
Red, White & Bloom
Executive Summary
“If, at any time, it comes into my head, that a present is due from me to somebody, I am puzzled what to give, until the opportunity is gone.” Ralph Waldo Emerson “Gifts,” Essays, Second Series (1844).
In the 160 years since Emerson made this statement, certain things haven’t changed: some of the most successful businessmen still have trouble purchasing gifts – especially flowers – for their wives, fiancées or girl friends. While some things don’t change, fortunately others – such as technology that can make the gift-giving process easier – do.
Red White & Bloom believes there is an opportunity to use technology to make it simple for male executives to easily purchase custom flower arrangements, with delivery on days they determine in advance, for their loved ones. The company plans to approach its goal short term by targeting affluent executive businessmen in Midtown and Downtown Atlanta for a very upscale, Frequent Flower Gift Program and, long term, to debut the city’s first floral art gallery in a neighborhood that is building its name as the next major arts community in Atlanta. Red White & Bloom will differ from traditional florists by cultivating personal relationships through the use of technology and marketing, offering a gift program that makes purchasing flowers easy (and forgetting special dates a thing of the past), and delivering exceptional customer service. Ideally the company plans to open its gallery in March in Castleberry Hill, one of Atlanta’s historic loft neighborhoods that is less than one mile from Downtown Atlanta.
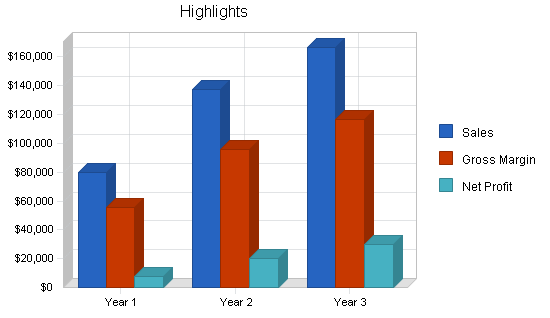
The company anticipates modest first year total revenue with the opportunity to increase Year Two revenue dramatically because of Valentine’s Day sales (excluded in Year One due to a March opening). Additional revenue growth should stem from the maturing Castleberry Hill area as a destination shopping district. At the time of opening the Castleberry Hill area will have approximately 1,500 residents. Studies indicate that a population of 10,000 is necessary to support a traditional retail florist; therefore, it is important to point out that Red White & Bloom will not be a typical retail florist. In Years One to Three of Red White & Bloom’s development, the company will not depend on retail traffic, but will instead use technology and savvy marketing programs to target ideal, repeat buyers (individuals and commercial accounts) in the more than 1,500 targeted businesses in Midtown and Downtown Atlanta office buildings.
With the anticipated expansion of Castleberry Hill as an arts district for leading Atlanta galleries, along with continued projected commercial and residential growth for the downtown area by Central Atlanta Progress, the Castleberry Hill location presents steady growth opportunities for Red White & Bloom. The company is forecasting conservative, yet healthy, revenue projections for Years Two and Three. If the company manages to this plan, revenues should consistently reach over $170,000 each additional year.
Red White & Bloom is an S-Corporation started by Jamie Muir, who is the majority owner.
1.1 Mission
Red White & Bloom will use technology to identify and serve an ideal target audience within a five-mile radius of Castleberry Hill. The company will use sophisticated marketing techniques to secure a core clientele of executive businessmen and corporate accounts, and will differentiate from other traditional retail and on-line florists by offering Frequent Flower Gift Programs with personalized service (e.g., customers can select the specific delivery dates) and custom floral designs (e.g., customers can specify flowers, colors, scents, etc.).
Red White & Bloom is dedicated to operating with a constant enthusiasm for learning, being open to implementing new ideas, and maintaining a willingness to adapt to evolving market conditions.
1.2 Keys to Success
- Using technology to develop loyal, frequently-buying male clients instead of traditional, walk-in retail shoppers.
- Designing and selling innovative, high quality fresh flower arrangements using a variety of design styles, flowers, and containers.
- Creating a storefront that resembles an art gallery, with fresh, avant-garde floral arrangements displayed like art (and always for sale).
- Offering additional products, including gourmet chocolates and original artwork from local artists.
- Communicating with potential customers through direct mail, print advertising and an easy-to-use website.
- Offering complimentary in-store events, such as book signings, cheese tastings, and art showings, that coincide with other neighborhood gallery openings.
1.3 Objectives
- Generate healthy total revenue of $79,600 in Year One.
- Maintain an average direct cost of sales 40% or lower, and a high gross margin.
- Build pricing programs based on the assumption of 10% profit.
- Increase sales approximately 72% in Year Two and 21% in Year Three.*
*Note: Red White & Bloom will open after Valentine’s Day and Easter/Passover in Year One. The large percentage increase in Year Two reflects a full 12-months of revenue (versus 10 months in Year One), the benefit of one year of marketing, and the inclusion of Valentine’s Day and Easter/Passover. Valentine’s Day alone typically accounts for one third of a florist’s yearly revenue.
Company Summary
Red White & Bloom will initially target two key audiences within one geographic market:
Affluent businessmen who work in Midtown and Downtown Atlanta: They are ideal candidates for an automatic, fresh flower delivery program that will help them keep romance alive with their spouses or significant others. The concept involves establishing flower arrangements as a way to foster romance, and the company will target men with higher levels of discretionary income who are more accustomed to spending money on loved ones. With Red White & Bloom’s floral delivery program, these men will never have to worry about missing a loved one’s special day (anniversary, birthday, holiday) and fresh flowers will also be promoted as a way to say “I Love You” on any day of the year. Also, instead of delivering flowers to a woman at home, Red White & Bloom will deliver flowers to the man who works in Midtown/Downtown Atlanta, and let him reap the benefits of delivering the flowers to his loved one in person. To address the inconvenience of transporting flower arrangements from work to home, Red White & Bloom will develop special packaging to keep containers upright and spillproof. This packaging will be well branded with the company’s logo, and will serve as an additional marketing vehicle once delivered to a customer’s workplace (office building).
Midtown and Downtown Atlanta: These are prime areas from which to attract a handful of commercial accounts that require weekly floral arrangements. Downtown Atlanta alone, defined as a four-square mile area centered near the intersection of Peachtree Street and Andrew Young International Blvd, is home to more than 136,000 employees daily. Almost half of the dozen Fortune 500 firms headquartered in Atlanta are either headquartered downtown or have a major office presence downtown. More than 6,500 banks, hotels, large corporations, law firms, upscale restaurants, and consulate/foreign trade offices are located in this defined area, and these businesses are prime candidate for weekly floral arrangements for their lobbies and/or reception areas.
The main selling points for buyers will be twofold: peace of mind for the male customer, that is, never worrying about missing a loved one’s special day, and customized services for commercial accounts, including long-lasting arrangements designed to accent a specific business’ decor and delivered routinely based on an established frequency (weekly, bi-monthly).

Store Location
Because Red White & Bloom will not seek traditional retail customers, the company plans to locate in an area of Atlanta close to its downtown clients, but without the price tag of downtown retail space. Red White & Bloom plans to open a small gallery with warehouse workspace in Castleberry Hill, an up-and-coming arts district located approximately one mile from downtown Atlanta. The Castleberry Hill Arts District is currently home to several distinctive galleries, included Skot Forman Fine Art, the Marcia Wood Gallery, the Ty Stokes Gallery, 3TEN Haustudio, and the Wolf Fisher Gallery. In addition, the well-established Atlanta-based speciality furniture store, No Mas! Productions, plans to relocate its main store to the Castleberry Hill area, and create a distinctive destination shopping area for metro Atlanta shoppers. As a floral design gallery, Red White & Bloom will blend perfectly into this neighborhood, and can possibly secure some of the art galleries and stores – and their customers – as its own clients. During the first five years of operation, the company does not anticipate enough retail neighborhood foot traffic to generate desired revenue, but Red White & Bloom would be open to the public six days a week, and would offer a frequent buying program for residents.
Red White & Bloom plans to open in March, occupying approximately 600 square feet. Approximately one-third of the space would be allocated for retail use, and the other two-thirds would be used for workspace and storage. At this time, there are no other planned florists in the Castleberry Hill area.
Free parking is available for the shoppers who visit the area; however, the majority of Red White & Bloom’s revenue will come from routinely delivered floral arrangements outside of the Castleberry Hill area.
Atlanta is served by a large international airport, and access to imported flowers is excellent. Several of the city’s largest floral warehouses are located nearby: Hall’s (less than three miles); Cutflower Warehouse (less than six miles); and Floral Park (less than three miles). Red White & Bloom will also use the Internet to purchase from wholesalers throughout the country who offer a wide variety of flowers throughout the year and can drop ship directly to a retail florist.
Store Design
The exterior of a florist shop is estimated to account for the attraction of 35% of all customers. While short term the company will not have a large amount of retail walk-in traffic, Red White & Bloom will still create an inviting storefront, one designed to be distinctive and inviting, including:
- Very simple, modern design with attractive displays
- Spacious interior design with lots of light and accent lighting to illuminate flower designs
- Unobstructed windows to showcase flower arrangement in a “gallery” format, with access to the store from the street
- Clear large glass windows with dramatic lighting and clear branding
- High visibility from the street, as well as visually pleasing at night
- Movable floor and ceiling displays to allow easy and frequent redesign of store
- Clearly priced merchandise
- A variety of pre-designed floral arrangements.
Store Operation
Red White & Bloom will be open for operation Monday – Saturday, and closed on Sunday and on major holidays. Hours of operation will be 10:00 a.m. – 5:00 p.m. Monday – Friday, and from noon – 4:00 p.m. on Saturday. Hours may be extended during the holidays.
Owner Jamie Muir, who has more than 14 years of experience in corporate marketing and has trained as a florist, will create floral arrangements and run the business (manage operations, inventories, marketing and sales). She will engage the services of a part-time delivery person, and, for certain floral-intensive holidays, may employ temporary staffing.
Store Policies
The company will invest in customer relationship management software (CRM) and a simple point of sales (POS) system to track sales and collect customer information, including names, address, e-mail address and other pertinent information (pets, flower likes/dislikes, color preferences, allergies, birthday, anniversary). This information will be used with e-mail and direct mail efforts to build custom marketing programs, establish customer loyalty and drive revenue. The company will offer a 24-hour return/exchange policy to build trust with customers and to maintain retention and loyalty.
2.1 Start-up Summary
Working capital, cash sufficient to cover build out costs in the second month, and long-term assets (such as refrigeration units) will make up the majority of the start-up requirements. Start-up expenses, which are detailed in this section, comprise the remaining 12% at $11,600.
Funding
As detailed in Sources and Uses of Funds, Red White & Bloom requires $95,000 to soundly begin operations and have suitable cash reserves for a start-up company. Jamie Muir has secured a loan for $45,000, and is seeking additional funding.
Sources & Uses of Funds
The following chart recaps the sources and uses of funds for Red White & Bloom:
| Sources: | |
| Jamie Muir: Loan (secured) |
$45,000 |
| Other Sources (unsecured) |
$50,000 |
| Total Sources |
$95,000 |
| Uses: | |
| Build out |
$18,000 |
| Credit for Build out |
-$9,000 |
| Deposits |
$1,000 |
| Equipment* |
$11,550 |
| Inventory |
$1,500 |
| Start-Up Expenses |
$11,600 |
| Working Capital |
$59,666 |
| Total Uses |
$94,816 |
|
*Description of Asset |
Quantity |
Cost |
|
2-Line Phone System |
1 |
$350 |
|
POS System & Software |
1 |
$5,000 |
|
Laptop PC Computer |
1 |
$1,635 |
|
Accounting & Credit Card Software |
1 |
$415 |
|
Backup Device |
1 |
$150 |
|
5 ft x10 ft Walk-In Cooler |
1 |
$4,000 |
|
Total: |
|
$11,550 |

| Start-up | |
| Requirements | |
| Start-up Expenses | |
| Accounting/Legal Fees | $500 |
| Initial Marketing & Advertising | $5,000 |
| Collateral & Stationery | $2,500 |
| Store Planner/Design | $1,000 |
| DSL Installation & Service Activation | $100 |
| Office Supplies, Giftwrap, Packaging | $1,000 |
| Furniture | $1,500 |
| Other | $0 |
| Total Start-up Expenses | $11,600 |
| Start-up Assets | |
| Cash Required | $70,350 |
| Start-up Inventory | $1,500 |
| Other Current Assets | $0 |
| Long-term Assets | $11,550 |
| Total Assets | $83,400 |
| Total Requirements | $95,000 |
| Start-up Funding | |
| Start-up Expenses to Fund | $11,600 |
| Start-up Assets to Fund | $83,400 |
| Total Funding Required | $95,000 |
| Assets | |
| Non-cash Assets from Start-up | $13,050 |
| Cash Requirements from Start-up | $70,350 |
| Additional Cash Raised | $0 |
| Cash Balance on Starting Date | $70,350 |
| Total Assets | $83,400 |
| Liabilities and Capital | |
| Liabilities | |
| Current Borrowing | $50,000 |
| Long-term Liabilities | $0 |
| Accounts Payable (Outstanding Bills) | $0 |
| Other Current Liabilities (interest-free) | $0 |
| Total Liabilities | $50,000 |
| Capital | |
| Planned Investment | |
| Jamie Muir | $45,000 |
| Investor | $0 |
| Other | $0 |
| Additional Investment Requirement | $0 |
| Total Planned Investment | $45,000 |
| Loss at Start-up (Start-up Expenses) | ($11,600) |
| Total Capital | $33,400 |
| Total Capital and Liabilities | $83,400 |
| Total Funding | $95,000 |
2.2 Company Ownership
Red White & Bloom is an S-corporation, and is majority-owned by Jamie Muir.
Products and Services
Red White & Bloom will offer a variety of products and services.
PRODUCTS
- Original Floral Designs, Using A Wide Mix of Flowers. Each Red White & Bloom floral arrangement will be a natural, original work of art. The company is committed to making each arrangement unique and custom-designed based on each customer’s needs. Red White & Bloom’s floral arrangements will feature a wide range of seasonal flowers. All sample arrangements in the store will be available for purchase.
- Unique Containers. Red White & Bloom will select and offer distinctive vases for the discretionary buyer or for a special occasion, as well as affordable options for routine purchases.
- Green and Flowering House Plants. Red White & Bloom may occasionally offer a selection of seasonal green and flowering house plants.
- Gourmet Chocolates. With consumer’s heightened awareness of chocolate brands and a seeming willingness to pay for a better product, Red White & Bloom will carry several lines of exclusive gourmet chocolate bars, that is, the brands will not be sold by other metro Atlanta retailers. The sale of gourmet chocolate is a perfect complement to flowers, and encourages consumers to indulge and experience something new because they are worth it.
- Paintings and Artwork from Local Artists. To create a gallery environment, the Red White & Bloom store will feature paintings and/or drawings from local artists, and the artwork will be for sale. The company will collect a small percentage of each sale (5%).
- Variety of prices. Red White & Bloom will offer a variety of arrangement sizes, and will always create a unique arrangement to meet anyone’s stated budget.
- Hand-tied Bouquets. For customers who prefer to use their own vases, Red White & Bloom will offer hand-tied bouquets.
SERVICES
Forget-Me-Not Club. Special occasions account for four out of every ten floral purchases made. To capture a portion of this market and to foster overall romance, Red White & Bloom will offer a Frequent Flower Gift Program called the Forget-Me-Not Club designed for men. This program will let each customer register a minimum of six days per year (birthdays, holidays, anniversaries or any day except Valentine’s Day) on which Red White & Bloom will automatically plan to deliver a floral arrangement to his place of work (which must be in Midtown or Downtown Atlanta). A courtesy call will be given or an e-mail sent to each customer 48-hours in advance. To make it as easy as possible for its customers to transport flower arrangements from work to home, Red White & Bloom will develop special packaging to keep containers upright and spillproof. This packaging will be well branded with the company’s logo, and will serve as an additional marketing vehicle once delivered to a customer’s workplace (office building). The customer must agree to the cost of each arrangement (minimum $100), in advance and the service must be guaranteed by a credit card in advance. The credit card will not be charged until the day of each delivery.
Commercial Account Program including:
- Free initial consulting. For retail and office tenants who are interested in a weekly delivery program, Red White & Bloom will conduct an initial free, on-site visit to the customer’s office or store to determine the optimum floral design plan.
- Priority delivery program. Red White & Bloom will work with each commercial customer to determine a weekly delivery schedule, and will assure that arrangements are delivered on the same day each week at the same time.
- Birthday Blooms. Red White & Bloom will offer a free arrangement to each office manager for a commercial account on his or her birthday.
- Referral Program. Red White & Bloom will offer a one-time 25% discount to each commercial customer for every additional commercial referral that becomes a customer.
Castleberry Hill Residential Program. For residents of Castleberry Hill, Red White & Bloom will offer a monthly fresh flower program with free delivery to encourage the habit of keeping fresh flowers in their homes. More frequent delivery options are available, and residents will be given a $5 discount if they pick up the flowers in the store, which will decrease delivery expenses as well as increase exposure to additional buying opportunities. Other special programs for local residents include:
- Forget-Me-Not Club. (As defined above.)
- Narcissus Club. For residents who desire a custom-designed floral plan for their homes, Red White & Bloom offers the upscale Narcissus Club, which includes a free in-home consultation to assess the customer’s home and the recommendation of a floral design plan; a minimum investment of $75 per month; and a minimum of a six-month commitment. The commitment must be guaranteed by a credit card in advance. This service will also be offered as a gift certificate (limited delivery).
Unique-buying experience. As the Castleberry Hill area becomes a destination shopping venue, Red White & Bloom will contribute to the experience by offering a pleasant shopping experience through the gallery-like design of its storefront, and its selection of materials and floral designs.
In-Store Presentations. In the spirit of education and event marketing, Red White & Bloom will offer periodic in-store workshops to attract potential customers. Topics will be seasonal in nature, and will feature guest artists such as regional cuisine, interior design tips from local designers, books signings, jewelry shows, and local artist showings.
Gift Cards. Red White & Bloom will offer $25, $50, $75 and $100 gift certificates, as well as gift cards for the Forget-Me-Not program that would enable women to receive the program as a gift, and then select the characteristics of each scheduled delivery.
Surveys/Comment Cards. Red White & Bloom will use in-store comment cards as well as occasional surveys to ensure products and services are meeting customers’ expectations.
Market Analysis Summary
The following section presents a broad range of market information and projections, including:
- Who is the typical floral buyer, and who is the typical floral buyer at Red White & Bloom?
- How and why does he or she purchase flowers?
- What are the prevailing buying patterns in the floral industry?
- What is the size of the Atlanta market that Red White & Bloom plans to target?
- What is the overall buying potential/revenue for Red White & Bloom?
- Who is the competition in the Atlanta market?
4.1 Buying Patterns
Factors that Drive Typical Floral Purchases
Holiday purchases traditionally drive the florist industry. The holidays, along with birthdays and anniversaries, are ideal dates for men to select as part of a Frequent Flower Gift Program. For reference, the following chart ranks floral purchases by holiday:
Percent Ranking by Retail Dollars
| Valentine’s Day |
36% |
| Mother’s Day |
27.4% |
| Christmas & Hanukkah |
15.1% |
| Easter & Passover |
8.9% |
| Thanksgiving Day |
7.4% |
| Sweetest Day |
1.2% |
| Administrative Professional’s Day |
1.1% |
| St. Patrick’s Day |
.09% |
| Grandparent’s Day |
.09% |
| Halloween |
.05% |
| Father’s Day |
.04% |
| Boss’ Day |
.02% |
Source: American Floral Endowment Consumer Tracking Study
Capturing Valentine’s Day Business
Valentine’s Day ranks number one in single-day holiday cut flower purchases, capturing 34 percent of transactions and 36 percent of dollar volume. Eighty percent of consumers who buy florals for the romantic holiday purchase cut flowers. According to the International Mass Retailers Association (IMRA), men are more likely to give flowers than women, and men plan to spend $95 on the average, while women plan to spend $60. The average amount spent per household is approximately $94.50, and the trend is an upward one.
To maximize Valentine’s Day revenue with add-on sales, Red White & Bloom will offer special, seasonal gourmet chocolates in addition to the store’s normal gourmet chocolates. Chocolates account for 75% of Valentine’s Day candy sales, which totaled an estimated $1.1 billion in 2002. A survey conducted by the Chocolate Manufacturers Association revealed that 50 percent of women are likely to give a gift of chocolate to a man for Valentine’s Day.
Profile of Traditional Buyers of Floral Arrangements
Which households buy fresh cut flowers, how often and how much do they spend? According to the American Floral Endowment Consumer Tracking Study, consumer spending is on the rise. For example, the percentage of U.S. households making at least one fresh cut flower purchase during the year continues to increase. The frequency of consumer flower purchases is also remaining consistent.
- 27.7% of all US Household purchased fresh cut flowers at least once per year.
- The average floral purchase per buying household was 3.7 times.
- The average purchase price per buying household was $62.63.
- The most frequent purchases are women over 35, with incomes in access of $30,000 who live in metropolitan areas with populations greater than 2.5 million.
- Seventy percent of floral buys are planned purchased.
Source: American Floral Endowment Consumer Tracking Study.
Profile of a Red White & Bloom Customer
As noted earlier in this plan, Red White & Bloom will not be a typical retail florist, and therefore will target and serve a very different primary market, one that is described in detail in the next section.
4.2 Market Summary
Midtown and Downtown Atlanta Demographics
Red White & Bloom will primarily target businessmen who work in highly-paid professions in Midtown and Downtown Atlanta. A second market includes businesses in Midtown and Downtown Atlanta that need weekly floral arrangements. The following chart provides an overview of potential prospects (businessmen and companies) within the defined areas.
- Midtown is defined as a one-mile radius from 10th NE at Peachtree.
- Downtown is defined as a four-mile radius from Peachtree and Andrew Young Intl Blvd.
|
|
Midtown |
Downtown |
Total |
|
Total Number of Businesses |
3,380 |
3,216 |
6,596 |
|
Law Firms |
959 |
17 |
976 |
|
Banks |
30 |
93 |
123 |
|
Securities & Commodities |
43 |
25 |
68 |
|
Real Estate |
150 |
87 |
237 |
|
Insurance |
8 |
40 |
48 |
|
Hotels |
27 |
31 |
58 |
|
Total Number of Daily Employees |
58,373 |
136,776 |
195,149 |
|
Law Firms |
9,075 |
1,500 |
10,575 |
|
Banks |
1,895 |
10,637* |
15,435 |
|
Securities & Commodities |
1,062 |
– |
– |
|
Real Estate |
1,418 |
– |
– |
|
Insurance |
423 |
– |
– |
|
Services |
32,715 |
49,343 |
82,058 |
*Represents Finance, Insurance & Real Estate
Source: Central Atlanta Progress
To meet its target revenue goals, Red White & Bloom estimates that it needs the following number of clients:
- 2005: Five commercial accounts (businesses); 50 Frequent Flower Gift Program Members (businessmen).
- 2006: Eight commercial accounts (businesses); 75 Frequent Flower Gift Program Members (businessmen).
- 2007: Ten commercial accounts (businesses); 100 Frequent Flower Gift Program Members (businessmen).
Given the combined 6,596 businesses located in Midtown and Downtown Atlanta, and the 1,510 ideal business (banks, law firms, securities firms, real estate, insurance companies and hotels), Red White & Bloom believes it has set realistic target levels for commercial accounts. Also, given the 195,149 employees who work in Midtown and Downtown Atlanta, with 26,010 identified as ideal prospects and assuming that 50% are men, the company also feels confident about its opportunity to reach its target goal for the Frequent Flower Gift Program.
For example, to reach its goal of five commercial clients in 2005, the company needs to secure .03% of its target company market (1,510), .05% in 2006, and .06% in 2007. To meet its Frequent Flower Gift Program estimates, the company needs to secure .04% of its targeted businessmen (13,005), .06% in 2006, and .08% in 2007.

| Market Analysis | |||||||
| Year 1 | Year 2 | Year 3 | Year 4 | Year 5 | |||
| Potential Customers | Growth | CAGR | |||||
| Select Businesses in Midtown/Downtown Atlanta | 5% | 1,510 | 1,586 | 1,665 | 1,748 | 1,835 | 4.99% |
| Businessmen within the Select Industries | 5% | 13,005 | 13,655 | 14,338 | 15,055 | 15,808 | 5.00% |
| Other | 0% | 0 | 0 | 0 | 0 | 0 | 0.00% |
| Total | 5.00% | 14,515 | 15,241 | 16,003 | 16,803 | 17,643 | 5.00% |
4.3 Competition
Red White & Bloom plans to differentiate through its Frequent Flower Gift Programs for businessmen, and will treat in-office deliveries to its male clients as an opportunity to establish brand awareness with office managers for potential commercial account business. From preliminary research of the competition, Red White & Bloom has not identified any traditional florist in Atlanta, nor an on-line florist, that is offering a Frequent Flower Gift Program that allows the customer to choose random delivery dates in advance. As a result, the florists listed below are considered competition for commercial accounts:
Carithers. 1893 Piedmont Road. Carithers is recognized as the leading florist in Atlanta, with three locations (one in town).
Petals: A Florist. 1422 Woodmont Lane NW. Petals offers flowers for delivery, as well as for special events such as weddings. The store uses fresh flowers to create designs with a natural garden feel. It also sells twig baskets and stone-finished containers with longer-lasting greenery and blooming plans, and offers baskets of fruit and gourmet food.
Lilly’s. 1197 Peachtree Street NE – Colony Square. Lilly’s is a full-service florist that serves the Colony Square retail and office clientele, along with the Sheraton Hotel.
Twelve. 976 Piedmont Avenue – at 10th Street. Located in a former Midtown residence, the store carries unusual flowers and orchids. It also carries jewelry, designer handbags and sunglasses, throw pillows and bath towels.
Fuji Designs. 1157 West Peachtree Street. Fuji Designs is a Japanese-style florist, offering silk and fresh flower arrangements, along with Japanese gifts, jewelry, glassware and handbags.
Stems. 999 Peachtree Street – at 10th Street. Located in the First Union building, Stems serves commercial clients in the building and is also a full-service floral shop.
On-line Florists. In addition to traditional florists, floral arrangements can be purchased via the Internet. Such services are offered by Jackson & Perkins (jackson-perkins.com), Calyx & Corolla (calyxandcorolla.com), Hallmark Flowers (hallmark.com), FTD.com, Harry & David (harryanddavid.com), and many others. These companies offer a monthly delivery program; however, customers cannot select custom arrangements (they have to accept the “selection of the month”), nor can they specify a delivery date (they have to choose a “month” and the date of the delivery is determined by the company). Also, when the floral arrangements arrive, they require arranging, and often the finished product may not match the photo that drove the purchase. Deliveries present another challenge if the gift recipient isn’t home. The flowers are either returned to the shipper’s distribution center where they remain in a box, or they are left in the box on a doorstep for an undetermined amount of time. In either situation, the quality of the live, perishable flowers is reduced.
Given the lack of Frequent Flower Gift Programs by Atlanta florists and on-line florists, Red White & Bloom believes there is a positive opportunity to establish a premium, niche service.
4.4 Target Market Segment Strategy
Buyer Characteristics
Ideal characteristics of a typical Red White & Bloom customer are:
Frequent Buyer Program Subscriber
- Male executive
- Works in Midtown or Downtown
- 25-60 years of age
- Affluent
- Married, engaged or in a long-term relationship
- Makes $150,000+
- Quality conscious
- Probably works as a banker, real estate agent, lawyer or financial analyst
- May have a preference for luxury items (cars, clothes, watches, homes, vacations)
- Homeowner, possible multiple home owner
- Has discretionary income
Commercial Accounts Customer Profile
- Primarily female office or store manager
- Professional 25-60 years of age
- Affluent
- Probably works for a law firm, hotel, large retail store, bank, real estate agency, foreign consulate or insurance agency
4.5 Market Projection
Using the target market numbers identified earlier in this section and the Midtown and Downtown Atlanta demographics, Red White & Bloom has made the following assessments regarding market opportunity and revenue potential:
POTENTIAL REVENUE FOR FREQUENT FLOWER GIFT PROGRAM CUSTOMERS:
13,005 Businessmen in Midtown & Downtown Atlanta x $600 (average purchase price [six deliveries per year, $100 per delivery])= $7.7 million of revenue opportunity.POTENTIAL REVENUE FOR WEEKLY COMMERCIAL ACCOUNTS CUSTOMERS:
6,596 Businesses in Midtown & Downtown Atlanta x $150 (average cost of an arrangement each week) x 52 weeks per year = $51.4 Million. If we assume (20) competitive florists in this area, that’s still $2.5M in potential revenue per florist. Or, if examined from another perspective, if the company can capture .05% of this potential business, that’s $257,244 in revenue opportunity.
As indicated previously, Red White & Bloom needs five commercial accounts and 50 Frequent Flower Gift Program Members to meet its first year revenue goals, and, given the breadth of the target market, the company believes these targets are reachable.
Strategy and Implementation Summary
According to the first American Express/RoperASW Global Affluent Study (October 2003), about half of high-income consumers around the world would choose to have more time in their lives than more money. Red White & Bloom’s goal is to facilitate this desire by creating marketing messages that emphasize being able to spend more time with love ones by: automating the flower arrangement buying process, fostering romance with the consistent delivery of flowers, and eliminating the worry of ever missing a loved one’s special day. The company’s intention is to gain market share with niche positioning, high quality products and, eventually, a unique shopping experience in an arts gallery district. The following sections review the various strategies that will support this effort.
5.1 Competitive Edge
Red White & Bloom will differ from traditional florists by creating customer intimacy based on personalized relationships that will save its male customers time and reduce anxiety often associated with the gift buying process. The company will achieve this goal by:
- Using technology to make the floral buying experience easy for customers and, at the same time, enable the company to identify and track its customer base.
- Creating a new fresh flower arrangement buying experience for customers – Atlanta’s first floral art gallery.
- Offering exquisite, artistic arrangements.
- Offering additional self-indulging products, including original artwork and gourmet chocolates.
- Building a customer database that identifies contact information as well as preferences (colors, vases, frequency, allergies, pets, children/spouse, birthday, anniversary, etc.).
- Adopting proactive customer service policies, for example, contacting each Frequent Flower Gift Program Member by phone call or e-mail within 48 hours of a scheduled delivery, and calling commercial clients after each delivery to ensure satisfaction.
As part of the definition process, it’s important to outline what Red White & Bloom is not. Unlike traditional florists, the company will not offer:
- FTD or Teleflora wire services. By recreating arrangements defined by another organization, this approach limits creativity.
- Weddings. Floral services for weddings are a specialty area. To remain focused on its Frequent Flower Gift Program objectives, Red White & Bloom may choose to refer potential wedding clients to other Atlanta florists.
- Funerals. Floral services for funerals are a specialty area. To remain focused on its Frequent Flower Gift Program objectives, Red White & Bloom may choose to refer potential funeral clients to other Atlanta florists.
- Balloons or stuffed animals.
- Atlanta-wide delivery services. Red White & Bloom will cater to Midtown and Downtown businesses, residents and workers.
5.2 Marketing Strategy
Overall Strategy
It’s a widely-held thought that there are not too many florists in this country – there are too many florists who are the same. A florist with a well-defined niche business can thrive. Red White & Bloom’s marketing strategy is to develop a specialized, independent niche business that centers around Frequent Flower Gift Programs and features quality products, custom designs and outstanding personalized customer service.
Marketing Objectives
Red White & Bloom needs to establish a reputation as an automatic, easy way to buy flowers and foster romance with loved ones, specifically with affluent men who work in Midtown and Downtown Atlanta. A measurable and specific objective includes initiating marketing efforts in the fall of 2004, and having a minimum of 25 male clients in a Frequent Flower Gift Program at the time of the store’s opening in March 2005.
Red White & Bloom needs to establish itself as a creative source for retail and office tenants in Midtown and Downtown Atlanta that need weekly flower arrangements. Measurable and specific objectives are to have five offices signed up for weekly deliveries by the time of the store’s opening.
Red White & Bloom needs to establish brand recognition to attract local shoppers who will eventually visit Castleberry Hill as a destination shopping area. Given the district’s art galleries, a measurable and specific objective includes having a least one local gallery as a client within one month of the store’s opening.
Positioning
Red White & Bloom offers an upscale Frequent Flower Gift Program targeted to affluent businessmen, featuring custom, high-quality floral arrangements and personalized service. Additionally, the company plans to create a unique shopping experience with its floral design gallery, which is located in an up-and-coming arts district area.
Marketing Mix
As outlined previously in this business plan, Red White & Bloom plans to serve three markets:
- Primary: Businessmen who work in Midtown and Downtown Atlanta.
- Secondary: Businesses in the same area.
- Tertiary: Residents of Castleberry Hill.
The company’s marketing efforts will focus on targeting men, and as a by-product of deliveries and promotional giveaway programs, the company plans to secure commercial accounts. Residential clients will stem from word of mouth and visibility of Red White & Bloom to neighborhood pedestrian and automotive traffic. The overall market approach involves creating brand awareness through targeted advertising, public relations and a website; and generating leads through co-marketing efforts with select venues, traditional direct mail/e-mail and events.
Primary Market: Businessmen Who Work in Midtown & Downtown Atlanta
Why should men subscribe to a frequent delivery program from Red White & Bloom?
- To foster romance with regular floral gifts for spouse/significant others.
- To eliminate “forgetting” about birthdays, anniversaries and other special dates.
- To be able to spend more time with loved ones and less time shopping for loved ones.
- Personalized service.
- Easy and convenient.
- Quality flowers and unique floral arrangements.
- One-of-a-kind gourmet chocolate available in addition to flowers.
- Free deliveries.
Other Markets
Why should commercial tenants buy from Red White & Bloom?
- Easy and convenient.
- Custom floral plan for each business.
- Quality flowers and unique floral arrangements.
- Frequent delivery program available.
- Free in-office/store consulting service available.
- Gourmet chocolate available as corporate gifts (for delivery).
Why should local residents buy from Red White & Bloom?
- Easy and convenient.
- Unique shopping experience.
- Quality flowers and unique floral arrangements.
- Frequent delivery program available.
- In home consulting available.
- Free neighborhood deliveries – discount for pickups.
- GOURMET chocolate.
- Event floral services (parties) available to local residents only.
- Support a local merchant.
Strategy
For businessmen who work in Midtown & Downtown Atlanta in select industries, Red White & Bloom will emphasize services (Forget-Me-Not Club) to keep romance and love alive.
Tactics
- Make giving flowers to loved ones an effortless, automatic process.
- Make the flower buying experience fun and easy.
- Make flowers a habit by encouraging men to take flowers home routinely, not just for special occasions.
- Shift the flower buying responsibility from women to men.
Programs
Public Relations
While the company will primarily target men with its advertising efforts, it will target women in an effort to educate women about the Frequent Buyer Program, and the women may encourage their spouses/fiancées/significant others to participate.
- Announce the store’s Grand Opening and the availability of services.
- Issue at least one press release per quarter to local newspapers.
- Target Atlanta publications for possible feature stores (one per story per quarter).
- Press List: Around the Rings, Atlanta Downtown, Atlanta Homes & Lifestyles, Atlanta Intown & The Studio Arts/Culture, Atlanta Jewish Life, Atlanta Jewish Times, Atlanta Journal-Constitution (Home/Living Sections, Business Section), Atlanta Magazine, Atlanta Press, Atlanta Woman, Communities Magazine, Creative Loafing – Atlanta Edition, David Atlanta, Designer’s Handbook, Dixie Living, Hotlanta Buzz, Jezebel Magazine, Northside Newspaper, Peachtree’s Symbol of the South, The Piedmont Review, Post Notes, Southern Changes, Southern Lifestyles, Southern Living, Veranda, Westside Atlanta, Where Atlanta, Zoom.
Advertising
The advertising program will explicitly target men.
- Develop a 1/8 page, one-color ad for routine insertions in the Atlanta Business Chronicle, the sports page and/or the business page of The Atlanta Journal & Constitution.
- Start ads in the fall of 2004 to build awareness and to generate business (in the form of gift certificates) for Christmas and Hanukkah.
Co-marketing Efforts
- Investigate contacting Peachtree Center Athletic Club, located in Downtown Atlanta, as a possible business partner. Offer free bi-monthly floral arrangements in exchange for the opportunity to market to club members (which includes businessmen).
Direct Mail/Postcards
- Develop a list of potential clients for routine communications about holiday specials and frequent buyer/gift programs.
- Push users to a website that will enable them to see sample designs, read about the Forget-Me-Not Club, and complete a form to request a free phone consultation.
- Buy/develop an e-mail list for routine communications about holiday specials and frequent buyer programs.
- Push users to a website that will enable them to sign-up for a free phone consultation.
Marketing Materials
Develop a consistent look and feel for all corporate collateral, including:
- Comment cards – collect name, addresses, e-mail, plus feedback on services.
- One-page brochure describing Frequent Flower Buyer Programs.
- Stationery – business cards, letterhead, envelopes.
- Gift cards.
- Packaging – develop no-spill packaging to make it easy to transport flowers and use all packaging for branding opportunities for Red White & Bloom logo and website.
Website
- Highlight frequent flower program (for individuals and businesses), enable visitors to schedule a free phone consultation, spotlight the floral design gallery and any local gallery events. Photos will change monthly.
For Commercial Accounts:
Identify 20 initial top retail and office prospects, especially new businesses in Centennial Park. Identify the primary buyer at each location, and deliver a free arrangement as a way of introduction.
- Network with store and office managers by researching and joining three key local business groups.
For Local Residents
- Grand Opening Reception (April 2005).
- Hold Floral Design Gallery Shows in conjunction with other Gallery Openings in the neighborhood.
To keep costs down, events will be promoted using in-store signs (three-month forward-looking Calendar of Events), press releases and the company website.
5.3 Sales Strategy
Direct Sales
Today, over 90% of Americans cite word-of-mouth as one of the best sources of ideas and information. Word-of-mouth is rated as important as advertising or editorial content, and Americans place one-and-a-half times more value on it today than they did 25 years ago. (Source: RoperASW, 2003). Red White & Bloom plans to foster direct sales by offering an exceptional level of personalized service to male executives in order to build loyalty, and ultimately, word-of-mouth referrals to their peers:
- The company will keep a database of customer names, addresses, e-mail addresses and preferences. This information will be used for e-mail and direct mail efforts to build customer loyalty.
- The company will offer a 24-hour return/exchange policy to build trust with our customers and maintain retention and loyalty.
Indirect Sales/Partner Opportunities
With its strategy of not offering special event or funeral arrangements, Red White & Bloom has an opportunity establish a referral service and partner with several key florists who can provide such floral services. The company would collect a flat percentage of each referral sale, with the sum payable at the end of each month.
5.3.1 Sales Forecast
2005 SALES FORECAST ASSUMPTIONS (MARCH 1 OPENING)
|
Type |
Frequency |
Per Year |
|
Retail |
$150 (x 44 weeks) |
$6,600 |
|
Commercial Accounts |
$750 (x 44 weeks) |
$33,000 |
|
Frequent Flower Gift Program |
$600 x 50 customers |
$30,000 |
|
Holidays/Events |
Christmas |
$10,000 |
|
|
|
$79,600 |
The estimates above equate to approximately six deliveries per week for the Frequent Flower Gift Program, and five deliveries per week for Commercial Accounts.
2006 SALES FORECAST ASSUMPTIONS
|
Type |
Frequency |
Per Year |
|
Retail |
$200 per week |
$9,600 |
|
Commercial Accounts |
$1200 per week |
$57,600 |
|
Frequent Flower Gift Program |
$600 x 75 customers |
$45,000 |
|
Holidays/Events |
Christmas/Valentine’s Day/Mother’s Day/Easter |
$25,000 |
|
|
|
$137,200 |
The estimates above equate to approximately nine deliveries per week for the Frequent Flower Gift Program, and eight deliveries per week for Commercial Accounts.
2007 SALES FORECAST ASSUMPTIONS
|
Type |
Frequency |
Per Year |
|
Retail |
$200 per week |
$9,600 |
|
Commercial Accounts |
$1500 per week |
$72,000 |
|
Frequent Flower Gift Program |
$600 x 100 customers |
$60,000 |
|
Holidays/Events |
Christmas/Valentine’s Day/Mother’s Day/Easter |
$25,000 |
|
|
|
$173,600 |
The estimates above equate to approximately twelve deliveries per week for the Frequent Flower Gift Program, and ten deliveries per week for Commercial Accounts. This sales activity level represents the maximum amount of clients that Red White & Bloom can handle without adding another full-time floral designer and a full-time driver.


| Sales Forecast | |||
| Year 1 | Year 2 | Year 3 | |
| Sales | |||
| Retail Sales | $6,600 | $9,600 | $9,600 |
| Commercial Accounts | $33,000 | $57,600 | $72,000 |
| Frequent Buyer Programs | $30,000 | $45,000 | $60,000 |
| Holidays/Events | $10,000 | $25,000 | $25,000 |
| Total Sales | $79,600 | $137,200 | $166,600 |
| Direct Cost of Sales | Year 1 | Year 2 | Year 3 |
| Flowers & Materials | $23,880 | $41,160 | $49,830 |
| Other | $0 | $0 | $0 |
| Subtotal Direct Cost of Sales | $23,880 | $41,160 | $49,830 |
5.4 Milestones
The following table lists important store milestones, with dates, implementation duty, and budgets for each. The milestone schedule emphasizes the timeliness for implementation per the sales and marketing targets listed in the detail in the previous topics.

| Milestones | |||||
| Milestone | Start Date | End Date | Budget | Manager | Department |
| Define Marketing Programs & Collateral | 5/1/2004 | 7/31/2004 | $3,500 | Jamie | Web |
| Locate & Secure Retail Space | 1/1/2004 | 10/1/2004 | $500 | Jamie | Marketing |
| Finalize Marketing Materials | 7/31/2004 | 10/1/2004 | $2,500 | Jamie | Department |
| Secure Additional Funding | 9/1/2003 | 12/1/2004 | $0 | Jamie | Web |
| Begin Retail Space Buildout Process | 1/15/2005 | 3/1/2005 | $18,000 | Jamie | Department |
| Finalize Media Plan | 8/30/2004 | 3/1/2005 | $0 | Jamie | Marketing |
| Release Press Announcements | 10/15/2004 | 3/15/2005 | $0 | Jamie | Marketing |
| Purchase Inventory & Supplies | 3/1/2005 | 3/15/2005 | $1,500 | Jamie | Marketing |
| Launch Website | 10/1/2004 | 4/15/2005 | $0 | Jamie | Department |
| Grand Opening | 4/15/2005 | 4/15/2005 | Part of Mktg | Jamie | Marketing |
| Kickoff Advertising Program | 11/1/2004 | 6/1/2005 | $5,000 | Jamie | Marketing |
| Totals | $31,000 | ||||
Management Summary
Owner Jamie Muir brings more than 15 years of marketing and management experience to Red White & Bloom. Her background in the technology and applications software industry includes using the Internet and integrated marketing communications to attract customers and develop brand loyalty. Jamie graduated cum laude from the University of Georgia in 1988 with a degree in Journalism. She has also completed training at the Vermont Academy of Floral Design, and apprenticed at De tuin van Heden, a retail flower shop in Ghent, Belgium. She currently holds a full time job as the public relations manager for a profitable, publicly traded technology company in Atlanta.
6.1 Personnel Plan
Red White & Bloom will not employ any staff members directly. As an owner of the company, Jamie Muir will take quarterly payments in the form of an after-tax draw. Although actual draw may vary with realized sales and profits, we are projecting owner’s draw will steadily increase from the first year to the third year. Other employees, when necessary, will be employed via a local temporary agency. These labor expenses can all be found in the Profit and Loss table, below.
Owner
Jamie Muir will oversee financial management, merchandising and operations for Red White & Bloom. Responsibilities will include: selling to commercial accounts; ensuring a profitable sales picture; establishing pricing policies; keeping up-to-date on trends by monitoring trade journals, vendors, sales reps, buying trips, industry meetings and educational programs; preparing and executing marketing programs, including advertising, publicity and lead generation programs (via direct mail and e-mail); establishing partner relationships as needed and designing arrangements.
She will also oversee sales, design and delivery. Responsibilities will include selling to walk-in retail customers; designing arrangements; ordering flowers, plants and greens; purchasing supplies, vases and containers; pricing and selling merchandise and orders for profit; spot checking orders to ensure quality products; knowing social and religious customs of various holidays; and handling complaints.
Delivery Person
The delivery person’s primary tasks will include planning deliveries (right time, right day); loading and unloading products carefully, securing plants and flowers during transportation; repairing, returning and replacing any transit-damaged products; keeping track of deliveries; and performing on-site credit card transactions. This position will be secured through a local employment agency, and will work part-time. Based on projected sales for the first year, a delivery person will be required approximately two hours per day, four days per week in the first year; hours needed will increase proportionally with sales in years two and three.
Characteristics: courteous, knowledgeable, neat and clean. The person should know the Midtown and Downtown areas of Atlanta.
Temporary Help
Red White & Bloom will employ temporary employees via a local staffing agency to assist with sales and customer service prior to Valentine’s Day, Mother’s Day, Easter/Passover, Thanksgiving and Christmas/Hanukkah.
Second Year: Contract Floral Designer As Needed for Holidays & Special Events
The contract floral designer will create arrangements using flowers, floral products and/or plants, working directly with customers regarding price and type of arrangement or following information from an order form. Other tasks include giving estimates on design work; working promptly and profitably, including tracking all materials used in every arrangement for accurate pricing; keeping the design area clean; keeping the cooler clean and rotating flower stock. The designer may assist walk-in customers, operate the cash register, and handle customer concerns and complaints. This position will be a part-time contractor.
Financial Plan
- Contracted Labor and Rent make up over 40% of the operating expenses.
- Red White & Bloom wants to finance growth through cash flow.
- Marketing will remain at or below 6% of sales.
- Company expansion, while not a necessity, will be an option if sales projections are met and/or exceeded.
7.1 Break-even Analysis
For our break-even analysis, we assume running costs which include our full payroll, rent, and utilities, and an estimation of other running costs. The chart shows what we need to sell per month to break even, according to these assumptions.

| Break-even Analysis | |
| Monthly Revenue Break-even | $5,085 |
| Assumptions: | |
| Average Percent Variable Cost | 30% |
| Estimated Monthly Fixed Cost | $3,560 |
7.2 Projected Profit and Loss
This business plan assumes an eventual 10% profit and is built using the following allocations of gross revenue:
- 10% profit
- 30% labor (including owner’s draw)
- 10% inventory
- 27% overhead
- 23% cost of merchandise


| Pro Forma Profit and Loss | |||
| Year 1 | Year 2 | Year 3 | |
| Sales | $79,600 | $137,200 | $166,600 |
| Direct Cost of Sales | $23,880 | $41,160 | $49,830 |
| Other Costs of Goods | $0 | $0 | $0 |
| Total Cost of Sales | $23,880 | $41,160 | $49,830 |
| Gross Margin | $55,720 | $96,040 | $116,770 |
| Gross Margin % | 70.00% | 70.00% | 70.09% |
| Expenses | |||
| Payroll | $0 | $0 | $0 |
| Marketing & Advertising | $4,640 | $6,860 | $8,330 |
| Depreciation | $1,150 | $1,150 | $1,150 |
| Rent | $4,800 | $7,800 | $8,400 |
| Delivery Labor | $5,000 | $8,500 | $10,200 |
| Temp Labor | $768 | $1,000 | $1,000 |
| Contracted Floral Designer | $0 | $17,000 | $18,200 |
| Insurance | $3,390 | $4,068 | $4,068 |
| Dues & Subscriptions | $250 | $300 | $300 |
| Repairs & Maintenance | $1,000 | $1,200 | $1,200 |
| Supplies | $2,650 | $5,488 | $6,944 |
| Taxes | $1,330 | $2,000 | $2,500 |
| Other Fees | $1,500 | $1,800 | $1,800 |
| Buildout Costs | $9,000 | $0 | $0 |
| Deposits | $1,000 | $0 | $0 |
| Utilities | $3,500 | $4,200 | $4,200 |
| Van | $1,410 | $1,692 | $1,692 |
| Merchant Fees | $1,330 | $2,744 | $3,472 |
| Total Operating Expenses | $42,718 | $65,802 | $73,456 |
| Profit Before Interest and Taxes | $13,002 | $30,238 | $43,314 |
| EBITDA | $14,152 | $31,388 | $44,464 |
| Interest Expense | $2,156 | $1,404 | $711 |
| Taxes Incurred | $3,254 | $8,650 | $12,781 |
| Net Profit | $7,592 | $20,184 | $29,822 |
| Net Profit/Sales | 9.54% | 14.71% | 17.90% |
7.3 Projected Cash Flow
The Cash Flow table, below, shows a solid cash balance from day one. Because Red White & Bloom will sell on a cash-basis only, and will stock only slightly more than one month’s inventory at any time, we do not anticipate any problems with cash flow, once we have obtained sufficient start-up funds.

| Pro Forma Cash Flow | |||
| Year 1 | Year 2 | Year 3 | |
| Cash Received | |||
| Cash from Operations | |||
| Cash Sales | $79,600 | $137,200 | $166,600 |
| Subtotal Cash from Operations | $79,600 | $137,200 | $166,600 |
| Additional Cash Received | |||
| Sales Tax, VAT, HST/GST Received | $0 | $0 | $0 |
| New Current Borrowing | $0 | $0 | $0 |
| New Other Liabilities (interest-free) | $0 | $0 | $0 |
| New Long-term Liabilities | $0 | $0 | $0 |
| Sales of Other Current Assets | $0 | $0 | $0 |
| Sales of Long-term Assets | $0 | $0 | $0 |
| New Investment Received | $0 | $0 | $0 |
| Subtotal Cash Received | $79,600 | $137,200 | $166,600 |
| Expenditures | Year 1 | Year 2 | Year 3 |
| Expenditures from Operations | |||
| Cash Spending | $0 | $0 | $0 |
| Bill Payments | $64,913 | $117,356 | $135,553 |
| Subtotal Spent on Operations | $64,913 | $117,356 | $135,553 |
| Additional Cash Spent | |||
| Sales Tax, VAT, HST/GST Paid Out | $0 | $0 | $0 |
| Principal Repayment of Current Borrowing | $15,000 | $13,860 | $13,860 |
| Other Liabilities Principal Repayment | $0 | $0 | $0 |
| Long-term Liabilities Principal Repayment | $0 | $0 | $0 |
| Purchase Other Current Assets | $0 | $0 | $0 |
| Purchase Long-term Assets | $0 | $0 | $0 |
| Dividends | $0 | $0 | $0 |
| Subtotal Cash Spent | $79,913 | $131,216 | $149,413 |
| Net Cash Flow | ($313) | $5,984 | $17,187 |
| Cash Balance | $70,037 | $76,021 | $93,208 |
7.4 Projected Balance Sheet
The Balance Sheet, below, shows our projected assets and liabilities for the three years of the plan, including accumulated depreciation of long-term assets.
| Pro Forma Balance Sheet | |||
| Year 1 | Year 2 | Year 3 | |
| Assets | |||
| Current Assets | |||
| Cash | $70,037 | $76,021 | $93,208 |
| Inventory | $3,947 | $6,803 | $8,236 |
| Other Current Assets | $0 | $0 | $0 |
| Total Current Assets | $73,984 | $82,824 | $101,444 |
| Long-term Assets | |||
| Long-term Assets | $11,550 | $11,550 | $11,550 |
| Accumulated Depreciation | $1,150 | $2,300 | $3,450 |
| Total Long-term Assets | $10,400 | $9,250 | $8,100 |
| Total Assets | $84,384 | $92,074 | $109,544 |
| Liabilities and Capital | Year 1 | Year 2 | Year 3 |
| Current Liabilities | |||
| Accounts Payable | $8,392 | $9,758 | $11,265 |
| Current Borrowing | $35,000 | $21,140 | $7,280 |
| Other Current Liabilities | $0 | $0 | $0 |
| Subtotal Current Liabilities | $43,392 | $30,898 | $18,545 |
| Long-term Liabilities | $0 | $0 | $0 |
| Total Liabilities | $43,392 | $30,898 | $18,545 |
| Paid-in Capital | $45,000 | $45,000 | $45,000 |
| Retained Earnings | ($11,600) | ($4,008) | $16,176 |
| Earnings | $7,592 | $20,184 | $29,822 |
| Total Capital | $40,992 | $61,176 | $90,999 |
| Total Liabilities and Capital | $84,384 | $92,074 | $109,544 |
| Net Worth | $40,992 | $61,176 | $90,999 |
7.5 Business Ratios
Business ratios for the years of this plan are shown below. Industry profile ratios based on the Standard Industrial Classification (SIC) code 5992, Florists, are shown for comparison.
| Ratio Analysis | ||||
| Year 1 | Year 2 | Year 3 | Industry Profile | |
| Sales Growth | 0.00% | 72.36% | 21.43% | 0.24% |
| Percent of Total Assets | ||||
| Inventory | 4.68% | 7.39% | 7.52% | 36.28% |
| Other Current Assets | 0.00% | 0.00% | 0.00% | 24.49% |
| Total Current Assets | 87.68% | 89.95% | 92.61% | 76.91% |
| Long-term Assets | 12.32% | 10.05% | 7.39% | 23.09% |
| Total Assets | 100.00% | 100.00% | 100.00% | 100.00% |
| Current Liabilities | 51.42% | 33.56% | 16.93% | 39.45% |
| Long-term Liabilities | 0.00% | 0.00% | 0.00% | 11.77% |
| Total Liabilities | 51.42% | 33.56% | 16.93% | 51.22% |
| Net Worth | 48.58% | 66.44% | 83.07% | 48.78% |
| Percent of Sales | ||||
| Sales | 100.00% | 100.00% | 100.00% | 100.00% |
| Gross Margin | 70.00% | 70.00% | 70.09% | 38.48% |
| Selling, General & Administrative Expenses | #VALUE! | 68.09% | #VALUE! | 23.26% |
| Advertising Expenses | 0.00% | 0.00% | 0.00% | 2.12% |
| Profit Before Interest and Taxes | 16.33% | 22.04% | 26.00% | 1.54% |
| Main Ratios | ||||
| Current | 1.71 | 2.68 | 5.47 | 1.68 |
| Quick | 1.61 | 2.46 | 5.03 | 0.68 |
| Total Debt to Total Assets | 51.42% | 33.56% | 16.93% | 57.66% |
| Pre-tax Return on Net Worth | 26.46% | 47.13% | 46.82% | 3.25% |
| Pre-tax Return on Assets | 12.85% | 31.32% | 38.89% | 7.68% |
| Additional Ratios | Year 1 | Year 2 | Year 3 | |
| Net Profit Margin | 9.54% | 14.71% | 17.90% | n.a |
| Return on Equity | 18.52% | 32.99% | 32.77% | n.a |
| Activity Ratios | ||||
| Inventory Turnover | 9.79 | 7.66 | 6.63 | n.a |
| Accounts Payable Turnover | 8.73 | 12.17 | 12.17 | n.a |
| Payment Days | 27 | 28 | 28 | n.a |
| Total Asset Turnover | 0.94 | 1.49 | 1.52 | n.a |
| Debt Ratios | ||||
| Debt to Net Worth | 1.06 | 0.51 | 0.20 | n.a |
| Current Liab. to Liab. | 1.00 | 1.00 | 1.00 | n.a |
| Liquidity Ratios | ||||
| Net Working Capital | $30,592 | $51,926 | $82,899 | n.a |
| Interest Coverage | 6.03 | 21.54 | 60.96 | n.a |
| Additional Ratios | ||||
| Assets to Sales | 1.06 | 0.67 | 0.66 | n.a |
| Current Debt/Total Assets | 51% | 34% | 17% | n.a |
| Acid Test | 1.61 | 2.46 | 5.03 | n.a |
| Sales/Net Worth | 1.94 | 2.24 | 1.83 | n.a |
| Dividend Payout | 0.00 | 0.00 | 0.00 | n.a |
Appendix
| Pro Forma Profit and Loss | |||||||||||||
| Month 1 | Month 2 | Month 3 | Month 4 | Month 5 | Month 6 | Month 7 | Month 8 | Month 9 | Month 10 | Month 11 | Month 12 | ||
| Sales | $0 | $0 | $6,960 | $6,960 | $6,960 | $6,960 | $6,960 | $6,960 | $6,960 | $6,960 | $11,960 | $11,960 | |
| Direct Cost of Sales | $0 | $0 | $2,088 | $2,088 | $2,088 | $2,088 | $2,088 | $2,088 | $2,088 | $2,088 | $3,588 | $3,588 | |
| Other Costs of Goods | $0 | $0 | $0 | $0 | $0 | $0 | $0 | $0 | $0 | $0 | $0 | $0 | |
| Total Cost of Sales | $0 | $0 | $2,088 | $2,088 | $2,088 | $2,088 | $2,088 | $2,088 | $2,088 | $2,088 | $3,588 | $3,588 | |
| Gross Margin | $0 | $0 | $4,872 | $4,872 | $4,872 | $4,872 | $4,872 | $4,872 | $4,872 | $4,872 | $8,372 | $8,372 | |
| Gross Margin % | 0.00% | 0.00% | 70.00% | 70.00% | 70.00% | 70.00% | 70.00% | 70.00% | 70.00% | 70.00% | 70.00% | 70.00% | |
| Expenses | |||||||||||||
| Payroll | $0 | $0 | $0 | $0 | $0 | $0 | $0 | $0 | $0 | $0 | $0 | $0 | |
| Marketing & Advertising | $0 | $0 | $464 | $464 | $464 | $464 | $464 | $464 | $464 | $464 | $464 | $464 | |
| Depreciation | $0 | $0 | $115 | $115 | $115 | $115 | $115 | $115 | $115 | $115 | $115 | $115 | |
| Rent | $0 | $0 | $0 | $0 | $600 | $600 | $600 | $600 | $600 | $600 | $600 | $600 | |
| Delivery Labor | $0 | $0 | $400 | $400 | $450 | $450 | $500 | $500 | $500 | $500 | $600 | $700 | |
| Temp Labor | $0 | $0 | $0 | $192 | $192 | $0 | $0 | $0 | $0 | $0 | $192 | $192 | |
| Contracted Floral Designer | $0 | $0 | $0 | $0 | $0 | $0 | $0 | $0 | $0 | $0 | $0 | $0 | |
| Insurance | $0 | $0 | $339 | $339 | $339 | $339 | $339 | $339 | $339 | $339 | $339 | $339 | |
| Dues & Subscriptions | $0 | $0 | $25 | $25 | $25 | $25 | $25 | $25 | $25 | $25 | $25 | $25 | |
| Repairs & Maintenance | $0 | $0 | $100 | $100 | $100 | $100 | $100 | $100 | $100 | $100 | $100 | $100 | |
| Supplies | $0 | $0 | $265 | $265 | $265 | $265 | $265 | $265 | $265 | $265 | $265 | $265 | |
| Taxes | $0 | $0 | $133 | $133 | $133 | $133 | $133 | $133 | $133 | $133 | $133 | $133 | |
| Other Fees | $0 | $0 | $150 | $150 | $150 | $150 | $150 | $150 | $150 | $150 | $150 | $150 | |
| Buildout Costs | $0 | $9,000 | $0 | $0 | $0 | $0 | $0 | $0 | $0 | $0 | $0 | $0 | |
| Deposits | $1,000 | $0 | $0 | $0 | $0 | $0 | $0 | $0 | $0 | $0 | $0 | $0 | |
| Utilities | $0 | $0 | $350 | $350 | $350 | $350 | $350 | $350 | $350 | $350 | $350 | $350 | |
| Van | 15% | $0 | $0 | $141 | $141 | $141 | $141 | $141 | $141 | $141 | $141 | $141 | $141 |
| Merchant Fees | $0 | $0 | $133 | $133 | $133 | $133 | $133 | $133 | $133 | $133 | $133 | $133 | |
| Total Operating Expenses | $1,000 | $9,000 | $2,615 | $2,807 | $3,457 | $3,265 | $3,315 | $3,315 | $3,315 | $3,315 | $3,607 | $3,707 | |
| Profit Before Interest and Taxes | ($1,000) | ($9,000) | $2,257 | $2,065 | $1,415 | $1,607 | $1,557 | $1,557 | $1,557 | $1,557 | $4,765 | $4,665 | |
| EBITDA | ($1,000) | ($9,000) | $2,372 | $2,180 | $1,530 | $1,722 | $1,672 | $1,672 | $1,672 | $1,672 | $4,880 | $4,780 | |
| Interest Expense | $208 | $208 | $202 | $196 | $190 | $183 | $177 | $171 | $165 | $158 | $152 | $146 | |
| Taxes Incurred | ($362) | ($2,763) | $616 | $561 | $368 | $427 | $414 | $416 | $418 | $420 | $1,384 | $1,356 | |
| Net Profit | ($846) | ($6,446) | $1,438 | $1,308 | $858 | $997 | $966 | $970 | $975 | $979 | $3,229 | $3,163 | |
| Net Profit/Sales | 0.00% | 0.00% | 20.67% | 18.80% | 12.32% | 14.32% | 13.88% | 13.94% | 14.00% | 14.07% | 27.00% | 26.45% | |
| Pro Forma Balance Sheet | |||||||||||||
| Month 1 | Month 2 | Month 3 | Month 4 | Month 5 | Month 6 | Month 7 | Month 8 | Month 9 | Month 10 | Month 11 | Month 12 | ||
| Assets | Starting Balances | ||||||||||||
| Current Assets | |||||||||||||
| Cash | $70,350 | $70,322 | $69,289 | $68,312 | $67,590 | $67,499 | $66,976 | $66,587 | $66,168 | $65,753 | $65,343 | $69,791 | $70,037 |
| Inventory | $1,500 | $1,500 | $1,500 | $2,297 | $2,297 | $2,297 | $2,297 | $2,297 | $2,297 | $2,297 | $2,297 | $3,947 | $3,947 |
| Other Current Assets | $0 | $0 | $0 | $0 | $0 | $0 | $0 | $0 | $0 | $0 | $0 | $0 | $0 |
| Total Current Assets | $71,850 | $71,822 | $70,789 | $70,608 | $69,887 | $69,796 | $69,273 | $68,884 | $68,465 | $68,050 | $67,640 | $73,737 | $73,984 |
| Long-term Assets | |||||||||||||
| Long-term Assets | $11,550 | $11,550 | $11,550 | $11,550 | $11,550 | $11,550 | $11,550 | $11,550 | $11,550 | $11,550 | $11,550 | $11,550 | $11,550 |
| Accumulated Depreciation | $0 | $0 | $0 | $115 | $230 | $345 | $460 | $575 | $690 | $805 | $920 | $1,035 | $1,150 |
| Total Long-term Assets | $11,550 | $11,550 | $11,550 | $11,435 | $11,320 | $11,205 | $11,090 | $10,975 | $10,860 | $10,745 | $10,630 | $10,515 | $10,400 |
| Total Assets | $83,400 | $83,372 | $82,339 | $82,043 | $81,207 | $81,001 | $80,363 | $79,859 | $79,325 | $78,795 | $78,270 | $84,252 | $84,384 |
| Liabilities and Capital | Month 1 | Month 2 | Month 3 | Month 4 | Month 5 | Month 6 | Month 7 | Month 8 | Month 9 | Month 10 | Month 11 | Month 12 | |
| Current Liabilities | |||||||||||||
| Accounts Payable | $0 | $818 | $6,231 | $5,997 | $5,352 | $5,788 | $5,653 | $5,683 | $5,679 | $5,675 | $5,670 | $9,924 | $8,392 |
| Current Borrowing | $50,000 | $50,000 | $50,000 | $48,500 | $47,000 | $45,500 | $44,000 | $42,500 | $41,000 | $39,500 | $38,000 | $36,500 | $35,000 |
| Other Current Liabilities | $0 | $0 | $0 | $0 | $0 | $0 | $0 | $0 | $0 | $0 | $0 | $0 | $0 |
| Subtotal Current Liabilities | $50,000 | $50,818 | $56,231 | $54,497 | $52,352 | $51,288 | $49,653 | $48,183 | $46,679 | $45,175 | $43,670 | $46,424 | $43,392 |
| Long-term Liabilities | $0 | $0 | $0 | $0 | $0 | $0 | $0 | $0 | $0 | $0 | $0 | $0 | $0 |
| Total Liabilities | $50,000 | $50,818 | $56,231 | $54,497 | $52,352 | $51,288 | $49,653 | $48,183 | $46,679 | $45,175 | $43,670 | $46,424 | $43,392 |
| Paid-in Capital | $45,000 | $45,000 | $45,000 | $45,000 | $45,000 | $45,000 | $45,000 | $45,000 | $45,000 | $45,000 | $45,000 | $45,000 | $45,000 |
| Retained Earnings | ($11,600) | ($11,600) | ($11,600) | ($11,600) | ($11,600) | ($11,600) | ($11,600) | ($11,600) | ($11,600) | ($11,600) | ($11,600) | ($11,600) | ($11,600) |
| Earnings | $0 | ($846) | ($7,292) | ($5,853) | ($4,545) | ($3,687) | ($2,690) | ($1,725) | ($754) | $221 | $1,200 | $4,429 | $7,592 |
| Total Capital | $33,400 | $32,554 | $26,108 | $27,547 | $28,855 | $29,713 | $30,710 | $31,675 | $32,646 | $33,621 | $34,600 | $37,829 | $40,992 |
| Total Liabilities and Capital | $83,400 | $83,372 | $82,339 | $82,043 | $81,207 | $81,001 | $80,363 | $79,859 | $79,325 | $78,795 | $78,270 | $84,252 | $84,384 |
| Net Worth | $33,400 | $32,554 | $26,108 | $27,547 | $28,855 | $29,713 | $30,710 | $31,675 | $32,646 | $33,620 | $34,600 | $37,829 | $40,992 |
| Sales Forecast | |||||||||||||
| Month 1 | Month 2 | Month 3 | Month 4 | Month 5 | Month 6 | Month 7 | Month 8 | Month 9 | Month 10 | Month 11 | Month 12 | ||
| Sales | |||||||||||||
| Retail Sales | 0% | $0 | $0 | $660 | $660 | $660 | $660 | $660 | $660 | $660 | $660 | $660 | $660 |
| Commercial Accounts | 0% | $0 | $0 | $3,300 | $3,300 | $3,300 | $3,300 | $3,300 | $3,300 | $3,300 | $3,300 | $3,300 | $3,300 |
| Frequent Buyer Programs | 0% | $0 | $0 | $3,000 | $3,000 | $3,000 | $3,000 | $3,000 | $3,000 | $3,000 | $3,000 | $3,000 | $3,000 |
| Holidays/Events | 0% | $0 | $0 | $0 | $0 | $0 | $0 | $0 | $0 | $0 | $0 | $5,000 | $5,000 |
| Total Sales | $0 | $0 | $6,960 | $6,960 | $6,960 | $6,960 | $6,960 | $6,960 | $6,960 | $6,960 | $11,960 | $11,960 | |
| Direct Cost of Sales | Month 1 | Month 2 | Month 3 | Month 4 | Month 5 | Month 6 | Month 7 | Month 8 | Month 9 | Month 10 | Month 11 | Month 12 | |
| Flowers & Materials | $0 | $0 | $2,088 | $2,088 | $2,088 | $2,088 | $2,088 | $2,088 | $2,088 | $2,088 | $3,588 | $3,588 | |
| Other | $0 | $0 | $0 | $0 | $0 | $0 | $0 | $0 | $0 | $0 | $0 | $0 | |
| Subtotal Direct Cost of Sales | $0 | $0 | $2,088 | $2,088 | $2,088 | $2,088 | $2,088 | $2,088 | $2,088 | $2,088 | $3,588 | $3,588 | |
| Pro Forma Cash Flow | |||||||||||||
| Month 1 | Month 2 | Month 3 | Month 4 | Month 5 | Month 6 | Month 7 | Month 8 | Month 9 | Month 10 | Month 11 | Month 12 | ||
| Cash Received | |||||||||||||
| Cash from Operations | |||||||||||||
| Cash Sales | $0 | $0 | $6,960 | $6,960 | $6,960 | $6,960 | $6,960 | $6,960 | $6,960 | $6,960 | $11,960 | $11,960 | |
| Subtotal Cash from Operations | $0 | $0 | $6,960 | $6,960 | $6,960 | $6,960 | $6,960 | $6,960 | $6,960 | $6,960 | $11,960 | $11,960 | |
| Additional Cash Received | |||||||||||||
| Sales Tax, VAT, HST/GST Received | 0.00% | $0 | $0 | $0 | $0 | $0 | $0 | $0 | $0 | $0 | $0 | $0 | $0 |
| New Current Borrowing | $0 | $0 | $0 | $0 | $0 | $0 | $0 | $0 | $0 | $0 | $0 | $0 | |
| New Other Liabilities (interest-free) | $0 | $0 | $0 | $0 | $0 | $0 | $0 | $0 | $0 | $0 | $0 | $0 | |
| New Long-term Liabilities | $0 | $0 | $0 | $0 | $0 | $0 | $0 | $0 | $0 | $0 | $0 | $0 | |
| Sales of Other Current Assets | $0 | $0 | $0 | $0 | $0 | $0 | $0 | $0 | $0 | $0 | $0 | $0 | |
| Sales of Long-term Assets | $0 | $0 | $0 | $0 | $0 | $0 | $0 | $0 | $0 | $0 | $0 | $0 | |
| New Investment Received | $0 | $0 | $0 | $0 | $0 | $0 | $0 | $0 | $0 | $0 | $0 | $0 | |
| Subtotal Cash Received | $0 | $0 | $6,960 | $6,960 | $6,960 | $6,960 | $6,960 | $6,960 | $6,960 | $6,960 | $11,960 | $11,960 | |
| Expenditures | Month 1 | Month 2 | Month 3 | Month 4 | Month 5 | Month 6 | Month 7 | Month 8 | Month 9 | Month 10 | Month 11 | Month 12 | |
| Expenditures from Operations | |||||||||||||
| Cash Spending | $0 | $0 | $0 | $0 | $0 | $0 | $0 | $0 | $0 | $0 | $0 | $0 | |
| Bill Payments | $28 | $1,033 | $6,438 | $6,181 | $5,552 | $5,983 | $5,849 | $5,879 | $5,875 | $5,870 | $6,013 | $10,213 | |
| Subtotal Spent on Operations | $28 | $1,033 | $6,438 | $6,181 | $5,552 | $5,983 | $5,849 | $5,879 | $5,875 | $5,870 | $6,013 | $10,213 | |
| Additional Cash Spent | |||||||||||||
| Sales Tax, VAT, HST/GST Paid Out | $0 | $0 | $0 | $0 | $0 | $0 | $0 | $0 | $0 | $0 | $0 | $0 | |
| Principal Repayment of Current Borrowing | $0 | $0 | $1,500 | $1,500 | $1,500 | $1,500 | $1,500 | $1,500 | $1,500 | $1,500 | $1,500 | $1,500 | |
| Other Liabilities Principal Repayment | $0 | $0 | $0 | $0 | $0 | $0 | $0 | $0 | $0 | $0 | $0 | $0 | |
| Long-term Liabilities Principal Repayment | $0 | $0 | $0 | $0 | $0 | $0 | $0 | $0 | $0 | $0 | $0 | $0 | |
| Purchase Other Current Assets | $0 | $0 | $0 | $0 | $0 | $0 | $0 | $0 | $0 | $0 | $0 | $0 | |
| Purchase Long-term Assets | $0 | $0 | $0 | $0 | $0 | $0 | $0 | $0 | $0 | $0 | $0 | $0 | |
| Dividends | $0 | $0 | $0 | $0 | $0 | $0 | $0 | $0 | $0 | $0 | $0 | $0 | |
| Subtotal Cash Spent | $28 | $1,033 | $7,938 | $7,681 | $7,052 | $7,483 | $7,349 | $7,379 | $7,375 | $7,370 | $7,513 | $11,713 | |
| Net Cash Flow | ($28) | ($1,033) | ($978) | ($721) | ($92) | ($523) | ($389) | ($419) | ($415) | ($410) | $4,447 | $247 | |
| Cash Balance | $70,322 | $69,289 | $68,312 | $67,590 | $67,499 | $66,976 | $66,587 | $66,168 | $65,753 | $65,343 | $69,791 | $70,037 | |

