
Circuit Fitness Importing
Executive Summary
Circuit Fitness Importing is a start-up business that has been formed as an Oregon registered LLC. The company has been formed to become the exclusive importer of the Wega Corporation’s innovative Esercitazione Diritta (Exercise Standing) fitness equipment. Circuit Fitness Importing is poised to receive the exclusive license to sell this patented equipment, already very popular in Europe, in the U.S.A.
The Market
The American fitness market, a smaller subset of the sporting goods industry has sales of $5.8 billion. The last 10 years has seen significant spikes in membership and usage of this equipment. Americans, on a societal level are beginning to realize that their unhealthy eating habits and lack of physical activity can have a profound impact on their lives. Consequently, fitness participation is booming. Circuit Fitness Importing has identified three customer segments that are particularly attractive:
- Distributors– This distribution layer accounts for 60% of the sales of fitness equipment. These sales occur primarily to independent fitness clubs.
- Health Clubs– This is another huge customer segment that is expected to have $565 million in sales for Year 1.
- Vertical Markets– These non-fitness industry facilities have over 30,000 facilities.
The Product
Esercitazione Diritta, Wega Corporation’s flagship fitness equipment is a patented technology applicable to strength fitness equipment. All other strength fitness equipment manufacturers have users placed in a seated position when performing the exercises. Esercitazione Diritta, instead, has the user stand. This is advantageous for several reasons. First, this strengthens lower body muscles that hold the body upright. It also strengthens central motor skills needed to maintain an upright position relative to the offsetting forces generated from the weight lifting. Esercitazione Diritta is protected patented technology which provides Circuit Fitness Importing a competitive edge. Additionally, Esercitazione Diritta is built on casters allowing the units to be moved as necessary.
Management
Circuit Fitness Importing will be led by Max Peruggio. Max has achieved numerous accomplishments that will provide him with the necessary skill set to execute on this well researched business model:
- Project manager for civilian and military projects in excess of $100 million.
- Accomplished sales manager, boosting sales of a design firm 10-fold in two years.
- Fluent in Italian and English.
- Successful importer of Italian goods into the U.S.A.
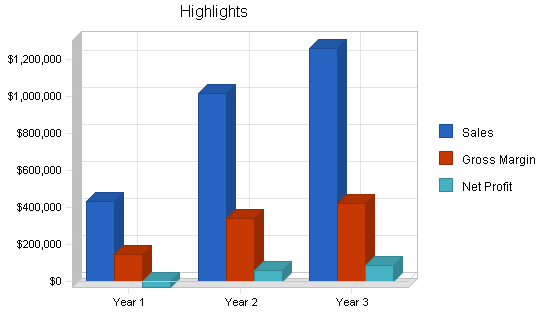
The combination of a exceptional products, the exclusive license to import the patented technology and an experienced sales and project manager will allow Circuit Fitness Importing to quickly gain market share. Revenue for years two and three have been forecasted to reach $1.0 million and $1.2 million respectively. For the same years net profit will be 6.0% and 6.98%.
1.1 Mission
Circuit Fitness Importing’s mission is to offer the finest, most innovative fitness equipment to the U.S.A. market. Circuit Fitness Importing will ensure all of their customer’s expectations are exceeded. By only offering the highest quality product with premium support, Circuit Fitness Importing will become the premier fitness equipment importer.
1.2 Keys to Success
- Provide value to customers with the best, most innovative product.
- Develop strong relationships with distributors, anticipating their needs.
- Employ strict financial controls to ensure profitability.
1.3 Objectives
- To become the sole U.S. importer of the revolutionary new Esercitazione Diritta exercise system.
- To generate revenue of $1 million within two years.
- Achieve profitability within the first year.
Company Summary
Circuit Fitness Importing has been formed as an Oregon LLC with the express purpose of importing the finest fitness equipment from Italy into the U.S. The company was founded by Max Peruggio in January of this year.
2.1 Start-up Summary
Circuit Fitness Importing is in the process of opening an office in anticipation of receiving an exclusive importing contract from Wega regarding their innovative Esercitazione Diritta exercise equipment. The office is located in Portland and requires the following equipment and service provider expenses:
- Three computer workstations with the following equipment:
- three Microsoft Office licenses
- broadband Internet connection
- two laser printers
- Peachtree Accounting
- Fax machine
- Copier
- Three sets of office furniture
- Large desk and chairs for meeting room
- Two line phone system
- Mobile phone
- Attorney fees for contract generation and LLC formation
- Accountant fees for accounting system set up
- Website development set up fees
- Brochure creation and printing

| Start-up Funding | |
| Start-up Expenses to Fund | $17,900 |
| Start-up Assets to Fund | $182,100 |
| Total Funding Required | $200,000 |
| Assets | |
| Non-cash Assets from Start-up | $15,000 |
| Cash Requirements from Start-up | $167,100 |
| Additional Cash Raised | $0 |
| Cash Balance on Starting Date | $167,100 |
| Total Assets | $182,100 |
| Liabilities and Capital | |
| Liabilities | |
| Current Borrowing | $0 |
| Long-term Liabilities | $85,000 |
| Accounts Payable (Outstanding Bills) | $0 |
| Other Current Liabilities (interest-free) | $0 |
| Total Liabilities | $85,000 |
| Capital | |
| Planned Investment | |
| Max Perrugio | $40,000 |
| Family and Friends | $75,000 |
| Other | $0 |
| Additional Investment Requirement | $0 |
| Total Planned Investment | $115,000 |
| Loss at Start-up (Start-up Expenses) | ($17,900) |
| Total Capital | $97,100 |
| Total Capital and Liabilities | $182,100 |
| Total Funding | $200,000 |
| Start-up | |
| Requirements | |
| Start-up Expenses | |
| Legal | $2,000 |
| Accountant fees | $2,000 |
| Brochures | $750 |
| Website development | $4,000 |
| Insurance | $150 |
| Rent | $1,000 |
| Research and Development | $0 |
| Expensed Equipment | $8,000 |
| Other | $0 |
| Total Start-up Expenses | $17,900 |
| Start-up Assets | |
| Cash Required | $167,100 |
| Start-up Inventory | $0 |
| Other Current Assets | $0 |
| Long-term Assets | $15,000 |
| Total Assets | $182,100 |
| Total Requirements | $200,000 |
2.2 Company Ownership
Max Peruggio is the sole owner of Circuit Fitness Importing. To finance operations, Max has invested $40,000 in the business, and has received money from friends and family as well as taken on bank debt.
Products
Esercitazione Diritta is a new and unique type of strength training fitness equipment. Unlike all other strength fitness equipment where you sit when you are doing your exercise, Esercitazione Diritta (Exercise Standing), as the name implies, has the user stand. Standing while doing exercises has many advantages.
- Develops a proper equilibrium with the central nervous system. This is accomplished because in addition to the user having to develop force to move the specific weight exercise, a standing posture must be maintained while exerting the force.
- In addition to working the specific muscle group, the lower body is being strengthened by having to use muscles to stand.
- Esercitazione Diritta replicates natural movements which are made throughout our daily life.
- Forcing the user to stand to perform the strength exercise enters the component of cardio into the workout.
All of the Esercitazione Diritta machines are commercial quality, crafted in Italy of the highest grade steels. In addition to being made to handle constant use, they have casters, allowing them to be easily moved anywhere in the club. Esercitazione Diritta has machines for a wide variety of body zones and muscle groups including:
- chest press– offers a choice of vertical or horizontal hand positions while the user performs forward extensions.
- tractions– the handgrips of the station are brought down to shoulder height just in front of the shoulders.
- shoulders– vertical lifts.
- legs– distances may vary between the feet. This station can perform squats, abductions, kicking motions and flexions of the hip.
- gluteus– while resting on the elbows and the arms, the user places the instep of one foot on the bar and pushes backwards.
- rowing– all of the muscles in the upper back are testing while avoiding the overloading that is is often associated with free movement.
- triceps– a variety of hand positions are possible to find the most natural movement.
- arm curl– arm muscles flex upwards while the legs are positioned one in front of the other.
Esercitazione Diritta is organized into a circuit of machines. Within a 45 minute period, a user can efficiently and effectively use all of the machines in a circuit for a complete workout.

Wega has received multiple international patents on their unique Esercitazione Diritta system of standing while performing strength exercise. Esercitazione Diritta is currently distributed in Europe and the manufacturer is interested in distribution into the U.S. fitness market. Wega has requested a importation proposal in the form of a business plan to choose a sole U.S. distributor.
Max Peruggio, founder of Circuit Fitness Importing has been requested by Wega to submit a proposal for the creation of an exclusive U.S. importer of Esercitazione Diritta. Because of Max’s Italian heritage, language skills, and past importation experience Wega is very interested in working with Max and Circuit Fitness Importing. It sounds as if the “proposal,” this business plan is a mere formality due to the good match of Max’s skills and Wega’s need for an importer.
Market Analysis Summary
Circuit Fitness Importing has identified three distinct customer segments that will be targeted for sale of the fitness equipment:
- Distributors
- Fitness Clubs
- Vertical Markets
The following section provides detail regarding each respective segment as well as background information regarding the industry, a large growing industry. The competition that Circuit Fitness faces is also provided.
4.1 Market Segmentation
Fitness equipment is distributed in the U.S. through distributors or direct from the manufacturer/importer. The majority of sales are done through distributors. Distributors typically carry one (sometimes a couple of) vendor for each type of equipment (strength, cardiovascular, etc.) and this explains the large number of distributors in the U.S. Manufacturers will typically provide an exclusive geographic area for each distributor to sell the products.
Large corporations (whether fitness clubs, franchises, corporations, etc.) that have significant buying power are often able to sidestep the distributor layer of the distribution channel by buying direct from the manufacturer. This means that Circuit Fitness Importing will have distributors as well as end consumers as target customers.
Distributors
As previously mentioned, distributors sell the bulk of fitness equipment. Data is sparse regarding distributors because the various industry associations (the primary association being IHRSA [International Health, Racquet and Sports club Association]) serve manufacturers more than distributors. The key information is that 60% of the fitness club market is composed of independent clubs, all of which purchase their equipment through distributors. The remaining 40% is composed of chains, franchises, etc., some of which purchase from distributors, some of which exert their superior buying power and purchase direct from the manufacturers.
Health Clubs
Health clubs are the second largest market of fitness equipment behind home fitness equipment (of a lower grade and price point relative to commercial equipment). The 1990s saw a significant increase in health club membership, 76% or 30.6 million people from 1997 to 1999.
In addition to significant increases in membership, health clubs have seen a shift in their customer demographics.
The demographic shifts are significant. Fitness clubs were once populated primarily by 18-34 year olds who were interested in body building. As Americans have made a paradigm shift they are now making the cognitive connection of fitness and health. Consequently, there is far greater cross section of the population having fitness club memberships. This is evidenced by the huge increase in club membership for over 55 year olds who are intuitively more interested in overall health than just fitness and strength. Additional demographics includes:
- Active, fitness oriented people are more concentrated in urban areas.
- 22% of club members are considered enthusiasts, evidenced by exercising 50 days a year at home, 96 days at a club.
- In metropolitan areas, 16% of the people exercise at clubs versus 23% at home.
- 5% of the club market is female-only facilities.
Sales of fitness equipment to clubs in 1998 was approximately $445 million. The projected figure for 2003 is $565 million, representing a 21% increase. The typical useable life of the fitness equipment in a fitness club (variances include maintenance, initial quality, and use) is 7 years.
Vertical Markets
Another market that will be attractive to Circuit Fitness Importing is the vertical market which includes non-health club environments such as hotels, hospitals, apartment complexes, corporations, universities, and senior citizen centers. This relatively new market is growing fast as consumers are increasingly valuing convenient access to exercise facilities.
Hotels
- 6,000 hotel fitness centers
- 68% of luxury hotels have fitness facilities
- Business travelers often use the existence of a fitness center as one of the key variables for hotel selection
Senior Living and Apartment Complexes
- 8,500 fitness centers within the complexes
- Proof of the shifting demographic to an older crowd using fitness equipment
Corporate Wellness
As a cost saving measure and a source of employee fringe benefits, corporations have been installing fitness centers within their offices. In a recently published study in the Journal of Occupational and Environmental Health, workers who participated in Xerox’s health-risk appraisal program which included active participation with the company’s fitness facilities, there was a 37% reduction in worker compensation claims and a 31% decrease in costs per injury. This provided Xerox over a two-year period with a 5 to 1 return on investment (ROI).
For Johnson & Johnson who studied the impact of a large-scale corporate health and wellness program, employees who participated within the program each saved the company $225 annually. The savings were generated from reduced hospital admissions, mental health visits and outpatient service. The bulk of the savings occurred between years three and four. When Johnson & Johnson evaluated medical expenditures for five years before the program and four years after the start of the program, the company saved $8.5 million annually. Both the Xerox and Johnson & Johnson studies provide solid quantifiable evidence that corporate wellness programs can have significant financial gains for the company.
- There are 4,000 corporate wellness fitness centers in the U.S.
- On average companies realize a 20% reduction in health care costs by implementing a corporate fitness and wellness program.
- The actual increase in productivity is in the process of being measured but will provide even greater data supporting corporate wellness and fitness centers.
Hospital Fitness Centers
- In 1997 there was 1,219 hospitals with fitness centers, ranging in size from 1,500 – 8,500 square meters
Other Non-health Club Markets
- 10,500 additional facilities, including airports, country clubs, and shopping malls

| Market Analysis | |||||||
| Year 1 | Year 2 | Year 3 | Year 4 | Year 5 | |||
| Potential Customers | Growth | CAGR | |||||
| Distributors | 3% | 1,200 | 1,236 | 1,273 | 1,311 | 1,350 | 2.99% |
| Health clubs | 5% | 12,545 | 13,172 | 13,831 | 14,523 | 15,249 | 5.00% |
| Vertical markets | 6% | 30,000 | 31,800 | 33,708 | 35,730 | 37,874 | 6.00% |
| Total | 5.64% | 43,745 | 46,208 | 48,812 | 51,564 | 54,473 | 5.64% |
4.2 Target Market Segment Strategy
Circuit Fitness Importing has chosen the three enumerated market segments for several reasons:
- Distributors– this is the network of companies that sells the bulk of fitness equipment to health clubs in the U.S. Specifically 60% of the health clubs make their equipment purchases through the distributor network.
- Health Clubs– the larger health clubs, because of their size and superior buying power are able to eliminate the distributor layer of the distribution channel and purchase equipment directly from the manufacturer. While the distributors are unhappy about this, there is little leverage that they can attempt to apply to the manufacturers because of the sheer size advantage that the larger clubs have.
- Vertical Markets– these markets, by virtue of the fact that they are outside the traditional industry of fitness equipment, and also because of some of the companies’ size, are able to buy direct from the importer or manufacturer. While these companies within the vertical market are more difficult and widespread in terms of identifying and contacting, they will still be a good source of sales.
4.3 Industry Analysis
The American fitness market is valued at $5.8 billion. While the industry is valued and tracked as a stand alone industry, it is generally considered part of the larger sporting goods market. In 2000, the fitness market grew at a 6% annual rate, almost twice the rate of the sporting goods market.
One trend that has been a significant driver in the growth of the fitness industry is the increasing recognition of the relationship between health and fitness. The societal epidemic of obesity has driven people to fitness clubs in an effort to take control of their health (weight, well being). This has helped Americans value the importance of fitness as it relates to their health. Looking good is no longer more important than feeling good and having a healthier and happier lifestyle. This is important because it provides a far larger foundation of customers with a more intuitive appeal toward fitness. Additionally, Baby Boomers (the post war bulge in population, people born between 1946-1964) have become more committed to exercise and fitness. This is fueled by their recent increases in disposable income as well as the perceived threat of not being able to enjoy their later years because of a decline in health.
The fitness industry is currently witnessing two significant trends. The first trend is the desire for equipment that is able to target specific body parts. Americans are also increasingly aware of the decrease of free time they have. Consequently, people are looking for machines that provide the greatest fitness benefit in the least amount of time.
Another trend the industry is experiencing is the accessibility of fitness equipment in nontraditional venues. In the 1990s fitness equipment was available primarily to people through fitness club membership. Beginning in the late 1990s and 2000, the industry has seen a trend of accessibility of fitness equipment in vertical markets which encompasses hotels, hospitals/rehabilitation centers, apartment complexes, corporate wellness facilities, and universities.
4.3.1 Competition and Buying Patterns
Circuit Fitness Importing faces competition from several large sources. The sources take the form of other fitness equipment manufacturers and importers. Circuit Fitness Importing is lumping both the manufacturers and importers together because they are often the same company or a subsidiary. In the case when they are a separate company, importers only import a specific brand of equipment so it is really a manufacturing brand versus a manufacturing brand.
- Precor– this is one of the largest manufacturers of fitness equipment. Precor makes both home fitness equipment as well as commercial grade equipment for fitness clubs. Precor manufactures both strength equipment as well as cardiovascular equipment.
- Paramount– this is a large manufacturer of both strength and cardiovascular equipment. Paramount however, only sells commercial grade equipment, they do not sell home units.
- Cybex– this is a large equipment manufacturer that sells a variety of light-commercial equipment. The light-commercial equipment is a mid-price point, higher quality and price than the home fitness equipment but not as expensive as commercial equipment. Light-commercial typically finds placement in vertical market customers where there equipment is not being used 24 hours a day, and therefore the units can be scaled back a bit in terms of quality and still remain functional for the industry average of seven years.
Strategy and Implementation Summary
Circuit Fitness Importing will leverage their competitive edge of intelectual property (IP) (actually a license to use the IP) that takes the form of a patent in the innovative Esercitazione Diritta approach to strength training. The marketing strategy will have an emphasis on the development of the customer network and relationships. Lastly, the sales strategy will be the work on moving the fitness units into a variety of different facilities through the emphasis of an efficient, innovative workout.
The first step that Circuit Fitness Importing must accomplish to prepare itself for the implementation of the marketing and sales strategy will be the development of a support infrastructure. The costs of importing which include shipping, duties and tariffs, warehousing, and distribution will be captured and detailed as a direct costs of goods founding the sales forecast. The following areas will need to be addressed:
- Import and logistics– the units will be manufactured in Italy and shipped via ocean freight on pallets in containers to the U.S. using the Port of Portland as the port of entry.
- The units will then be warehoused until they are sold.
- Distribution once the units are sold and need to be delivered.
- Customer service– as the sole importer Circuit Fitness Importing will offer customer service for the equipment.
- Repair– this function will be outsourced because of the geographic dispersion of all the different machines throughout the U.S. and will be recognized as a percentage in the direct cost of goods.
- Training– Circuit Fitness Importing will offer many different seminars that are designed to train the distributors or large individual users on the proper and most efficient use of the fitness equipment.
5.1 Competitive Edge
Circuit Fitness Importing’s competitive edge is their ability to license and use Wega’s intelectual property which takes the form of numerous international patents for Esercitazione Diritta. Esercitazione Diritta is innovative in the sense that it is the only equipment that allows the user to stand while performing strength exercises. This is of significant advantage for several reasons:
- Esercitazione Diritta provides a lower body workout for the user while they are performing a specific upper or lower body workout. While the workout of the legs is not as strong as the other specific workout the individual is performing at the same time, it none the less is a set of exercises that develop leg muscle tone.
- Esercitazione Diritta strengthens and tests the central nervous systems equilibrium which is a series of interrelated systems used to ensure balance when the person is standing. This is very good for motor skill development.
- Esercitazione Diritta’s exercise simulate natural movements that individuals do repletively throughout the day.
This ground breaking technology will provide significant differentiation for Esercitazione Diritta and assist them in their U.S.A. market penetration.
5.2 Marketing Strategy
The marketing strategy will consist of the following activities designed to develop a network of customer relationships:
- Focus groups with high-end fitness centers
- Private presentations to distributors
- Private showings to high-end fitness centers
- Meetings and presentations with personal trainers (e.g. New York City Personal Trainer Association) physical therapists, and sports medicine physicians and other specialists
- Tradeshows, with regional and national attendance
- Mailings and direct calling
5.3 Sales Strategy
The sales strategy will initially be based on the goal of trying to get large clubs to adopt Esercitazione Diritta equipment. This is quite attractive to Circuit Fitness Importing for a couple of reasons:
- A large fitness club will have many different outlets so a contract with one fitness company will yield multi-location sales. This is good for sales volume.
- The adoption of a large fitness company brings legitimacy of Esercitazione Diritta in the U.S. market.
Circuit Fitness Importing will also work on sales to distributors. Distributors are useful because Circuit Fitness Importing is able to leverage the distributor’s sales efforts for increased sales. This comes at a slightly smaller margin for the distributor customers. In all of the sales efforts, Circuit Fitness Importing will emphasize the innovative patented technology that is a part of the Esercitazione Diritta equipment that no other manufacturer can claim to offer.
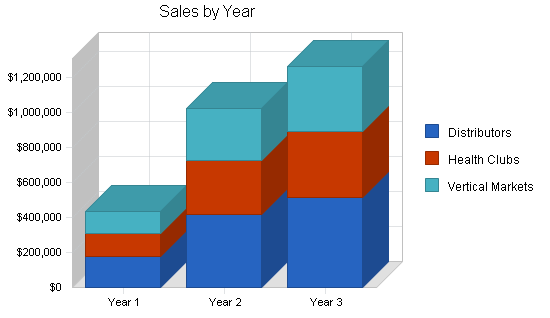
5.3.1 Sales Forecast
The sales forecast has been developed as a means for predicting and tracking sales. The direct costs of goods reflects the following components that have been converted into a percentage of sales:
- cost of the actual equipment
- warehouse costs
- handling and receiving of the pallet
- storage fees
- handling and shipping
- importing
- US government taxes
- merchandise process fee
- harbor maintenance fee
- duty
- custom & clearance

| Sales Forecast | |||
| Year 1 | Year 2 | Year 3 | |
| Sales | |||
| Distributors | $176,100 | $415,000 | $512,500 |
| Health Clubs | $130,314 | $307,100 | $379,250 |
| Vertical Markets | $126,792 | $298,800 | $369,000 |
| Total Sales | $433,206 | $1,020,900 | $1,260,750 |
| Direct Cost of Sales | Year 1 | Year 2 | Year 3 |
| Distributors | $112,704 | $265,600 | $328,000 |
| Health Clubs | $88,614 | $208,828 | $257,890 |
| Vertical Markets | $86,219 | $203,184 | $250,920 |
| Subtotal Direct Cost of Sales | $287,536 | $677,612 | $836,810 |
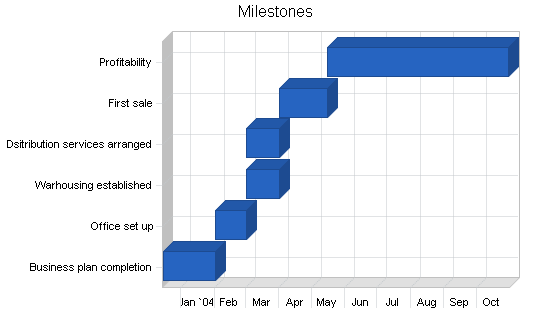
5.4 Milestones
Circuit Fitness Importing has adopted a series of milestone as goals for the organization. Different sections within the company are responsible for different milestones. The following table provides detailed information about the milestones.
| Milestones | |||||
| Milestone | Start Date | End Date | Budget | Manager | Department |
| Business plan completion | 12/15/2003 | 2/1/2004 | $0 | Max | Business Development |
| Office set up | 2/1/2004 | 3/1/2004 | $0 | Max | Operations |
| Warhousing established | 3/1/2004 | 4/1/2004 | $0 | Max | Operations |
| Dsitribution services arranged | 3/1/2004 | 4/1/2004 | $0 | Max | Operations |
| First sale | 4/1/2004 | 5/15/2004 | $0 | Max Max | Sales |
| Profitability | 5/15/2004 | 10/30/2004 | $0 | Max | Accounting |
| Totals | $0 | ||||
Web Plan Summary
A website will be developed as a sales and marketing tool for the Esercitazione Diritta products. While the parent company has a nice Flash-based website that provides a general overview of the technology, the site is geared more toward individual consumers (fitness users). Circuit Fitness Importing will be developing a website that is more technical in nature with the target audience being distributors or the procurement department of a large fitness club. The expense of the website has been listed as a start-up expense.
6.1 Website Marketing Strategy
The marketing of the website will be primarily based on inclusion of the URL in all printed material. Because the audience of Esercitazione Diritta equipment is fairly specialized, the most efficient means for marketing the site will be working specifically with the intended customers and pointing them to the site. Circuit Fitness Importing will submit the website to the various search engines.
6.2 Development Requirements
A Computer Science Student at Portland State University will be used for the design and development of the site.
Management Summary
Circuit Fitness Importing will be led by Max Peruggio. Max was born in Milan, Italy and received the equivalent of a U.S. law degree as an undergraduate education. Max’s career began early when he began to work for a design firm called Cootorcoli. At the age of 19, Max joined the firm and within two years was promoted to the head of sales. In this position Max increased sales from $1.5 million to $17 million. After this position Max moved onto project manager positions for numerous Italian civilian and military companies including being responsible for the following projects:
- Azzura III & IV– the first kevlar hulled boat to compete in Sailing’s World Cup. ($27 million)
- Terranova Antarctic Project– the Italian Antarctica based scientific research center ($54 million)
- Patriot Missile System– the missle defense system ($156 million)
Following these exciting projects max met an American woman and moved to the United States. Once in the U.S, Max started his own importation company for gourmet coffee beans, recognizing the absence of high quality Italian beans in America. After four years, Max transformed the importing company into a coffee roasting company and began roasting his own beans for sale using a decades old family recipe that uses blended recipes for the beans. Max pursued his dream of roasting coffee for nine years until he sold the business, looking for a new opportunity.
Through a close family friend, Max was told about the innovative Esercitazione Diritta equipment that Wega was producing and met with Wega representatives at a trade show in hope of developing an importing relationship. The Wega owners were so impressed with Max that the next month they flew him to Italy to check out the factory and meet more in depth with him. This was the beginning of Circuit Fitness Importing. Max is able to offer his Italian heritage and language skills which are invaluable when communicating with an Italian manufacturer. Max will also be able to leverage his superior project management skills as well as his Italy to U.S.A. importation skills to ensure that Circuit Fitness Importing is a success.
7.1 Personnel Plan
- Max– business development, marketing, sales
- Support– customer, training, operations (2)
- Repair technician (1)
- Sales agents (2)
| Personnel Plan | |||
| Year 1 | Year 2 | Year 3 | |
| Max | $20,000 | $45,000 | $60,000 |
| Support | $16,200 | $21,600 | $21,600 |
| Support | $14,400 | $21,600 | $21,600 |
| Repair | $16,000 | $24,000 | $24,000 |
| Sales | $20,000 | $30,000 | $40,000 |
| Sales | $15,000 | $30,000 | $40,000 |
| Total People | 6 | 6 | 6 |
| Total Payroll | $101,600 | $172,200 | $207,200 |
Financial Plan
The following sections will outline important financial information.
8.1 Important Assumptions
The following table details important financial assumptions.
| General Assumptions | |||
| Year 1 | Year 2 | Year 3 | |
| Plan Month | 1 | 2 | 3 |
| Current Interest Rate | 10.00% | 10.00% | 10.00% |
| Long-term Interest Rate | 10.00% | 10.00% | 10.00% |
| Tax Rate | 30.00% | 30.00% | 30.00% |
| Other | 0 | 0 | 0 |
8.2 Break-even Analysis
The Break-even Analysis indicates that approximately $41,600 will be needed in monthly revenue to reach the break even point.

| Break-even Analysis | |
| Monthly Revenue Break-even | $41,669 |
| Assumptions: | |
| Average Percent Variable Cost | 66% |
| Estimated Monthly Fixed Cost | $14,012 |
8.3 Projected Profit and Loss
The following table and charts illustrate the projected profit and loss.


| Pro Forma Profit and Loss | |||
| Year 1 | Year 2 | Year 3 | |
| Sales | $433,206 | $1,020,900 | $1,260,750 |
| Direct Cost of Sales | $287,536 | $677,612 | $836,810 |
| Other Costs of Goods | $0 | $0 | $0 |
| Total Cost of Sales | $287,536 | $677,612 | $836,810 |
| Gross Margin | $145,670 | $343,288 | $423,940 |
| Gross Margin % | 33.63% | 33.63% | 33.63% |
| Expenses | |||
| Payroll | $101,600 | $172,200 | $207,200 |
| Sales and Marketing and Other Expenses | $31,500 | $31,500 | $35,000 |
| Depreciation | $3,000 | $3,000 | $3,000 |
| Rent | $12,000 | $12,000 | $12,000 |
| Utilities | $3,000 | $3,000 | $3,000 |
| Insurance | $1,800 | $1,800 | $1,800 |
| Payroll Taxes | $15,240 | $25,830 | $31,080 |
| Other | $0 | $0 | $0 |
| Total Operating Expenses | $168,140 | $249,330 | $293,080 |
| Profit Before Interest and Taxes | ($22,470) | $93,958 | $130,860 |
| EBITDA | ($19,470) | $96,958 | $133,860 |
| Interest Expense | $7,764 | $6,457 | $5,123 |
| Taxes Incurred | $0 | $26,250 | $37,721 |
| Net Profit | ($30,234) | $61,251 | $88,016 |
| Net Profit/Sales | -6.98% | 6.00% | 6.98% |
8.4 Projected Cash Flow
The following chart and table show the projected cash flow.

| Pro Forma Cash Flow | |||
| Year 1 | Year 2 | Year 3 | |
| Cash Received | |||
| Cash from Operations | |||
| Cash Sales | $216,603 | $510,450 | $630,375 |
| Cash from Receivables | $142,682 | $410,168 | $589,448 |
| Subtotal Cash from Operations | $359,285 | $920,618 | $1,219,823 |
| Additional Cash Received | |||
| Sales Tax, VAT, HST/GST Received | $0 | $0 | $0 |
| New Current Borrowing | $0 | $0 | $0 |
| New Other Liabilities (interest-free) | $0 | $0 | $0 |
| New Long-term Liabilities | $0 | $0 | $0 |
| Sales of Other Current Assets | $0 | $0 | $0 |
| Sales of Long-term Assets | $0 | $0 | $0 |
| New Investment Received | $0 | $0 | $0 |
| Subtotal Cash Received | $359,285 | $920,618 | $1,219,823 |
| Expenditures | Year 1 | Year 2 | Year 3 |
| Expenditures from Operations | |||
| Cash Spending | $101,600 | $172,200 | $207,200 |
| Bill Payments | $327,255 | $808,471 | $963,605 |
| Subtotal Spent on Operations | $428,855 | $980,671 | $1,170,805 |
| Additional Cash Spent | |||
| Sales Tax, VAT, HST/GST Paid Out | $0 | $0 | $0 |
| Principal Repayment of Current Borrowing | $0 | $0 | $0 |
| Other Liabilities Principal Repayment | $0 | $0 | $0 |
| Long-term Liabilities Principal Repayment | $13,793 | $13,282 | $13,392 |
| Purchase Other Current Assets | $0 | $0 | $0 |
| Purchase Long-term Assets | $0 | $0 | $0 |
| Dividends | $0 | $0 | $0 |
| Subtotal Cash Spent | $442,647 | $993,953 | $1,184,197 |
| Net Cash Flow | ($83,362) | ($73,335) | $35,626 |
| Cash Balance | $83,738 | $10,402 | $46,028 |
8.5 Projected Balance Sheet
The following table presents the projected balance sheet.
| Pro Forma Balance Sheet | |||
| Year 1 | Year 2 | Year 3 | |
| Assets | |||
| Current Assets | |||
| Cash | $83,738 | $10,402 | $46,028 |
| Accounts Receivable | $73,921 | $174,203 | $215,131 |
| Inventory | $25,349 | $59,738 | $73,773 |
| Other Current Assets | $0 | $0 | $0 |
| Total Current Assets | $183,008 | $244,344 | $334,932 |
| Long-term Assets | |||
| Long-term Assets | $15,000 | $15,000 | $15,000 |
| Accumulated Depreciation | $3,000 | $6,000 | $9,000 |
| Total Long-term Assets | $12,000 | $9,000 | $6,000 |
| Total Assets | $195,008 | $253,344 | $340,932 |
| Liabilities and Capital | Year 1 | Year 2 | Year 3 |
| Current Liabilities | |||
| Accounts Payable | $56,935 | $67,302 | $80,266 |
| Current Borrowing | $0 | $0 | $0 |
| Other Current Liabilities | $0 | $0 | $0 |
| Subtotal Current Liabilities | $56,935 | $67,302 | $80,266 |
| Long-term Liabilities | $71,207 | $57,925 | $44,533 |
| Total Liabilities | $128,142 | $125,227 | $124,799 |
| Paid-in Capital | $115,000 | $115,000 | $115,000 |
| Retained Earnings | ($17,900) | ($48,134) | $13,117 |
| Earnings | ($30,234) | $61,251 | $88,016 |
| Total Capital | $66,866 | $128,117 | $216,133 |
| Total Liabilities and Capital | $195,008 | $253,344 | $340,932 |
| Net Worth | $66,866 | $128,117 | $216,133 |
8.6 Business Ratios
Business ratios for the years of this plan are shown below. Industry profile ratios based on the Standard Industrial Classification (SIC) code 5941, Sporting good (exercise apparatus)-retail, are shown for comparison. We are an importer of European equipment into the U.S., and we retail the equipment to the end user…gyms and health clubs, as well as to independent distributors.
| Ratio Analysis | ||||
| Year 1 | Year 2 | Year 3 | Industry Profile | |
| Sales Growth | 0.00% | 135.66% | 23.49% | 4.01% |
| Percent of Total Assets | ||||
| Accounts Receivable | 37.91% | 68.76% | 63.10% | 15.71% |
| Inventory | 13.00% | 23.58% | 21.64% | 39.55% |
| Other Current Assets | 0.00% | 0.00% | 0.00% | 24.92% |
| Total Current Assets | 93.85% | 96.45% | 98.24% | 80.18% |
| Long-term Assets | 6.15% | 3.55% | 1.76% | 19.82% |
| Total Assets | 100.00% | 100.00% | 100.00% | 100.00% |
| Current Liabilities | 29.20% | 26.57% | 23.54% | 40.00% |
| Long-term Liabilities | 36.52% | 22.86% | 13.06% | 14.33% |
| Total Liabilities | 65.71% | 49.43% | 36.61% | 54.33% |
| Net Worth | 34.29% | 50.57% | 63.39% | 45.67% |
| Percent of Sales | ||||
| Sales | 100.00% | 100.00% | 100.00% | 100.00% |
| Gross Margin | 33.63% | 33.63% | 33.63% | 31.56% |
| Selling, General & Administrative Expenses | 40.61% | 27.63% | 26.64% | 19.76% |
| Advertising Expenses | 0.00% | 0.00% | 0.00% | 1.49% |
| Profit Before Interest and Taxes | -5.19% | 9.20% | 10.38% | 1.66% |
| Main Ratios | ||||
| Current | 3.21 | 3.63 | 4.17 | 1.80 |
| Quick | 2.77 | 2.74 | 3.25 | 0.69 |
| Total Debt to Total Assets | 65.71% | 49.43% | 36.61% | 3.82% |
| Pre-tax Return on Net Worth | -45.22% | 68.30% | 58.18% | 59.54% |
| Pre-tax Return on Assets | -15.50% | 34.54% | 36.88% | 9.44% |
| Additional Ratios | Year 1 | Year 2 | Year 3 | |
| Net Profit Margin | -6.98% | 6.00% | 6.98% | n.a |
| Return on Equity | -45.22% | 47.81% | 40.72% | n.a |
| Activity Ratios | ||||
| Accounts Receivable Turnover | 2.93 | 2.93 | 2.93 | n.a |
| Collection Days | 55 | 89 | 113 | n.a |
| Inventory Turnover | 24.00 | 15.93 | 12.54 | n.a |
| Accounts Payable Turnover | 6.75 | 12.17 | 12.17 | n.a |
| Payment Days | 27 | 28 | 28 | n.a |
| Total Asset Turnover | 2.22 | 4.03 | 3.70 | n.a |
| Debt Ratios | ||||
| Debt to Net Worth | 1.92 | 0.98 | 0.58 | n.a |
| Current Liab. to Liab. | 0.44 | 0.54 | 0.64 | n.a |
| Liquidity Ratios | ||||
| Net Working Capital | $126,073 | $177,042 | $254,666 | n.a |
| Interest Coverage | -2.89 | 14.55 | 25.54 | n.a |
| Additional Ratios | ||||
| Assets to Sales | 0.45 | 0.25 | 0.27 | n.a |
| Current Debt/Total Assets | 29% | 27% | 24% | n.a |
| Acid Test | 1.47 | 0.15 | 0.57 | n.a |
| Sales/Net Worth | 6.48 | 7.97 | 5.83 | n.a |
| Dividend Payout | 0.00 | 0.00 | 0.00 | n.a |
Appendix
| Sales Forecast | |||||||||||||
| Month 1 | Month 2 | Month 3 | Month 4 | Month 5 | Month 6 | Month 7 | Month 8 | Month 9 | Month 10 | Month 11 | Month 12 | ||
| Sales | |||||||||||||
| Distributors | 0% | $0 | $0 | $0 | $0 | $9,500 | $14,500 | $18,500 | $21,000 | $23,500 | $28,000 | $30,050 | $31,050 |
| Health Clubs | 0% | $0 | $0 | $0 | $0 | $7,030 | $10,730 | $13,690 | $15,540 | $17,390 | $20,720 | $22,237 | $22,977 |
| Vertical Markets | 0% | $0 | $0 | $0 | $0 | $6,840 | $10,440 | $13,320 | $15,120 | $16,920 | $20,160 | $21,636 | $22,356 |
| Total Sales | $0 | $0 | $0 | $0 | $23,370 | $35,670 | $45,510 | $51,660 | $57,810 | $68,880 | $73,923 | $76,383 | |
| Direct Cost of Sales | Month 1 | Month 2 | Month 3 | Month 4 | Month 5 | Month 6 | Month 7 | Month 8 | Month 9 | Month 10 | Month 11 | Month 12 | |
| Distributors | $0 | $0 | $0 | $0 | $6,080 | $9,280 | $11,840 | $13,440 | $15,040 | $17,920 | $19,232 | $19,872 | |
| Health Clubs | $0 | $0 | $0 | $0 | $4,780 | $7,296 | $9,309 | $10,567 | $11,825 | $14,090 | $15,121 | $15,624 | |
| Vertical Markets | $0 | $0 | $0 | $0 | $4,651 | $7,099 | $9,058 | $10,282 | $11,506 | $13,709 | $14,712 | $15,202 | |
| Subtotal Direct Cost of Sales | $0 | $0 | $0 | $0 | $15,512 | $23,676 | $30,207 | $34,289 | $38,371 | $45,718 | $49,066 | $50,698 | |
| Personnel Plan | |||||||||||||
| Month 1 | Month 2 | Month 3 | Month 4 | Month 5 | Month 6 | Month 7 | Month 8 | Month 9 | Month 10 | Month 11 | Month 12 | ||
| Max | 0% | $0 | $0 | $2,000 | $2,000 | $2,000 | $2,000 | $2,000 | $2,000 | $2,000 | $2,000 | $2,000 | $2,000 |
| Support | 0% | $0 | $0 | $0 | $1,800 | $1,800 | $1,800 | $1,800 | $1,800 | $1,800 | $1,800 | $1,800 | $1,800 |
| Support | 0% | $0 | $0 | $0 | $0 | $1,800 | $1,800 | $1,800 | $1,800 | $1,800 | $1,800 | $1,800 | $1,800 |
| Repair | 0% | $0 | $0 | $0 | $0 | $2,000 | $2,000 | $2,000 | $2,000 | $2,000 | $2,000 | $2,000 | $2,000 |
| Sales | 0% | $0 | $0 | $0 | $0 | $2,500 | $2,500 | $2,500 | $2,500 | $2,500 | $2,500 | $2,500 | $2,500 |
| Sales | 0% | $0 | $0 | $0 | $0 | $0 | $0 | $2,500 | $2,500 | $2,500 | $2,500 | $2,500 | $2,500 |
| Total People | 0 | 0 | 1 | 2 | 5 | 5 | 6 | 6 | 6 | 6 | 6 | 6 | |
| Total Payroll | $0 | $0 | $2,000 | $3,800 | $10,100 | $10,100 | $12,600 | $12,600 | $12,600 | $12,600 | $12,600 | $12,600 | |
| General Assumptions | |||||||||||||
| Month 1 | Month 2 | Month 3 | Month 4 | Month 5 | Month 6 | Month 7 | Month 8 | Month 9 | Month 10 | Month 11 | Month 12 | ||
| Plan Month | 1 | 2 | 3 | 4 | 5 | 6 | 7 | 8 | 9 | 10 | 11 | 12 | |
| Current Interest Rate | 10.00% | 10.00% | 10.00% | 10.00% | 10.00% | 10.00% | 10.00% | 10.00% | 10.00% | 10.00% | 10.00% | 10.00% | |
| Long-term Interest Rate | 10.00% | 10.00% | 10.00% | 10.00% | 10.00% | 10.00% | 10.00% | 10.00% | 10.00% | 10.00% | 10.00% | 10.00% | |
| Tax Rate | 30.00% | 30.00% | 30.00% | 30.00% | 30.00% | 30.00% | 30.00% | 30.00% | 30.00% | 30.00% | 30.00% | 30.00% | |
| Other | 0 | 0 | 0 | 0 | 0 | 0 | 0 | 0 | 0 | 0 | 0 | 0 | |
| Pro Forma Profit and Loss | |||||||||||||
| Month 1 | Month 2 | Month 3 | Month 4 | Month 5 | Month 6 | Month 7 | Month 8 | Month 9 | Month 10 | Month 11 | Month 12 | ||
| Sales | $0 | $0 | $0 | $0 | $23,370 | $35,670 | $45,510 | $51,660 | $57,810 | $68,880 | $73,923 | $76,383 | |
| Direct Cost of Sales | $0 | $0 | $0 | $0 | $15,512 | $23,676 | $30,207 | $34,289 | $38,371 | $45,718 | $49,066 | $50,698 | |
| Other Costs of Goods | $0 | $0 | $0 | $0 | $0 | $0 | $0 | $0 | $0 | $0 | $0 | $0 | |
| Total Cost of Sales | $0 | $0 | $0 | $0 | $15,512 | $23,676 | $30,207 | $34,289 | $38,371 | $45,718 | $49,066 | $50,698 | |
| Gross Margin | $0 | $0 | $0 | $0 | $7,858 | $11,994 | $15,303 | $17,371 | $19,439 | $23,162 | $24,857 | $25,685 | |
| Gross Margin % | 0.00% | 0.00% | 0.00% | 0.00% | 33.63% | 33.63% | 33.63% | 33.63% | 33.63% | 33.63% | 33.63% | 33.63% | |
| Expenses | |||||||||||||
| Payroll | $0 | $0 | $2,000 | $3,800 | $10,100 | $10,100 | $12,600 | $12,600 | $12,600 | $12,600 | $12,600 | $12,600 | |
| Sales and Marketing and Other Expenses | $0 | $0 | $0 | $3,500 | $3,500 | $3,500 | $3,500 | $3,500 | $3,500 | $3,500 | $3,500 | $3,500 | |
| Depreciation | $250 | $250 | $250 | $250 | $250 | $250 | $250 | $250 | $250 | $250 | $250 | $250 | |
| Rent | $1,000 | $1,000 | $1,000 | $1,000 | $1,000 | $1,000 | $1,000 | $1,000 | $1,000 | $1,000 | $1,000 | $1,000 | |
| Utilities | $250 | $250 | $250 | $250 | $250 | $250 | $250 | $250 | $250 | $250 | $250 | $250 | |
| Insurance | $150 | $150 | $150 | $150 | $150 | $150 | $150 | $150 | $150 | $150 | $150 | $150 | |
| Payroll Taxes | 15% | $0 | $0 | $300 | $570 | $1,515 | $1,515 | $1,890 | $1,890 | $1,890 | $1,890 | $1,890 | $1,890 |
| Other | $0 | $0 | $0 | $0 | $0 | $0 | $0 | $0 | $0 | $0 | $0 | $0 | |
| Total Operating Expenses | $1,650 | $1,650 | $3,950 | $9,520 | $16,765 | $16,765 | $19,640 | $19,640 | $19,640 | $19,640 | $19,640 | $19,640 | |
| Profit Before Interest and Taxes | ($1,650) | ($1,650) | ($3,950) | ($9,520) | ($8,907) | ($4,771) | ($4,337) | ($2,269) | ($201) | $3,522 | $5,217 | $6,045 | |
| EBITDA | ($1,400) | ($1,400) | ($3,700) | ($9,270) | ($8,657) | ($4,521) | ($4,087) | ($2,019) | $49 | $3,772 | $5,467 | $6,295 | |
| Interest Expense | $699 | $690 | $681 | $671 | $662 | $652 | $643 | $633 | $623 | $613 | $603 | $593 | |
| Taxes Incurred | $0 | $0 | $0 | $0 | $0 | $0 | $0 | $0 | $0 | $0 | $0 | $0 | |
| Net Profit | ($2,349) | ($2,340) | ($4,631) | ($10,191) | ($9,568) | ($5,423) | ($4,979) | ($2,902) | ($824) | $2,908 | $4,614 | $5,451 | |
| Net Profit/Sales | 0.00% | 0.00% | 0.00% | 0.00% | -40.94% | -15.20% | -10.94% | -5.62% | -1.43% | 4.22% | 6.24% | 7.14% | |
| Pro Forma Cash Flow | |||||||||||||
| Month 1 | Month 2 | Month 3 | Month 4 | Month 5 | Month 6 | Month 7 | Month 8 | Month 9 | Month 10 | Month 11 | Month 12 | ||
| Cash Received | |||||||||||||
| Cash from Operations | |||||||||||||
| Cash Sales | $0 | $0 | $0 | $0 | $11,685 | $17,835 | $22,755 | $25,830 | $28,905 | $34,440 | $36,962 | $38,192 | |
| Cash from Receivables | $0 | $0 | $0 | $0 | $0 | $390 | $11,890 | $17,999 | $22,858 | $25,933 | $29,090 | $34,524 | |
| Subtotal Cash from Operations | $0 | $0 | $0 | $0 | $11,685 | $18,225 | $34,645 | $43,829 | $51,763 | $60,373 | $66,051 | $72,716 | |
| Additional Cash Received | |||||||||||||
| Sales Tax, VAT, HST/GST Received | 0.00% | $0 | $0 | $0 | $0 | $0 | $0 | $0 | $0 | $0 | $0 | $0 | $0 |
| New Current Borrowing | $0 | $0 | $0 | $0 | $0 | $0 | $0 | $0 | $0 | $0 | $0 | $0 | |
| New Other Liabilities (interest-free) | $0 | $0 | $0 | $0 | $0 | $0 | $0 | $0 | $0 | $0 | $0 | $0 | |
| New Long-term Liabilities | $0 | $0 | $0 | $0 | $0 | $0 | $0 | $0 | $0 | $0 | $0 | $0 | |
| Sales of Other Current Assets | $0 | $0 | $0 | $0 | $0 | $0 | $0 | $0 | $0 | $0 | $0 | $0 | |
| Sales of Long-term Assets | $0 | $0 | $0 | $0 | $0 | $0 | $0 | $0 | $0 | $0 | $0 | $0 | |
| New Investment Received | $0 | $0 | $0 | $0 | $0 | $0 | $0 | $0 | $0 | $0 | $0 | $0 | |
| Subtotal Cash Received | $0 | $0 | $0 | $0 | $11,685 | $18,225 | $34,645 | $43,829 | $51,763 | $60,373 | $66,051 | $72,716 | |
| Expenditures | Month 1 | Month 2 | Month 3 | Month 4 | Month 5 | Month 6 | Month 7 | Month 8 | Month 9 | Month 10 | Month 11 | Month 12 | |
| Expenditures from Operations | |||||||||||||
| Cash Spending | $0 | $0 | $2,000 | $3,800 | $10,100 | $10,100 | $12,600 | $12,600 | $12,600 | $12,600 | $12,600 | $12,600 | |
| Bill Payments | $70 | $2,099 | $2,100 | $2,506 | $6,948 | $30,494 | $35,028 | $41,000 | $43,889 | $48,124 | $56,840 | $58,158 | |
| Subtotal Spent on Operations | $70 | $2,099 | $4,100 | $6,306 | $17,048 | $40,594 | $47,628 | $53,600 | $56,489 | $60,724 | $69,440 | $70,758 | |
| Additional Cash Spent | |||||||||||||
| Sales Tax, VAT, HST/GST Paid Out | $0 | $0 | $0 | $0 | $0 | $0 | $0 | $0 | $0 | $0 | $0 | $0 | |
| Principal Repayment of Current Borrowing | $0 | $0 | $0 | $0 | $0 | $0 | $0 | $0 | $0 | $0 | $0 | $0 | |
| Other Liabilities Principal Repayment | $0 | $0 | $0 | $0 | $0 | $0 | $0 | $0 | $0 | $0 | $0 | $0 | |
| Long-term Liabilities Principal Repayment | $1,098 | $1,107 | $1,116 | $1,125 | $1,135 | $1,144 | $1,154 | $1,163 | $1,173 | $1,183 | $1,193 | $1,203 | |
| Purchase Other Current Assets | $0 | $0 | $0 | $0 | $0 | $0 | $0 | $0 | $0 | $0 | $0 | $0 | |
| Purchase Long-term Assets | $0 | $0 | $0 | $0 | $0 | $0 | $0 | $0 | $0 | $0 | $0 | $0 | |
| Dividends | $0 | $0 | $0 | $0 | $0 | $0 | $0 | $0 | $0 | $0 | $0 | $0 | |
| Subtotal Cash Spent | $1,168 | $3,206 | $5,216 | $7,431 | $18,183 | $41,738 | $48,781 | $54,763 | $57,662 | $61,907 | $70,633 | $71,961 | |
| Net Cash Flow | ($1,168) | ($3,206) | ($5,216) | ($7,431) | ($6,498) | ($23,513) | ($14,136) | ($10,934) | ($5,899) | ($1,534) | ($4,582) | $755 | |
| Cash Balance | $165,932 | $162,727 | $157,511 | $150,080 | $143,582 | $120,069 | $105,932 | $94,998 | $89,099 | $87,565 | $82,983 | $83,738 | |
| Pro Forma Balance Sheet | |||||||||||||
| Month 1 | Month 2 | Month 3 | Month 4 | Month 5 | Month 6 | Month 7 | Month 8 | Month 9 | Month 10 | Month 11 | Month 12 | ||
| Assets | Starting Balances | ||||||||||||
| Current Assets | |||||||||||||
| Cash | $167,100 | $165,932 | $162,727 | $157,511 | $150,080 | $143,582 | $120,069 | $105,932 | $94,998 | $89,099 | $87,565 | $82,983 | $83,738 |
| Accounts Receivable | $0 | $0 | $0 | $0 | $0 | $11,685 | $29,131 | $39,996 | $47,827 | $53,874 | $62,382 | $70,254 | $73,921 |
| Inventory | $0 | $0 | $0 | $0 | $0 | $7,756 | $11,838 | $15,103 | $17,144 | $19,185 | $22,859 | $24,533 | $25,349 |
| Other Current Assets | $0 | $0 | $0 | $0 | $0 | $0 | $0 | $0 | $0 | $0 | $0 | $0 | $0 |
| Total Current Assets | $167,100 | $165,932 | $162,727 | $157,511 | $150,080 | $163,023 | $161,037 | $161,031 | $159,969 | $162,158 | $172,805 | $177,769 | $183,008 |
| Long-term Assets | |||||||||||||
| Long-term Assets | $15,000 | $15,000 | $15,000 | $15,000 | $15,000 | $15,000 | $15,000 | $15,000 | $15,000 | $15,000 | $15,000 | $15,000 | $15,000 |
| Accumulated Depreciation | $0 | $250 | $500 | $750 | $1,000 | $1,250 | $1,500 | $1,750 | $2,000 | $2,250 | $2,500 | $2,750 | $3,000 |
| Total Long-term Assets | $15,000 | $14,750 | $14,500 | $14,250 | $14,000 | $13,750 | $13,500 | $13,250 | $13,000 | $12,750 | $12,500 | $12,250 | $12,000 |
| Total Assets | $182,100 | $180,682 | $177,227 | $171,761 | $164,080 | $176,773 | $174,537 | $174,281 | $172,969 | $174,908 | $185,305 | $190,019 | $195,008 |
| Liabilities and Capital | Month 1 | Month 2 | Month 3 | Month 4 | Month 5 | Month 6 | Month 7 | Month 8 | Month 9 | Month 10 | Month 11 | Month 12 | |
| Current Liabilities | |||||||||||||
| Accounts Payable | $0 | $2,029 | $2,020 | $2,301 | $5,937 | $29,333 | $33,664 | $39,542 | $42,294 | $46,231 | $54,902 | $56,195 | $56,935 |
| Current Borrowing | $0 | $0 | $0 | $0 | $0 | $0 | $0 | $0 | $0 | $0 | $0 | $0 | $0 |
| Other Current Liabilities | $0 | $0 | $0 | $0 | $0 | $0 | $0 | $0 | $0 | $0 | $0 | $0 | $0 |
| Subtotal Current Liabilities | $0 | $2,029 | $2,020 | $2,301 | $5,937 | $29,333 | $33,664 | $39,542 | $42,294 | $46,231 | $54,902 | $56,195 | $56,935 |
| Long-term Liabilities | $85,000 | $83,902 | $82,796 | $81,679 | $80,554 | $79,419 | $78,275 | $77,122 | $75,958 | $74,785 | $73,602 | $72,410 | $71,207 |
| Total Liabilities | $85,000 | $85,932 | $84,816 | $83,981 | $86,491 | $108,752 | $111,939 | $116,663 | $118,253 | $121,016 | $128,505 | $128,605 | $128,142 |
| Paid-in Capital | $115,000 | $115,000 | $115,000 | $115,000 | $115,000 | $115,000 | $115,000 | $115,000 | $115,000 | $115,000 | $115,000 | $115,000 | $115,000 |
| Retained Earnings | ($17,900) | ($17,900) | ($17,900) | ($17,900) | ($17,900) | ($17,900) | ($17,900) | ($17,900) | ($17,900) | ($17,900) | ($17,900) | ($17,900) | ($17,900) |
| Earnings | $0 | ($2,349) | ($4,689) | ($9,320) | ($19,511) | ($29,080) | ($34,502) | ($39,482) | ($42,384) | ($43,208) | ($40,299) | ($35,686) | ($30,234) |
| Total Capital | $97,100 | $94,751 | $92,411 | $87,780 | $77,589 | $68,020 | $62,598 | $57,618 | $54,716 | $53,892 | $56,801 | $61,414 | $66,866 |
| Total Liabilities and Capital | $182,100 | $180,682 | $177,227 | $171,761 | $164,080 | $176,773 | $174,537 | $174,281 | $172,969 | $174,908 | $185,305 | $190,019 | $195,008 |
| Net Worth | $97,100 | $94,751 | $92,411 | $87,780 | $77,589 | $68,020 | $62,598 | $57,618 | $54,716 | $53,892 | $56,801 | $61,414 | $66,866 |


