
Kingfishers
Executive Summary
Kingfishers is a retail Fly Shop offering supplies, guided tours, and fishing/hunting cabins to Anglers and Hunters that come to our state from all over the world. We are centrally located in the middle of this famous area, on Highway frontage on one of the busiest highways. We are in a prime location to succeed, as we make an excellent base camp and meeting place.
As new owners, Ausable Wulff and Brassie Nymph are purchasing a mildly successful fly shop, remodeling it, re-packaging it, and turning it into a successful destination location for fly fishers across the south.
Our competitive edge is tremendous. Our location, our advertising techniques, and unique customer “interest points” give us a superb edge in advertising. Our expertise in fly fishing these particular rivers lets us stock the most relevant supplies and provide our customers with expert advice so they can truly enjoy their fishing vacations. Our welcoming and supportive attitude towards even novice fisherman will turn first-time visitors into repeat customers. In addition, we offer not just lodging, but some of the nicest and most unique lodging in the area, at very competitive rates. We are on the the travel route between 4 major blue ribbon rivers, and the single most famous Trout River in the world. The keys to our success lie in our great location, the ambiance of our store, and most importantly, our attitude.
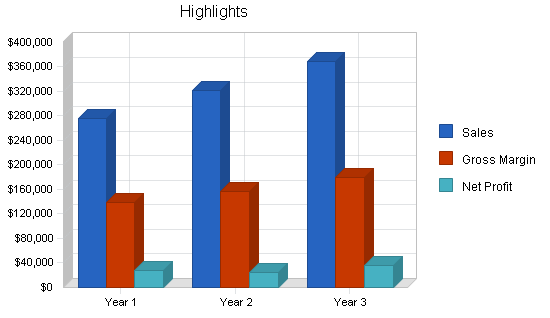
This plan will show what the business needs to start its successful venture, and how we plan on doing it. It shows that even using conservative projections, the company will have positive cash flows, tremendous gross margins of over 50%, and steady/solid growth. We will show a modest profit in the first year, and our profits increase steadily. Our projections are based on the past performance of the business under its previous owner, who willingly admits that he has not maximized the profit potential of the business. Based on these conservative projections, we will be ahead of the industry standard in almost every aspect.
In order to fund the purchase, renovation, and restocking of the business, the owners are contributing $64,000. We are also seeking a 10-year loan of $513,000, secured with the owners’ collateral (3 houses), at an 8% interest rate.
1.1 Objectives
We have several key objectives to complete to bring the business back to the level of success experienced in the past, and then maximize the revenue and profitability for today. To accomplish this, our objectives are:
- To double the number of customers that walk through the door the first year through use of advertising and Web presence, and increase customer traffic by 20% each year for five years.
- To increase floor sales by 30% by remodeling the retail space and re merchandising the products conducive to flow patterns, making it more customer and “sales” friendly.
- To take full advantage of all revenue sources in the geographic area by offering Hunting products to the substantiated large number of hunters in the area during the fall and winter months, increasing revenue by at least 25% the first year, 33% the second year, and 40% the third year.
- To reinstate the guide service for anglers, booking a minimum of 125 trips the first year using independently contracted guides and 1 employed guide, 250 the second year by using independently contracted guides and 1-2 employed guides, and 300+ the third year by using independently contracted and 1-2 employed guides under the Kingfishers Outfitters’ License. We will also increase revenue and gain market share by renting 2-3 drift boats to anglers that prefer to forego professional guide services.
- To gain market share and increase current revenues 50-60% by offering quality lodging at competitive rates in the most advantageous location possible for hunters and anglers. We would accomplish this by building 5 custom log cabins the first year, and adding one cabin per year for three years starting in Year 3. By doing this we will increase revenues of both guide trips/product sales and lodging, as each aspect will complement the other.
1.2 Mission
To provide an Angler’s and Outdoorsman’s shop where the customer is the priority and arrogance is left at the door… where patience is a practice and everyone we meet is a friend… where questions are answered without demeaning glances, and cold stares are unheard of… where you are asked to stay for a cup of coffee rather than just asked for your money and shown the door. Kingfishers is dedicated to providing Anglers and Hunters alike with the equipment that they want, the knowledge that they need, and experiences that make them want to come back.
1.3 Keys to Success
In the retail Fly Shop and Hunting Store business there are 4 main keys to success:
- Location: We are centrally located and within minutes of 5 major Trout Rivers and 4,000 square miles of public land. We are on a main highway that links Yellowstone National Park and Glacier National Park, and the highway that leads to one of our states biggest tourist attractions.
- Quality/Variety of products and services: We offer both top-quality and budget-priced products to both anglers and hunters; as well as guide services, boat rentals, and lodging. We also offer products and services unique to this shop.
- Atmosphere: Our store is built in a restored rustic log building, which symbolizes our state and what our state stands for. It has a spacious, warm ambiance, and offers a comforting atmosphere conducive to stress-free sales.
- Visibility/Marketing: Kingfishers is located on one of the busiest highways in the southwest portion of our state. 3000-4000 vehicles pass by the store each day during the spring, summer and fall months. We will use both passive (billboards etc) and active (direct mail, commercials etc) advertising to draw customers into the store from both in-state, and out of state.
Company Summary
Kingfishers is a retail store and lodging place in a great location that provides industry specific products to Anglers and Hunters who travel to our state from all over the world for Fly Fishing and Big Game Hunting. The store flourished under its former owner using just one half (1/2) of the available retail space, and offering no other services. The business has been in operation for nearly 20 years and enjoys a solid and positive reputation. The business has serviced clientele from all over the U.S. and has a large repeat customer base from both local and out-of-state Anglers. Under its former owner, the business offered Fly Fishing Guide Services and had a very respectable client base which could be easily regained to maximize and increase revenues today.
2.1 Company Ownership
Kingfishers will be a Limited Liability Company owned and operated by Ausable Wulff and Brassie Nymph, located in the southwest corner of the state on US Hwy XX. Ausable owns another company in the Hunting and Fishing Industry that he started in two years ago, which manufactures innovative hunting and fishing accessories. Brassie has 15 years of experience in managing tourist lodging and has financial management skills.
2.2 Start-up Summary
The start up table below summarizes what we feel is needed to start this business on the right track and to set it up for success. We have been careful to plan for what was really needed and not extravagant or needless items. The following is a list of assets needed for the business to start.

- The lot, improvements and buildings currently known as XXX.
- Outfitters License
- All current inventory of XXX (current wholesale value of $68,000)
- All current fixtures and signage of XXX
- New logo and signage for business
- The bare lot located adjacent to the above mentioned lot and buildings
- 5 Custom Pre-Built log cabin structures to be placed on the bare lot as said above
- Fixtures and furnishing/linen for 5 cabins
- 3 Drift Boats
- 1 portable espresso/coffee maker
The table below shows the breakdown of the assets as they are needed, including $15,000 starting cash and $30,000 dollars for additional inventory to stock the store to make it sales ready. It also includes a figure for current assets needed such as additional fixtures, and a computer system designed for retail sales, as well as showing the full value of the long-term assets that will be part of the business.

| Start-up | |
| Requirements | |
| Start-up Expenses | |
| Remodeling expenses | $4,000 |
| Stationery etc. | $400 |
| Other | $800 |
| Total Start-up Expenses | $5,200 |
| Start-up Assets | |
| Cash Required | $15,000 |
| Start-up Inventory | $98,000 |
| Other Current Assets | $6,400 |
| Long-term Assets | $452,400 |
| Total Assets | $571,800 |
| Total Requirements | $577,000 |
Products and Services
Kingfishers will offer a variety of products and services to leverage all aspects of outdoors fly fishing and hunting activities, to include:
- Fly Fishing Equipment, Clothing and Accessories: We will provide both top-quality and economical products to Anglers through our retail shop and on our website. Examples of our product brand names include R.L. Winston, Orvis, Umpqua, Filson, Columbia, Dr. Slick, Scientific Anglers, and more. We will also carry the largest selection of fishing Flies in the state (one key point in our advertising campaign).
- Hunting Equipment, Clothing and Accessories: We will provide a full line of hunting clothing and accessories for the large hunting market in the area. Our product line will include camouflage clothing and outerwear, ammunition and gun maintenance products, as well as a selection of related safety and convenience items.
- Comestibles: We will carry a number of comestibles, including cold refreshments and an assortment of quality cigars. We have found that many Hunters and Anglers love the idea of a cold drink and a fine cigar, and find the idea of such a treat after a good day of fishing or hunting extremely appealing. We have also searched for, but never found, any other business like ours offering the same. This type of product placement keeps the memory of our business in the customer’s mind for repeat business and word of mouth advertising.
- Pro Fishing Guide Services: With an Outfitter’s License that has more client days than most, and a large pool of experienced guides to pull from, we can offer a large numbers of Anglers guided trips on any one of 5 major trout rivers. With the opportunity to pick from full or half day trips, boat or wade trips, and multi-day packages available, we can tailor a trip to customer-specific desires, addressing both monetary and experience levels.
- Drift Boat Rentals: Our central location gives us a tremendous advantage over our competition, as well as providing great benefit to our customers. For customers who prefer not to hire a guide because of experience or monetary reasons, we will offer a superb compromise. By renting drift boats by the day to anglers who do not have boats of their own, or prefer not to transport them long distances, we can satisfy a substantial customer need and gain high margin revenue.
- Lodging: Kingfishers will offer lodging in custom-built log cabins. The cabins will be centrally located between 5 nearby trout rivers, as well as huge sections of private and public hunting lands. With differing levels of comfort and numbers of beds, the rustic cabins will have bathrooms, kitchenettes, hot and cold water, and heat. Our cabins will offer rustic comfort, and convenience of location.
Market Analysis Summary
Studies conducted by the U.S. Fish and Wildlife Service show very positive market trends in the nation and in our area. Fishing industry expenditures increased nationally from $53 billion in 1991 to $70 billion in 2001. In our state, there was a 6% increase in the number of Anglers who fished in the state, a 55% increase in the number of days that each Angler fished, and an incredible 118% increase in the total dollars spent by Anglers from 1991 – 2001, representing the 2nd largest increase in the nation. This means that there are more Anglers fishing here, they are staying longer, and they are spending more money while they are here.
The same USFWS report shows that the same is true for hunting in the state. 229,000 hunters hunted in this state for a total of 2.4 million days. This includes 59,000 non-resident hunters who hunted for 390,000 days, an average of 6.6 days each. This is a 46% increase in the number of hunting days in the state, and a 46% increase in the total dollars spent ($206 Million on expenses and equipment) from 1991 – 2001.
The breakdown of 2001 Hunting and Fishing Statistics looks like this:
Fishing:
| # of Anglers | 349,000 |
| Resident Anglers | 212,000 (60%) |
| Non-resident Anglers | 138,000 (40%) |
| Days of fishing | 4,100,000 |
| Resident days | 3,500,000 (85%) |
| Average days per Resident | 16.5 |
| Non-resident days | 554,000 (15%) |
| Average days per Non-resident | 4.1 |
| Total Expenditures | $292,000,000 |
| Trip-related | $149,000,000 |
| Equipment | $109,000,000 |
Hunting:
| # of Hunters | 229,000 |
| Resident Hunters | 170,000 (74%) |
| Non-resident Hunters | 59,000 (26%) |
| Days of hunting | 2,400,000 |
| Resident days of hunting | 2,100,000 (87%) |
| Average days per Resident | 12.4 |
| Non-resident days of hunting | 390,000 (13%) |
| Average days per Non-resident | 6.6 |
| Total Expenditures | $238,000,000 |
| Trip-related | $107,000,000 |
| Equipment | $99,000,000 |
Demographics:
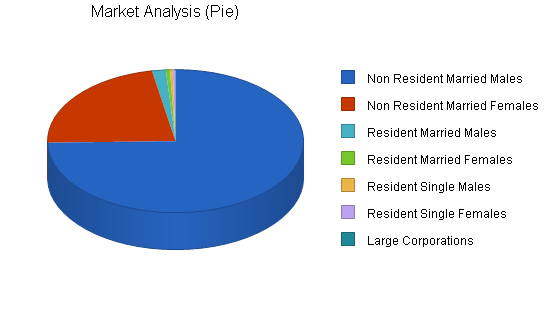
Our target customers consist of 6 target groups. The American Sport Fishing Association has conducted studies that show that Anglers are an average age of 42, 70% are married, and 33% have college degrees. In our state, 28% of all Anglers are female, and 97.5% of them are white. Based on these numbers, we have concluded that the best target audience will be out-of-state white males between 35 and 70. We also have smaller target market segments in out-of-state white females between 30 – 50, in-state single white males between 18 and 25, in-state married white males between 25 and 60, and in-state white females between 25 and 55, as well as large companies with large employee bases.
4.1 Market Segmentation
Our market segmentation defines the target customer segments most likely to visit the area of our state that we service. This way we can then tailor our advertising specifically to those target segments, thus minimizing advertising expenses and maximizing the effect of investment dollars.
Primary and secondary segments deal with non-resident Anglers and Hunters, one female group and one male group. These two segments consist of married men and women between the ages of 35 and 70. This is the age group that is most likely to have the means to afford the cost of traveling to a different state for fishing or hunting excursions. These segments travel specifically to hunt and fish as their end goal, or enjoy travel as the satisfaction goal and like to include hunting or fishing as enhancement activities. In either case, this group accounts for 33-40% of all fishing/hunting expenditures according to state-gathered statistics. In our state alone, this group spent an estimated $116,800,000 in 2001.
Our third target segment is resident males between the ages of 18 and 25. These males represent the future anglers and hunters, and are key to the future success of the business as well as a source of current revenues. By enticing these males to this area and enriching their experience, we will be more likely to turn them into repeat customers, even introducing their children into the business cycle. This segment has less financial responsibility or encumbrance than segments over 25 years old, and are therefore apt to take more trips and spend more freely. This group spent an estimated $73,777,200 in our state during 2001.
The fourth segment consists of single females 25 to 35 years of age. Females account for 30% of the anglers in our state and, by national average, do not marry until their 30’s. By targeting this segment of 30% of the market, we will earn their business and loyalty before they settle into family lives with incumbent responsibilities that may slow their outdoor activities. Pattern studies indicate that purchasing patterns and business loyalties formed within this segment are the most likely to endure through the life changes of marriage, family and personal maturity. This group makes up about 9% of the Anglers in our state and is responsible for about $16,254,000 spent here in 2001.
The fifth and sixth market segments consist of married residents, both male and female, between the ages of 25 and 60. This group is by far the largest group of hunters and anglers, from the casual to the avid sportspersons. This group makes up 70% of the Hunters and Anglers in our state and is responsible for $223,224,000 spent in Montana on Fishing and Hunting in 2001.
The seventh market segment targets large companies. The purpose of this including segment is to gain market share through direct advertising to companies that are large enough to send groups of people on trips as part of their own PR campaign, as company bonuses or as executive gifts. Billions of dollars are spent every year by large companies on advertising, bonus plans, and public relations. Our goal is to tap into this by offering guided trips and lodging (premium service at premium rates), to companies who don’t mind spending the money and can largely write-off the expense.
| Market Analysis | |||||||
| Year 1 | Year 2 | Year 3 | Year 4 | Year 5 | |||
| Potential Customers | Growth | CAGR | |||||
| Non Resident Married Males | 80% | 5,597,989 | 10,076,380 | 18,137,484 | 32,647,471 | 58,765,448 | 80.00% |
| Non Resident Married Females | 38% | 1,679,396 | 2,317,566 | 3,198,241 | 4,413,573 | 6,090,731 | 38.00% |
| Resident Married Males | 2% | 129,400 | 131,988 | 134,628 | 137,321 | 140,067 | 2.00% |
| Resident Married Females | 2% | 38,160 | 38,923 | 39,701 | 40,495 | 41,305 | 2.00% |
| Resident Single Males | 2% | 26,000 | 26,520 | 27,050 | 27,591 | 28,143 | 2.00% |
| Resident Single Females | 2% | 25,000 | 25,500 | 26,010 | 26,530 | 27,061 | 2.00% |
| Large Corporations | 10% | 2,000 | 2,200 | 2,420 | 2,662 | 2,928 | 10.00% |
| Total | 71.65% | 7,497,945 | 12,619,077 | 21,565,534 | 37,295,643 | 65,095,683 | 71.65% |
4.2 Target Market Segment Strategy
Our target market strategy focuses on groups who most closely resemble the average Hunter and Angler, and who have the means and desire to trave, fish and hunt. These are the groups that are most significantly contributing to the state’s revenue figures and are therefore the groups that will most significantly contribute to our revenue figures.
Our goal is to use the least amount of money on the most effective type of advertising so that we can have as large a return on our advertising investment as possible. To do this we will wage an advertising campaign aimed at all of our targeted segments, using a large percentage of the budget to focus on as large of a percentage of each market as possible, and to use a small amount of the budget to single out certain segments at certain times of the year.
4.3 Service Business Analysis
Kingfishers will be competing in the Hunting, Fishing, and Lodging industries in our state. The business will provide services specific to certain segments of those industries, and will be doing so in a specific geographic market area. Though there are dozens of businesses offering similar products and services across the state, we are not in direct competition with all of them. Direct competition is represented by five other Fly Shops in the market area that service the same waters we do, and as many as 10 businesses that offer lodging in the market area. There are few businesses offering products for the hunting industry in the area that we service.
Most of the industry competition that we face lies in the large department stores or chain stores located in the major cities, or “jumping-off points” of Hunters and Anglers. This is where a majority of resident anglers purchase their equipment and accessories, because this is where they live. Non-residents, however, tend to have specific destinations and limited time. This means that they normally travel to where they are going to hunt and fish, and then purchase any gear that they need from the local shops that their guides recommend, or that they have come to know from previous trips or advertising.
4.3.1 Competition and Buying Patterns
Competition varies greatly within the three industries that we conduct business. Discussed below are the general issues germane to competition in those three industries.
Fishing Industry:
The fishing industry is broken up into different categories. Fly Fishing is by far the most popular fishing sport in our state, and also the category with the most nuances. Catering to these nuances is the key to success in the Fly Fishing business. It is also an industry in which brand recognition and quality are of the utmost importance. For this reason, chain stores that sell fly-fishing equipment are not strong direct competitors. Chain and department stores do not carry the top-quality brand name equipment and accessories that Fly Shops do, for the most part. The larger stores do not specialize in a sport that requires a major amount of specialization. One of the biggest reasons that chain stores or even bigger department stores can’t compete well with specialty stores, such as fly shops, is that they do not have the staff with the product knowledge, or breadth of knowledge about the sport in general, to adequately sell the products. The vast majority of fly anglers recognize this fact and avoid chain stores for anything but general purchases. Competition in the chain store/department store arena usually revolves around price, convenience and availability.
Competition with other fly shops is a different story. Campaigns in this competition are waged over location, ambiance, advertising, name brands, quality service and relationships. Fly anglers are known to be loyal. When they find a fly shop that they like they will usually go back year after year. So in competition with other fly shops, the objective is to get the customer into your store and make them want to come back. This is where our “Keys to success” and “Objectives” come in.
Hunting Industry:
The Hunting industry is different from the Fly Fishing industry in that Hunters have a huge number of stores to choose from to purchase the products that they need. Most of these stores are located in the major cities and bigger towns. Our objective is not to compete with these stores directly, but to pick up where they leave off. Most hunters will forget something when they leave for a trip, or will lose or break something while they are out. This is the market share that we want to gain. Our location makes us a convenient stop to pick up an item or replace a piece of equipment. More than that, though, because the business is one of the few in the area to offer hunting and fishing Licenses, the Hunters are already coming into the store. This is a perfect opportunity to sell impulse items, or items that someone realizes they forgot or need.
Lodging Industry:
The Lodging side of the business has few direct competitors. There are several local businesses that offer lodging, but not many target the specific niche that we do. Most of the lodges are full service luxury-type accommodations that cost $200+ a night. There are several hotels in the area and one right in our town. These, however, are motels in the traditional sense and do not offer the same amenities that our lodging does. There are only 1-2 businesses offering lodging similar to ours and they are 30 to 40 miles away. When looking for lodging, most Anglers and Hunters look for convenience, comfort level, and price in orders that differ depending on the individuals and their particular needs. Our lodging scores high in all of those areas for the angling and hunting markets.
Strategy and Implementation Summary
Kingfishers’ strategy and implementation are simple. We aim to capitalize on our state’s natural beauty and wildlife resources, and the revenue that those two assets bring into the state every year. We will do so by promoting our location, unique marketing edges, and our quality services. By staying ahead of the competition, and creating the leading edge of marketing, we can draw people to our business where we will keep them as customers for life with our belief in customer service and sound business practice, as well as unique products and services.
5.1 Competitive Edge
Kingfishers is a company with a competitive edge. The most important aspect of the business is the location. Located on highway frontage on the main highway that connects five of the best trout rivers in our state, and serves as the main route between two national parks, we have a huge exposure to potential customers and a great marketing scheme. Whether they are staying in our rustic cabins, renting a boat from us, using one of our guides, or shopping in our store, the customer is centrally located to everything in the area. This means that if one river is not fishing very well for some reason, the customer is just as close to the four other rivers that will be. We make an excellent base camp and meeting place.
The opportunities for unique and exclusive advertising with our company are huge. Kingfishers can advertise the largest collection of flies in the state. We can advertise that we have one of, if not the oldest, Fly Shop in our county (our building was built in 1943). We can advertise the true rustic spirit of our shop, a log building that has been remodeled to be beautiful inside yet rustic at the same time. Our Lodging is among the nicest and most rustic available, with prices that can compete with even the run-down hotels. We have an Outfitters License that has a very large number of client days on it, and we can advertise that fact.
Finally, our competitive edge also lies in our attitude. Our Company Mission Statement says it for us. This is the reason people will come back year after year, tell their friends about us, and recommend us to acquaintances. It is what makes our company different than most others, and why we will build a solid business with a solid reputation.
Three principle items are sold by every business that sells products. They are the product itself, warranty and service. We are very aware that in today’s ultra-productive global society, product quality and name brand only go so far, and warranties are all almost identical. The one thing that is left is service. So above all else, Kingfishers focuses on selling Relationships, built on the piers of unequaled service, industry knowledge and business commitment.
5.2 Marketing Strategy
Our marketing strategy is directed to twin fronts, the local market and the out-of-state market. Marketing efforts will be divided equally between the two, with tactics specific to each.
Guide trip bookings are an important part of the business, and most bookings comes from out-of-state. Guide trips are important for several reasons, the first being that they are very profitable. Second, clients do not just purchase the trip but also spend money in the store. Third, those clients are a very important part of our advertising plan in the form of word-of-mouth advertising that is invaluable to the success of our business. To reach the out-of-state market we will use several approaches:
- The World Wide Web: We consider this to be the most cost-effective form of advertising available. Potential customers come to us via search engine hits that post our website based on keyword tags, thus we are presented to a targeted customer who is planning to spend money with somebody. For this reason, we have developed a website that easily rivals any competitors’. It is simple to navigate, easy to understand and read, makes the reader feel comfortable and trusting, and provides pertinent, accurate information, all key things when making a sale.
- Fishing Publications: Our target audience also turns to fishing publications when looking for a guide service or ideas on an area to fish. Advertising in these types of publications is key. The drawback is that you are competing with every other guide service and fly shop as well. Our goal with this type of advertising is to attempt to stand out, while using as little money as possible.
- Newspaper advertising when feasible: Newspaper advertising can be effective if done correctly. We believe that by placing ads in key sections of newspapers in large cities we can generate sales. The key to this type of advertising is to get the potential customer to see the ad, and call shortly afterwards. Often, the customer will see the ad, think about it, and go looking for more info and potentially stumble across the competition. Our plan with this type of advertising is to use small ads containing pictures and verbiage that will draw on an emotional response, thereby making the ad memorable.
- Occupational publications such as medical magazines: We consider this strategy our secret weapon. By publishing in publications such as Medical Magazines or other types of professional publications we are doing two things: we are effectively reaching a relatively wealthy audience of educated professionals who fit the target audience perfectly, and we are avoiding our competition while doing so.
- Infomercial Video on CD Media: This is our most targeted type of advertising that we will aim at the out-of-state market. We will produce short, 3 to 5 minute infomercials about our business concentrating on our guided trips and lodging. They will include exciting video of boat trips, and the camaraderie that goes along with them as well as a good look at the lodging aspect of the business, and the beauty of the surrounding area. These short CD videos will be sent to the Executive and PR staff of large corporations. Our goal with this is to entice these companies to send us business in the form of PR trips for their potential clients, as bonuses for their employees, or as personal trips for anyone in the company the video gets passed to. We feel this will be a very cost-effective way to get a solid customer base. It is a unique marketing tool for our industry and again avoids marketing in direct competition with our competition.
Local business is very important to us as well, and is why we are using the 2nd half of the marketing budget to reach it. Our local marketing strategy is very different than our out-of-state strategy. While our website will include information for local markets, most of our local budget is going to be spent on the last two forms of media discussed below.
- Roadside Advertising: We feel that the best form of advertising for our type of business will be roadside advertising, for several reasons. The biggest reason is that any customer who enters our shop or even comes to the general area will have driven there. Our main goal is to get them to notice that there is a great Fly Shop here by placing as many roadside billboards as possible along the smaller highways that come into the general five-rivers area surrounding us. The most advantageous places will be on the opposite sides of the surrounding towns (where our main competition lies), and outside of our town. If possible we will also place billboards at most of the major highway junctions in the area.
- Radio: All of the local business that we capture will have driven to our location from some distance. For this reason, we plan to place radio ads with the stations that will be most likely to provide coverage over the largest geographic area with the biggest population densities. ROI studies will be conducted as part of the advertising contract to ensure that we can track expenditures against returns to ensure positive ratios.
5.3 Sales Strategy
The objective of our sales strategy is simply to sell something to everyone who comes through the door, and to maximize the traffic flow in the shop. Anglers enter a shop with the idea that, at the very least, there is a possibility that they will make a purchase. To help realize our goals we will do the following:
- We will merchandise the store products to the greatest benefit, utilizing placement to maximize traffic flow.
- Every customer will be made to feel important and welcome. People spend money where they are comfortable and confident, and they buy from people that they like. We will provide both of these environments.
- A staff member knowledgeable in the fishing and hunting industries, as well as about local details, will always be available on-site.
- We will offer discounts to local guides who bring customers to the shop or recommend our store.
- Toward autumn we will integrate hunting products into the store to continue the season from the summer into the winter months.
5.3.1 Sales Forecast
The sales forecast shown here is based on conservative estimates and could turn out to be underestimated substantially. These estimates do not take into account any Internet sales as the Internet portion of the retail sales plan is new to the operation and competing in an unknown market. We expect that due to the ease of use and sales-friendly structure of the website, our Internet sales will be effective. Therefore, the Internet sales will be used initially as re-investment funding rather than as a substantial part of our financial plan. We will use it to boost the funding of things such as advertising, shop/lodging atmosphere and/or to increase revenue generating services like the number of cabins, or adding boats to the rental fleet.
The fist part of our sales forecast deals strictly with retail sales from the shop. Based on the 2003 Profit and Loss statement of the former owner, by merely increasing the traffic flow by 10%, the closing ratio by 12%, and by increasing the amount of each sale by 12% we can increase overall sales by a total of 35% ($88,500 to $119,218). We believe that new ownership could make these increases with fresh enthusiasm alone. However, coupled with a remodeling of the store which would double the sales space, brightening the interior with lighting and renovation, and fresh merchandise, the sales could easily double.
The forecast also deals with our available services. We have used conservative numbers here as well, and have information from the competition that suggests our actual sales could be higher. Our two main services are common to the industry and include professionally-guided float and wade trips on the local rivers, and boat rentals to anglers who do not need or want a guide but need a boat. We have forecasted the boats to rent at about 68% (86 out of about 127 days) of the season. We expect 100 to 120 guided float and wade trips the first year, including 50 trips conducted by the owner, and 50 to 70 contracted out to independent guides in the area.
The third service we offer is Lodging to the Hunters and Anglers in the area. The businesses offering lodging similar to ours report occupancy rates of 95%-100% from mid-spring to late autumn. We believe that we would have a competitive edge in the lodging market, but have forecast our first year at 75% occupancy rate. Even at a 75% occupancy rate, we still show a substantial profit from the lodging, and expect it to grow dramatically. If we see occupancy rates above 80% in the peak seasons, we will increase the number of cabins that we have available at a rate of one per year, which will increase our profit margins even more. Direct inventory costs for lodging (shown below) include soap and toiletries, firewood, and propane; related direct costs for cleaning services and repairs are shown at the top of the Profit and Loss table.
One of the major services that we offer is as a licensing agent for the state. This plays a major role in the business as it draws large numbers of people to the shop. License sales in 2003 topped $29,000. This is an estimated 1,000 people, or about 40% the number of estimated sales in 2003. Capitalizing on this service and increasing it is a key issue to our forecasts and growth.
In addition to the Fishing products and services we offer, we will also offer a variety of hunting equipment, accessories, and apparel to the hunters in the area. We estimate that the store sold 250 hunting licenses in 2003, but stocked no product to sell to those hunters. Our forecast shows what we believe to be an accurate representation of the revenue we can generate in the first 1 to 3 years by providing these products. Once the word of mouth advertising grows and it becomes widely known that we carry these types of items, we will be able to service not only the local resident market, but the state-resident area and non-resident out-of-state hunters as well. By tapping into this revenue source we will be able to accomplish two goals: increasing revenues from sources not taken advantage of by the former owner, and working our way into the Hunting Guide business in the coming years.
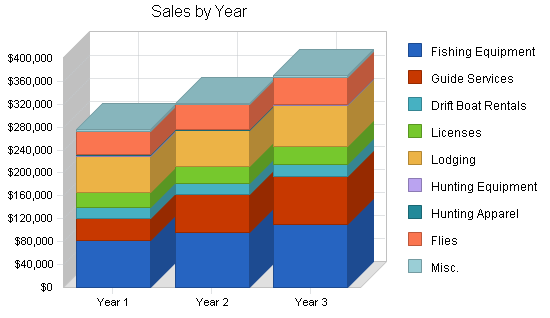
The table below shows both projected sales revenue and direct inventory costs for those sales. Direct costs for services (guided trips, boat rentals, cabins) are shown at the top of the Profit and Loss table.

| Sales Forecast | |||
| Year 1 | Year 2 | Year 3 | |
| Sales | |||
| Fishing Equipment | $82,816 | $95,238 | $109,523 |
| Guide Services | $37,400 | $68,000 | $85,000 |
| Drift Boat Rentals | $18,840 | $19,000 | $21,000 |
| Licenses | $26,800 | $28,500 | $30,000 |
| Lodging | $63,000 | $63,000 | $72,000 |
| Hunting Equipment | $1,350 | $1,200 | $1,500 |
| Hunting Apparel | $1,350 | $850 | $1,200 |
| Flies | $41,269 | $43,000 | $46,000 |
| Misc. | $2,700 | $3,000 | $3,500 |
| Total Sales | $275,525 | $321,788 | $369,723 |
| Direct Cost of Sales | Year 1 | Year 2 | Year 3 |
| Fishing Equipment | $45,548 | $52,380 | $60,237 |
| Lodging | $315 | $315 | $360 |
| Hunting Equipment | $743 | $600 | $750 |
| Hunting Apparel | $743 | $400 | $600 |
| Flies | $17,743 | $18,490 | $19,780 |
| Misc | $1,080 | $1,650 | $1,925 |
| Subtotal Direct Cost of Sales | $66,172 | $73,835 | $83,652 |
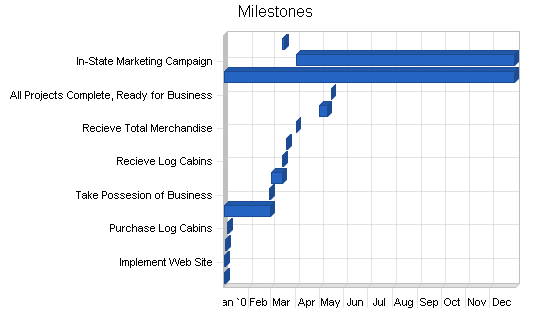
5.4 Milestones
The Milestones Table shows the milestones that are important to the operation of the business. Our goal is to get all of our projects completed as soon as possible, but we will use this timeline as a maximum deadline. This will give us time to do the jobs correctly without making the mistakes that rushing can cause while still allowing us to be ready in plenty of time for the main season to begin.
| Milestones | |||||
| Milestone | Start Date | End Date | Budget | Manager | Department |
| Close on Business | 1/1/2005 | 1/2/2005 | $0 | ABC | Owner |
| Implement Web Site | 1/1/2005 | 1/2/2005 | $500 | ABC | Owner |
| Purchase Additional Inventory | 1/3/2005 | 1/4/2005 | $30,000 | ABC | Owner |
| Purchase Log Cabins | 1/5/2005 | 1/6/2005 | $25,000 | ABC | Owner |
| Retail Space Remodel | 1/1/2005 | 2/28/2005 | $10,000 | ABC | Owner |
| Take Possesion of Business | 2/27/2005 | 2/28/2005 | $0 | ABC | Owner |
| Start Lodging Lot Prep | 3/1/2005 | 3/15/2005 | $10,000 | ABC | Owner |
| Recieve Log Cabins | 3/15/2005 | 3/16/2005 | $75,000 | ABC | Owner |
| Purchase Boats | 3/20/2005 | 3/21/2005 | $14,000 | ABC | Owner |
| Recieve Total Merchandise | 4/1/2005 | 4/2/2005 | $0 | ABC | Owner |
| Finish Cabin Furnishing | 4/30/2005 | 5/10/2005 | $15,000 | ABC | Owner |
| All Projects Complete, Ready for Business | 5/15/2005 | 5/15/2005 | $0 | ABC | Owner |
| Out-of-State Marketing Campaign | 1/1/2005 | 12/31/2005 | $2,250 | ABC | Mktng/Sales |
| In-State Marketing Campaign | 4/1/2005 | 12/31/2005 | $2,750 | ABC | Mktng/Sales |
| Finish Cabin Install | 3/15/2005 | 04/31/05 | $10,000 | ABC | Owner |
| Totals | $194,500 | ||||
Web Plan Summary
The World Wide Web is an extremely important asset to our business. By providing a storefront available to the entire world that is open 24 hours, we are able to reach unprecedented numbers of potential customers. This source of advertising will help us realize significant gains in both potential customers and revenue.
We have developed our website to accomplish two missions. The first is to draw customers from out-of-state to our company for Professional Guiding. The second is to provide an online store where customers who can not visit our physical store may purchase Fishing and Hunting products. By giving people an online store, an easy method of purchase, and fair prices on items that they need or want, we can gain market share where we would never have known it even existed in the past.
To entice people to reserve trips with us, to buy on our online store, and to convince them to visit us in person, we have developed the website to do several things at once when a customer visits the site:
- Give the customer an initial impression of our store and our personality: This is a crucial part of selling ourselves. Our customers do not just buy from us because we have what they want or need. They buy from us because they like us.
- Look warm and inviting: The design of our website is meant to give a warm and rustic feeling to instill trust of our company, and keeps the customer on the page for as long as possible.
- Be unique and look professional: While all websites share certain characteristics, we have attempted to keep a fresh look that is professional. Professional-looking websites instill trust, and generate sales.
After we have made our initial impression, we have convinced our visitor to stay on the site and look at what we have to offer. To keep the visitor browsing and convince them to either buy products or contact us to reserve a fishing trip, our site must do several things:
- Be easy to navigate: We have made our site extremely easy to navigate with out excessive scrolling. A visitor must be able to easily find their way around the site and to go directly to the information that they are seeking without having to think or search extensively. Most visitors give a site 10 to 15 seconds, or less, to find what they are looking for.
- Instill trust: Our website instills trust on several levels. It looks professional, and is designed using warm, friendly colors and simple layout. We accept credit cards online, which shows our competence and tells customers that we are big enough to offer secure methods of payment.
- Offer all of the information a visitor is looking for: Information about all of our services is easy to find and complete. Visitors don’t search websites for information so that they can be told to call someone for more information.
- Ask the visitor to act (call or buy): We provide plenty of opportunity for people to purchase products or contact us about our services without being pushy about it. Most people do not mind being led into a purchase or action, but resent being pushed into it. We believe that we have found the right balance.
- Come up on Search Engine Searches: Our site has been designed to be search engine compliant, and can be found at the top of most of the search engine results for searches conducted for our services. When search engines search the Web for content, they have specific criteria that a site has to meet for the site to be found and display in a search. This is extremely important for ranking purposes.
6.1 Website Marketing Strategy
Our website is geared to the casual Internet user who is looking for us, or more precisely, looking for information about fishing and hunting in our state, or about products and services we offer. This gives us several marketing strategies to use to put our website and name in front of as many people as possible.
- We will constantly upgrade our website and keep it search engine compliant so that it stays in the top rankings for our industry.
- We will exchange links with as many other same-industry websites as possible, who are not in direct competition with our shop.
- We will put our Web address/link on as many state commerce-oriented sites as possible. This enables us to link our site with 2 to 3 state-sponsored sites, and several privately-sponsored sites as well, thereby doubling or tripling (or more) the chances of someone seeing the site.
- We will advertise on the search engines. This is an extremely effective method of advertisement wherein we pay a certain amount for each visitor that comes to our site from a particular search engine. The search engine, in exchange, puts our site at the top of the list, or in some cases in a special box that draws attention.
6.2 Development Requirements
The website will be developed in house by the business owner. Costs will be kept to a minimum and the only projected expenses will be the cost of having the site hosted on a server, and those costs usually associated with accepting credit cards online. The site should be mostly completed and online by the closing date of the business sale.
Management Summary
Kingfishers is owned and operated by Ausable Wulff and Brassie Nymph. Ausable is an Army Veteran and comes from a background in Federal Law Enforcement. He brings his motivation for success, ability to lead people, and knowledge of the industry to this venture where he feels he can be very successful. Ausable has started one company in the industry where he has invented products for the hunting and fishing industry, applied for and received patents, and wholesales the products to Fly Shops and Hunting stores around the state. He accomplished this with limited capital and in his spare time during nights and weekends. He will use this “can do” positive attitude to expand Kingfishers, and make it a great place where both customers and employees want to be.
Brassie Nymph is Ausable’s sister, a fly fishing enthusiast and former manager of The Lodges at Creek X. She brings 15 years of management and financial experience to the business, and will be in charge of the Kingfishers cabins.
7.1 Personnel Plan
We are basing our personnel table below on the historic season and guiding dates of the area. The owner (and other independently-contracted guides) will guide clients on the river while one employee will be needed to assist customers and watch the store while the owner is gone. The additional employee will be especially beneficial during the extremely busy months of July, August and September. We are estimating that the employee will increase revenue enough to more than pay for the salary being paid to him. Independently-contracted guides are not employees – expenses for their payments can be found in the Profit and Loss statement.
Brassy Nymph will not draw a salary in the first year, but will have access to at-cost fly fishing equipment during the trout season, when we will need her help as manager of the lodging cabins. She will begin to draw a salary in the second year.
After the first year, we will evaluate how many employees will be needed to staff the store for the upcoming season. Based on projected growth rates we are estimating that hiring two employees the second year would be prudent.
| Personnel Plan | |||
| Year 1 | Year 2 | Year 3 | |
| Owner Operator | $15,600 | $17,000 | $20,000 |
| Cabin Manager (Brassie) | $0 | $10,000 | $15,000 |
| Part Time Employee | $12,600 | $25,200 | $25,200 |
| Name or Title or Group | $0 | $0 | $0 |
| Total People | 3 | 5 | 5 |
| Total Payroll | $28,200 | $52,200 | $60,200 |
Financial Plan
The $513,000 loan that the company expects to secure shortly will help cover the start-up expenses and provide operating cash. The following sections show in detail that Kingfishers will be profitable from the beginning. Its healthy profits will be sufficient to pay back the loan and provide return to the owners with room to grow.
8.1 Start-up Funding
Our start up funding table shows a start up requirement of $577,000, which includes $556,800 of non-cash assets, $5,200 of expenses and $15,000 cash. The owners will contribute $50,000 and $14,000, respectively, to the business. As shown in the table, Kingfishers only needs $513,000 in lending to get the business going. We will repay this loan over ten years at an 8% interest rate. We would like to defer initial repayments until April of the first year, when trout fishing picks up, in order to maintain a positive cash balance. We will make up these first three months of repayments with double payments for three months in the 3rd year. The major use of loan funds will be to buy the property of the former fly fishing business we plan to revive.
| Start-up Funding | |
| Start-up Expenses to Fund | $5,200 |
| Start-up Assets to Fund | $571,800 |
| Total Funding Required | $577,000 |
| Assets | |
| Non-cash Assets from Start-up | $556,800 |
| Cash Requirements from Start-up | $15,000 |
| Additional Cash Raised | $0 |
| Cash Balance on Starting Date | $15,000 |
| Total Assets | $571,800 |
| Liabilities and Capital | |
| Liabilities | |
| Current Borrowing | $0 |
| Long-term Liabilities | $513,000 |
| Accounts Payable (Outstanding Bills) | $0 |
| Other Current Liabilities (interest-free) | $0 |
| Total Liabilities | $513,000 |
| Capital | |
| Planned Investment | |
| Owner-Ausable | $50,000 |
| Owner-Brassie | $14,000 |
| Additional Investment Requirement | $0 |
| Total Planned Investment | $64,000 |
| Loss at Start-up (Start-up Expenses) | ($5,200) |
| Total Capital | $58,800 |
| Total Capital and Liabilities | $571,800 |
| Total Funding | $577,000 |
8.2 Important Assumptions
The financial plan depends on important assumptions. The key underlying assumptions are:
- We assume a steady growth economy, without major recession.
- We assume that there wont be a catastrophic event such as 9-11, or that if such an event happens it won’t stop tourism.
| General Assumptions | |||
| Year 1 | Year 2 | Year 3 | |
| Plan Month | 1 | 2 | 3 |
| Current Interest Rate | 8.00% | 8.00% | 8.00% |
| Long-term Interest Rate | 8.00% | 8.00% | 8.00% |
| Tax Rate | 30.00% | 30.00% | 30.00% |
| Other | 0 | 0 | 0 |
8.3 Break-even Analysis
For our break-even analysis, we assume running costs which include our full payroll, loan principal repayment, and utilities, and an estimation of other running costs. Total direct costs for the first year average include inventory, payments to outside guides, cleaning and maintenance of the lodging, and credit card fees.
The table shows that we will surpass the break-even point in the second half of the first year. As the Fishing, Hunting and Tourism business is seasonal, we plan on making the majority of our revenues during the summer and fall months, which will carry us through the beginning of the next year until the next summer season starts.

| Break-even Analysis | |
| Monthly Revenue Break-even | $16,291 |
| Assumptions: | |
| Average Percent Variable Cost | 49% |
| Estimated Monthly Fixed Cost | $8,236 |
8.4 Projected Profit and Loss
Our Pro Forma Profit and Loss statement was constructed from a conservative point-of-view, and is based in large part on past performance of the business under its former owner. By improving on the retail store and adding fresh ideas and spirit to the sales floor we can dramatically increase sales beyond our conservative estimates. By adding other services that are not highly labor intensive, such as lodging, to the business we can greatly increase revenue without greatly increasing costs. By strengthening our service position, and rebuilding our customer relationships, we will widen our customer base and increase sales.
Non-inventory costs of sales listed below include payments to the independently-contracted guides, license fees, credit card fees, and cleaning and maintenance on the cabins.
Despite the seasonal nature of the business, we expect to generate a small profit in the first year, based on the past performance of the business, as backed up by tax statements, and on a modest increase in sales from the remodeling and new revenue streams. We expect second year profits to dip slightly as we increase payroll to include Brassy Nymph and hire additional part-time employees. Month-to-month projections for Profit and Loss are included in the appendix.


| Pro Forma Profit and Loss | |||
| Year 1 | Year 2 | Year 3 | |
| Sales | $275,525 | $321,788 | $369,723 |
| Direct Cost of Sales | $66,172 | $73,835 | $83,652 |
| Independant Guide Cost | $21,840 | $40,800 | $51,000 |
| License Funds going back to state | $26,600 | $28,200 | $29,700 |
| Credit Card Fees | $1,460 | $2,011 | $2,311 |
| Lodging – cleaning and maintenance | $20,160 | $20,160 | $23,040 |
| Total Cost of Sales | $136,232 | $165,006 | $189,703 |
| Gross Margin | $139,293 | $156,782 | $180,020 |
| Gross Margin % | 50.56% | 48.72% | 48.69% |
| Expenses | |||
| Payroll | $28,200 | $52,200 | $60,200 |
| Marketing/Promotion | $10,600 | $12,000 | $15,000 |
| Depreciation | $15,060 | $15,060 | $15,060 |
| Utilities | $3,200 | $3,200 | $3,200 |
| Insurance | $2,400 | $2,400 | $2,400 |
| Payroll Taxes | $0 | $0 | $0 |
| Other | $900 | $900 | $900 |
| Total Operating Expenses | $60,360 | $85,760 | $96,760 |
| Profit Before Interest and Taxes | $78,933 | $71,022 | $83,260 |
| EBITDA | $93,993 | $86,082 | $98,320 |
| Interest Expense | $39,758 | $35,882 | $31,209 |
| Taxes Incurred | $11,753 | $10,542 | $15,615 |
| Net Profit | $27,423 | $24,598 | $36,436 |
| Net Profit/Sales | 9.95% | 7.64% | 9.85% |
8.5 Projected Cash Flow
The cash flow table and chart, below, shows our cash position during the first 6 months of the year until the summer tourist and fishing season starts, based on receiving the full amount of funding requested. The table also shows our planned repayment of the loan principal, on the terms outlined in the Start-up Funding table. May shows a near shortage of cash, but we believe that this is more due to our conservative forecasting than a real danger. The beginning of summer shows a decisive increase in cash, and is typical in a business such as this, where the total year’s earning are made in a season of about 5 months.
We have projected to end the year with enough cash to make it through the winter and spring of 2006 and to start the season in a good position. Based on this, we project our cash flows will increase steadily over the coming years, allowing us to improve our inventory, and increase our revenue-producing assets, such as cabins for lodging. We believe these cash flow projections are realistic, if not slightly conservative.

| Pro Forma Cash Flow | |||
| Year 1 | Year 2 | Year 3 | |
| Cash Received | |||
| Cash from Operations | |||
| Cash Sales | $275,525 | $321,788 | $369,723 |
| Subtotal Cash from Operations | $275,525 | $321,788 | $369,723 |
| Additional Cash Received | |||
| Sales Tax, VAT, HST/GST Received | $0 | $0 | $0 |
| New Current Borrowing | $0 | $0 | $0 |
| New Other Liabilities (interest-free) | $0 | $0 | $0 |
| New Long-term Liabilities | $0 | $0 | $0 |
| Sales of Other Current Assets | $0 | $0 | $0 |
| Sales of Long-term Assets | $0 | $0 | $0 |
| New Investment Received | $0 | $0 | $0 |
| Subtotal Cash Received | $275,525 | $321,788 | $369,723 |
| Expenditures | Year 1 | Year 2 | Year 3 |
| Expenditures from Operations | |||
| Cash Spending | $28,200 | $52,200 | $60,200 |
| Bill Payments | $205,669 | $214,251 | $241,745 |
| Subtotal Spent on Operations | $233,869 | $266,451 | $301,945 |
| Additional Cash Spent | |||
| Sales Tax, VAT, HST/GST Paid Out | $0 | $0 | $0 |
| Principal Repayment of Current Borrowing | $0 | $0 | $0 |
| Other Liabilities Principal Repayment | $0 | $0 | $0 |
| Long-term Liabilities Principal Repayment | $38,475 | $52,000 | $64,825 |
| Purchase Other Current Assets | $0 | $0 | $0 |
| Purchase Long-term Assets | $0 | $0 | $0 |
| Dividends | $0 | $0 | $0 |
| Subtotal Cash Spent | $272,344 | $318,451 | $366,770 |
| Net Cash Flow | $3,181 | $3,337 | $2,953 |
| Cash Balance | $18,181 | $21,518 | $24,471 |
8.6 Projected Balance Sheet
Our Balance Sheet shows that we have planned for and expect steady growth in the business. Notice that our net worth is growing year by year, and that even in the first year we can show a profit. We fully expect to be able to fulfill all debt obligations easily. We will continue to take a conservative approach in our expectations and reinvest any profit that is above and beyond our forecasts. By doing this, we will be able to not only expand our holdings and improve our position, but we will be able to attract more customers and clients, leading to more revenue and a continued cycle of growth.
| Pro Forma Balance Sheet | |||
| Year 1 | Year 2 | Year 3 | |
| Assets | |||
| Current Assets | |||
| Cash | $18,181 | $21,518 | $24,471 |
| Inventory | $101,829 | $107,994 | $114,342 |
| Other Current Assets | $6,400 | $6,400 | $6,400 |
| Total Current Assets | $126,410 | $135,912 | $145,213 |
| Long-term Assets | |||
| Long-term Assets | $452,400 | $452,400 | $452,400 |
| Accumulated Depreciation | $15,060 | $30,120 | $45,180 |
| Total Long-term Assets | $437,340 | $422,280 | $407,220 |
| Total Assets | $563,750 | $558,192 | $552,433 |
| Liabilities and Capital | Year 1 | Year 2 | Year 3 |
| Current Liabilities | |||
| Accounts Payable | $3,002 | $24,846 | $47,476 |
| Current Borrowing | $0 | $0 | $0 |
| Other Current Liabilities | $0 | $0 | $0 |
| Subtotal Current Liabilities | $3,002 | $24,846 | $47,476 |
| Long-term Liabilities | $474,525 | $422,525 | $357,700 |
| Total Liabilities | $477,527 | $447,371 | $405,176 |
| Paid-in Capital | $64,000 | $64,000 | $64,000 |
| Retained Earnings | ($5,200) | $22,223 | $46,821 |
| Earnings | $27,423 | $24,598 | $36,436 |
| Total Capital | $86,223 | $110,821 | $147,257 |
| Total Liabilities and Capital | $563,750 | $558,192 | $552,433 |
| Net Worth | $86,223 | $110,821 | $147,257 |
8.7 Business Ratios
The company’s projected business ratios are provided in the table below. The final column, Industry Profile, shows significant ratios for the Retail Fishing Equipment and Supplies Industry, with the Standard Industry Classification (SIC) Code of 5091.03.
Please note the comparisons with our Gross Margin ratios as ours are significantly higher than the industry standard, as is our Profit before Interest ratio. Our high gross margin comes of an intimate knowledge of the inventory needs of a fly shop in this town, based on our own expertise and the advise of the previous owner, and on our plan to increase sales with high-margin items like the cabins, and food and beverage options.
Our Debt to Assets ratio is showing higher than the industry standard, but we expect that to level out and then surpass the standard in 6-7 years.
| Ratio Analysis | ||||
| Year 1 | Year 2 | Year 3 | Industry Profile | |
| Sales Growth | 0.00% | 16.79% | 14.90% | 2.44% |
| Percent of Total Assets | ||||
| Inventory | 18.06% | 19.35% | 20.70% | 29.25% |
| Other Current Assets | 1.14% | 1.15% | 1.16% | 27.04% |
| Total Current Assets | 22.42% | 24.35% | 26.29% | 90.39% |
| Long-term Assets | 77.58% | 75.65% | 73.71% | 9.61% |
| Total Assets | 100.00% | 100.00% | 100.00% | 100.00% |
| Current Liabilities | 0.53% | 4.45% | 8.59% | 36.23% |
| Long-term Liabilities | 84.17% | 75.70% | 64.75% | 9.00% |
| Total Liabilities | 84.71% | 80.15% | 73.34% | 45.23% |
| Net Worth | 15.29% | 19.85% | 26.66% | 54.77% |
| Percent of Sales | ||||
| Sales | 100.00% | 100.00% | 100.00% | 100.00% |
| Gross Margin | 50.56% | 48.72% | 48.69% | 33.14% |
| Selling, General & Administrative Expenses | 40.60% | 41.08% | 38.84% | 19.58% |
| Advertising Expenses | 0.00% | 0.00% | 0.00% | 1.07% |
| Profit Before Interest and Taxes | 28.65% | 22.07% | 22.52% | 1.83% |
| Main Ratios | ||||
| Current | 42.11 | 5.47 | 3.06 | 2.11 |
| Quick | 8.19 | 1.12 | 0.65 | 1.14 |
| Total Debt to Total Assets | 84.71% | 80.15% | 73.34% | 52.38% |
| Pre-tax Return on Net Worth | 45.44% | 31.71% | 35.35% | 3.78% |
| Pre-tax Return on Assets | 6.95% | 6.30% | 9.42% | 7.95% |
| Additional Ratios | Year 1 | Year 2 | Year 3 | |
| Net Profit Margin | 9.95% | 7.64% | 9.85% | n.a |
| Return on Equity | 31.80% | 22.20% | 24.74% | n.a |
| Activity Ratios | ||||
| Inventory Turnover | 0.83 | 0.70 | 0.75 | n.a |
| Accounts Payable Turnover | 69.52 | 9.50 | 5.57 | n.a |
| Payment Days | 27 | 22 | 50 | n.a |
| Total Asset Turnover | 0.49 | 0.58 | 0.67 | n.a |
| Debt Ratios | ||||
| Debt to Net Worth | 5.54 | 4.04 | 2.75 | n.a |
| Current Liab. to Liab. | 0.01 | 0.06 | 0.12 | n.a |
| Liquidity Ratios | ||||
| Net Working Capital | $123,408 | $111,066 | $97,737 | n.a |
| Interest Coverage | 1.99 | 1.98 | 2.67 | n.a |
| Additional Ratios | ||||
| Assets to Sales | 2.05 | 1.73 | 1.49 | n.a |
| Current Debt/Total Assets | 1% | 4% | 9% | n.a |
| Acid Test | 8.19 | 1.12 | 0.65 | n.a |
| Sales/Net Worth | 3.20 | 2.90 | 2.51 | n.a |
| Dividend Payout | 0.00 | 0.00 | 0.00 | n.a |
Appendix
| Sales Forecast | |||||||||||||
| Month 1 | Month 2 | Month 3 | Month 4 | Month 5 | Month 6 | Month 7 | Month 8 | Month 9 | Month 10 | Month 11 | Month 12 | ||
| Sales | |||||||||||||
| Fishing Equipment | 0% | $1,730 | $1,730 | $2,730 | $4,000 | $2,730 | $7,166 | $16,000 | $16,000 | $16,000 | $8,000 | $2,730 | $4,000 |
| Guide Services | 0% | $0 | $0 | $1,000 | $4,500 | $0 | $3,740 | $7,480 | $8,460 | $7,480 | $4,740 | $0 | $0 |
| Drift Boat Rentals | 0% | $0 | $0 | $0 | $1,440 | $0 | $2,000 | $4,320 | $4,320 | $4,320 | $2,440 | $0 | $0 |
| Licenses | 0% | $0 | $0 | $0 | $5,400 | $0 | $200 | $5,400 | $5,400 | $5,400 | $5,000 | $0 | $0 |
| Lodging | 0% | $0 | $0 | $0 | $0 | $0 | $4,500 | $13,500 | $13,500 | $13,500 | $9,000 | $9,000 | $0 |
| Hunting Equipment | 0% | $0 | $0 | $0 | $0 | $0 | $0 | $0 | $0 | $250 | $500 | $600 | $0 |
| Hunting Apparel | 0% | $0 | $0 | $0 | $0 | $0 | $0 | $0 | $0 | $250 | $500 | $600 | $0 |
| Flies | 0% | $0 | $0 | $635 | $2,000 | $500 | $1,567 | $15,000 | $12,000 | $8,000 | $1,567 | $0 | $0 |
| Misc. | 0% | $0 | $0 | $0 | $0 | $0 | $400 | $600 | $600 | $600 | $300 | $200 | $0 |
| Total Sales | $1,730 | $1,730 | $4,365 | $17,340 | $3,230 | $19,573 | $62,300 | $60,280 | $55,800 | $32,047 | $13,130 | $4,000 | |
| Direct Cost of Sales | Month 1 | Month 2 | Month 3 | Month 4 | Month 5 | Month 6 | Month 7 | Month 8 | Month 9 | Month 10 | Month 11 | Month 12 | |
| Fishing Equipment | $952 | $952 | $1,501 | $2,200 | $1,501 | $3,941 | $8,800 | $8,800 | $8,800 | $4,400 | $1,501 | $2,200 | |
| Lodging | 1% | $0 | $0 | $0 | $0 | $0 | $23 | $68 | $68 | $68 | $45 | $45 | $0 |
| Hunting Equipment | $0 | $0 | $0 | $0 | $0 | $0 | $0 | $0 | $138 | $275 | $330 | $0 | |
| Hunting Apparel | $0 | $0 | $0 | $0 | $0 | $0 | $0 | $0 | $138 | $275 | $330 | $0 | |
| Flies | $0 | $0 | $273 | $860 | $215 | $673 | $6,450 | $5,160 | $3,440 | $672 | $0 | $0 | |
| Misc | $0 | $0 | $0 | $0 | $0 | $160 | $240 | $240 | $240 | $120 | $80 | $0 | |
| Subtotal Direct Cost of Sales | $952 | $952 | $1,774 | $3,060 | $1,716 | $4,797 | $15,558 | $14,268 | $12,824 | $5,787 | $2,286 | $2,200 | |
| Personnel Plan | |||||||||||||
| Month 1 | Month 2 | Month 3 | Month 4 | Month 5 | Month 6 | Month 7 | Month 8 | Month 9 | Month 10 | Month 11 | Month 12 | ||
| Owner Operator | 0% | $1,300 | $1,300 | $1,300 | $1,300 | $1,300 | $1,300 | $1,300 | $1,300 | $1,300 | $1,300 | $1,300 | $1,300 |
| Cabin Manager (Brassie) | 0% | $0 | $0 | $0 | $0 | $0 | $0 | $0 | $0 | $0 | $0 | $0 | $0 |
| Part Time Employee | 0% | $0 | $0 | $0 | $1,800 | $1,800 | $1,800 | $1,800 | $1,800 | $1,800 | $1,800 | $0 | $0 |
| Name or Title or Group | 0% | $0 | $0 | $0 | $0 | $0 | $0 | $0 | $0 | $0 | $0 | $0 | $0 |
| Total People | 2 | 2 | 2 | 3 | 3 | 3 | 3 | 3 | 3 | 3 | 2 | 3 | |
| Total Payroll | $1,300 | $1,300 | $1,300 | $3,100 | $3,100 | $3,100 | $3,100 | $3,100 | $3,100 | $3,100 | $1,300 | $1,300 | |
| Pro Forma Profit and Loss | |||||||||||||
| Month 1 | Month 2 | Month 3 | Month 4 | Month 5 | Month 6 | Month 7 | Month 8 | Month 9 | Month 10 | Month 11 | Month 12 | ||
| Sales | $1,730 | $1,730 | $4,365 | $17,340 | $3,230 | $19,573 | $62,300 | $60,280 | $55,800 | $32,047 | $13,130 | $4,000 | |
| Direct Cost of Sales | $952 | $952 | $1,774 | $3,060 | $1,716 | $4,797 | $15,558 | $14,268 | $12,824 | $5,787 | $2,286 | $2,200 | |
| Independant Guide Cost | 60% | $0 | $0 | $0 | $2,700 | $0 | $2,244 | $4,488 | $5,076 | $4,488 | $2,844 | $0 | $0 |
| License Funds going back to state | $0 | $0 | $0 | $5,400 | $0 | $0 | $5,400 | $5,400 | $5,400 | $5,000 | $0 | $0 | |
| Credit Card Fees | 1% | $9 | $9 | $23 | $92 | $17 | $104 | $330 | $319 | $296 | $170 | $70 | $21 |
| Lodging – cleaning and maintenance | 32% | $0 | $0 | $0 | $0 | $0 | $1,440 | $4,320 | $4,320 | $4,320 | $2,880 | $2,880 | $0 |
| Total Cost of Sales | $961 | $961 | $1,797 | $11,252 | $1,733 | $8,584 | $30,096 | $29,383 | $27,327 | $16,681 | $5,236 | $2,221 | |
| Gross Margin | $769 | $769 | $2,568 | $6,088 | $1,497 | $10,989 | $32,204 | $30,897 | $28,473 | $15,366 | $7,894 | $1,779 | |
| Gross Margin % | 44.47% | 44.44% | 58.83% | 35.11% | 46.34% | 56.14% | 51.69% | 51.26% | 51.03% | 47.95% | 60.12% | 44.47% | |
| Expenses | |||||||||||||
| Payroll | $1,300 | $1,300 | $1,300 | $3,100 | $3,100 | $3,100 | $3,100 | $3,100 | $3,100 | $3,100 | $1,300 | $1,300 | |
| Marketing/Promotion | $1,500 | $1,500 | $1,000 | $700 | $700 | $700 | $700 | $700 | $700 | $700 | $700 | $1,000 | |
| Depreciation | $1,255 | $1,255 | $1,255 | $1,255 | $1,255 | $1,255 | $1,255 | $1,255 | $1,255 | $1,255 | $1,255 | $1,255 | |
| Utilities | $300 | $300 | $300 | $300 | $275 | $275 | $200 | $200 | $200 | $250 | $300 | $300 | |
| Insurance | $200 | $200 | $200 | $200 | $200 | $200 | $200 | $200 | $200 | $200 | $200 | $200 | |
| Payroll Taxes | 15% | $0 | $0 | $0 | $0 | $0 | $0 | $0 | $0 | $0 | $0 | $0 | $0 |
| Other | $75 | $75 | $75 | $75 | $75 | $75 | $75 | $75 | $75 | $75 | $75 | $75 | |
| Total Operating Expenses | $4,630 | $4,630 | $4,130 | $5,630 | $5,605 | $5,605 | $5,530 | $5,530 | $5,530 | $5,580 | $3,830 | $4,130 | |
| Profit Before Interest and Taxes | ($3,861) | ($3,861) | ($1,562) | $458 | ($4,108) | $5,384 | $26,674 | $25,367 | $22,943 | $9,786 | $4,064 | ($2,351) | |
| EBITDA | ($2,606) | ($2,606) | ($307) | $1,713 | ($2,853) | $6,639 | $27,929 | $26,622 | $24,198 | $11,041 | $5,319 | ($1,096) | |
| Interest Expense | $3,420 | $3,420 | $3,420 | $3,392 | $3,363 | $3,335 | $3,306 | $3,278 | $3,249 | $3,221 | $3,192 | $3,164 | |
| Taxes Incurred | ($2,184) | ($2,184) | ($1,495) | ($880) | ($2,241) | $615 | $7,010 | $6,627 | $5,908 | $1,970 | $262 | ($1,654) | |
| Net Profit | ($5,096) | ($5,097) | ($3,487) | ($2,053) | ($5,230) | $1,434 | $16,358 | $15,463 | $13,786 | $4,596 | $611 | ($3,860) | |
| Net Profit/Sales | -294.59% | -294.61% | -79.90% | -11.84% | -161.91% | 7.33% | 26.26% | 25.65% | 24.71% | 14.34% | 4.65% | -96.51% | |
| Pro Forma Cash Flow | |||||||||||||
| Month 1 | Month 2 | Month 3 | Month 4 | Month 5 | Month 6 | Month 7 | Month 8 | Month 9 | Month 10 | Month 11 | Month 12 | ||
| Cash Received | |||||||||||||
| Cash from Operations | |||||||||||||
| Cash Sales | $1,730 | $1,730 | $4,365 | $17,340 | $3,230 | $19,573 | $62,300 | $60,280 | $55,800 | $32,047 | $13,130 | $4,000 | |
| Subtotal Cash from Operations | $1,730 | $1,730 | $4,365 | $17,340 | $3,230 | $19,573 | $62,300 | $60,280 | $55,800 | $32,047 | $13,130 | $4,000 | |
| Additional Cash Received | |||||||||||||
| Sales Tax, VAT, HST/GST Received | 0.00% | $0 | $0 | $0 | $0 | $0 | $0 | $0 | $0 | $0 | $0 | $0 | $0 |
| New Current Borrowing | $0 | $0 | $0 | $0 | $0 | $0 | $0 | $0 | $0 | $0 | $0 | $0 | |
| New Other Liabilities (interest-free) | $0 | $0 | $0 | $0 | $0 | $0 | $0 | $0 | $0 | $0 | $0 | $0 | |
| New Long-term Liabilities | $0 | $0 | $0 | $0 | $0 | $0 | $0 | $0 | $0 | $0 | $0 | $0 | |
| Sales of Other Current Assets | $0 | $0 | $0 | $0 | $0 | $0 | $0 | $0 | $0 | $0 | $0 | $0 | |
| Sales of Long-term Assets | $0 | $0 | $0 | $0 | $0 | $0 | $0 | $0 | $0 | $0 | $0 | $0 | |
| New Investment Received | $0 | $0 | $0 | $0 | $0 | $0 | $0 | $0 | $0 | $0 | $0 | $0 | |
| Subtotal Cash Received | $1,730 | $1,730 | $4,365 | $17,340 | $3,230 | $19,573 | $62,300 | $60,280 | $55,800 | $32,047 | $13,130 | $4,000 | |
| Expenditures | Month 1 | Month 2 | Month 3 | Month 4 | Month 5 | Month 6 | Month 7 | Month 8 | Month 9 | Month 10 | Month 11 | Month 12 | |
| Expenditures from Operations | |||||||||||||
| Cash Spending | $1,300 | $1,300 | $1,300 | $3,100 | $3,100 | $3,100 | $3,100 | $3,100 | $3,100 | $3,100 | $1,300 | $1,300 | |
| Bill Payments | $111 | $3,320 | $3,327 | $3,805 | $11,659 | $2,609 | $9,555 | $26,035 | $26,150 | $24,585 | $19,321 | $75,193 | |
| Subtotal Spent on Operations | $1,411 | $4,620 | $4,627 | $6,905 | $14,759 | $5,709 | $12,655 | $29,135 | $29,250 | $27,685 | $20,621 | $76,493 | |
| Additional Cash Spent | |||||||||||||
| Sales Tax, VAT, HST/GST Paid Out | $0 | $0 | $0 | $0 | $0 | $0 | $0 | $0 | $0 | $0 | $0 | $0 | |
| Principal Repayment of Current Borrowing | $0 | $0 | $0 | $0 | $0 | $0 | $0 | $0 | $0 | $0 | $0 | $0 | |
| Other Liabilities Principal Repayment | $0 | $0 | $0 | $0 | $0 | $0 | $0 | $0 | $0 | $0 | $0 | $0 | |
| Long-term Liabilities Principal Repayment | $0 | $0 | $0 | $4,275 | $4,275 | $4,275 | $4,275 | $4,275 | $4,275 | $4,275 | $4,275 | $4,275 | |
| Purchase Other Current Assets | $0 | $0 | $0 | $0 | $0 | $0 | $0 | $0 | $0 | $0 | $0 | $0 | |
| Purchase Long-term Assets | $0 | $0 | $0 | $0 | $0 | $0 | $0 | $0 | $0 | $0 | $0 | $0 | |
| Dividends | $0 | $0 | $0 | $0 | $0 | $0 | $0 | $0 | $0 | $0 | $0 | $0 | |
| Subtotal Cash Spent | $1,411 | $4,620 | $4,627 | $11,180 | $19,034 | $9,984 | $16,930 | $33,410 | $33,525 | $31,960 | $24,896 | $80,768 | |
| Net Cash Flow | $319 | ($2,890) | ($262) | $6,160 | ($15,804) | $9,589 | $45,370 | $26,870 | $22,275 | $87 | ($11,766) | ($76,768) | |
| Cash Balance | $15,319 | $12,429 | $12,168 | $18,327 | $2,524 | $12,113 | $57,483 | $84,353 | $106,628 | $106,715 | $94,949 | $18,181 | |
| Pro Forma Balance Sheet | |||||||||||||
| Month 1 | Month 2 | Month 3 | Month 4 | Month 5 | Month 6 | Month 7 | Month 8 | Month 9 | Month 10 | Month 11 | Month 12 | ||
| Assets | Starting Balances | ||||||||||||
| Current Assets | |||||||||||||
| Cash | $15,000 | $15,319 | $12,429 | $12,168 | $18,327 | $2,524 | $12,113 | $57,483 | $84,353 | $106,628 | $106,715 | $94,949 | $18,181 |
| Inventory | $98,000 | $97,049 | $96,097 | $94,323 | $91,263 | $89,547 | $84,750 | $69,193 | $54,925 | $42,102 | $36,315 | $104,029 | $101,829 |
| Other Current Assets | $6,400 | $6,400 | $6,400 | $6,400 | $6,400 | $6,400 | $6,400 | $6,400 | $6,400 | $6,400 | $6,400 | $6,400 | $6,400 |
| Total Current Assets | $119,400 | $118,768 | $114,926 | $112,890 | $115,990 | $98,470 | $103,263 | $133,075 | $145,678 | $155,130 | $149,430 | $205,377 | $126,410 |
| Long-term Assets | |||||||||||||
| Long-term Assets | $452,400 | $452,400 | $452,400 | $452,400 | $452,400 | $452,400 | $452,400 | $452,400 | $452,400 | $452,400 | $452,400 | $452,400 | $452,400 |
| Accumulated Depreciation | $0 | $1,255 | $2,510 | $3,765 | $5,020 | $6,275 | $7,530 | $8,785 | $10,040 | $11,295 | $12,550 | $13,805 | $15,060 |
| Total Long-term Assets | $452,400 | $451,145 | $449,890 | $448,635 | $447,380 | $446,125 | $444,870 | $443,615 | $442,360 | $441,105 | $439,850 | $438,595 | $437,340 |
| Total Assets | $571,800 | $569,913 | $564,816 | $561,525 | $563,370 | $544,595 | $548,133 | $576,690 | $588,038 | $596,235 | $589,280 | $643,972 | $563,750 |
| Liabilities and Capital | Month 1 | Month 2 | Month 3 | Month 4 | Month 5 | Month 6 | Month 7 | Month 8 | Month 9 | Month 10 | Month 11 | Month 12 | |
| Current Liabilities | |||||||||||||
| Accounts Payable | $0 | $3,209 | $3,209 | $3,406 | $11,579 | $2,309 | $8,687 | $25,162 | $25,322 | $24,008 | $16,732 | $75,089 | $3,002 |
| Current Borrowing | $0 | $0 | $0 | $0 | $0 | $0 | $0 | $0 | $0 | $0 | $0 | $0 | $0 |
| Other Current Liabilities | $0 | $0 | $0 | $0 | $0 | $0 | $0 | $0 | $0 | $0 | $0 | $0 | $0 |
| Subtotal Current Liabilities | $0 | $3,209 | $3,209 | $3,406 | $11,579 | $2,309 | $8,687 | $25,162 | $25,322 | $24,008 | $16,732 | $75,089 | $3,002 |
| Long-term Liabilities | $513,000 | $513,000 | $513,000 | $513,000 | $508,725 | $504,450 | $500,175 | $495,900 | $491,625 | $487,350 | $483,075 | $478,800 | $474,525 |
| Total Liabilities | $513,000 | $516,209 | $516,209 | $516,406 | $520,304 | $506,759 | $508,862 | $521,062 | $516,947 | $511,358 | $499,807 | $553,889 | $477,527 |
| Paid-in Capital | $64,000 | $64,000 | $64,000 | $64,000 | $64,000 | $64,000 | $64,000 | $64,000 | $64,000 | $64,000 | $64,000 | $64,000 | $64,000 |
| Retained Earnings | ($5,200) | ($5,200) | ($5,200) | ($5,200) | ($5,200) | ($5,200) | ($5,200) | ($5,200) | ($5,200) | ($5,200) | ($5,200) | ($5,200) | ($5,200) |
| Earnings | $0 | ($5,096) | ($10,193) | ($13,681) | ($15,734) | ($20,964) | ($19,529) | ($3,172) | $12,291 | $26,077 | $30,673 | $31,283 | $27,423 |
| Total Capital | $58,800 | $53,704 | $48,607 | $45,119 | $43,066 | $37,836 | $39,271 | $55,628 | $71,091 | $84,877 | $89,473 | $90,083 | $86,223 |
| Total Liabilities and Capital | $571,800 | $569,913 | $564,816 | $561,525 | $563,370 | $544,595 | $548,133 | $576,690 | $588,038 | $596,235 | $589,280 | $643,972 | $563,750 |
| Net Worth | $58,800 | $53,704 | $48,607 | $45,119 | $43,066 | $37,836 | $39,271 | $55,628 | $71,091 | $84,877 | $89,473 | $90,083 | $86,223 |


