
McKenzie Tackle and Bait Shop
Executive Summary
Located off Highway 126, next to the new Oakridge Plaza, McKenzie Tackle and Bait Shop will offer a convenient one-stop resource for all fishing products to travelers heading into the McKenzie National Parks System. Highway 126 is the gateway to over 130 public fishing locations and the Oakridge Plaza is the last commercial shopping and dining area before entering the McKenzie National Parks System. McKenzie Tackle and Bait Shop will capitalize on its location to pull in customers. It will offer a wide selection of fishing products as well as information on fishing conditions.
Brad West, owner of McKenzie Tackle and Bait Shop, has been an avid fisherman in the area for the past 25 years. He knows all the area’s best fishing locations and has managed two fishing tackle and bait shops in the past seven years.

1.1 Objectives
- To become a familiar and essential shopping destination for travelers heading out for a day of fishing.
- Build a customer base that will grow each year.
- Offer exceptional service and products to both the experienced and novice fishing enthusiast.
1.2 Keys to Success
The keys to success for McKenzie Tackle and Bait Shop are the following:
- Location: McKenzie Tackle and Bait Shop is located off Highway 126, next to the new Oakridge Plaza. Highway 126 is the gateway to over 130 public fishing locations in the McKenzie National Park System. Oakridge Plaza is the last commercial shopping and dining location before entering the McKenzie National Park System. Many travelers routinely stop in the plaza at the beginning and end of their day in the park system.
- Service: Brad West, owner of McKenzie Tackle and Bait Shop, knows that customers are not in his shop to browse. They need the right product or the best information on where to fish. McKenzie Tackle and Bait Shop will offer exceptional service and get the customers on their way so they can enjoy a day of fishing.
1.3 Mission
The mission of McKenzie Tackle and Bait Shop is to be the best, most visible, fishing product and information resource in the McKenzie National Parks area. We want travelers to plan stopping at our store as a important step in their day of fishing.
Company Summary
McKenzie Tackle and Bait Shop will offer a convenient one-stop resource for all fishing products to travelers heading into the McKenzie National Parks System. The shop will be open April to November.
2.1 Company Ownership
McKenzie Tackle and Bait Shop is a sole proprietorship owned by Brad West.
2.2 Start-up Summary
Estimated start-up costs and expenses are set forth below. The start-up costs are to be financed by Brad West’s personal investment.
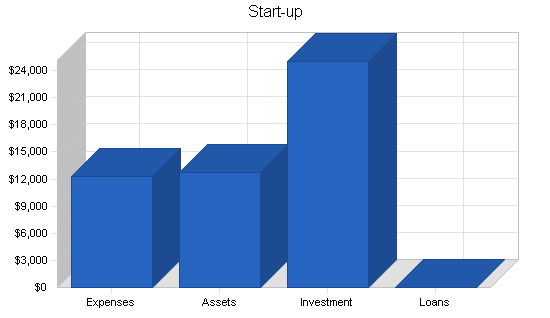
| Start-up Funding | |
| Start-up Expenses to Fund | $12,300 |
| Start-up Assets to Fund | $12,700 |
| Total Funding Required | $25,000 |
| Assets | |
| Non-cash Assets from Start-up | $0 |
| Cash Requirements from Start-up | $12,700 |
| Additional Cash Raised | $0 |
| Cash Balance on Starting Date | $12,700 |
| Total Assets | $12,700 |
| Liabilities and Capital | |
| Liabilities | |
| Current Borrowing | $0 |
| Long-term Liabilities | $0 |
| Accounts Payable (Outstanding Bills) | $0 |
| Other Current Liabilities (interest-free) | $0 |
| Total Liabilities | $0 |
| Capital | |
| Planned Investment | |
| Brad West | $25,000 |
| Other | $0 |
| Additional Investment Requirement | $0 |
| Total Planned Investment | $25,000 |
| Loss at Start-up (Start-up Expenses) | ($12,300) |
| Total Capital | $12,700 |
| Total Capital and Liabilities | $12,700 |
| Total Funding | $25,000 |
| Start-up | |
| Requirements | |
| Start-up Expenses | |
| Legal | $500 |
| Insurance | $0 |
| Rent | $800 |
| Inventory | $7,000 |
| Display Equipment | $2,000 |
| Store Sign | $2,000 |
| Other | $0 |
| Total Start-up Expenses | $12,300 |
| Start-up Assets | |
| Cash Required | $12,700 |
| Start-up Inventory | $0 |
| Other Current Assets | $0 |
| Long-term Assets | $0 |
| Total Assets | $12,700 |
| Total Requirements | $25,000 |
Products
Store products include:
- Fly rods and reels.
- Lines-leaders-tippets.
- Fishing gadgets-net/retractors.
- Fishing footgear.
- Raingear.
- Maps.
- Flies and fly tying materials.
- Gear bags.
- Tubes.
- Misc: drinks, snacks, souvenirs, etc.
Market Analysis Summary
The McKenzie National Park System is dotted with a number of small fishing tackle and bait shops on small roads around the park system. Most of them only serve a few fishing areas and have irregular operating hours. Highway 126 is the only main traffic artery into the park system and yet there are currently no other tackle and bait shop located on Highway 126. This is because the closest commercial center to the park system, Oakridge Plaza, is eight miles from the park’s entrance. Over 90% of the park visitors use Highway 126 to access the park system. Last year, the park system welcomed 100,000 fishing enthusiasts.
These enthusiasts were typically male between the ages of 20-45 years old. A fishing party of three to five is the norm for the area. Approximately 70% of these fishing enthusiasts visit the park system several times a year and develop strong customer relationships with the area’s businesses.
The McKenzie Tackle and Bait Shop will create a base of loyal customers with quality service and fishing information that customers will come to depend.
Strategy and Implementation Summary
Highway 126 is a four-lane highway running north to the park system and south to the town of Mapleton. The McKenzie Tackle and Bait Shop is located just off the northbound lanes and is next to the Oakridge Plaza. The shop will erect a large sign to grab customer attention to its location.
Once in the store, Brad West will provide the exceptional service that will build a loyal customer base.
5.1 Competitive Edge
McKenzie Tackle and Bait Shop’s competitive edge is two-fold:
- Location: McKenzie Tackle and Bait Shop is located off Highway 126, next to the new Oakridge Plaza. Highway 126 is the gateway to over 130 public fishing locations in the McKenzie National Park System. Many travelers routinely stop in the plaza at the beginning and the end of their day in the park system.
- Service: Brad West has the experience to provide exceptional service.
5.2 Sales Strategy
The key to customer satisfaction is a customer-friendly store that is easy to navigate and has knowledgeable people to help customers find what they want quickly.
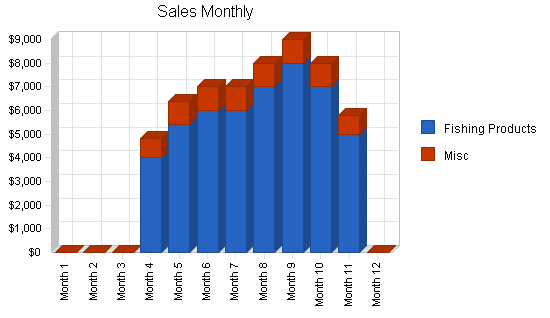
5.2.1 Sales Forecast
The following is the sales forecast for three years. The monthly estimates for the first year are included in the appendices.

| Sales Forecast | |||
| Year 1 | Year 2 | Year 3 | |
| Sales | |||
| Fishing Products | $48,400 | $60,000 | $70,000 |
| Misc | $7,600 | $8,000 | $9,000 |
| Total Sales | $56,000 | $68,000 | $79,000 |
| Direct Cost of Sales | Year 1 | Year 2 | Year 3 |
| Fishing Products | $7,000 | $9,000 | $10,000 |
| Misc | $1,500 | $1,750 | $2,000 |
| Subtotal Direct Cost of Sales | $8,500 | $10,750 | $12,000 |
Personnel Plan
Brad West will operate the shop without any additional staff.
| Personnel Plan | |||
| Year 1 | Year 2 | Year 3 | |
| Brad West | $24,000 | $28,000 | $35,000 |
| Other | $0 | $0 | $0 |
| Total People | 1 | 1 | 1 |
| Total Payroll | $24,000 | $28,000 | $35,000 |
Financial Plan
The following sections will outline the important financial assumptions, break-even analysis, profit and loss, cash flow, and the balance sheet.
7.1 Break-even Analysis
The break-even analysis indicates what is needed in monthly revenue to break even.

| Break-even Analysis | |
| Monthly Revenue Break-even | $4,595 |
| Assumptions: | |
| Average Percent Variable Cost | 15% |
| Estimated Monthly Fixed Cost | $3,898 |
7.2 Projected Profit and Loss
The following table and charts will highlight projected profit and loss. The appendices include first year monthly P & L estimates.


| Pro Forma Profit and Loss | |||
| Year 1 | Year 2 | Year 3 | |
| Sales | $56,000 | $68,000 | $79,000 |
| Direct Cost of Sales | $8,500 | $10,750 | $12,000 |
| Other Production Expenses | $0 | $0 | $0 |
| Total Cost of Sales | $8,500 | $10,750 | $12,000 |
| Gross Margin | $47,500 | $57,250 | $67,000 |
| Gross Margin % | 84.82% | 84.19% | 84.81% |
| Expenses | |||
| Payroll | $24,000 | $28,000 | $35,000 |
| Sales and Marketing and Other Expenses | $8,000 | $10,000 | $11,000 |
| Depreciation | $0 | $0 | $0 |
| Leased Equipment | $0 | $0 | $0 |
| Utilities | $1,470 | $1,800 | $1,800 |
| Insurance | $0 | $0 | $0 |
| Rent | $9,700 | $9,700 | $9,700 |
| Payroll Taxes | $3,600 | $4,200 | $5,250 |
| Other | $0 | $0 | $0 |
| Total Operating Expenses | $46,770 | $53,700 | $62,750 |
| Profit Before Interest and Taxes | $730 | $3,550 | $4,250 |
| EBITDA | $730 | $3,550 | $4,250 |
| Interest Expense | $0 | $0 | $0 |
| Taxes Incurred | $219 | $1,065 | $1,275 |
| Net Profit | $511 | $2,485 | $2,975 |
| Net Profit/Sales | 0.91% | 3.65% | 3.77% |
7.3 Projected Cash Flow
The following is the projected cash flow for three years. First year monthlies are in the appendix.


| Pro Forma Cash Flow | |||
| Year 1 | Year 2 | Year 3 | |
| Cash Received | |||
| Cash from Operations | |||
| Cash Sales | $56,000 | $68,000 | $79,000 |
| Subtotal Cash from Operations | $56,000 | $68,000 | $79,000 |
| Additional Cash Received | |||
| Sales Tax, VAT, HST/GST Received | $0 | $0 | $0 |
| New Current Borrowing | $0 | $0 | $0 |
| New Other Liabilities (interest-free) | $0 | $0 | $0 |
| New Long-term Liabilities | $0 | $0 | $0 |
| Sales of Other Current Assets | $0 | $0 | $0 |
| Sales of Long-term Assets | $0 | $0 | $0 |
| New Investment Received | $0 | $0 | $0 |
| Subtotal Cash Received | $56,000 | $68,000 | $79,000 |
| Expenditures | Year 1 | Year 2 | Year 3 |
| Expenditures from Operations | |||
| Cash Spending | $24,000 | $28,000 | $35,000 |
| Bill Payments | $32,132 | $35,243 | $40,920 |
| Subtotal Spent on Operations | $56,132 | $63,243 | $75,920 |
| Additional Cash Spent | |||
| Sales Tax, VAT, HST/GST Paid Out | $0 | $0 | $0 |
| Principal Repayment of Current Borrowing | $0 | $0 | $0 |
| Other Liabilities Principal Repayment | $0 | $0 | $0 |
| Long-term Liabilities Principal Repayment | $0 | $0 | $0 |
| Purchase Other Current Assets | $0 | $0 | $0 |
| Purchase Long-term Assets | $0 | $0 | $0 |
| Dividends | $0 | $0 | $0 |
| Subtotal Cash Spent | $56,132 | $63,243 | $75,920 |
| Net Cash Flow | ($132) | $4,757 | $3,080 |
| Cash Balance | $12,568 | $17,325 | $20,405 |
7.4 Projected Balance Sheet
The following is the projected balance sheet for three years. The first year monthly projections can be seen in the appendix.
| Pro Forma Balance Sheet | |||
| Year 1 | Year 2 | Year 3 | |
| Assets | |||
| Current Assets | |||
| Cash | $12,568 | $17,325 | $20,405 |
| Inventory | $1,170 | $1,480 | $1,652 |
| Other Current Assets | $0 | $0 | $0 |
| Total Current Assets | $13,738 | $18,805 | $22,057 |
| Long-term Assets | |||
| Long-term Assets | $0 | $0 | $0 |
| Accumulated Depreciation | $0 | $0 | $0 |
| Total Long-term Assets | $0 | $0 | $0 |
| Total Assets | $13,738 | $18,805 | $22,057 |
| Liabilities and Capital | Year 1 | Year 2 | Year 3 |
| Current Liabilities | |||
| Accounts Payable | $527 | $3,109 | $3,386 |
| Current Borrowing | $0 | $0 | $0 |
| Other Current Liabilities | $0 | $0 | $0 |
| Subtotal Current Liabilities | $527 | $3,109 | $3,386 |
| Long-term Liabilities | $0 | $0 | $0 |
| Total Liabilities | $527 | $3,109 | $3,386 |
| Paid-in Capital | $25,000 | $25,000 | $25,000 |
| Retained Earnings | ($12,300) | ($11,789) | ($9,304) |
| Earnings | $511 | $2,485 | $2,975 |
| Total Capital | $13,211 | $15,696 | $18,671 |
| Total Liabilities and Capital | $13,738 | $18,805 | $22,057 |
| Net Worth | $13,211 | $15,696 | $18,671 |
7.5 Business Ratios
Business ratios for the years of this plan are shown below. Industry profile ratios based on the Standard Industrial Classification (SIC) code 5091, Sporting & Recreational Goods, are shown for comparison.
| Ratio Analysis | ||||
| Year 1 | Year 2 | Year 3 | Industry Profile | |
| Sales Growth | 0.00% | 21.43% | 16.18% | 11.50% |
| Percent of Total Assets | ||||
| Inventory | 8.52% | 7.87% | 7.49% | 28.00% |
| Other Current Assets | 0.00% | 0.00% | 0.00% | 29.00% |
| Total Current Assets | 100.00% | 100.00% | 100.00% | 88.70% |
| Long-term Assets | 0.00% | 0.00% | 0.00% | 11.30% |
| Total Assets | 100.00% | 100.00% | 100.00% | 100.00% |
| Current Liabilities | 3.83% | 16.53% | 15.35% | 38.00% |
| Long-term Liabilities | 0.00% | 0.00% | 0.00% | 9.00% |
| Total Liabilities | 3.83% | 16.53% | 15.35% | 47.00% |
| Net Worth | 96.17% | 83.47% | 84.65% | 53.00% |
| Percent of Sales | ||||
| Sales | 100.00% | 100.00% | 100.00% | 100.00% |
| Gross Margin | 84.82% | 84.19% | 84.81% | 23.00% |
| Selling, General & Administrative Expenses | 83.91% | 80.54% | 81.04% | 14.80% |
| Advertising Expenses | 14.29% | 14.71% | 13.92% | 0.70% |
| Profit Before Interest and Taxes | 1.30% | 5.22% | 5.38% | 2.00% |
| Main Ratios | ||||
| Current | 26.08 | 6.05 | 6.51 | 2.19 |
| Quick | 23.86 | 5.57 | 6.03 | 1.22 |
| Total Debt to Total Assets | 3.83% | 16.53% | 15.35% | 47.00% |
| Pre-tax Return on Net Worth | 5.53% | 22.62% | 22.76% | 5.30% |
| Pre-tax Return on Assets | 5.31% | 18.88% | 19.27% | 10.10% |
| Additional Ratios | Year 1 | Year 2 | Year 3 | |
| Net Profit Margin | 0.91% | 3.65% | 3.77% | n.a |
| Return on Equity | 3.87% | 15.83% | 15.93% | n.a |
| Activity Ratios | ||||
| Inventory Turnover | 9.23 | 8.11 | 7.66 | n.a |
| Accounts Payable Turnover | 61.99 | 12.17 | 12.17 | n.a |
| Payment Days | 27 | 18 | 29 | n.a |
| Total Asset Turnover | 4.08 | 3.62 | 3.58 | n.a |
| Debt Ratios | ||||
| Debt to Net Worth | 0.04 | 0.20 | 0.18 | n.a |
| Current Liab. to Liab. | 1.00 | 1.00 | 1.00 | n.a |
| Liquidity Ratios | ||||
| Net Working Capital | $13,211 | $15,696 | $18,671 | n.a |
| Interest Coverage | 0.00 | 0.00 | 0.00 | n.a |
| Additional Ratios | ||||
| Assets to Sales | 0.25 | 0.28 | 0.28 | n.a |
| Current Debt/Total Assets | 4% | 17% | 15% | n.a |
| Acid Test | 23.86 | 5.57 | 6.03 | n.a |
| Sales/Net Worth | 4.24 | 4.33 | 4.23 | n.a |
| Dividend Payout | 0.00 | 0.00 | 0.00 | n.a |
Appendix
| Sales Forecast | |||||||||||||
| Month 1 | Month 2 | Month 3 | Month 4 | Month 5 | Month 6 | Month 7 | Month 8 | Month 9 | Month 10 | Month 11 | Month 12 | ||
| Sales | |||||||||||||
| Fishing Products | 0% | $0 | $0 | $0 | $4,000 | $5,400 | $6,000 | $6,000 | $7,000 | $8,000 | $7,000 | $5,000 | $0 |
| Misc | 0% | $0 | $0 | $0 | $800 | $1,000 | $1,000 | $1,000 | $1,000 | $1,000 | $1,000 | $800 | $0 |
| Total Sales | $0 | $0 | $0 | $4,800 | $6,400 | $7,000 | $7,000 | $8,000 | $9,000 | $8,000 | $5,800 | $0 | |
| Direct Cost of Sales | Month 1 | Month 2 | Month 3 | Month 4 | Month 5 | Month 6 | Month 7 | Month 8 | Month 9 | Month 10 | Month 11 | Month 12 | |
| Fishing Products | $0 | $0 | $0 | $700 | $800 | $800 | $900 | $1,000 | $800 | $1,000 | $600 | $400 | |
| Misc | $0 | $0 | $0 | $150 | $200 | $200 | $200 | $200 | $200 | $200 | $150 | $0 | |
| Subtotal Direct Cost of Sales | $0 | $0 | $0 | $850 | $1,000 | $1,000 | $1,100 | $1,200 | $1,000 | $1,200 | $750 | $400 | |
| Personnel Plan | |||||||||||||
| Month 1 | Month 2 | Month 3 | Month 4 | Month 5 | Month 6 | Month 7 | Month 8 | Month 9 | Month 10 | Month 11 | Month 12 | ||
| Brad West | 0% | $0 | $0 | $0 | $3,000 | $3,000 | $3,000 | $3,000 | $3,000 | $3,000 | $3,000 | $3,000 | $0 |
| Other | 0% | $0 | $0 | $0 | $0 | $0 | $0 | $0 | $0 | $0 | $0 | $0 | $0 |
| Total People | 0 | 0 | 0 | 1 | 1 | 1 | 1 | 1 | 1 | 1 | 1 | 1 | |
| Total Payroll | $0 | $0 | $0 | $3,000 | $3,000 | $3,000 | $3,000 | $3,000 | $3,000 | $3,000 | $3,000 | $0 | |
| General Assumptions | |||||||||||||
| Month 1 | Month 2 | Month 3 | Month 4 | Month 5 | Month 6 | Month 7 | Month 8 | Month 9 | Month 10 | Month 11 | Month 12 | ||
| Plan Month | 1 | 2 | 3 | 4 | 5 | 6 | 7 | 8 | 9 | 10 | 11 | 12 | |
| Current Interest Rate | 10.00% | 10.00% | 10.00% | 10.00% | 10.00% | 10.00% | 10.00% | 10.00% | 10.00% | 10.00% | 10.00% | 10.00% | |
| Long-term Interest Rate | 10.00% | 10.00% | 10.00% | 10.00% | 10.00% | 10.00% | 10.00% | 10.00% | 10.00% | 10.00% | 10.00% | 10.00% | |
| Tax Rate | 30.00% | 30.00% | 30.00% | 30.00% | 30.00% | 30.00% | 30.00% | 30.00% | 30.00% | 30.00% | 30.00% | 30.00% | |
| Other | 0 | 0 | 0 | 0 | 0 | 0 | 0 | 0 | 0 | 0 | 0 | 0 | |
| Pro Forma Profit and Loss | |||||||||||||
| Month 1 | Month 2 | Month 3 | Month 4 | Month 5 | Month 6 | Month 7 | Month 8 | Month 9 | Month 10 | Month 11 | Month 12 | ||
| Sales | $0 | $0 | $0 | $4,800 | $6,400 | $7,000 | $7,000 | $8,000 | $9,000 | $8,000 | $5,800 | $0 | |
| Direct Cost of Sales | $0 | $0 | $0 | $850 | $1,000 | $1,000 | $1,100 | $1,200 | $1,000 | $1,200 | $750 | $400 | |
| Other Production Expenses | $0 | $0 | $0 | $0 | $0 | $0 | $0 | $0 | $0 | $0 | $0 | $0 | |
| Total Cost of Sales | $0 | $0 | $0 | $850 | $1,000 | $1,000 | $1,100 | $1,200 | $1,000 | $1,200 | $750 | $400 | |
| Gross Margin | $0 | $0 | $0 | $3,950 | $5,400 | $6,000 | $5,900 | $6,800 | $8,000 | $6,800 | $5,050 | ($400) | |
| Gross Margin % | 0.00% | 0.00% | 0.00% | 82.29% | 84.38% | 85.71% | 84.29% | 85.00% | 88.89% | 85.00% | 87.07% | 0.00% | |
| Expenses | |||||||||||||
| Payroll | $0 | $0 | $0 | $3,000 | $3,000 | $3,000 | $3,000 | $3,000 | $3,000 | $3,000 | $3,000 | $0 | |
| Sales and Marketing and Other Expenses | $0 | $0 | $0 | $1,000 | $1,000 | $1,000 | $1,000 | $1,000 | $1,000 | $1,000 | $1,000 | $0 | |
| Depreciation | $0 | $0 | $0 | $0 | $0 | $0 | $0 | $0 | $0 | $0 | $0 | $0 | |
| Leased Equipment | $0 | $0 | $0 | $0 | $0 | $0 | $0 | $0 | $0 | $0 | $0 | $0 | |
| Utilities | $40 | $40 | $40 | $150 | $150 | $150 | $150 | $150 | $150 | $150 | $150 | $150 | |
| Insurance | $0 | $0 | $0 | $0 | $0 | $0 | $0 | $0 | $0 | $0 | $0 | $0 | |
| Rent | $900 | $800 | $800 | $800 | $800 | $800 | $800 | $800 | $800 | $800 | $800 | $800 | |
| Payroll Taxes | 15% | $0 | $0 | $0 | $450 | $450 | $450 | $450 | $450 | $450 | $450 | $450 | $0 |
| Other | $0 | $0 | $0 | $0 | $0 | $0 | $0 | $0 | $0 | $0 | $0 | $0 | |
| Total Operating Expenses | $940 | $840 | $840 | $5,400 | $5,400 | $5,400 | $5,400 | $5,400 | $5,400 | $5,400 | $5,400 | $950 | |
| Profit Before Interest and Taxes | ($940) | ($840) | ($840) | ($1,450) | $0 | $600 | $500 | $1,400 | $2,600 | $1,400 | ($350) | ($1,350) | |
| EBITDA | ($940) | ($840) | ($840) | ($1,450) | $0 | $600 | $500 | $1,400 | $2,600 | $1,400 | ($350) | ($1,350) | |
| Interest Expense | $0 | $0 | $0 | $0 | $0 | $0 | $0 | $0 | $0 | $0 | $0 | $0 | |
| Taxes Incurred | ($282) | ($252) | ($252) | ($435) | $0 | $180 | $150 | $420 | $780 | $420 | ($105) | ($405) | |
| Net Profit | ($658) | ($588) | ($588) | ($1,015) | $0 | $420 | $350 | $980 | $1,820 | $980 | ($245) | ($945) | |
| Net Profit/Sales | 0.00% | 0.00% | 0.00% | -21.15% | 0.00% | 6.00% | 5.00% | 12.25% | 20.22% | 12.25% | -4.22% | 0.00% | |
| Pro Forma Cash Flow | |||||||||||||
| Month 1 | Month 2 | Month 3 | Month 4 | Month 5 | Month 6 | Month 7 | Month 8 | Month 9 | Month 10 | Month 11 | Month 12 | ||
| Cash Received | |||||||||||||
| Cash from Operations | |||||||||||||
| Cash Sales | $0 | $0 | $0 | $4,800 | $6,400 | $7,000 | $7,000 | $8,000 | $9,000 | $8,000 | $5,800 | $0 | |
| Subtotal Cash from Operations | $0 | $0 | $0 | $4,800 | $6,400 | $7,000 | $7,000 | $8,000 | $9,000 | $8,000 | $5,800 | $0 | |
| Additional Cash Received | |||||||||||||
| Sales Tax, VAT, HST/GST Received | 0.00% | $0 | $0 | $0 | $0 | $0 | $0 | $0 | $0 | $0 | $0 | $0 | $0 |
| New Current Borrowing | $0 | $0 | $0 | $0 | $0 | $0 | $0 | $0 | $0 | $0 | $0 | $0 | |
| New Other Liabilities (interest-free) | $0 | $0 | $0 | $0 | $0 | $0 | $0 | $0 | $0 | $0 | $0 | $0 | |
| New Long-term Liabilities | $0 | $0 | $0 | $0 | $0 | $0 | $0 | $0 | $0 | $0 | $0 | $0 | |
| Sales of Other Current Assets | $0 | $0 | $0 | $0 | $0 | $0 | $0 | $0 | $0 | $0 | $0 | $0 | |
| Sales of Long-term Assets | $0 | $0 | $0 | $0 | $0 | $0 | $0 | $0 | $0 | $0 | $0 | $0 | |
| New Investment Received | $0 | $0 | $0 | $0 | $0 | $0 | $0 | $0 | $0 | $0 | $0 | $0 | |
| Subtotal Cash Received | $0 | $0 | $0 | $4,800 | $6,400 | $7,000 | $7,000 | $8,000 | $9,000 | $8,000 | $5,800 | $0 | |
| Expenditures | Month 1 | Month 2 | Month 3 | Month 4 | Month 5 | Month 6 | Month 7 | Month 8 | Month 9 | Month 10 | Month 11 | Month 12 | |
| Expenditures from Operations | |||||||||||||
| Cash Spending | $0 | $0 | $0 | $3,000 | $3,000 | $3,000 | $3,000 | $3,000 | $3,000 | $3,000 | $3,000 | $0 | |
| Bill Payments | $22 | $656 | $588 | $693 | $3,744 | $3,566 | $3,586 | $3,772 | $4,132 | $4,175 | $3,996 | $3,203 | |
| Subtotal Spent on Operations | $22 | $656 | $588 | $3,693 | $6,744 | $6,566 | $6,586 | $6,772 | $7,132 | $7,175 | $6,996 | $3,203 | |
| Additional Cash Spent | |||||||||||||
| Sales Tax, VAT, HST/GST Paid Out | $0 | $0 | $0 | $0 | $0 | $0 | $0 | $0 | $0 | $0 | $0 | $0 | |
| Principal Repayment of Current Borrowing | $0 | $0 | $0 | $0 | $0 | $0 | $0 | $0 | $0 | $0 | $0 | $0 | |
| Other Liabilities Principal Repayment | $0 | $0 | $0 | $0 | $0 | $0 | $0 | $0 | $0 | $0 | $0 | $0 | |
| Long-term Liabilities Principal Repayment | $0 | $0 | $0 | $0 | $0 | $0 | $0 | $0 | $0 | $0 | $0 | $0 | |
| Purchase Other Current Assets | $0 | $0 | $0 | $0 | $0 | $0 | $0 | $0 | $0 | $0 | $0 | $0 | |
| Purchase Long-term Assets | $0 | $0 | $0 | $0 | $0 | $0 | $0 | $0 | $0 | $0 | $0 | $0 | |
| Dividends | $0 | $0 | $0 | $0 | $0 | $0 | $0 | $0 | $0 | $0 | $0 | $0 | |
| Subtotal Cash Spent | $22 | $656 | $588 | $3,693 | $6,744 | $6,566 | $6,586 | $6,772 | $7,132 | $7,175 | $6,996 | $3,203 | |
| Net Cash Flow | ($22) | ($656) | ($588) | $1,107 | ($344) | $435 | $414 | $1,228 | $1,868 | $825 | ($1,196) | ($3,203) | |
| Cash Balance | $12,678 | $12,022 | $11,434 | $12,541 | $12,197 | $12,632 | $13,046 | $14,273 | $16,142 | $16,967 | $15,771 | $12,568 | |
| Pro Forma Balance Sheet | |||||||||||||
| Month 1 | Month 2 | Month 3 | Month 4 | Month 5 | Month 6 | Month 7 | Month 8 | Month 9 | Month 10 | Month 11 | Month 12 | ||
| Assets | Starting Balances | ||||||||||||
| Current Assets | |||||||||||||
| Cash | $12,700 | $12,678 | $12,022 | $11,434 | $12,541 | $12,197 | $12,632 | $13,046 | $14,273 | $16,142 | $16,967 | $15,771 | $12,568 |
| Inventory | $0 | $0 | $0 | $0 | $935 | $1,100 | $1,100 | $1,210 | $1,320 | $1,320 | $1,320 | $1,570 | $1,170 |
| Other Current Assets | $0 | $0 | $0 | $0 | $0 | $0 | $0 | $0 | $0 | $0 | $0 | $0 | $0 |
| Total Current Assets | $12,700 | $12,678 | $12,022 | $11,434 | $13,476 | $13,297 | $13,732 | $14,256 | $15,593 | $17,462 | $18,287 | $17,341 | $13,738 |
| Long-term Assets | |||||||||||||
| Long-term Assets | $0 | $0 | $0 | $0 | $0 | $0 | $0 | $0 | $0 | $0 | $0 | $0 | $0 |
| Accumulated Depreciation | $0 | $0 | $0 | $0 | $0 | $0 | $0 | $0 | $0 | $0 | $0 | $0 | $0 |
| Total Long-term Assets | $0 | $0 | $0 | $0 | $0 | $0 | $0 | $0 | $0 | $0 | $0 | $0 | $0 |
| Total Assets | $12,700 | $12,678 | $12,022 | $11,434 | $13,476 | $13,297 | $13,732 | $14,256 | $15,593 | $17,462 | $18,287 | $17,341 | $13,738 |
| Liabilities and Capital | Month 1 | Month 2 | Month 3 | Month 4 | Month 5 | Month 6 | Month 7 | Month 8 | Month 9 | Month 10 | Month 11 | Month 12 | |
| Current Liabilities | |||||||||||||
| Accounts Payable | $0 | $636 | $568 | $568 | $3,625 | $3,446 | $3,461 | $3,635 | $3,992 | $4,041 | $3,886 | $3,185 | $527 |
| Current Borrowing | $0 | $0 | $0 | $0 | $0 | $0 | $0 | $0 | $0 | $0 | $0 | $0 | $0 |
| Other Current Liabilities | $0 | $0 | $0 | $0 | $0 | $0 | $0 | $0 | $0 | $0 | $0 | $0 | $0 |
| Subtotal Current Liabilities | $0 | $636 | $568 | $568 | $3,625 | $3,446 | $3,461 | $3,635 | $3,992 | $4,041 | $3,886 | $3,185 | $527 |
| Long-term Liabilities | $0 | $0 | $0 | $0 | $0 | $0 | $0 | $0 | $0 | $0 | $0 | $0 | $0 |
| Total Liabilities | $0 | $636 | $568 | $568 | $3,625 | $3,446 | $3,461 | $3,635 | $3,992 | $4,041 | $3,886 | $3,185 | $527 |
| Paid-in Capital | $25,000 | $25,000 | $25,000 | $25,000 | $25,000 | $25,000 | $25,000 | $25,000 | $25,000 | $25,000 | $25,000 | $25,000 | $25,000 |
| Retained Earnings | ($12,300) | ($12,300) | ($12,300) | ($12,300) | ($12,300) | ($12,300) | ($12,300) | ($12,300) | ($12,300) | ($12,300) | ($12,300) | ($12,300) | ($12,300) |
| Earnings | $0 | ($658) | ($1,246) | ($1,834) | ($2,849) | ($2,849) | ($2,429) | ($2,079) | ($1,099) | $721 | $1,701 | $1,456 | $511 |
| Total Capital | $12,700 | $12,042 | $11,454 | $10,866 | $9,851 | $9,851 | $10,271 | $10,621 | $11,601 | $13,421 | $14,401 | $14,156 | $13,211 |
| Total Liabilities and Capital | $12,700 | $12,678 | $12,022 | $11,434 | $13,476 | $13,297 | $13,732 | $14,256 | $15,593 | $17,462 | $18,287 | $17,341 | $13,738 |
| Net Worth | $12,700 | $12,042 | $11,454 | $10,866 | $9,851 | $9,851 | $10,271 | $10,621 | $11,601 | $13,421 | $14,401 | $14,156 | $13,211 |

