
Seacliff Products
Executive Summary
Seacliff Products (Seacliff) is an innovative company that has developed a patented fishing hook. Seacliff has initially developed a do-it-yourself-kit for sale while they find a suitable business partner to license the product to. Seacliff has forecasted hefty sales for year one and a tidy increase for year two.
Seacliff has developed the Supreme hook, an innovative, live bait holder. Tests have indicated that there are appreciable increases in fish hook up. Having increased fish hookups allows the user to have greater enjoyment while fishing.
The Business Model
Seacliff will be utilizing a laser-focused business model that allows them to focus on their core competencies while outsourcing the activities that do not add significant value. Seacliff is a design company, therefore they will concentrate on the design of useful products. They will find a strategic partner who can take over production, marketing, and distribution activities. The outsourcing of non-essential activities will allow Seacliff to realize significant profits without the liabilities of marketing, manufacturing, and distribution. Licensing allows a company the right to produce the Supreme hook while Seacliff will realize a steady stream of revenue without the capital costs normally associated with selling a product. Seacliff enjoys nice profits and the product is supported by a professional marketing department and an established distribution and production system. Seacliff is currently looking for a strategic partner and expects to enter into negotiations in the near future.
The Market
The fishing market for the Supreme hook is quite large. The overall market is valued at $300 million. There are over 39.1 million anglers in the U.S.A. who have fished over 618 million days while taking 807 million trips. What is even more exciting is the growth rate of this industry. Between 1955-1996 the number of anglers has increased at over twice the rate of the U.S. population.
Management
The whole foundation of the business model is to concentrate at what you are good at. Seacliff has taken this premise to heart by focusing on design. The owner’s (name omitted) education is a JD/MBA from Willamette University. This dual degree provided him with valuable insight into business development as well as the attractive legal tool of licenses and patents. Following graduate school, he was unsure of what direction his career should take him so headed off to Oregon to be a fly fishing guide. During this 2 year stint, he became enthralled with fishing and thought that he wanted to remain in the industry. He went back to school and got a Masters in Engineering on the premise that he could pursue the design and development aspect of fishing related products. It was near the end of his last graduate degree that he developed the Supreme hook. Based on his previous degrees (JD/MBA) he felt comfortable to form his own company and find a manufacturer to license his soon to be patented product.
Seacliff is an exciting company that shuns the typical need for extensive start-up capital for production by licensing a patented product. By licensing the product it frees up Seacliff’s time to concentrate on value added activities such as future designs. Profitability will be reached by month one.

1.1 Mission
The mission of Seacliff is to maximize the profit potential of its newly patented fish hook invention (the Supreme) via licensing and other means, and to further develop other innovative products suitable for the fishing gear market.
1.2 Keys to Success
The keys to success in maximizing profits in licensing this patent are:
- To separate the manufacturing of the Supreme from its marketing.
- Search out a manufacturer capable of producing the hook and give them exclusivity.
- Locate a suitable marketing company with substantial fishing gear expertise who recognizes the potential of the Supreme and is willing to commit the necessary marketing budget.
- Structure a reasonable, well-thought-out, exclusive licensing agreement that will insure a mutually-profitable partnership arrangement between marketer and Seacliff.
The keys to success in profiting from the patent in make-it-yourself kit form are:
- Recognize that there is a narrower market for the kit.
- Follow the time-tested price structure formula which provides attractive margins to everyone in the distribution chain (manufacturer’s representative, wholesaler, and retailer).
- Reach the narrow market niche through free publicity in fishing magazines and catalogs, website, trade shows, etc.
- Keep overhead low and stay alive until word-of-mouth begins to generate clients.
1.3 Objectives
The main objectives are:
- Locate a suitable manufacturer who is willing, on an exclusive basis, to produce the patented Supreme hook at a reasonable price. This would, at the retail level, cause the Supreme to sell for under 150% of a normal hook of similar size.
- Locate a medium-sized fishing gear marketing company who recognizes the potential of the patent and is willing to commit the resources to successfully mass-merchandise the Supreme, both domestically and overseas. Enter into an exclusive license arrangement that contains the normal safeguards and will allow for a three percent royalty on all purchases from the exclusive manufacturer.
- Successfully bring the product in kit form to market. Reach break even point (370 kits) within the first three months. Sell 8,333 kits in the first year.
- Complete the website design.
- Join the American Sportfishing Association (ASA); secure a booth for the ASA trade show in Los Vegas this coming July.
Company Summary
Seacliff is a start-up, limited-liability corporation, incorporated in the State of Oregon.
2.1 Company Ownership
The company is 80% owned by the founder and inventor of the Supreme, with the remaining shares owned by six individual investors.
2.2 Start-up Summary
To complete the necessary start-up funds, external financing must be obtained. The start-up table is itemized below.
Start-up Expenses: Various expenses, such as legal, travel, salaries, and design costs for the start of the plan.
Start-up Inventory: Prior to any sales, which are projected to begin in January, cash is needed to purchase materials included in the kit.
Long-term Assets: In addition to minor office equipment the major Long-term asset represents the purchase price of Patent Number 6,038,806.
Start-Up Funding: The inventor/founder has invested heavily in the company. Additional money has been invested by six individual investors. A further sum has been invested in a barter agreement in exchange for essential peg and graphic illustration work (see Design Preproduction Expenses). Between mid-October and the end of December, a final sum is expected to be raised from sale of stock to individual investors.

| Start-up | |
| Requirements | |
| Start-up Expenses | |
| Legal | $6,000 |
| Printing/Reproduction | $3,000 |
| Salaries | $7,000 |
| Prototype | $7,500 |
| Utilities | $2,000 |
| Graphic Design | $29,500 |
| Misc expenses, Travel, Enter. | $7,900 |
| Tooling | $20,350 |
| Other | $0 |
| Total Start-up Expenses | $83,250 |
| Start-up Assets | |
| Cash Required | $20,000 |
| Start-up Inventory | $58,530 |
| Other Current Assets | $0 |
| Long-term Assets | $483,425 |
| Total Assets | $561,955 |
| Total Requirements | $645,205 |
| Start-up Funding | |
| Start-up Expenses to Fund | $83,250 |
| Start-up Assets to Fund | $561,955 |
| Total Funding Required | $645,205 |
| Assets | |
| Non-cash Assets from Start-up | $541,955 |
| Cash Requirements from Start-up | $20,000 |
| Additional Cash Raised | $0 |
| Cash Balance on Starting Date | $20,000 |
| Total Assets | $561,955 |
| Liabilities and Capital | |
| Liabilities | |
| Current Borrowing | $0 |
| Long-term Liabilities | $100,000 |
| Accounts Payable (Outstanding Bills) | $0 |
| Other Current Liabilities (interest-free) | $0 |
| Total Liabilities | $100,000 |
| Capital | |
| Planned Investment | |
| Founder/President | $482,000 |
| Individual Investors (6) | $26,000 |
| Design & Consultant Barter Stock | $27,000 |
| Other | $10,205 |
| Additional Investment Requirement | $0 |
| Total Planned Investment | $545,205 |
| Loss at Start-up (Start-up Expenses) | ($83,250) |
| Total Capital | $461,955 |
| Total Capital and Liabilities | $561,955 |
| Total Funding | $645,205 |

2.3 Company Locations and Facilities
The company is located in Florence, Oregon, where there is adequate storage and office space available.
Products
There are two marketable products stemming from the same patent. One will result in royalties when the patent is licensed to the right fishing gear marketing company. The other is a kit which makes it possible for a certain narrow segment of fishing enthusiasts to make up the Supreme before it is actually ready for mass distribution.
3.1 Product Description
The Supreme is a standard hook combined with a specially-designed bait holder that eliminates the drawbacks of the conventional methods of attaching live bait. Initial, non-laboratory testing of the Supreme has shown an increased enjoyment of the sport. This is as a result of greater attraction of fish to the live bait swim action and increased hook-ups because of the full-hook exposure. The invention also has wider application in use with shrimp or crab bait, as well as with dead bait trolling.
Benefits of the Invention
- Increased hook-ups by permitting full-hook exposure in a more disguised manner.
- Faster rigging of bait fish so as not to keep the bait fish out of the water for long periods of time.
- The barb attaches to the bait fish under the scales and skin, rather than vital parts of the fish, prolonging the life of the bait fish, and allowing the bait fish to swim naturally.
- Keeping the bait fish on the hook is less of a problem because of the holding barb.
- Due to the location of the hook on the bait fish, chances of a hook-up with the target fish are greater.
- Several body locations of the bait fish can be used in mounting the patented hook.
- Excellent application in either freshwater or saltwater fishing with live shrimp or crab where the barb is easily inserted under the carapace.
- Fun and easy to use.
Do-it-yourself Kits:
As mentioned earlier, before the invention can be manufactured and brought to market, the Supreme can be marketed in kit form. This kit contains barbs, which are an essential element of the hook. They are crimped onto most any commercial hook and fixed with epoxy. All the apparatus for doing this is contained in the kit, including the necessary crimping tool. Additional barbs can be purchased at minimal cost, making the kit attractive to a narrow segment of enthusiastic fisherman.
Prototypes for the kit are ready to be shown to wholesalers and retailers. As of this writing, an initial order of 250 kits has already been received. However, kits will not be ready for sale until January 2001.
3.2 Competitive Comparison
This product is unique. A normal competitive comparison analysis cannot be offered. However, do-it-yourself kits are not unknown in the industry. Section 5.2.2, Pricing Strategy, lists several of these kits and their prices.
3.3 Sales Literature
Excellent graphics have been prepared to demonstrate the features of the hook. These need to be incorporated into a brochure that will double as a mailer. We will add contact information, including phone and fax numbers, and our website address. This project is currently under way.
3.4 Sourcing
Sourcing of the raw materials to produce the kits is not difficult as there is more than one supplier of each essential part of the kit. Some suppliers are located further from Oregon than is wished, but as sales of the kits increase, opportunities to obtain suppliers closer to home are expected.
3.5 Future Products
Future products are already on the drawing board at Seacliff, including:
- Rod and Reel action holder, which provides additional leverage and mobility.
- Non-toxic dead-bait trolling stabilizer.
- Adapter rod holder for bait jiggers.
Market Analysis Summary
The market for the patented hook, trade-named the Supreme, is large and has wide appeal. Over $300 million (retail level) in fish hooks alone are purchased each year in the United States. The patented Supreme, by virtue of its unique look and user-friendly features, has immense potential in the hands of astute marketers of fishing gear. One of the most powerful marketing tools is a unique selling proposition (USP). A good example is the “Flo-Thru” teabag USP developed by Lipton, or Heinz’ “Slowest Catsup in the West.” Any time that a marketer has a product which is visually different and has user-friendly, unique features, dramatic success can be achieved in capturing market share. In the same way that Lipton’s “Flo-Thru” USP catapulted Lipton to brand leader over Salada Tea, the Supreme could conceivably capture 10% of the hook market. This would translate into royalties for the patent holder of approximately $200,000 to $300,000 annually.
The do-it-yourself kit selling retail for $129.95 has a much narrower market appeal to primarily saltwater fisherman who are especially enthusiastic about catching a category of approximately 20 popular game fish. Nearly five million fishermen hunt these fish. Sales of 25,000 kits over the three year period of this plan is a reasonable estimate, and amounts to only one half of one percent of the number of big-game fishermen. Gross sales of kits could total $1.25 million, assuming manufacturer’s net price of $50 to distributors.
Some statistics drawn from the 1996 Fish and Wildlife Survey are recorded in the table below.
| Population | Days Fished | Trips | Money Spent | |
| Saltwater Fishermen | 9.4 million | 103 million | 87 million | $8.1 million |
| Freshwater Fishermen | 29.7 million | 515 million | 420 million | $24.5 million |
4.1 Market Segmentation
The full potential of the Supreme patented hook can only be reached by licensing it to an established fishing gear company with a professional marketing department and extensive distribution system. This full potential would take into consideration freshwater fishermen (the highest concentration of anglers), and saltwater fishermen. Until a license agreement has been reached with a marketing company, the prime focus must be on sales of the do-it-yourself kits. Because of Seacliff’s saltwater contacts, and the need to limit the initial size of barbs provided in the kits (four large-sized barbs), the market segmentation analysis will be concentrated on that portion of the 9.4 million saltwater fishermen who go after the 20 species of large game fish.
According to the 1996 National Survey of Fishing, Hunting, and Wildlife-Associated Recreation (see complete survey http://fa.r9.fws.gov/surveys/surveys.html), there are 35.2 million Americans, 16 years of age or over, who fish annually. Most of these are freshwater fishermen; only 9.4 million are saltwater fishermen. Between 1955-1996, the number of anglers increased at over twice the rate of the U.S. population growth. These saltwater fishermen spent over $8.1 billion, of which $1.1 billion was spent on fishing gear. Each fisherman fished an average of 11 days over nine trips, spending $492 per trip ($45/day). The ideal candidate to purchase one of the Seacliff kits is a passionate, enthusiastic fisherman who is very serious about the sport. He is likely to have a boat, alone or shared with others. He is likely to read magazines dedicated to the sport, like Saltwater Sportsman (circulation 150,000), Florida Sportsman (circulation 111,000), Marlin (circulation 40,000), Sport Fishing Magazine (150,000), etc. These fishermen go for the big fish and are willing to go out of their way to get to where those fish are. These anglers are 73% male. The densest age groups are 35-44 (27%), 25-34 (20%), 45-54 (20%), and 55-64 (10%). Income-wise, 64% of anglers earn more than $50,000 a year. Seacliff kits are ideally suited for saltwater anglers earning more than $50,000 per year who fish for Bass, Bluefish, and any one of the 20 species pictured and described in Appendix D. The 1996 survey gives exact statistics on the number of saltwater fishermen who search out these fish.
The chart and table below indicate the number of fishermen, engaged by fish type. Saltwater anglers have increased by six percent between 1991-1996. During the same period, freshwater fishing declined by four percent. For purposes of entering a growth percentage, we will assume that the number of saltwater fishermen will increase by about one percent annually.
**appendix were not available for this sample plan.

| Market Analysis | |||||||
| Year 1 | Year 2 | Year 3 | Year 4 | Year 5 | |||
| Potential Customers | Growth | CAGR | |||||
| Flounder (or other flat fish) | 1% | 2,626 | 2,652 | 2,679 | 2,706 | 2,733 | 1.00% |
| Mackerel | 1% | 683 | 690 | 697 | 704 | 711 | 1.01% |
| Salmon/Trout | 1% | 1,877 | 1,896 | 1,915 | 1,934 | 1,953 | 1.00% |
| Striped Bass | 1% | 1,443 | 1,457 | 1,472 | 1,487 | 1,502 | 1.01% |
| Bluefish | 1% | 1,499 | 1,514 | 1,529 | 1,544 | 1,559 | 0.99% |
| Other Large Game Fish | 1% | 4,928 | 4,977 | 5,027 | 5,077 | 5,128 | 1.00% |
| Total | 1.00% | 13,056 | 13,186 | 13,319 | 13,452 | 13,586 | 1.00% |
4.2 Target Market Segment Strategy
The target market strategy for the sale of the kits is to focus on the large, saltwater game fish anglers (Striped bass 1.4 million, bluefish 1.5 million, 18 others 4.9 million). Of the total 9.4 million saltwater fishermen, 7,180 are located in only eight coastal states (see following table).
|
State |
Number of Anglers |
| Florida |
2,255,000 |
| California |
1,049,000 |
| Maryland |
429,000 |
| New Jersey |
841,000 |
| Oregon |
429,000 |
| New York |
476,000 |
| North Carolina |
770,000 |
| Texas |
862,000 |
4.2.1 Market Trends
Fishing is definitely growing in popularity. According to the 1996 Wildlife survey, the number of anglers has been increasing at over twice the rate of U.S. population growth (1955-1996). More than one out of every six Americans goes fishing every year. A total of $38 billion, according to the study, is being spent annually on fishing. Of this amount, 51% ($19.2 billion) is being spent on fishing equipment, and 28% ($5.3 billion) is being spent annually on fishing tackle (includes both freshwater and saltwater fishing tackle).
4.2.2 Market Growth
The 1996 survey, which is the source of most statistics on the fishing industry, reports that the number of saltwater fishermen increased six percent between 1991-1996. During the same period, freshwater fishermen declined four percent. However, expenditures on the sport increased at a much greater rate. Fishing expenditures increased 37%, and the number of days spent fishing increased 22% when compared with the 1991 survey.
4.2.3 Market Needs
Convenience, speed, improved performance, enjoyment are all aspects of the patented Supreme hook, which apply both in speaking about the hook to be licensed as well as to the do-it-yourself kit. See Chapter 3.1 (Product Description) for details of the benefits as well as graphic illustrations.
**No graphic illustrations were available for this sample plan.
4.3 Industry Analysis
The fishing gear industry used to be characterized by many small manufacturers. This was especially true of fishing lures, which were often made by individuals who started up in the industry working out of their garages. This situation has changed dramatically. According to an article in the New York Times (October 24, 1999), entitled “Fishing Gear Makers Are Now a Prize Catch,” like toy and hardware makers before them, small manufacturers of fishing gear are being acquired by aggressive competitors looking to build economies of scale. The labor-of-love specialty companies are quickly being bought up. Andy Rogerson, chief executive of Pradco Inc., which now owns eleven popular brands of fishing lures (mostly acquired in the last five years), claims the small guy can’t make it any longer. The big-box sports chains and major marts are driving distribution. These mass market retailers, as well as a small number of equally demanding cataloguers, sell 75% of fishing tackle.
There has been so much consolidation in the industry, it is hard to keep track of who belongs to whom, according to Lauren Walsh, managing editor of Fishing Tackle Retailer. Membership in the industry’s trade organization, the ASA, has declined from 600 members in 1995 to 450 members at present. This decline has been solely due to acquisition, as the number of products has remained level or even increased. Modernization has also hit the fishing gear industry as it has other industries. Large companies, like Pure Fishing, have invested millions in computerized inventory systems and warehouses; they are also tapping the previously-ignored international market.
4.3.1 Distribution Patterns
According to SBG’s exclusive fishing tackle survey conducted in 1992, 69% of tackle is bought through wholesalers, 27% direct from manufacturers, and four percent from other sources. In the eight years since the survey was completed, it is likely that mass merchants and dedicated cataloguers have been taking a greater share of the pie. This would mean that there has been more direct buying from manufacturers.
With cataloguers and mass merchants capturing 75% of sales of fishing gear, it is clear that the small manufacturer is at a disadvantage in respect to large suppliers. Wal-Mart, and other large, multi-line chains, will only purchase from suppliers who can offer a large menu. The trend is for these retailers to purchase directly from manufacturers at the wholesale price, since they do their own distribution. The mass merchants can then afford to discount the item 10-20% and still make a healthy return on investment.
4.3.2 Main Competitors
As mentioned in earlier chapters, there are easily 250 manufacturers of fishing tackle. Many of these are makers of lures and artificial bait. The Supreme primarily competes with the old, standard method of hooking bait, either live or dead, to a standard fish hook. The advantages of the Supreme over this old method are more easily understood by turning to section 3.1, which includes graphic displays comparing the Supreme stem hook system to the traditional methods. There exists no other product on the market that competes with, or provides the features of, the Supreme.
**All graphic illustrations have been removed from this sample plan.
4.3.3 Industry Participants
According to the membership rolls of the ASA, there are 450 companies that are somehow involved in some aspect of fishing. Many of these are boat manufacturers, and other manufacturers outside of the narrower field of fishing gear. Large retailers are also members.
Industry Participants – Retail
As of 1992 there were 20,696 retail outlets in the United States, of which 31% were fishing specialists, 47% were multiline, 12.2% were classed as department or mass merchants, and nine percent other retail. Mail lists are available from Database America (201-476-2300).
Industry Participants – Wholesale
Information on U.S. wholesalers such as names, addresses, phone numbers, gross sales, number of employees, and major product lines handled, is available from the Wholesalers and Distributors Directory, which is available at libraries. Chapter 46 lists Recreational and Sporting Goods Wholesalers. Pages 987-1010 list 50 wholesalers who specifically mention the word “fishing tackle.”
Industry Participants – Manufacturers
Ward’s Business Directory of U.S. Private and Public Companies, under NAIC code 339920 (Sporting and Athletic Goods Manufacturing) lists 75 names, beginning with Brunswick Corporation of Lake Forest, Illinois, with $4 billion in sales (Brunswick’s Zebco Corporation is a division specializing in fishing gear), and ending with Easton Sports of Van Nuys, California, with $40 million in sales. Much more up-to-date information can be obtained via ASA’s website:www.asafishing.org/membership/locator/index.cfm. Another excellent source is the Fishing Tackle Source Directory which lists at least 250 fishing tackle manufacturers under the saltwater category alone.
Strategy and Implementation Summary
Initially, by virtue of the total uniqueness of the Supreme, the reliance will be on publicity in magazines like Saltwater Sportsman, and other dedicated fishing publications, coupled with distribution through wholesalers to fishing tackle retailers in the eight most important coastal states. Word-of-mouth among the more passionate sector of the saltwater game fish enthusiasts should be sufficient to reach projected sales of the do-it-yourself kits. While this is going on, an organized approach will be followed to locate a suitable mass marketing company to license the Supreme. The eventual launching of the hook with the attached barb by the chosen marketing company should spawn further sales of the kits without any advertising or expensive promotional efforts on the part of Seacliff.
5.1 Competitive Edge
The Supreme’s stem-hook system is patented (Patent Number 6,042,520, dated May 16, 2000). The product is not available from any other supplier or manufacturer. The features are clearly outlined, and the hook is visually unique as well, making the hook an ideal USP in the hands of a capable marketing specialist. Case studies of other products with well-devised USP’s (having both a unique look and user-friendly features) have shown dramatic success in capturing market share from other brands.
5.2 Marketing Strategy
Considering the patented hook is so revolutionary, the initial reactions from fishermen, retailers, and other industry participants have been extremely positive. As time to market is everything, it is important not to wait until a suitable licensee can be chosen. This could take a year or more. The process of subcontracting the necessary elements forming the do-it-yourself kit, will get the hook to market within a few months, and the acceptance of the product in kit form should be a great spur to marketing candidates to consider licensing the hook.
An organized approach will be followed to locate a suitable licensee marketing company. A letter will be sent to licensee candidates. Enclosed in each letter will be a product summary. An exclusive manufacturer will also need to be found. A product summary and letter will be sent to manufacturing candidates. Phone calls will follow up the letters. The ASA Trade Show will also be a good way to attract the interest of licensees.
5.2.1 Distribution Strategy
For the do-it-yourself kits, the distribution will be traditional. Seacliff will sign an agreement with Nautical Marketing of Seaport, Oregon who will represent the kits to wholesalers. Emphasis will be placed on wholesalers and cataloguers in the eight coastal states that make up over seven million of the 9.4 million saltwater anglers. The wholesalers, in turn, will sell to retailers. Pricing has been carefully arranged to insure generous margins for both wholesalers and retailers.
5.2.2 Positioning Statement
Although the Supreme is suitable for many freshwater applications, the freshwater market is best attacked once the licensee marketing company has been located. Until then, marketing efforts for the Supreme in kit form will be focused on the much narrower market of saltwater fishermen who are especially enthusiastic about hunting for the 20 or so larger-game fish. These fishermen are more likely to read about the Supreme or to hear about it by word-of-mouth than through any other means of advertising.
5.2.3 Pricing Strategy
It is not an easy task to decide on a price for a totally unique, newly-patented item in kit form. However, there is no question that fishermen in the same market category will spend considerable amounts of money on fishing gear kits. Appendix A shows examples of such non-competing kits:
MIT Custom Rigging Kit
Includes leader, crimps, chafe tube, strand cable and swages, rigging tape and thimbles. Contains a crimper tool, a snipper and safety knife. As advertised in Melton International Tackle Catalog, it is priced at $225.
Ultimate Rigging Kit:
For double rigging riggers. Includes release clips, cork balls, black snubbers with stainless pulleys, nylon line and leader snaps. As advertised in Boater’s World Marine Centers Catalog, it is priced at $129.99.
Big Game Rigging Kits:
Includes large press tool, small press tool, 100 sleeves and thimbles of various sizes, monofiliment and stainless cable and three color tapes. All in carrying case with vinyl mesh back and clear front with velcro flaps. As advertised in Boater’s World Marine Centers Catalog, it is priced at $239.99
Pricing Structure
The pricing structure follows a retail cost model which is fairly standard in most industries. The manufacturer’s sell price to the distributor is approximately 55% off the retail price.
|
Retail sell price |
$129.95 |
| Retailer cost from wholesaler |
$77.97 |
| Wholesaler cost from Seacliff |
$58.48 |
| Less terms (2% 10 net 30) |
$1.17 |
| Less freight (5%) |
$2.92 |
| Less representative commissions (7.5%) |
$4.39 |
| Net price to Seacliff |
$50.00 |
(See Appendix B for price lists for Distributor (wholesaler) and Dealer (retailer)).
**appendix were not available for this sample plan.
5.2.4 Promotion Strategy
No large budget has been provided for promotional efforts, but we have set aside a small budget for point-of-sale materials. The strategy is to hold off on these expenditures. Once a licensee marketing company has been located, their efforts to market and promote the Supreme will be more than sufficient to get the word out to all fishermen.
5.3 Sales Strategy
The sales strategy is to rely as much as possible on the traditional distribution channel members (wholesalers and retailers) and to minimize the number of direct sales. Seacliff’s forte is more in the direction of formulating ideas worthy of patenting rather than administrative expertise. In addition, Seacliff will engage the services of a manufacturer’s representative to out-source, to every extent possible, sales reliance on Seacliff. Sales invoicing should be in only large quantities, such as a recent order for 250 kits.
5.3.1 Sales Forecast
Unit Sales of Kits:
Marketing research indicates that approximately five million saltwater fishermen hunt for the 20 or so large game fish. These fishermen are especially enthusiastic about the sport, and are relatively easy to reach as they are concentrated in only eight coastal states. We estimate 25,000 kits can be sold over the next three years to this market group alone, which works out to only one half of one percent. We will assume one quarter of these will be sold in the first year, one third in the second year, and the remainder in the third year. We will not attempt to project monthly sales differences, but will assume sales are steady throughout the year.
It is expected that other items will be sold such as replacement barbs for the kits, crimping tools, etc., but these are primarily minor items. They will be ignored in this original business plan, but will probably be included in updates once more exact trend information is available.
Unit Sales Prices
Direct Unit Costs:
The direct units costs pertain to the various items that comprise the Proline Kit, the fulfillment costs of assembling the various items into the kit, and the outer carton used to ship the kits to wholesalers, retailers, and/or individual consumers who purchase by mail or over the Internet.
- Bags. These are clear, plastic, re-sealable bags to hold the Supremes. There are 10 Supremes per bag. The bags are printed with the company’s fish logo giving the size of the Supreme. The bags are provided by Uline Shipping Supply Specialists. Price is $66 per 1,000, assuming 20,000, order plus $100 set-up charge, and $50 for each of three color changes. Four bags per kit at $0.097 each (4 x .097 = .388 per kit). Four weeks lead time when ordering.
- Barbs. These are the Supremes. They are provided by RCI Wilmette, Illinois. They come in four lengths and each kit contains 10 of each size:
| Size | Cost per 1,000 | Cost per Proline Kit |
| 2.03 cm | $79.00 | $0.79 |
| 2.28 cm | $83.00 | $0.83 |
| 2.58 cm | $86.00 | $0.86 |
| 2.78 cm | $90.00 | $0.90 |
| TOTAL | $3.38 cost of barbs per kit |
There is an initial tooling cost of approximately $25,350, which will be included in the pre-production expenses and amortized over the first five years. Allow 10-12 weeks tooling lead time, and two to three weeks lead for orders.
- Crimping Tool. All are stainless, and are supplied by Freil Specialty Tools, Kansas, Missouri. The tools are quoted at $3.89 each, assuming an order of seven gross (144 x 7= 1,008) plus shipping and handling ($100), total per unit cost will be $3.99. Allow a two to four week lead time.
- Kit Bag. The kit bags come from Octagon Products of Eugene, Oregon and cost $6.50 each, assuming a purchase of 1,000. Allow two to four weeks lead time.
- Paper Mixing Pad. Provided with the kit to mix the epoxy and hardener on. The supplier is Tisbury Printers and cost $.30. Allow two to four weeks lead time.
- Drying Pad. This is a 5/8″ thick closed cell rubber foam block used to hold the barbed hooks up in the air until the epoxy has dried. Also supplied by Greene Rubber Products and cost $.35 each. Lead time, allow two to three weeks.
- Epoxy. Supplied by Chilton Industries Inc. of Ashland, Long Island. It is supplied in five-gallon buckets (four colors: teal, red, cobalt, and black). It is $63.98/gal. Each kit contains 1/2 oz. tube of each color. Cost per kit, assuming 128 oz. per gallon. Cost per ounce $.50, cost per kit $1.00.
- Hardener. Also from Chilton Industries. Cost $178.95 per gallon. Sold in five-gallon buckets. Each kit contains two one-ounce tubes of hardener. Cost per ounce is $1.40, cost per kit is $2.80.
- Tubes. Supplied by Tripex Los Angeles, California. Six are needed per kit. Cost $278.00 per 1,000, cost per kit $1.67. These are rather light but bulky items, add 10% for shipping. Cost per kit is $1.84.
- Filling of Tubes with resin and hardener. This will be done by Lucaplan Labs in Columbus, Ohio. Cost: $0.50 per tube ,plus $10 for pallet wrapping. Per kit cost $3.00, assume $3.50 with wrapping and shipping charges.
- Stirring sticks. Approximately 30 small plastic sticks will be bundled and placed in each kit. Supplied by Sysco Restaurant Supplies. Approximately 60,000 will cost $30.00. Price per kit: approximately $0.02.
- Instruction Card. A plastic laminated card with instructions and warranties will be enclosed in each kit. They will cost $.50 each.
- Label. To be sewn onto kit face. Estimated cost, $.50 each.
- Outer carton. Each carton to hold six kits. Cost $.54 each, cost per kit $.09.
- Zip Lock Bag. Each kit will be in a separate bag with a hole at the top for placement in a retail wire hook. Cost is $82, cost per kit: $.32.
- Fulfillment. This is the cost of assembling the kits. This will be done by Antique Industries in Salem, Oregon for $1.00 per kit.
Total Unit Costs: $26.48 per kit
Royalty Income:
Royalty income is very difficult to predict because the royalty percentages can range widely. We have chosen three percent which is at the low end of the royalty percentages spectrum. We have assumed that this income will not begin until the second year (2002) of operation. We have estimated a total potential for the U.S. alone of $300,000 annually. We will assume a royalty of $50,000 in 2002 and $75,000 in 2003. This revenue is net of any related costs.

| Sales Forecast | |||
| Year 1 | Year 2 | Year 3 | |
| Unit Sales | |||
| Supreme Kits | 6,240 | 8,333 | 10,427 |
| Royalty Income | 0 | 50,000 | 75,000 |
| Other | 0 | 0 | 0 |
| Total Unit Sales | 6,240 | 58,333 | 85,427 |
| Unit Prices | Year 1 | Year 2 | Year 3 |
| Supreme Kits | $50.00 | $50.00 | $50.00 |
| Royalty Income | $0.00 | $1.00 | $1.00 |
| Other | $0.00 | $0.00 | $0.00 |
| Sales | |||
| Supreme Kits | $312,000 | $416,650 | $521,350 |
| Royalty Income | $0 | $50,000 | $75,000 |
| Other | $0 | $0 | $0 |
| Total Sales | $312,000 | $466,650 | $596,350 |
| Direct Unit Costs | Year 1 | Year 2 | Year 3 |
| Supreme Kits | $26.48 | $26.48 | $26.48 |
| Royalty Income | $0.00 | $0.00 | $0.00 |
| Other | $0.00 | $0.00 | $0.00 |
| Direct Cost of Sales | |||
| Supreme Kits | $165,235 | $220,658 | $276,107 |
| Royalty Income | $0 | $0 | $0 |
| Other | $0 | $0 | $0 |
| Subtotal Direct Cost of Sales | $165,235 | $220,658 | $276,107 |
5.4 Milestones
A major milestone is the securing of financing. Borrowing will be necessary either through the Small Business Administration (SBA) or alternative sources. It may be possible to arrange for some of this amount to be financed by the subcontractor of the barbs. The funds need to be committed to by the end of November at the latest.
The next step is to order the materials necessary for making up the kit and to have the kits ready for sale. This will take 45 days, and will begin when financing has been secured.
Joining the ASA is important, as is signing up for the ASA Trade Show in Las Vegas in July. Both of these things can be arranged in December, 2000.
An exclusive manufacturer needs to be located either domestically or internationally before March 2001. This should be an easier task than finding the right marketing company.
A licensee marketing company needs to be found who is willing to commit the resources necessary to mass market the hook. A short list should be found soon, initial contact made, and follow-up phone calls placed. Meetings at the trade show will be indispensible and will prove to be very profitable.
| Milestones | |||||
| Milestone | Start Date | End Date | Budget | Manager | Department |
| Secure Financing | 11/20/2000 | 12/1/2000 | $0 | Owner | Executive |
| Prepare Kits | 12/1/2000 | 1/15/2001 | $0 | Owner | Executive |
| Joining ASA | 12/1/2000 | 12/15/2000 | $400 | Owner | Executive |
| Booth at ASA Trade Show | 12/15/2000 | 1/15/2000 | $2,500 | Owner | Executive |
| Locate Exclusive Manufacturer | 1/1/2001 | 3/1/2001 | $0 | Owner | Executive |
| Short list of Licensee Candidate | 12/1/2000 | 1/30/2001 | $0 | Owner | Executive |
| Initial letter and Follow up Phone call | 1/30/2001 | 2/15/2001 | $0 | Owner | Executive |
| Face to Face Meetings | 2/15/2001 | 7/15/2001 | $0 | Owner | Executive |
| Conclude Agreements | 7/15/2001 | 8/30/2001 | $0 | Owner | Executive |
| Totals | $2,900 | ||||
Management Summary
A goal of the company is to sign a licensee agreement with an aggressive marketing company who will take over all aspects of the business of marketing the Supreme. Seacliff will not need an extensive management team to succeed at this. However, until the licensee agreement can be completed, Seacliff management will have to bring the product to market in kit form. Most of the load of management in doing this has been limited by subcontracting the manufacturing to others. The kits will even be assembled by a professional fulfillment company. By relying on the services of a manufacturer’s representative, as well as wholesalers/distributors, Seacliff will further limit the extent of administrative involvement.
6.1 Personnel Plan
The payroll will include a monthly salary for the president in the first year, increasing annually in year two, and year three. In addition, a bookkeeper/office manager will be necessary to enter the accounts into the computer (QuickBooks Pro), and to take orders over the phone, as well as to respond to email inquiries. His or her monthly salary will be established at the time of hiring for the first year of operation, increasing in the second and third years.
| Personnel Plan | |||
| Year 1 | Year 2 | Year 3 | |
| President | $24,000 | $36,000 | $48,000 |
| Bookkeeper/Office Manager | $24,000 | $30,000 | $30,000 |
| Total People | 2 | 2 | 2 |
| Total Payroll | $48,000 | $66,000 | $78,000 |
Financial Plan
The financial plan will require outside sources of funds. It is hoped that this amount can be obtained from the SBA. Seacliff has already succeeded in attracting significant private funding through the sale of common stock. This source of funds is still attractive due to the exciting features of the patent. It is assumed that the necessary funding will be found, and that it will be repaid in the first year.
7.1 Break-even Analysis
In the first year of operations, monthly expenses are projected to include interest expenses on initial borrowing. Although some sales will certainly come via Seacliff’s website at close to the suggested retail price of $129.95, for purposes of determining the break-even point we have assumed that all kits will be sold through the full distribution channel (representative, wholesaler, retailer).
The break-even chart shows the number kits needed to be sold each month to cover all variable and fixed costs. If we capitalize start-up costs (see section 2.2, Start-up Summary) and amortize them over five years and then added this to monthly fixed costs the break-even point would increase kits per month sold.

| Break-even Analysis | |
| Monthly Units Break-even | 286 |
| Monthly Revenue Break-even | $14,280 |
| Assumptions: | |
| Average Per-Unit Revenue | $50.00 |
| Average Per-Unit Variable Cost | $26.48 |
| Estimated Monthly Fixed Cost | $6,717 |
7.2 Important Assumptions
Although there is likely to be sales of replacement items from the kits, such as barbs, epoxy, etc. (see price list in the appendix) these items have been ignored in this business plan for projection purposes. The following table outlines the basic assumptions of Seacliff.
**appendix were not available for this sample plan.
| General Assumptions | |||
| Year 1 | Year 2 | Year 3 | |
| Plan Month | 1 | 2 | 3 |
| Current Interest Rate | 10.00% | 10.00% | 10.00% |
| Long-term Interest Rate | 10.00% | 10.00% | 10.00% |
| Tax Rate | 24.96% | 24.50% | 24.96% |
| Other | 0 | 0 | 0 |
7.3 Business Ratios
The following table outlines the important ratios of the sports and athletic goods manufacturing industry, as described in the Standard Industry Classification (SIC) Index, 3949.
| Ratio Analysis | ||||
| Year 1 | Year 2 | Year 3 | Industry Profile | |
| Sales Growth | 0.00% | 49.57% | 27.79% | -0.74% |
| Percent of Total Assets | ||||
| Inventory | 2.44% | 2.76% | 2.86% | 28.00% |
| Other Current Assets | 0.00% | 0.00% | 0.00% | 24.40% |
| Total Current Assets | 22.39% | 34.20% | 45.72% | 76.79% |
| Long-term Assets | 77.61% | 65.80% | 54.28% | 23.21% |
| Total Assets | 100.00% | 100.00% | 100.00% | 100.00% |
| Current Liabilities | 2.83% | 3.39% | 3.48% | 30.18% |
| Long-term Liabilities | 16.08% | 13.66% | 11.29% | 19.10% |
| Total Liabilities | 18.92% | 17.05% | 14.77% | 49.28% |
| Net Worth | 81.08% | 82.95% | 85.23% | 50.72% |
| Percent of Sales | ||||
| Sales | 100.00% | 100.00% | 100.00% | 100.00% |
| Gross Margin | 47.04% | 52.71% | 53.70% | 36.97% |
| Selling, General & Administrative Expenses | 32.34% | 29.03% | 27.51% | 21.82% |
| Advertising Expenses | 2.85% | 1.29% | 1.01% | 1.40% |
| Profit Before Interest and Taxes | 21.20% | 31.37% | 34.68% | 2.71% |
| Main Ratios | ||||
| Current | 7.91 | 10.09 | 13.14 | 2.23 |
| Quick | 7.05 | 9.27 | 12.32 | 1.14 |
| Total Debt to Total Assets | 18.92% | 17.05% | 14.77% | 53.80% |
| Pre-tax Return on Net Worth | 11.14% | 22.47% | 26.08% | 4.60% |
| Pre-tax Return on Assets | 9.03% | 18.63% | 22.23% | 9.97% |
| Additional Ratios | Year 1 | Year 2 | Year 3 | |
| Net Profit Margin | 13.51% | 22.07% | 24.77% | n.a |
| Return on Equity | 8.36% | 16.96% | 19.57% | n.a |
| Activity Ratios | ||||
| Inventory Turnover | 8.65 | 12.48 | 12.13 | n.a |
| Accounts Payable Turnover | 10.09 | 12.17 | 12.17 | n.a |
| Payment Days | 27 | 26 | 27 | n.a |
| Total Asset Turnover | 0.50 | 0.64 | 0.67 | n.a |
| Debt Ratios | ||||
| Debt to Net Worth | 0.23 | 0.21 | 0.17 | n.a |
| Current Liab. to Liab. | 0.15 | 0.20 | 0.24 | n.a |
| Liquidity Ratios | ||||
| Net Working Capital | $121,588 | $225,466 | $374,082 | n.a |
| Interest Coverage | 6.62 | 14.64 | 20.68 | n.a |
| Additional Ratios | ||||
| Assets to Sales | 1.99 | 1.57 | 1.49 | n.a |
| Current Debt/Total Assets | 3% | 3% | 3% | n.a |
| Acid Test | 7.05 | 9.27 | 12.32 | n.a |
| Sales/Net Worth | 0.62 | 0.77 | 0.79 | n.a |
| Dividend Payout | 0.00 | 0.00 | 0.00 | n.a |
7.4 Projected Profit and Loss
Because virtually all aspects of the production of the kits are being subcontracted, the ongoing monthly expenses are relatively small.
- Advertising and Promotion: The main focus is to try to get as much free publicity as possible. Once a licensee has been located to market the Supreme, sales of the kits will benefit from the advertising and promotional efforts of the licensee. However, some point-of-sale advertising is likely to be needed (assume $500 monthly). An extra $400 will be needed to join the ASA in January 2001, and to participate in the ASA trade show in July will require an additional $2,500.
- Travel: Travel to trade shows, with the connected hotel and meal expenses, we estimate at $600 monthly.
- Miscellaneous: We will allot $200 per month to cover any unexpected expenses.
- Depreciation: The only fixed assets that will be depreciated are minor pieces of office equipment which will be depreciated over three years at $75 per month. The larger fixed asset (patent number 6,038,806) of $480,000 will not depreciate.
- Utilities: Utilities are basically telephone, heat, and Internet connection. Assume $200 monthly in year one, increasing to $300 in years two and three.
- Insurance: Standard business liability insurance should be arranged. Assume $1,200 yearly.
- Rent: Free office space is available in premises owned by a family member.
- Consultants: A provision is being made to cover periodic review and updating of the business plan. Assume $2,400 annually.


| Pro Forma Profit and Loss | |||
| Year 1 | Year 2 | Year 3 | |
| Sales | $312,000 | $466,650 | $596,350 |
| Direct Cost of Sales | $165,235 | $220,658 | $276,107 |
| Other | $0 | $0 | $0 |
| Total Cost of Sales | $165,235 | $220,658 | $276,107 |
| Gross Margin | $146,765 | $245,992 | $320,243 |
| Gross Margin % | 47.04% | 52.71% | 53.70% |
| Expenses | |||
| Payroll | $48,000 | $66,000 | $78,000 |
| Sales and Marketing and Other Expenses | $20,900 | $18,000 | $18,000 |
| Depreciation | $908 | $908 | $908 |
| Leased Equipment | $0 | $0 | $0 |
| Utilities | $2,400 | $3,600 | $3,600 |
| Insurance | $1,200 | $1,200 | $1,200 |
| Rent | $0 | $0 | $0 |
| Payroll Taxes | $7,200 | $9,900 | $11,700 |
| Other | $0 | $0 | $0 |
| Total Operating Expenses | $80,608 | $99,608 | $113,408 |
| Profit Before Interest and Taxes | $66,157 | $146,384 | $206,835 |
| EBITDA | $67,065 | $147,292 | $207,743 |
| Interest Expense | $10,000 | $10,000 | $10,000 |
| Taxes Incurred | $14,007 | $33,414 | $49,127 |
| Net Profit | $42,150 | $102,970 | $147,708 |
| Net Profit/Sales | 13.51% | 22.07% | 24.77% |
7.5 Projected Cash Flow
The initial borrowing will be repaid monthly, beginning in the third month.

| Pro Forma Cash Flow | |||
| Year 1 | Year 2 | Year 3 | |
| Cash Received | |||
| Cash from Operations | |||
| Cash Sales | $312,000 | $466,650 | $596,350 |
| Subtotal Cash from Operations | $312,000 | $466,650 | $596,350 |
| Additional Cash Received | |||
| Sales Tax, VAT, HST/GST Received | $0 | $0 | $0 |
| New Current Borrowing | $0 | $0 | $0 |
| New Other Liabilities (interest-free) | $0 | $0 | $0 |
| New Long-term Liabilities | $0 | $0 | $0 |
| Sales of Other Current Assets | $0 | $0 | $0 |
| Sales of Long-term Assets | $0 | $0 | $0 |
| New Investment Received | $0 | $0 | $0 |
| Subtotal Cash Received | $312,000 | $466,650 | $596,350 |
| Expenditures | Year 1 | Year 2 | Year 3 |
| Expenditures from Operations | |||
| Cash Spending | $48,000 | $66,000 | $78,000 |
| Bill Payments | $159,957 | $294,644 | $368,819 |
| Subtotal Spent on Operations | $207,957 | $360,644 | $446,819 |
| Additional Cash Spent | |||
| Sales Tax, VAT, HST/GST Paid Out | $0 | $0 | $0 |
| Principal Repayment of Current Borrowing | $0 | $0 | $0 |
| Other Liabilities Principal Repayment | $0 | $0 | $0 |
| Long-term Liabilities Principal Repayment | $0 | $0 | $0 |
| Purchase Other Current Assets | $0 | $0 | $0 |
| Purchase Long-term Assets | $0 | $0 | $0 |
| Dividends | $0 | $0 | $0 |
| Subtotal Cash Spent | $207,957 | $360,644 | $446,819 |
| Net Cash Flow | $104,043 | $106,006 | $149,531 |
| Cash Balance | $124,043 | $230,049 | $379,579 |
7.6 Projected Balance Sheet
The annual figures for the Pprojected Balance Sheet are presented below. First year monthlies are available in the appendix.
| Pro Forma Balance Sheet | |||
| Year 1 | Year 2 | Year 3 | |
| Assets | |||
| Current Assets | |||
| Cash | $124,043 | $230,049 | $379,579 |
| Inventory | $15,147 | $20,227 | $25,310 |
| Other Current Assets | $0 | $0 | $0 |
| Total Current Assets | $139,189 | $250,276 | $404,889 |
| Long-term Assets | |||
| Long-term Assets | $483,425 | $483,425 | $483,425 |
| Accumulated Depreciation | $908 | $1,816 | $2,724 |
| Total Long-term Assets | $482,517 | $481,609 | $480,701 |
| Total Assets | $621,706 | $731,885 | $885,590 |
| Liabilities and Capital | Year 1 | Year 2 | Year 3 |
| Current Liabilities | |||
| Accounts Payable | $17,602 | $24,810 | $30,807 |
| Current Borrowing | $0 | $0 | $0 |
| Other Current Liabilities | $0 | $0 | $0 |
| Subtotal Current Liabilities | $17,602 | $24,810 | $30,807 |
| Long-term Liabilities | $100,000 | $100,000 | $100,000 |
| Total Liabilities | $117,602 | $124,810 | $130,807 |
| Paid-in Capital | $545,205 | $545,205 | $545,205 |
| Retained Earnings | ($83,250) | ($41,100) | $61,870 |
| Earnings | $42,150 | $102,970 | $147,708 |
| Total Capital | $504,105 | $607,075 | $754,783 |
| Total Liabilities and Capital | $621,706 | $731,885 | $885,590 |
| Net Worth | $504,105 | $607,075 | $754,783 |
Appendix
| Sales Forecast | |||||||||||||
| Month 1 | Month 2 | Month 3 | Month 4 | Month 5 | Month 6 | Month 7 | Month 8 | Month 9 | Month 10 | Month 11 | Month 12 | ||
| Unit Sales | |||||||||||||
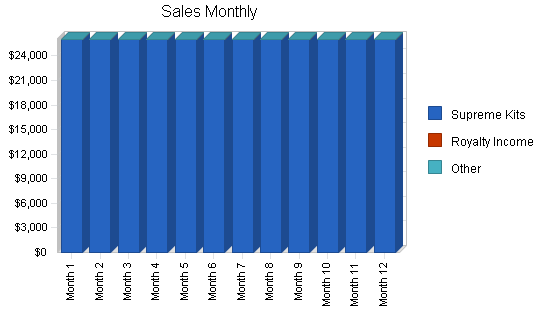
| Supreme Kits | 0% | 520 | 520 | 520 | 520 | 520 | 520 | 520 | 520 | 520 | 520 | 520 | 520 |
| Royalty Income | 0% | 0 | 0 | 0 | 0 | 0 | 0 | 0 | 0 | 0 | 0 | 0 | 0 |
| Other | 0% | 0 | 0 | 0 | 0 | 0 | 0 | 0 | 0 | 0 | 0 | 0 | 0 |
| Total Unit Sales | 520 | 520 | 520 | 520 | 520 | 520 | 520 | 520 | 520 | 520 | 520 | 520 | |
| Unit Prices | Month 1 | Month 2 | Month 3 | Month 4 | Month 5 | Month 6 | Month 7 | Month 8 | Month 9 | Month 10 | Month 11 | Month 12 | |
| Supreme Kits | $50.00 | $50.00 | $50.00 | $50.00 | $50.00 | $50.00 | $50.00 | $50.00 | $50.00 | $50.00 | $50.00 | $50.00 | |
| Royalty Income | $0.00 | $0.00 | $0.00 | $0.00 | $0.00 | $0.00 | $0.00 | $0.00 | $0.00 | $0.00 | $0.00 | $0.00 | |
| Other | $0.00 | $0.00 | $0.00 | $0.00 | $0.00 | $0.00 | $0.00 | $0.00 | $0.00 | $0.00 | $0.00 | $0.00 | |
| Sales | |||||||||||||
| Supreme Kits | $26,000 | $26,000 | $26,000 | $26,000 | $26,000 | $26,000 | $26,000 | $26,000 | $26,000 | $26,000 | $26,000 | $26,000 | |
| Royalty Income | $0 | $0 | $0 | $0 | $0 | $0 | $0 | $0 | $0 | $0 | $0 | $0 | |
| Other | $0 | $0 | $0 | $0 | $0 | $0 | $0 | $0 | $0 | $0 | $0 | $0 | |
| Total Sales | $26,000 | $26,000 | $26,000 | $26,000 | $26,000 | $26,000 | $26,000 | $26,000 | $26,000 | $26,000 | $26,000 | $26,000 | |
| Direct Unit Costs | Month 1 | Month 2 | Month 3 | Month 4 | Month 5 | Month 6 | Month 7 | Month 8 | Month 9 | Month 10 | Month 11 | Month 12 | |
| Supreme Kits | 0.00% | $26.48 | $26.48 | $26.48 | $26.48 | $26.48 | $26.48 | $26.48 | $26.48 | $26.48 | $26.48 | $26.48 | $26.48 |
| Royalty Income | 0.00% | $0.00 | $0.00 | $0.00 | $0.00 | $0.00 | $0.00 | $0.00 | $0.00 | $0.00 | $0.00 | $0.00 | $0.00 |
| Other | 0.00% | $0.00 | $0.00 | $0.00 | $0.00 | $0.00 | $0.00 | $0.00 | $0.00 | $0.00 | $0.00 | $0.00 | $0.00 |
| Direct Cost of Sales | |||||||||||||
| Supreme Kits | $13,770 | $13,770 | $13,770 | $13,770 | $13,770 | $13,770 | $13,770 | $13,770 | $13,770 | $13,770 | $13,770 | $13,770 | |
| Royalty Income | $0 | $0 | $0 | $0 | $0 | $0 | $0 | $0 | $0 | $0 | $0 | $0 | |
| Other | $0 | $0 | $0 | $0 | $0 | $0 | $0 | $0 | $0 | $0 | $0 | $0 | |
| Subtotal Direct Cost of Sales | $13,770 | $13,770 | $13,770 | $13,770 | $13,770 | $13,770 | $13,770 | $13,770 | $13,770 | $13,770 | $13,770 | $13,770 | |
| Personnel Plan | |||||||||||||
| Month 1 | Month 2 | Month 3 | Month 4 | Month 5 | Month 6 | Month 7 | Month 8 | Month 9 | Month 10 | Month 11 | Month 12 | ||
| President | 0% | $2,000 | $2,000 | $2,000 | $2,000 | $2,000 | $2,000 | $2,000 | $2,000 | $2,000 | $2,000 | $2,000 | $2,000 |
| Bookkeeper/Office Manager | 0% | $2,000 | $2,000 | $2,000 | $2,000 | $2,000 | $2,000 | $2,000 | $2,000 | $2,000 | $2,000 | $2,000 | $2,000 |
| Total People | 2 | 2 | 2 | 2 | 2 | 2 | 2 | 2 | 2 | 2 | 2 | 2 | |
| Total Payroll | $4,000 | $4,000 | $4,000 | $4,000 | $4,000 | $4,000 | $4,000 | $4,000 | $4,000 | $4,000 | $4,000 | $4,000 | |
| General Assumptions | |||||||||||||
| Month 1 | Month 2 | Month 3 | Month 4 | Month 5 | Month 6 | Month 7 | Month 8 | Month 9 | Month 10 | Month 11 | Month 12 | ||
| Plan Month | 1 | 2 | 3 | 4 | 5 | 6 | 7 | 8 | 9 | 10 | 11 | 12 | |
| Current Interest Rate | 10.00% | 10.00% | 10.00% | 10.00% | 10.00% | 10.00% | 10.00% | 10.00% | 10.00% | 10.00% | 10.00% | 10.00% | |
| Long-term Interest Rate | 10.00% | 10.00% | 10.00% | 10.00% | 10.00% | 10.00% | 10.00% | 10.00% | 10.00% | 10.00% | 10.00% | 10.00% | |
| Tax Rate | 30.00% | 24.50% | 24.50% | 24.50% | 24.50% | 24.50% | 24.50% | 24.50% | 24.50% | 24.50% | 24.50% | 24.50% | |
| Other | 0 | 0 | 0 | 0 | 0 | 0 | 0 | 0 | 0 | 0 | 0 | 0 | |
| Pro Forma Profit and Loss | |||||||||||||
| Month 1 | Month 2 | Month 3 | Month 4 | Month 5 | Month 6 | Month 7 | Month 8 | Month 9 | Month 10 | Month 11 | Month 12 | ||
| Sales | $26,000 | $26,000 | $26,000 | $26,000 | $26,000 | $26,000 | $26,000 | $26,000 | $26,000 | $26,000 | $26,000 | $26,000 | |
| Direct Cost of Sales | $13,770 | $13,770 | $13,770 | $13,770 | $13,770 | $13,770 | $13,770 | $13,770 | $13,770 | $13,770 | $13,770 | $13,770 | |
| Other | $0 | $0 | $0 | $0 | $0 | $0 | $0 | $0 | $0 | $0 | $0 | $0 | |
| Total Cost of Sales | $13,770 | $13,770 | $13,770 | $13,770 | $13,770 | $13,770 | $13,770 | $13,770 | $13,770 | $13,770 | $13,770 | $13,770 | |
| Gross Margin | $12,230 | $12,230 | $12,230 | $12,230 | $12,230 | $12,230 | $12,230 | $12,230 | $12,230 | $12,230 | $12,230 | $12,230 | |
| Gross Margin % | 47.04% | 47.04% | 47.04% | 47.04% | 47.04% | 47.04% | 47.04% | 47.04% | 47.04% | 47.04% | 47.04% | 47.04% | |
| Expenses | |||||||||||||
| Payroll | $4,000 | $4,000 | $4,000 | $4,000 | $4,000 | $4,000 | $4,000 | $4,000 | $4,000 | $4,000 | $4,000 | $4,000 | |
| Sales and Marketing and Other Expenses | $1,900 | $1,500 | $1,500 | $1,500 | $1,500 | $1,500 | $4,000 | $1,500 | $1,500 | $1,500 | $1,500 | $1,500 | |
| Depreciation | $76 | $76 | $76 | $76 | $76 | $76 | $76 | $76 | $76 | $76 | $76 | $76 | |
| Leased Equipment | $0 | $0 | $0 | $0 | $0 | $0 | $0 | $0 | $0 | $0 | $0 | $0 | |
| Utilities | $200 | $200 | $200 | $200 | $200 | $200 | $200 | $200 | $200 | $200 | $200 | $200 | |
| Insurance | $100 | $100 | $100 | $100 | $100 | $100 | $100 | $100 | $100 | $100 | $100 | $100 | |
| Rent | $0 | $0 | $0 | $0 | $0 | $0 | $0 | $0 | $0 | $0 | $0 | $0 | |
| Payroll Taxes | 15% | $600 | $600 | $600 | $600 | $600 | $600 | $600 | $600 | $600 | $600 | $600 | $600 |
| Other | $0 | $0 | $0 | $0 | $0 | $0 | $0 | $0 | $0 | $0 | $0 | $0 | |
| Total Operating Expenses | $6,876 | $6,476 | $6,476 | $6,476 | $6,476 | $6,476 | $8,976 | $6,476 | $6,476 | $6,476 | $6,476 | $6,476 | |
| Profit Before Interest and Taxes | $5,355 | $5,755 | $5,755 | $5,755 | $5,755 | $5,755 | $3,255 | $5,755 | $5,755 | $5,755 | $5,755 | $5,755 | |
| EBITDA | $5,430 | $5,830 | $5,830 | $5,830 | $5,830 | $5,830 | $3,330 | $5,830 | $5,830 | $5,830 | $5,830 | $5,830 | |
| Interest Expense | $833 | $833 | $833 | $833 | $833 | $833 | $833 | $833 | $833 | $833 | $833 | $833 | |
| Taxes Incurred | $1,356 | $1,206 | $1,206 | $1,206 | $1,206 | $1,206 | $593 | $1,206 | $1,206 | $1,206 | $1,206 | $1,206 | |
| Net Profit | $3,165 | $3,716 | $3,716 | $3,716 | $3,716 | $3,716 | $1,828 | $3,716 | $3,716 | $3,716 | $3,716 | $3,716 | |
| Net Profit/Sales | 12.17% | 14.29% | 14.29% | 14.29% | 14.29% | 14.29% | 7.03% | 14.29% | 14.29% | 14.29% | 14.29% | 14.29% | |
| Pro Forma Cash Flow | |||||||||||||
| Month 1 | Month 2 | Month 3 | Month 4 | Month 5 | Month 6 | Month 7 | Month 8 | Month 9 | Month 10 | Month 11 | Month 12 | ||
| Cash Received | |||||||||||||
| Cash from Operations | |||||||||||||
| Cash Sales | $26,000 | $26,000 | $26,000 | $26,000 | $26,000 | $26,000 | $26,000 | $26,000 | $26,000 | $26,000 | $26,000 | $26,000 | |
| Subtotal Cash from Operations | $26,000 | $26,000 | $26,000 | $26,000 | $26,000 | $26,000 | $26,000 | $26,000 | $26,000 | $26,000 | $26,000 | $26,000 | |
| Additional Cash Received | |||||||||||||
| Sales Tax, VAT, HST/GST Received | 0.00% | $0 | $0 | $0 | $0 | $0 | $0 | $0 | $0 | $0 | $0 | $0 | $0 |
| New Current Borrowing | $0 | $0 | $0 | $0 | $0 | $0 | $0 | $0 | $0 | $0 | $0 | $0 | |
| New Other Liabilities (interest-free) | $0 | $0 | $0 | $0 | $0 | $0 | $0 | $0 | $0 | $0 | $0 | $0 | |
| New Long-term Liabilities | $0 | $0 | $0 | $0 | $0 | $0 | $0 | $0 | $0 | $0 | $0 | $0 | |
| Sales of Other Current Assets | $0 | $0 | $0 | $0 | $0 | $0 | $0 | $0 | $0 | $0 | $0 | $0 | |
| Sales of Long-term Assets | $0 | $0 | $0 | $0 | $0 | $0 | $0 | $0 | $0 | $0 | $0 | $0 | |
| New Investment Received | $0 | $0 | $0 | $0 | $0 | $0 | $0 | $0 | $0 | $0 | $0 | $0 | |
| Subtotal Cash Received | $26,000 | $26,000 | $26,000 | $26,000 | $26,000 | $26,000 | $26,000 | $26,000 | $26,000 | $26,000 | $26,000 | $26,000 | |
| Expenditures | Month 1 | Month 2 | Month 3 | Month 4 | Month 5 | Month 6 | Month 7 | Month 8 | Month 9 | Month 10 | Month 11 | Month 12 | |
| Expenditures from Operations | |||||||||||||
| Cash Spending | $4,000 | $4,000 | $4,000 | $4,000 | $4,000 | $4,000 | $4,000 | $4,000 | $4,000 | $4,000 | $4,000 | $4,000 | |
| Bill Payments | $166 | $4,971 | $4,439 | $4,829 | $16,203 | $18,209 | $18,272 | $20,033 | $18,209 | $18,209 | $18,209 | $18,209 | |
| Subtotal Spent on Operations | $4,166 | $8,971 | $8,439 | $8,829 | $20,203 | $22,209 | $22,272 | $24,033 | $22,209 | $22,209 | $22,209 | $22,209 | |
| Additional Cash Spent | |||||||||||||
| Sales Tax, VAT, HST/GST Paid Out | $0 | $0 | $0 | $0 | $0 | $0 | $0 | $0 | $0 | $0 | $0 | $0 | |
| Principal Repayment of Current Borrowing | $0 | $0 | $0 | $0 | $0 | $0 | $0 | $0 | $0 | $0 | $0 | $0 | |
| Other Liabilities Principal Repayment | $0 | $0 | $0 | $0 | $0 | $0 | $0 | $0 | $0 | $0 | $0 | $0 | |
| Long-term Liabilities Principal Repayment | $0 | $0 | $0 | $0 | $0 | $0 | $0 | $0 | $0 | $0 | $0 | $0 | |
| Purchase Other Current Assets | $0 | $0 | $0 | $0 | $0 | $0 | $0 | $0 | $0 | $0 | $0 | $0 | |
| Purchase Long-term Assets | $0 | $0 | $0 | $0 | $0 | $0 | $0 | $0 | $0 | $0 | $0 | $0 | |
| Dividends | $0 | $0 | $0 | $0 | $0 | $0 | $0 | $0 | $0 | $0 | $0 | $0 | |
| Subtotal Cash Spent | $4,166 | $8,971 | $8,439 | $8,829 | $20,203 | $22,209 | $22,272 | $24,033 | $22,209 | $22,209 | $22,209 | $22,209 | |
| Net Cash Flow | $21,834 | $17,029 | $17,561 | $17,171 | $5,797 | $3,791 | $3,728 | $1,967 | $3,791 | $3,791 | $3,791 | $3,791 | |
| Cash Balance | $41,834 | $58,862 | $76,423 | $93,594 | $99,391 | $103,182 | $106,911 | $108,878 | $112,669 | $116,460 | $120,252 | $124,043 | |
| Pro Forma Balance Sheet | |||||||||||||
| Month 1 | Month 2 | Month 3 | Month 4 | Month 5 | Month 6 | Month 7 | Month 8 | Month 9 | Month 10 | Month 11 | Month 12 | ||
| Assets | Starting Balances | ||||||||||||
| Current Assets | |||||||||||||
| Cash | $20,000 | $41,834 | $58,862 | $76,423 | $93,594 | $99,391 | $103,182 | $106,911 | $108,878 | $112,669 | $116,460 | $120,252 | $124,043 |
| Inventory | $58,530 | $44,760 | $30,991 | $17,221 | $15,147 | $15,147 | $15,147 | $15,147 | $15,147 | $15,147 | $15,147 | $15,147 | $15,147 |
| Other Current Assets | $0 | $0 | $0 | $0 | $0 | $0 | $0 | $0 | $0 | $0 | $0 | $0 | $0 |
| Total Current Assets | $78,530 | $86,594 | $89,853 | $93,644 | $108,741 | $114,538 | $118,329 | $122,057 | $124,024 | $127,815 | $131,607 | $135,398 | $139,189 |
| Long-term Assets | |||||||||||||
| Long-term Assets | $483,425 | $483,425 | $483,425 | $483,425 | $483,425 | $483,425 | $483,425 | $483,425 | $483,425 | $483,425 | $483,425 | $483,425 | $483,425 |
| Accumulated Depreciation | $0 | $76 | $151 | $227 | $303 | $378 | $454 | $530 | $605 | $681 | $757 | $832 | $908 |
| Total Long-term Assets | $483,425 | $483,349 | $483,274 | $483,198 | $483,122 | $483,047 | $482,971 | $482,895 | $482,820 | $482,744 | $482,668 | $482,593 | $482,517 |
| Total Assets | $561,955 | $569,943 | $573,127 | $576,842 | $591,863 | $597,584 | $601,300 | $604,953 | $606,844 | $610,560 | $614,275 | $617,991 | $621,706 |
| Liabilities and Capital | Month 1 | Month 2 | Month 3 | Month 4 | Month 5 | Month 6 | Month 7 | Month 8 | Month 9 | Month 10 | Month 11 | Month 12 | |
| Current Liabilities | |||||||||||||
| Accounts Payable | $0 | $4,823 | $4,291 | $4,291 | $15,596 | $17,602 | $17,602 | $19,426 | $17,602 | $17,602 | $17,602 | $17,602 | $17,602 |
| Current Borrowing | $0 | $0 | $0 | $0 | $0 | $0 | $0 | $0 | $0 | $0 | $0 | $0 | $0 |
| Other Current Liabilities | $0 | $0 | $0 | $0 | $0 | $0 | $0 | $0 | $0 | $0 | $0 | $0 | $0 |
| Subtotal Current Liabilities | $0 | $4,823 | $4,291 | $4,291 | $15,596 | $17,602 | $17,602 | $19,426 | $17,602 | $17,602 | $17,602 | $17,602 | $17,602 |
| Long-term Liabilities | $100,000 | $100,000 | $100,000 | $100,000 | $100,000 | $100,000 | $100,000 | $100,000 | $100,000 | $100,000 | $100,000 | $100,000 | $100,000 |
| Total Liabilities | $100,000 | $104,823 | $104,291 | $104,291 | $115,596 | $117,602 | $117,602 | $119,426 | $117,602 | $117,602 | $117,602 | $117,602 | $117,602 |
| Paid-in Capital | $545,205 | $545,205 | $545,205 | $545,205 | $545,205 | $545,205 | $545,205 | $545,205 | $545,205 | $545,205 | $545,205 | $545,205 | $545,205 |
| Retained Earnings | ($83,250) | ($83,250) | ($83,250) | ($83,250) | ($83,250) | ($83,250) | ($83,250) | ($83,250) | ($83,250) | ($83,250) | ($83,250) | ($83,250) | ($83,250) |
| Earnings | $0 | $3,165 | $6,881 | $10,596 | $14,312 | $18,028 | $21,743 | $23,571 | $27,287 | $31,003 | $34,718 | $38,434 | $42,150 |
| Total Capital | $461,955 | $465,120 | $468,836 | $472,551 | $476,267 | $479,983 | $483,698 | $485,526 | $489,242 | $492,958 | $496,673 | $500,389 | $504,105 |
| Total Liabilities and Capital | $561,955 | $569,943 | $573,127 | $576,842 | $591,863 | $597,584 | $601,300 | $604,953 | $606,844 | $610,560 | $614,275 | $617,991 | $621,706 |
| Net Worth | $461,955 | $465,120 | $468,836 | $472,551 | $476,267 | $479,983 | $483,698 | $485,526 | $489,242 | $492,958 | $496,673 | $500,389 | $504,105 |


