
FireRescue Depot
Executive Summary
FireRescue Depot is an exciting start-up business that has been registered as an Illinois S Corporation. FireRescue Depot is a vendor of fire department and search and rescue hydraulic tools. FireRescue Depot stands apart from the competition by offering a complete line of hydraulic tools from all of the popular industry manufacturers. FireRescue Depot is able to offer an extensive product selection by arranging a drop ship agreement with the different manufacturers, significantly reducing their inventory overhead. FireRescue Depot was founded by Steve Dalmatian and the e-commerce business plan recently won a competition, generating $50,000 in prize money for the start up of the business. The plan won the competition due to FireRescue Depot’s unique approach to offering an extensive selection, as well as its addressing the common pitfall of large selection which is huge inventory. Winning the competition was the initial validation that Steve had developed what appeared to be a novel, profitable business model.
Products– FireRescue Depot will offer several different classes of tools for fire and search/rescue departments. These classes are the backbone of a department’s tools.
- Rams are used for punching, pulling, shoring, stabilizing, or supporting. With up to 15,000 pounds of punching force, they can easily displace a dashboard, move a steering column, or stabilize a vehicle. Various sizes are sold.
- Cutters provide maximum cutting force and flexibility. A wide range of cutters is offered, from 20,000 to 94,000 pounds of pressure. The different models come in a variety of sizes, jaw designs, and shapes.
- Spreaders separate a variety of materials including metal, mass timber, etc. Various models offer a range of spreading distance (24-40 inches) and a range of spreading force (19,000 – 37,000 pounds).
- Combination tools mate cutters and spreaders into one tool. These are quite useful when you need to move metal and have the cutting power necessary for quick responses.
Market– The following is a description of the two distinct customer segments that FireRescue Depot has identified and will tailor their marketing and sales activities toward.
FireRescue Depot targets two market segments. The first is urban fire and rescue departments with more than 10 employees serving more that 10,000 people. 3,435 potential customers have been identified. The annual growth rate is 8%. The second customer segment is rural departments with fewer than 10 employees and serving less than 10,000 people. This segment grows at an annual rate of 7% and includes 8,787 potential customers.
Management– FireRescue Depot’s management recognizes the fact that while business ideas and models change over time, the most important element of a business is the management who are in the position to carry out a well designed business plan.
FireRescue Depot will be led by Steve Dalmatian. Steve has the right skill set to follow through on the well thought out business opportunity. Steve has three years experience in a fire department where he participated in countless rescue operations, becoming intimately familiar with the industry and the corresponding technology. In addition to this wealth of knowledge, Steve received his MBA from Loyola University, providing him with comprehensive business skills.

Mission
FireRescue Depot’s mission is to become the leading vendor of fire and rescue equipment. Through a combination of outstanding selection and attention to detail, this customer-centric organization will be known as the best retailer for the price and customer service.
Keys to Success
FireRescue Depot has identified three keys to success, all of which are necessary to achieve sustainable profitability. These keys will be constantly monitored to determine if the organization is meeting them:
- Identify the products that the market demands and sell a wide range of options.
- Build long term customer relationships with exceptional customer service.
- Design and implement strict financial controls.
Objectives
FireRescue Depot has identified three objectives that will serve as lofty but achievable goals for the entire organization. They are:
- To become a premier vendor in the fire rescue hydraulic tool market.
- To reach profitability within 24 months.
- To increase market penetration to 15% by the end of four years.
Company Summary
FireRescue Depot is an S Corporation, registered and located in Chicago, IL.
Start-up Summary
FireRescue Depot has identified the type of equipment, and the start-up costs of the organization. The start-up expenditures will allow FireRescue Depot to open a small showroom for their equipment, launch a comprehensive eCommerce website, and have the necessary office support.
- Office furniture- enough for five workstations.
- Computer system- five workstations and one central file server. A laser printer, digital camera, scanner, and a broadband Internet connection will also be used. Needed software will be Business Plan Pro, Microsoft Office, and QuickBooks Pro.
- Copier and fax machine.
- Assorted furniture for the showroom.
- Storage shelving units.
- Assorted professional service providers fees including business, legal and accounting providers.
- Website development.
- Inventory for showroom.

| Start-up | |
| Requirements | |
| Start-up Expenses | |
| Legal | $2,000 |
| Stationery etc. | $500 |
| Brochures | $1,000 |
| Consultants | $3,000 |
| Website development | $15,000 |
| Total Start-up Expenses | $21,500 |
| Start-up Assets | |
| Cash Required | $62,000 |
| Other Current Assets | $6,500 |
| Long-term Assets | $35,000 |
| Total Assets | $103,500 |
| Total Requirements | $125,000 |
| Start-up Funding | |
| Start-up Expenses to Fund | $21,500 |
| Start-up Assets to Fund | $103,500 |
| Total Funding Required | $125,000 |
| Assets | |
| Non-cash Assets from Start-up | $41,500 |
| Cash Requirements from Start-up | $62,000 |
| Additional Cash Raised | $10,000 |
| Cash Balance on Starting Date | $72,000 |
| Total Assets | $113,500 |
| Liabilities and Capital | |
| Liabilities | |
| Current Borrowing | $0 |
| Long-term Liabilities | $0 |
| Accounts Payable (Outstanding Bills) | $0 |
| Other Current Liabilities (interest-free) | $0 |
| Total Liabilities | $0 |
| Capital | |
| Planned Investment | |
| Investor 1 | $75,000 |
| Investor 2 | $35,000 |
| Investor 3 | $25,000 |
| Additional Investment Requirement | $0 |
| Total Planned Investment | $135,000 |
| Loss at Start-up (Start-up Expenses) | ($21,500) |
| Total Capital | $113,500 |
| Total Capital and Liabilities | $113,500 |
| Total Funding | $135,000 |
Company Ownership
FireRescue Depot’s main shareholder in the S Corporation is Steve Dalmatian.
Products
FireRescue Depot sells fire and rescue hydraulic tools. These tools are the primary devices that fire and search and rescue departments use for car accidents, logging accidents, structural failures and other types of destruction. FireRescue Depot offers an impressive list of different manufacturers allowing the customer to choose the tool that best serves their needs. The main product categories are as follows:
- Rams are used for punching, pulling, shoring, stabilizing, or supporting. With up to 15,000 pounds of punching force, they can easily displace a dashboard, move a steering column, or stabilize a vehicle. Various sizes are sold.
- Cutters provide maximum cutting force and flexibility. A wide range of cutters is offered, from 20,000 to 94,000 pounds of pressure. The different models come in a variety of sizes, jaw designs, and shapes.
- Spreaders separate a variety of materials including metal, mass timber, etc. Various models offer a range of spreading distance (24-40 inches) and a range of spreading force (19,000 – 37,000 pounds).
- Combination tools mate cutters and spreaders into one tool. These are quite useful when you need to move metal and have the cutting power necessary for quick responses.
FireRescue Depot is differentiated from the competition by offering a wide selection from several manufacturers. Some of the represented manufacturers are:
- Hurst
- Rescue 42
- Ottawa River Fire Equipment
- Champion Rescue Tools
- Phoenix Rescue Equipment
Market Analysis Summary
FireRescue Depot has identified two distinct market segments to target; urban and rural fire/rescue departments. The general distinction between the two groups is the size of the population a department serves. The industry itself is primarily government based with few non-government agencies. The industry is predominantly male. FireRescue Depot faces competition from a number of companies, who all have a mail order and Internet presence.

Market Segmentation
FireRescue Depot has divided the market into two segments, urban and rural fire/rescue departments. The urban segment typically has 10 or more employees per department, and rural departments typically have fewer than 10. An urban department typically serves a population of over 10,000 people, while the rural departments serve less than 10,000 people.

| Market Analysis | |||||||
| Year 1 | Year 2 | Year 3 | Year 4 | Year 5 | |||
| Potential Customers | Growth | CAGR | |||||
| Urban departments | 8% | 3,435 | 3,710 | 4,007 | 4,328 | 4,674 | 8.00% |
| Rural departments | 7% | 8,787 | 9,402 | 10,060 | 10,764 | 11,517 | 7.00% |
| Total | 7.28% | 12,222 | 13,112 | 14,067 | 15,092 | 16,191 | 7.28% |
Target Market Segment Strategy
FireRescue Depot has chosen these two segments because they are the main purchasers of this type of equipment. While there are some private companies that use this type of equipment (such as timber companies, transportation companies, etc.), 97% of the business will be from the fire and rescue departments. These are very specialized tools, and fire and rescue departments have the specific needs that these tools serve. In essence this industry was developed as a response to the needs of fire and rescue departments. The only downside, as unavoidable as it may be, is that the two customer segments are part of the public sector, and therefore, their budgets are dependent upon the government budget process and public funding.
Industry Analysis
As mentioned in previous sections, the fire and rescue industry is almost always comprised of government agencies. Being a government agency is both positive and negative. It is positive because there is inherent stability in the fact that it is the government’s responsibility to ensure public safety. Conversely, each agency’s budget relies on government coffers which can fluctuate. The bottom line is that all departments need equipment, the question then becomes how often do they purchase new equipment.
The fire and rescue industry, the consumers of the FireRescue Depot’s products, have the following demographics:
- 90% have 10-hour day shifts and 14-hour night shifts.
- Participate in potentially dangerous activities with threats from: burning building materials, toxic fumes, toxic chemicals, falling building materials, chemical exposure.
- Employed by local governments.
- 95% of career firefighters are male.
- 99% of fire chiefs and officers are male.
- 61% of the career firefighters are ages 25-44.
- 31% of the career firefighters are ages 45-64.
- 8% of the career firefighters are under 25.
- 75% of the chiefs are 45-64.
- 25% of the chiefs are 25-44.
Trends within the industry include:
- Growth occurs alongside other parts of the economy such as transportation systems and urban centers.
- Volunteer departments are increasingly having difficulty recruiting and holding members as demand for the workers’ time increases.
- New chemicals, construction materials, building designs, and manufacturing materials all require additional training.
Competition and Buying Patterns
FireRescue Depot faces competition from four main sources. All four sources operate both a retail brick and mortar outlet and Internet/mail order presence. Because the market in any one geographic region is somewhat limited, having mail order sales and an eCommerce site enlarges the potential customer geographics to an acceptable figure.
The competition is:
- Galls Superstore- while this company sells hydraulic rescue equipment similar to FireRescue, their selection is quite limited.
- fireequipment.com- this company has some hydraulic equipment but much of their inventory is more fire oriented.
- Savelives.com- offers a good selection, not known for good customer service.
- The Firestore.com- has a fairly comprehensive selection that is limited by the number of manufacturers listed.
Typically departments make major purchases on a two-year cycle. Two-year cycles are the most common, because, after two years, tools are replaced to minimize the risk of failure during emergency use. The two-year cycle is of course dependent on the amount of use the tools get. Most manufacturers and fire/search & rescue departments’ policies indicate that two years is the typical lifespan of these tools. This takes into account use in emergencies as well as practice use. When a department is in need of tools they are given a budget by the city or whatever governing agency provides them with their budget and then they shop around. Requests for Proposals are rare in this industry.
The buying decision is made by the head of the fire/search & rescue department. After the department has reviewed the different options available they can decide what to purchase. The procedure for purchases varies from organization to organization, however it is very common for the city to provide the department with a set amount to of money and then allow the department to spend it as necessary. This makes sense since fire and rescue workers have far more knowledge regarding the specialized needs of the department than would a city treasurer or equivalent.
Strategy and Implementation Summary
FireRescue Depot will seek to become the premier fire and rescue hydraulic tool source in the country. This strategy will rely on a competitive edge and a strong marketing and sales campaign. FireRescue Depot will leverage their competitive edge of offering the finest selection of manufacturers’ products. The marketing campaign will seek to develop awareness of FireRescue Depot and the unmatched selection that they offer. The sales campaign will emphasize FireRescue Depot’s ability to offer the highest level of customer satisfaction in the industry.
Competitive Edge
FireRescue Depot’s competitive edge is their unmatched selection of models and manufacturers within the product lines that they offer. This variety of inventory is very difficult because of the capital requirements necessary to maintain inventory levels. FireRescue Depot avoids this pitfall by having negotiated arrangements with all of the top manufacturers. FireRescue Depot will have at least one example of each product in stock for the showroom, in return the manufacturers have agreed to drop ship future purchases directly to the customer. Having this arrangement in place means that FireRescue Depot is able to offer an unmatched selection without having large overhead. The manufacturers are happy to sell the products and drop ship them as long as FireRescue Depot has at least one example of every model in their showroom. This competitive edge of unmatched selection will be a sustainable advantage for FireRescue Depot.
Marketing Strategy
FireRescue Depot’s marketing strategy aims at increasing awareness of FireRescue Depot and their products within the targeted customer segments. Advertisements will be key in developing awareness. The main source of advertising will be National Fire and Rescue Magazine. This media source has over 35,000 rescue departments that consult the magazine, a 95.4% penetration rate. Advertisements in this periodical will provide FireRescue Depot with excellent exposure. Because the industry is so specialized, this is a wonderful resource since it is consulted by so many people. Additionally, advertisements are effective in generating customers because rarely does a department actually need to see the equipment. The equipment is similar from brand to brand, what separates the equipment are the product specifications. If a department is able to compare specifications they can make knowledgeable equipment choices. This of course lends itself to mail order/Internet sales where the customer might not be near a retail outlet. This reality of the industry supports FireRescue Depot’s idea that advertising will be an effective method of marketing.
Part of FireRescue Depot’s marketing strategy will be participation in the Firehouse World Expo. This exposition is the largest exposition in the country and is heavily attended by both product manufacturers and many fire/rescue departments. FireRescue Depot will operate a booth at the exposition. The key in the advertisements and the exposition is creating the image and awareness that FireRescue Depot is the number one source for fire and rescue hydraulic equipment. When any department needs the best selection of tools as well as the most useful advice regarding purchasing decisions, FireRescue Depot is the place to consult.
Milestones
FireRescue Depot has identified several milestones which will serve as organizational goals. The timetable is ambitious, but achievable. Please see the following table for a graphical representation of the milestones.

| Milestones | |||||
| Milestone | Start Date | End Date | Budget | Manager | Department |
| Business plan completion | 1/2/2003 | 4/15/2003 | $0 | Steve | Bus Dev |
| Open showroom | 1/2/2003 | 3/1/2003 | $0 | Steve | Sales |
| Internet site online | 1/2/2003 | 2/15/2003 | $0 | Steve | Sales |
| Exposition participation | 3/15/2003 | 4/28/2003 | $1,500 | Steve | Marketing |
| Revenues exceeding $100K | 1/2/2003 | 10/30/2003 | $0 | Steve | Sales |
| Profitability | 1/2/2003 | 10/30/2004 | $0 | Steve | Accounting |
| Totals | $1,500 | ||||
Sales Strategy
FireRescue Depot’s sales strategy is based on the premise that maintaining the highest level of customer service is the easiest way to create repeat customers. The premise is based on the fact that the industry is relatively small and specialized, and that it is important to be known for great customer service. Word travels fast within the industry. If a firm’s reputation is positive, the industry quickly becomes aware and sales spike upward.
All employees of FireRescue Depot will be given the tools/skills necessary to ensure that all customer interactions are positive. All employees will make sure customers leave happy. They will be taught how to remedy common problems or to enlist the help of their supervisor if they are unsure how to handle the situation. FireRescue Depot recognizes that while it may cost money to keep a customer happy in the short term, the long-term benefits of a happy and loyal customer outweigh any expenditures in the short term. This customer-centric sales strategy coupled with the marketing strategy and FireRescue Depot’s competitive edge will allow them to quickly gain market penetration.
Sales Forecast
The sales forecast has been developed from a conservative perspective to ensure that the sales targets are met. Sales will increase at a slow but steady pace. Sales are forecasted to make a jump after the Firehouse World Expo. FireRescue Depot’s presence at the Expo is expected to generate many sales and the forecasts reflect this.

| Sales Forecast | |||
| Year 1 | Year 2 | Year 3 | |
| Sales | |||
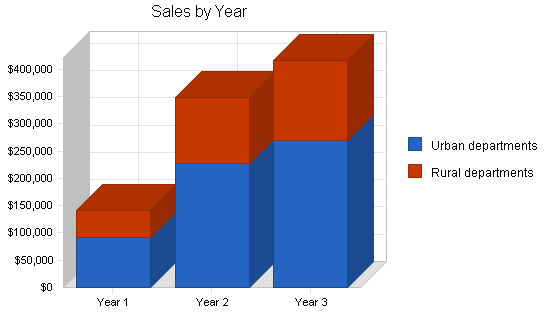
| Urban departments | $91,753 | $226,589 | $269,898 |
| Rural departments | $49,547 | $122,358 | $145,745 |
| Total Sales | $141,300 | $348,947 | $415,643 |
| Direct Cost of Sales | Year 1 | Year 2 | Year 3 |
| Urban departments | $35,784 | $88,370 | $105,260 |
| Rural departments | $19,323 | $47,720 | $56,841 |
| Subtotal Direct Cost of Sales | $55,107 | $136,089 | $162,101 |
Web Plan Summary
FireRescue will develop a website for both information and sales. Due to the geographic dispersion of potential customers, the website will serve as the main sales tool. In addition to placing an order on line, customers may call in orders. All available products will be featured on the website along with pertinent information. Product comparisons between the different manufacturers’ products will also be available on the site. Ease of use will be one of the primary design goals of the site allowing customers to easily and quickly navigate around the site, finding the information that they are seeking.
Website Marketing Strategy
FireRescue Depot will employ two different strategies for marketing the website. The first strategy is using a prominent display of the web address in all business literature, e.g. stationery, business cards, advertisements, etc. Anytime someone makes a purchase from FireRescue Depot the website will be advertised. The second method is through paid and non-paid placements in search engines. The paid aspect is “pay per click” in which FireRescue Depot is charged a small fee every time someone clicks through from an advertisement on a search engine page to the site. The non-paid method will be submission of the URL to all major search engines so that FireRescue Depot will show up when a prospective customer is searching for fire/rescue equipment.
Development Requirements
The website will require one full-time programmer to design and develop the site. By networking with the University of Chicago Computer Science Department FireRescue Depot will hire a graduate student who can devote a lot of time to the site.
Management Summary
Steve Dalmatian received his undergraduate degree in sociology from the University of Chicago. He wanted to take some time off, but knew he would later pursue an MBA, believing the skills taught in that program would be vital in his life.
Steve’s father was a career firefighter. He was able to secure an interview for Steve with the local fire department. Steve decided to apply, thinking the job would be good experience. Steve saw how much his father enjoyed firefighting and that helped him make the decision. Steve got the job and began basic training. After the 26 week session Steve was working full time with the department. Steve thought that there might be business opportunities related to firefighting because of its narrow scope. While working Steve studied all aspects of the agency hoping that some day he could start his own company in the industry.
After three years at the department, Steve decided to enroll in Loyola University’s MBA program. He concentrated his coursework within the Entrepreneurial Department recognizing that he wanted to start his own business. Toward the end of his second year Steve heard about a business plan competition that gave out $50,000 for the first place plan. After careful consideration, Steve decided to enter the competition with a plan that he would write for a vendor of fire and rescue tools. Steve won the competition and decided to use the money to pursue this opportunity.
Personnel Plan
- Steve: Sales, business development, managerial accounting, marketing
- Sales/procurement: Responsible for sales, procurement of products, and monitoring trends within the industry
- Customer service: Responsible for all customer contacts
- Administration: Responsibilities include a wide range of administrative tasks
- Accounting: Responsible for the bookkeeping
Financial Plan
The following sections outline important financial information.
Important Assumptions
The following table details relevant Financial Assumptions.
| General Assumptions | |||
| Year 1 | Year 2 | Year 3 | |
| Plan Month | 1 | 2 | 3 |
| Current Interest Rate | 10.00% | 10.00% | 10.00% |
| Long-term Interest Rate | 10.00% | 10.00% | 10.00% |
| Tax Rate | 30.00% | 30.00% | 30.00% |
| Other | 0 | 0 | 0 |
Break-even Analysis
The Break-even Analysis indicates what will be needed in monthly revenue to reach the break-even point.

| Break-even Analysis | |
| Monthly Revenue Break-even | $22,851 |
| Assumptions: | |
| Average Percent Variable Cost | 39% |
| Estimated Monthly Fixed Cost | $13,939 |
Projected Profit and Loss
The following table and charts illustrate the Projected Profit and Loss.


| Pro Forma Profit and Loss | |||
| Year 1 | Year 2 | Year 3 | |
| Sales | $141,300 | $348,947 | $415,643 |
| Direct Cost of Sales | $55,107 | $136,089 | $162,101 |
| Other Costs of Goods | $0 | $0 | $0 |
| Total Cost of Sales | $55,107 | $136,089 | $162,101 |
| Gross Margin | $86,193 | $212,858 | $253,542 |
| Gross Margin % | 61.00% | 61.00% | 61.00% |
| Expenses | |||
| Payroll | $117,800 | $156,400 | $160,400 |
| Sales and Marketing and Other Expenses | $5,300 | $3,600 | $3,600 |
| Depreciation | $6,996 | $6,996 | $6,996 |
| Rent | $12,000 | $13,000 | $14,000 |
| Utilities | $3,000 | $3,000 | $3,000 |
| Insurance | $3,000 | $3,000 | $3,000 |
| Payroll Taxes | $17,670 | $23,460 | $24,060 |
| Other | $1,500 | $1,500 | $1,500 |
| Total Operating Expenses | $167,266 | $210,956 | $216,556 |
| Profit Before Interest and Taxes | ($81,073) | $1,902 | $36,986 |
| EBITDA | ($74,077) | $8,898 | $43,982 |
| Interest Expense | $0 | $0 | $0 |
| Taxes Incurred | $0 | $571 | $11,096 |
| Net Profit | ($81,073) | $1,331 | $25,890 |
| Net Profit/Sales | -57.38% | 0.38% | 6.23% |
Projected Cash Flow
The following chart and table show the Projected Cash Flow.

| Pro Forma Cash Flow | |||
| Year 1 | Year 2 | Year 3 | |
| Cash Received | |||
| Cash from Operations | |||
| Cash Sales | $141,300 | $348,947 | $415,643 |
| Subtotal Cash from Operations | $141,300 | $348,947 | $415,643 |
| Additional Cash Received | |||
| Sales Tax, VAT, HST/GST Received | $0 | $0 | $0 |
| New Current Borrowing | $0 | $0 | $0 |
| New Other Liabilities (interest-free) | $0 | $0 | $0 |
| New Long-term Liabilities | $0 | $0 | $0 |
| Sales of Other Current Assets | $0 | $0 | $0 |
| Sales of Long-term Assets | $0 | $0 | $0 |
| New Investment Received | $0 | $0 | $0 |
| Subtotal Cash Received | $141,300 | $348,947 | $415,643 |
| Expenditures | Year 1 | Year 2 | Year 3 |
| Expenditures from Operations | |||
| Cash Spending | $117,800 | $156,400 | $160,400 |
| Bill Payments | $83,729 | $182,926 | $219,222 |
| Subtotal Spent on Operations | $201,529 | $339,326 | $379,622 |
| Additional Cash Spent | |||
| Sales Tax, VAT, HST/GST Paid Out | $0 | $0 | $0 |
| Principal Repayment of Current Borrowing | $0 | $0 | $0 |
| Other Liabilities Principal Repayment | $0 | $0 | $0 |
| Long-term Liabilities Principal Repayment | $0 | $0 | $0 |
| Purchase Other Current Assets | $0 | $0 | $0 |
| Purchase Long-term Assets | $0 | $0 | $0 |
| Dividends | $0 | $0 | $0 |
| Subtotal Cash Spent | $201,529 | $339,326 | $379,622 |
| Net Cash Flow | ($60,230) | $9,621 | $36,021 |
| Cash Balance | $11,770 | $21,391 | $57,412 |
Projected Balance Sheet
The following table presents the Projected Balance Sheet.
| Pro Forma Balance Sheet | |||
| Year 1 | Year 2 | Year 3 | |
| Assets | |||
| Current Assets | |||
| Cash | $11,770 | $21,391 | $57,412 |
| Other Current Assets | $6,500 | $6,500 | $6,500 |
| Total Current Assets | $18,270 | $27,891 | $63,912 |
| Long-term Assets | |||
| Long-term Assets | $35,000 | $35,000 | $35,000 |
| Accumulated Depreciation | $6,996 | $13,992 | $20,988 |
| Total Long-term Assets | $28,004 | $21,008 | $14,012 |
| Total Assets | $46,274 | $48,899 | $77,924 |
| Liabilities and Capital | Year 1 | Year 2 | Year 3 |
| Current Liabilities | |||
| Accounts Payable | $13,847 | $15,141 | $18,276 |
| Current Borrowing | $0 | $0 | $0 |
| Other Current Liabilities | $0 | $0 | $0 |
| Subtotal Current Liabilities | $13,847 | $15,141 | $18,276 |
| Long-term Liabilities | $0 | $0 | $0 |
| Total Liabilities | $13,847 | $15,141 | $18,276 |
| Paid-in Capital | $135,000 | $135,000 | $135,000 |
| Retained Earnings | ($21,500) | ($102,573) | ($101,242) |
| Earnings | ($81,073) | $1,331 | $25,890 |
| Total Capital | $32,427 | $33,758 | $59,648 |
| Total Liabilities and Capital | $46,274 | $48,899 | $77,924 |
| Net Worth | $32,427 | $33,758 | $59,648 |
Business Ratios
The following table displays common Business Ratios for both FireRescue Depot and the industry. Our SIC industry class is Firefighting and related equipment – 3569.02.
| Ratio Analysis | ||||
| Year 1 | Year 2 | Year 3 | Industry Profile | |
| Sales Growth | n.a. | 146.96% | 19.11% | -7.72% |
| Percent of Total Assets | ||||
| Other Current Assets | 14.05% | 13.29% | 8.34% | 21.77% |
| Total Current Assets | 39.48% | 57.04% | 82.02% | 76.03% |
| Long-term Assets | 60.52% | 42.96% | 17.98% | 23.97% |
| Total Assets | 100.00% | 100.00% | 100.00% | 100.00% |
| Current Liabilities | 29.92% | 30.96% | 23.45% | 32.40% |
| Long-term Liabilities | 0.00% | 0.00% | 0.00% | 16.93% |
| Total Liabilities | 29.92% | 30.96% | 23.45% | 49.33% |
| Net Worth | 70.08% | 69.04% | 76.55% | 50.67% |
| Percent of Sales | ||||
| Sales | 100.00% | 100.00% | 100.00% | 100.00% |
| Gross Margin | 61.00% | 61.00% | 61.00% | 34.31% |
| Selling, General & Administrative Expenses | 118.38% | 60.62% | 54.77% | 20.80% |
| Advertising Expenses | 0.00% | 0.00% | 0.00% | 0.62% |
| Profit Before Interest and Taxes | -57.38% | 0.54% | 8.90% | 2.52% |
| Main Ratios | ||||
| Current | 1.32 | 1.84 | 3.50 | 2.09 |
| Quick | 1.32 | 1.84 | 3.50 | 1.04 |
| Total Debt to Total Assets | 29.92% | 30.96% | 23.45% | 4.53% |
| Pre-tax Return on Net Worth | -250.02% | 5.63% | 62.01% | 54.20% |
| Pre-tax Return on Assets | -175.20% | 3.89% | 47.46% | 9.89% |
| Additional Ratios | Year 1 | Year 2 | Year 3 | |
| Net Profit Margin | -57.38% | 0.38% | 6.23% | n.a |
| Return on Equity | -250.02% | 3.94% | 43.40% | n.a |
| Activity Ratios | ||||
| Accounts Payable Turnover | 7.05 | 12.17 | 12.17 | n.a |
| Payment Days | 27 | 29 | 27 | n.a |
| Total Asset Turnover | 3.05 | 7.14 | 5.33 | n.a |
| Debt Ratios | ||||
| Debt to Net Worth | 0.43 | 0.45 | 0.31 | n.a |
| Current Liab. to Liab. | 1.00 | 1.00 | 1.00 | n.a |
| Liquidity Ratios | ||||
| Net Working Capital | $4,423 | $12,750 | $45,636 | n.a |
| Interest Coverage | 0.00 | 0.00 | 0.00 | n.a |
| Additional Ratios | ||||
| Assets to Sales | 0.33 | 0.14 | 0.19 | n.a |
| Current Debt/Total Assets | 30% | 31% | 23% | n.a |
| Acid Test | 1.32 | 1.84 | 3.50 | n.a |
| Sales/Net Worth | 4.36 | 10.34 | 6.97 | n.a |
| Dividend Payout | 0.00 | 0.00 | 0.00 | n.a |
Appendix
| Sales Forecast | |||||||||||||
| Month 1 | Month 2 | Month 3 | Month 4 | Month 5 | Month 6 | Month 7 | Month 8 | Month 9 | Month 10 | Month 11 | Month 12 | ||
| Sales | |||||||||||||
| Urban departments | 0% | $0 | $0 | $2,000 | $2,500 | $3,656 | $6,987 | $7,987 | $9,695 | $11,254 | $13,655 | $16,545 | $17,474 |
| Rural departments | 0% | $0 | $0 | $1,080 | $1,350 | $1,974 | $3,773 | $4,313 | $5,235 | $6,077 | $7,374 | $8,934 | $9,436 |
| Total Sales | $0 | $0 | $3,080 | $3,850 | $5,630 | $10,760 | $12,300 | $14,930 | $17,331 | $21,029 | $25,479 | $26,910 | |
| Direct Cost of Sales | Month 1 | Month 2 | Month 3 | Month 4 | Month 5 | Month 6 | Month 7 | Month 8 | Month 9 | Month 10 | Month 11 | Month 12 | |
| Urban departments | $0 | $0 | $780 | $975 | $1,426 | $2,725 | $3,115 | $3,781 | $4,389 | $5,325 | $6,453 | $6,815 | |
| Rural departments | $0 | $0 | $421 | $527 | $770 | $1,471 | $1,682 | $2,042 | $2,370 | $2,876 | $3,484 | $3,680 | |
| Subtotal Direct Cost of Sales | $0 | $0 | $1,201 | $1,502 | $2,196 | $4,196 | $4,797 | $5,823 | $6,759 | $8,201 | $9,937 | $10,495 | |
| Personnel Plan | |||||||||||||
| Month 1 | Month 2 | Month 3 | Month 4 | Month 5 | Month 6 | Month 7 | Month 8 | Month 9 | Month 10 | Month 11 | Month 12 | ||
| Steve | 0% | $2,000 | $2,000 | $2,000 | $2,000 | $2,000 | $2,000 | $2,000 | $2,000 | $2,000 | $2,000 | $2,000 | $2,000 |
| Sales/Procurement | 0% | $0 | $0 | $2,000 | $2,000 | $2,000 | $2,000 | $2,000 | $2,000 | $2,000 | $2,000 | $2,000 | $2,000 |
| Customer service | 0% | $0 | $0 | $2,000 | $2,000 | $2,000 | $2,000 | $2,000 | $2,000 | $2,000 | $2,000 | $2,000 | $2,000 |
| Customer service | 0% | $0 | $0 | $0 | $0 | $2,000 | $2,000 | $2,000 | $2,000 | $2,000 | $2,000 | $2,000 | $2,000 |
| Customer service | 0% | $0 | $0 | $0 | $0 | $0 | $0 | $2,000 | $2,000 | $2,000 | $2,000 | $2,000 | $2,000 |
| Administrative | 0% | $0 | $0 | $1,500 | $1,500 | $1,500 | $1,500 | $1,500 | $1,500 | $1,500 | $1,500 | $1,500 | $1,500 |
| Accounting | 0% | $0 | $0 | $0 | $1,200 | $1,200 | $1,200 | $1,200 | $1,200 | $1,200 | $1,200 | $1,200 | $1,200 |
| Total People | 1 | 1 | 4 | 5 | 6 | 6 | 7 | 7 | 7 | 7 | 7 | 7 | |
| Total Payroll | $2,000 | $2,000 | $7,500 | $8,700 | $10,700 | $10,700 | $12,700 | $12,700 | $12,700 | $12,700 | $12,700 | $12,700 | |
| General Assumptions | |||||||||||||
| Month 1 | Month 2 | Month 3 | Month 4 | Month 5 | Month 6 | Month 7 | Month 8 | Month 9 | Month 10 | Month 11 | Month 12 | ||
| Plan Month | 1 | 2 | 3 | 4 | 5 | 6 | 7 | 8 | 9 | 10 | 11 | 12 | |
| Current Interest Rate | 10.00% | 10.00% | 10.00% | 10.00% | 10.00% | 10.00% | 10.00% | 10.00% | 10.00% | 10.00% | 10.00% | 10.00% | |
| Long-term Interest Rate | 10.00% | 10.00% | 10.00% | 10.00% | 10.00% | 10.00% | 10.00% | 10.00% | 10.00% | 10.00% | 10.00% | 10.00% | |
| Tax Rate | 30.00% | 30.00% | 30.00% | 30.00% | 30.00% | 30.00% | 30.00% | 30.00% | 30.00% | 30.00% | 30.00% | 30.00% | |
| Other | 0 | 0 | 0 | 0 | 0 | 0 | 0 | 0 | 0 | 0 | 0 | 0 | |
| Pro Forma Profit and Loss | |||||||||||||
| Month 1 | Month 2 | Month 3 | Month 4 | Month 5 | Month 6 | Month 7 | Month 8 | Month 9 | Month 10 | Month 11 | Month 12 | ||
| Sales | $0 | $0 | $3,080 | $3,850 | $5,630 | $10,760 | $12,300 | $14,930 | $17,331 | $21,029 | $25,479 | $26,910 | |
| Direct Cost of Sales | $0 | $0 | $1,201 | $1,502 | $2,196 | $4,196 | $4,797 | $5,823 | $6,759 | $8,201 | $9,937 | $10,495 | |
| Other Costs of Goods | $0 | $0 | $0 | $0 | $0 | $0 | $0 | $0 | $0 | $0 | $0 | $0 | |
| Total Cost of Sales | $0 | $0 | $1,201 | $1,502 | $2,196 | $4,196 | $4,797 | $5,823 | $6,759 | $8,201 | $9,937 | $10,495 | |
| Gross Margin | $0 | $0 | $1,879 | $2,349 | $3,434 | $6,564 | $7,503 | $9,107 | $10,572 | $12,828 | $15,542 | $16,415 | |
| Gross Margin % | 0.00% | 0.00% | 61.00% | 61.00% | 61.00% | 61.00% | 61.00% | 61.00% | 61.00% | 61.00% | 61.00% | 61.00% | |
| Expenses | |||||||||||||
| Payroll | $2,000 | $2,000 | $7,500 | $8,700 | $10,700 | $10,700 | $12,700 | $12,700 | $12,700 | $12,700 | $12,700 | $12,700 | |
| Sales and Marketing and Other Expenses | $300 | $300 | $300 | $2,000 | $300 | $300 | $300 | $300 | $300 | $300 | $300 | $300 | |
| Depreciation | $583 | $583 | $583 | $583 | $583 | $583 | $583 | $583 | $583 | $583 | $583 | $583 | |
| Rent | $1,000 | $1,000 | $1,000 | $1,000 | $1,000 | $1,000 | $1,000 | $1,000 | $1,000 | $1,000 | $1,000 | $1,000 | |
| Utilities | $250 | $250 | $250 | $250 | $250 | $250 | $250 | $250 | $250 | $250 | $250 | $250 | |
| Insurance | $250 | $250 | $250 | $250 | $250 | $250 | $250 | $250 | $250 | $250 | $250 | $250 | |
| Payroll Taxes | 15% | $300 | $300 | $1,125 | $1,305 | $1,605 | $1,605 | $1,905 | $1,905 | $1,905 | $1,905 | $1,905 | $1,905 |
| Other | $125 | $125 | $125 | $125 | $125 | $125 | $125 | $125 | $125 | $125 | $125 | $125 | |
| Total Operating Expenses | $4,808 | $4,808 | $11,133 | $14,213 | $14,813 | $14,813 | $17,113 | $17,113 | $17,113 | $17,113 | $17,113 | $17,113 | |
| Profit Before Interest and Taxes | ($4,808) | ($4,808) | ($9,254) | ($11,865) | ($11,379) | ($8,249) | ($9,610) | ($8,006) | ($6,541) | ($4,285) | ($1,571) | ($698) | |
| EBITDA | ($4,225) | ($4,225) | ($8,671) | ($11,282) | ($10,796) | ($7,666) | ($9,027) | ($7,423) | ($5,958) | ($3,702) | ($988) | ($115) | |
| Interest Expense | $0 | $0 | $0 | $0 | $0 | $0 | $0 | $0 | $0 | $0 | $0 | $0 | |
| Taxes Incurred | $0 | $0 | $0 | $0 | $0 | $0 | $0 | $0 | $0 | $0 | $0 | $0 | |
| Net Profit | ($4,808) | ($4,808) | ($9,254) | ($11,865) | ($11,379) | ($8,249) | ($9,610) | ($8,006) | ($6,541) | ($4,285) | ($1,571) | ($698) | |
| Net Profit/Sales | 0.00% | 0.00% | -300.46% | -308.17% | -202.10% | -76.67% | -78.13% | -53.62% | -37.74% | -20.38% | -6.16% | -2.59% | |
| Pro Forma Cash Flow | |||||||||||||
| Month 1 | Month 2 | Month 3 | Month 4 | Month 5 | Month 6 | Month 7 | Month 8 | Month 9 | Month 10 | Month 11 | Month 12 | ||
| Cash Received | |||||||||||||
| Cash from Operations | |||||||||||||
| Cash Sales | $0 | $0 | $3,080 | $3,850 | $5,630 | $10,760 | $12,300 | $14,930 | $17,331 | $21,029 | $25,479 | $26,910 | |
| Subtotal Cash from Operations | $0 | $0 | $3,080 | $3,850 | $5,630 | $10,760 | $12,300 | $14,930 | $17,331 | $21,029 | $25,479 | $26,910 | |
| Additional Cash Received | |||||||||||||
| Sales Tax, VAT, HST/GST Received | 0.00% | $0 | $0 | $0 | $0 | $0 | $0 | $0 | $0 | $0 | $0 | $0 | $0 |
| New Current Borrowing | $0 | $0 | $0 | $0 | $0 | $0 | $0 | $0 | $0 | $0 | $0 | $0 | |
| New Other Liabilities (interest-free) | $0 | $0 | $0 | $0 | $0 | $0 | $0 | $0 | $0 | $0 | $0 | $0 | |
| New Long-term Liabilities | $0 | $0 | $0 | $0 | $0 | $0 | $0 | $0 | $0 | $0 | $0 | $0 | |
| Sales of Other Current Assets | $0 | $0 | $0 | $0 | $0 | $0 | $0 | $0 | $0 | $0 | $0 | $0 | |
| Sales of Long-term Assets | $0 | $0 | $0 | $0 | $0 | $0 | $0 | $0 | $0 | $0 | $0 | $0 | |
| New Investment Received | $0 | $0 | $0 | $0 | $0 | $0 | $0 | $0 | $0 | $0 | $0 | $0 | |
| Subtotal Cash Received | $0 | $0 | $3,080 | $3,850 | $5,630 | $10,760 | $12,300 | $14,930 | $17,331 | $21,029 | $25,479 | $26,910 | |
| Expenditures | Month 1 | Month 2 | Month 3 | Month 4 | Month 5 | Month 6 | Month 7 | Month 8 | Month 9 | Month 10 | Month 11 | Month 12 | |
| Expenditures from Operations | |||||||||||||
| Cash Spending | $2,000 | $2,000 | $7,500 | $8,700 | $10,700 | $10,700 | $12,700 | $12,700 | $12,700 | $12,700 | $12,700 | $12,700 | |
| Bill Payments | $74 | $2,225 | $2,293 | $4,324 | $6,408 | $5,792 | $7,756 | $8,661 | $9,684 | $10,637 | $12,089 | $13,786 | |
| Subtotal Spent on Operations | $2,074 | $4,225 | $9,793 | $13,024 | $17,108 | $16,492 | $20,456 | $21,361 | $22,384 | $23,337 | $24,789 | $26,486 | |
| Additional Cash Spent | |||||||||||||
| Sales Tax, VAT, HST/GST Paid Out | $0 | $0 | $0 | $0 | $0 | $0 | $0 | $0 | $0 | $0 | $0 | $0 | |
| Principal Repayment of Current Borrowing | $0 | $0 | $0 | $0 | $0 | $0 | $0 | $0 | $0 | $0 | $0 | $0 | |
| Other Liabilities Principal Repayment | $0 | $0 | $0 | $0 | $0 | $0 | $0 | $0 | $0 | $0 | $0 | $0 | |
| Long-term Liabilities Principal Repayment | $0 | $0 | $0 | $0 | $0 | $0 | $0 | $0 | $0 | $0 | $0 | $0 | |
| Purchase Other Current Assets | $0 | $0 | $0 | $0 | $0 | $0 | $0 | $0 | $0 | $0 | $0 | $0 | |
| Purchase Long-term Assets | $0 | $0 | $0 | $0 | $0 | $0 | $0 | $0 | $0 | $0 | $0 | $0 | |
| Dividends | $0 | $0 | $0 | $0 | $0 | $0 | $0 | $0 | $0 | $0 | $0 | $0 | |
| Subtotal Cash Spent | $2,074 | $4,225 | $9,793 | $13,024 | $17,108 | $16,492 | $20,456 | $21,361 | $22,384 | $23,337 | $24,789 | $26,486 | |
| Net Cash Flow | ($2,074) | ($4,225) | ($6,713) | ($9,174) | ($11,478) | ($5,733) | ($8,156) | ($6,431) | ($5,053) | ($2,309) | $690 | $424 | |
| Cash Balance | $69,926 | $65,701 | $58,988 | $49,814 | $38,337 | $32,604 | $24,448 | $18,017 | $12,964 | $10,655 | $11,346 | $11,770 | |
| Pro Forma Balance Sheet | |||||||||||||
| Month 1 | Month 2 | Month 3 | Month 4 | Month 5 | Month 6 | Month 7 | Month 8 | Month 9 | Month 10 | Month 11 | Month 12 | ||
| Assets | Starting Balances | ||||||||||||
| Current Assets | |||||||||||||
| Cash | $72,000 | $69,926 | $65,701 | $58,988 | $49,814 | $38,337 | $32,604 | $24,448 | $18,017 | $12,964 | $10,655 | $11,346 | $11,770 |
| Other Current Assets | $6,500 | $6,500 | $6,500 | $6,500 | $6,500 | $6,500 | $6,500 | $6,500 | $6,500 | $6,500 | $6,500 | $6,500 | $6,500 |
| Total Current Assets | $78,500 | $76,426 | $72,201 | $65,488 | $56,314 | $44,837 | $39,104 | $30,948 | $24,517 | $19,464 | $17,155 | $17,846 | $18,270 |
| Long-term Assets | |||||||||||||
| Long-term Assets | $35,000 | $35,000 | $35,000 | $35,000 | $35,000 | $35,000 | $35,000 | $35,000 | $35,000 | $35,000 | $35,000 | $35,000 | $35,000 |
| Accumulated Depreciation | $0 | $583 | $1,166 | $1,749 | $2,332 | $2,915 | $3,498 | $4,081 | $4,664 | $5,247 | $5,830 | $6,413 | $6,996 |
| Total Long-term Assets | $35,000 | $34,417 | $33,834 | $33,251 | $32,668 | $32,085 | $31,502 | $30,919 | $30,336 | $29,753 | $29,170 | $28,587 | $28,004 |
| Total Assets | $113,500 | $110,843 | $106,035 | $98,739 | $88,982 | $76,922 | $70,606 | $61,867 | $54,853 | $49,217 | $46,325 | $46,433 | $46,274 |
| Liabilities and Capital | Month 1 | Month 2 | Month 3 | Month 4 | Month 5 | Month 6 | Month 7 | Month 8 | Month 9 | Month 10 | Month 11 | Month 12 | |
| Current Liabilities | |||||||||||||
| Accounts Payable | $0 | $2,151 | $2,151 | $4,109 | $6,217 | $5,535 | $7,469 | $8,339 | $9,331 | $10,236 | $11,630 | $13,308 | $13,847 |
| Current Borrowing | $0 | $0 | $0 | $0 | $0 | $0 | $0 | $0 | $0 | $0 | $0 | $0 | $0 |
| Other Current Liabilities | $0 | $0 | $0 | $0 | $0 | $0 | $0 | $0 | $0 | $0 | $0 | $0 | $0 |
| Subtotal Current Liabilities | $0 | $2,151 | $2,151 | $4,109 | $6,217 | $5,535 | $7,469 | $8,339 | $9,331 | $10,236 | $11,630 | $13,308 | $13,847 |
| Long-term Liabilities | $0 | $0 | $0 | $0 | $0 | $0 | $0 | $0 | $0 | $0 | $0 | $0 | $0 |
| Total Liabilities | $0 | $2,151 | $2,151 | $4,109 | $6,217 | $5,535 | $7,469 | $8,339 | $9,331 | $10,236 | $11,630 | $13,308 | $13,847 |
| Paid-in Capital | $135,000 | $135,000 | $135,000 | $135,000 | $135,000 | $135,000 | $135,000 | $135,000 | $135,000 | $135,000 | $135,000 | $135,000 | $135,000 |
| Retained Earnings | ($21,500) | ($21,500) | ($21,500) | ($21,500) | ($21,500) | ($21,500) | ($21,500) | ($21,500) | ($21,500) | ($21,500) | ($21,500) | ($21,500) | ($21,500) |
| Earnings | $0 | ($4,808) | ($9,616) | ($18,870) | ($30,735) | ($42,113) | ($50,363) | ($59,973) | ($67,978) | ($74,519) | ($78,805) | ($80,375) | ($81,073) |
| Total Capital | $113,500 | $108,692 | $103,884 | $94,630 | $82,765 | $71,387 | $63,137 | $53,527 | $45,522 | $38,981 | $34,695 | $33,125 | $32,427 |
| Total Liabilities and Capital | $113,500 | $110,843 | $106,035 | $98,739 | $88,982 | $76,922 | $70,606 | $61,867 | $54,853 | $49,217 | $46,325 | $46,433 | $46,274 |
| Net Worth | $113,500 | $108,692 | $103,884 | $94,630 | $82,765 | $71,387 | $63,137 | $53,527 | $45,522 | $38,981 | $34,695 | $33,125 | $32,427 |

