
Green Investments
Executive Summary
Green Investments (GI) is a financial service company that focuses on stocks of environmentally responsible companies. The Washington-based L.L.C. is lead by Sarah Lewis and Steve Burke. GI uses financial research purchased from Bear Stearns and in-house environmental responsibility analysis to make recommendations to clients.
Services
GI has developed a criteria-based marker system which is easy and effective in evaluating a wide range of different companies on their environmental impact. Only financially prudent/performing companies are evaluated, ensuring that its recommendations make both financial and environmental sense.
Competitive Edge
GI will leverage the proprietory evaluation system to quickly gain market share. The system is convenient and based on extensive research, providing a streamlined overview of the environmental performance of the companies.
Market
GI will concentrate on the unserved niche of environmental investing within the financial services market. GI faces indirect competition from environmentally responsible mutual funds, which do a similar job in assessing a company’s environmental performance but do not allow for investing in individual equity.
Management Team
GI is lead by two experienced managers, Sarah Lewis, and Steve Burke. Sarah has a masters degree in environmental studies and has worked for the Environmental Protection Agency where she was responsible for preparing environmental impact statements. Steve has an MBA and has worked for Salomon Smith Barney where he developed an extensive amount of networking contacts.
GI addresses a previously ignored niche of the financial services market. GI will generate $230,000 and $261,000 in sales in year two and three respectively.

1.1 Objectives
- To become the premier environmental investment firm.
- Attract more people into making investments based on environmental actions of the prospective companies, in effect raising the awareness of and supporting investments in companies that act on environmental concerns.
- Continue to drive down the costs associated with investment research as it relates to environmental criteria.
1.2 Mission
Green Investments’ mission is to become the premier financial service organization that makes investment in companies with outstanding environmental records and practices. Green Investments, through comprehensive research and well thought out and verifiable marker criteria will be able to identify sound environmental investments. By offering the highest level of services, Green Investments will succeed as a company as well as have a positive impact on our environment.
1.3 Keys to Success
- Develop a workable, accurate set of environmental markers for a wide range of environmental impacts a company faces.
- Purchase high-quality financial performance investment research, recognizing that there is no value added for Green Investments doing this research themselves.
- Price the service so that there is a good profit margin while remaining competitive.
Company Summary
Green Investments is a Washington-based financial service company that is concentrating on the niche of environmentally responsible companies. The company is owned by Steve Burke and Sarah Lewis. It has been formed as a L.L.C.
2.1 Start-up Summary
The following equipment will be needed for start up:
- Phone system (5 line).
- Workstation computers (4), back end server, DSL Internet connection, and laser printer.
- Office furniture, meeting room and waiting room furniture.
- Monthly service charge for Bears Stearns software.
- Fax machine, copier, lighting, and assorted office supplies.
| Start-up | |
| Requirements | |
| Start-up Expenses | |
| Legal | $5,000 |
| Stationery etc. | $500 |
| Brochures | $500 |
| Licenses | $2,000 |
| Insurance | $500 |
| Research and Development | $9,000 |
| Other | $2,500 |
| Total Start-up Expenses | $20,000 |
| Start-up Assets | |
| Cash Required | $79,000 |
| Other Current Assets | $7,000 |
| Long-term Assets | $19,000 |
| Total Assets | $105,000 |
| Total Requirements | $125,000 |
| Start-up Funding | |
| Start-up Expenses to Fund | $20,000 |
| Start-up Assets to Fund | $105,000 |
| Total Funding Required | $125,000 |
| Assets | |
| Non-cash Assets from Start-up | $26,000 |
| Cash Requirements from Start-up | $79,000 |
| Additional Cash Raised | $0 |
| Cash Balance on Starting Date | $79,000 |
| Total Assets | $105,000 |
| Liabilities and Capital | |
| Liabilities | |
| Current Borrowing | $0 |
| Long-term Liabilities | $0 |
| Accounts Payable (Outstanding Bills) | $0 |
| Other Current Liabilities (interest-free) | $0 |
| Total Liabilities | $0 |
| Capital | |
| Planned Investment | |
| Investor 1 | $75,000 |
| Investor 2 | $50,000 |
| Additional Investment Requirement | $0 |
| Total Planned Investment | $125,000 |
| Loss at Start-up (Start-up Expenses) | ($20,000) |
| Total Capital | $105,000 |
| Total Capital and Liabilities | $105,000 |
| Total Funding | $125,000 |
2.2 Company Ownership
Steve Burke and Sarah Lewis equally own Green Investments. While they initially were going to create a S Corporation as the business formation, they decided to form as a L.L.C. as a means to avoid double taxation found with a corporation yet realizing the benefits of personal liability avoidance.
Services
Green Investments is a financial service company that offers investment advice specifically for stocks. GI purchases fiscal performance research from Bear Stearns, one of the highest respected firms in the market. In addition to solid financial performance criteria, GI has developed a set of environmental markers by which it can analyze and grade the attractiveness of the environmental impact that a company has.
As mentioned earlier, the economic performance of a company is rated by the financial firm Bear Stearns. Green Investments purchases Bear Stearns research based on recognition that there is no value added to do this research. The confidence of the research is quite high because of the firm performing it. If Bear Stearns’ research or another firm of comparable quality was not available Green Investments would have to rethink the decision to farm out this research.
Green Investments has developed a comprehensive set of environmental markers for which a company and their environmental impact can be evaluated. The following areas are evaluated:
- Energy usage
- Water usage
- Recycling program
- Paper consumption and procurement
- Chemical cleaning usage
- Ground maintenance impact
- Formal environmental policy
- Recycling rate
All of the markers include current, next stage, and long run benchmarks.
Green Investments takes the list of recommended investments from Bear Stearns and then applies environmental marker criteria to narrow the list down. The result is a list of possible investments (stocks) that are recommended because of their fiscal and environmental performance. Green Investments attempts to make evaluations of companies in a wide range of sectors allowing the customer to make the choice as to what type of company/industry that they would like to invest in.
Green Investments’ service charge is similar to a typical brokerage fee system based on a percentage. While Green Investments is a bit more expensive than other standard financial services companies because of the additional research required, the variance is not that material, particularly to customers that want good performing stocks but only want to invest with environmentally sound companies.
Several recent well respected studies indicate that “green” stocks are not inherently under performing. Actually it is just the reverse, companies that make decisions with environmental considerations in mind generally perform better.
Market Analysis Summary
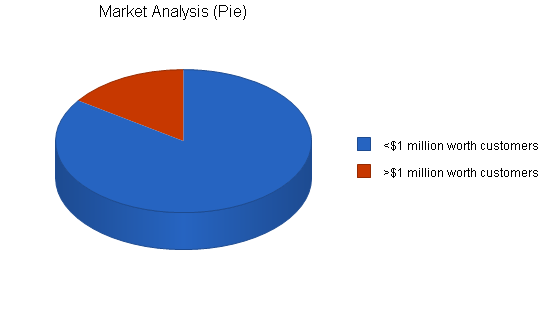
Green Investments has identified two distinct groups of target customers. These two groups of customers are distinguished by their household wealth. They have been grouped as customers with <$1 million and >$1 million in household wealth. The main characteristic that makes both of these groups so attractive is their desire to make a difference in the world by making investment decisions that take into account environmental factors.
The financial services industry has many different niches. Some advisors provide general investment services. Others will only offer one type of investments, maybe just mutual funds or might concentrate on bonds. Other service providers will concentrate on a specific niche like technology or socially responsible companies.
4.1 Market Segmentation
Green Investments has segmented the target market into two distinct groups. The groups can be differentiated by their difference in household wealth, households of <$1 million and >$1 million.
- <$1 million (household worth): These customers are middle class people who have a concern for the environment and are taking personal action through their choosing of stock investments based on companies with both strong economic and environmental performance records. Because these people do not have an over abundance of money they choose stocks that are of moderate risk. Generally, this group has 35%-45% of their portfolio in stocks, the remaining percentages in other types of investments.
- >$1 million (household worth): These customers are upper middle class to upper class. They have amassed over $1 million in savings and are fairly savvy investors (themselves or the people they hire). These people are generally concerned about the rate of return of their investments but also have environmental concerns.
Some characteristics that are shared by both target segments include:

- Vehicles are chosen with environmental concerns in mind. This means they are unlikely to own a SUV, they may in fact be one of the first adopters of the new hybrids (gas/electric vehicles).
- Many of the people commute by bike, car pool or use public transportation when possible.
- Active recyclers, both at work as well as at home.
- Retail purchases are made with environmental concerns in mind.
- A higher percentage of these people relative to the general population are vegetarians.
- For recreational sports, particularly outdoor sports, the people are more likely to enjoy hiking, XC skiing, and other human powered activities instead of golf, downhill skiing, snowmobiling, and jet skiing, all sports that are destructive to the environment.
| Market Analysis | |||||||
| Year 1 | Year 2 | Year 3 | Year 4 | Year 5 | |||
| Potential Customers | Growth | CAGR | |||||
| <$1 million worth customers | 8% | 1,232,000 | 1,330,560 | 1,437,005 | 1,551,965 | 1,676,122 | 8.00% |
| >$1 million worth customers | 7% | 223,090 | 238,706 | 255,415 | 273,294 | 292,425 | 7.00% |
| Total | 7.85% | 1,455,090 | 1,569,266 | 1,692,420 | 1,825,259 | 1,968,547 | 7.85% |
4.2 Target Market Segment Strategy
Green Investments has chosen the previously mentioned target market segments because of the ideological beliefs and the fact that these beliefs translate into the customer groups needing services that Green Investments can provide. While the people can always purchase shares of an environmentally responsible mutual fund, a way that they can exercise their beliefs, mutual funds are just one type of investments. The downside of investments are their relatively low rate of return (relative to good stocks) and the inability to receive personalized service and the ability to make custom choices beyond the type of mutual fund.
Therefore, Green Investments has chosen these specific customer segments because it is a market group that has unmet needs. These groups have the money and willingness for an environmental investment, yet their only current choice is a mutual fund. Green Investments has chosen to distinguish the two market segments by household worth since this characteristic provides useful behavioral information regarding the different people.
4.3 Service Business Analysis
Green Investments participates within the financial service industry. This multi-billion dollar ($14.8) industry services a wide range of people and companies with financial services such as investments. There are many different types of investments offered including but not limited to:
- Bonds
- Treasury bills
- Stocks, mutual funds
- Insurance policies
- Annuities
- IRAs
Within the industry, customers are served by a wide range of service providers including:
- Large national firms such as Merrill Lynch or Charles Schwaab
- Franchises
- Individual firms
- Online brokers
Buying decisions are often based on who you know or familiarity that the person may have with a specific company. Most of the service providers can provide a similar menu of investment options.
Fee structures vary from firm to firm. Many are percentage based on the amount of money the client investments. Some firms charge hourly rates while other firms charge a quarterly management fee. The fee structures are set in stone for some service providers while others take a more flexible approach and are willing to work with the customer to set up special arrangements.
4.3.1 Competition and Buying Patterns
Green Investments has no direct competitors that offer environmentally sound stock investment services. All of the current environmental investment options are mutual fund based. Examples of this type of mutual funds include Janus, Citizen Funds, Sierra Club Environmental Fund, and Portfolio 21.
Other competitors that Green Investments faces are the typical range of financial advisors. These indirect competitors provide customers with a wide range of different investment options. They could always place an investment order for a specific company, but these specific competitors do not do any independent research on the environmentalism of different companies.
Strategy and Implementation Summary
Green Investments will leverage its sustainable competitive edge of independent environmental research based on a custom set of criteria based markers for an objective measure of a company’s dedication to environmentalism. The competitive edge will be marketed by using the mantra of “think globally, act locally.” This marketing slogan will encourage people to do their part in regards to helping the environment through responsible investing. The sales campaign will rely on metrics that indicate environmental investments can and do outperform the S&P 500 Index.
5.1 Competitive Edge
Green Investments’ competitive edge is the environmental marker criteria that when applied indicates which economic performing companies with solid environmental commitments. The markers are effective for extremely valuable for several reasons:
- Meaningful: They are based on extensive research, providing a streamlined overview of the environmental performance of the companies.
- Context-based: Allows a high degree of comparability with similar businesses.
- Convenient: Far easier to use than large scale internal audits.
The key here is the fact that an objective, easy to apply, and accurate measurement system has been developed to provide environmental analysis for any company that has the markers applied to them. No one else offers this type of service as an information source for the decision making process of stock investments.
5.2 Marketing Strategy
“Think globally, act locally.” This well known and concise mantra simply suggests everyone should do their part. Green Investments services allows people to make investments based on their conscience. So many people want to do good but are unsure how to. Green Investments’ services allows people to do the right thing, with no real cost relative to the other options. Green Investments’ returns are better than the S&P 500 Index.
The marketing effort will concentrate on Green Investments’ ability to empower people to make a substantial difference in this world while getting a great return on their money. Green Investments will use magazine advertisements and community based marketing (networking, sponsorship and participation in seminars) to increase visibility for Green Investments and the services offered. The advertisements will be a steady way that people will become aware of the investment options as well as some visibility for the company itself. The community involvement implicitly accepts the premise that good business relies on networking (inter relationships, both business and personal) to be a significant source of business and good will. Green Investments will participate in numerous on-topic events and seminars that will display them as experts as well as give them a podium to describe the different services.
5.3 Sales Strategy
The sales strategy will rely on using quantitative evidence the recommended companies outperform the S&P 500 Index. In 1999-2001, Green Investments’ chosen companies outperformed the index by 2.4%. This is a significant amount. The sales strategy will concentrate on that by making smart green investments, you can achieve better then average returns on your money. A sales packet will be assembled and distributed to prospective customers that shows the better than average historic returns that Green Investments recommended companies enjoy.
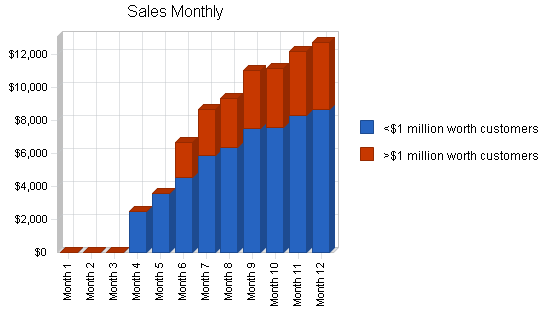
5.3.1 Sales Forecast
The sales forecast is being done in a conservative fashion to avoid any inflated expectations that might not be able to be obtained. The first several months will be slow. Green Investments has projected steady, incremental growth in sales. This can be explained as a function of the increased proficiency in terms of sales for Green Investments as well as an increased awareness of Green Investments by the target customers. Please review the following table and chart for numerical and graphical representations of the future year’s sales forecasts.
| Sales Forecast | |||
| Year 1 | Year 2 | Year 3 | |
| Sales | |||
| <$1 million worth customers | $54,746 | $156,665 | $178,225 |
| >$1 million worth customers | $22,889 | $73,633 | $83,766 |
| Total Sales | $77,635 | $230,298 | $261,991 |
| Direct Cost of Sales | Year 1 | Year 2 | Year 3 |
| <$1 million worth customers | $8,212 | $23,500 | $26,734 |
| >$1 million worth customers | $3,433 | $11,045 | $12,565 |
| Subtotal Direct Cost of Sales | $11,645 | $34,545 | $39,299 |
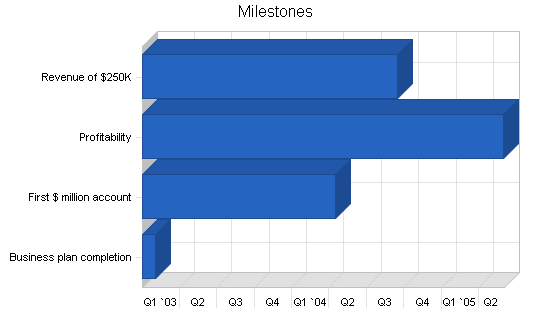
5.4 Milestones
Green Investments has identified several milestones which will act as ambitious yet achievable goals for the organization. By establishing the goals, the need to reach them will develop an implicit incentive for all organizational members to work hard to achieve the milestones.
- Business plan completion: The business plan is the roadmap for the organization. There is value in the process of the writing of the business plan, forcing the writers to analyze a multitude of issues.
- First account of over $1 million invested: This would be a significant amount of money for an individual account and the organization will strive to achieve many of these customers.
- Profitability: An eventual necessity.
- Revenue of $250,000: With the achievement of this milestone and the previous one, there will be a clear reaffirmation that the business model is successful.
| Milestones | |||||
| Milestone | Start Date | End Date | Budget | Manager | Department |
| Business plan completion | 1/1/2003 | 2/1/2003 | $0 | Sarah & Steve | Planning |
| First $ million account | 1/1/2003 | 4/15/2004 | $0 | Sarah | Sales |
| Profitability | 1/1/2003 | 6/1/2005 | $0 | Steve | Accounting |
| Revenue of $250K | 1/1/2003 | 9/15/2004 | $0 | Sarah | Sales |
| Totals | $0 | ||||
Management Summary
Green Investments will be lead by the founding team of Sarah Lewis and Steve Burke. Sarah has an undergraduate and Masters in environmental studies from the University of Burlington. After Sarah obtained the degrees she moved to Washington DC where she worked for the Environmental Protection Agency (EPA) for four years, performing environmental impact statements for a variety of industries, companies, and projects. Sarah was also a project manager for Janus in their evaluation department where they performed company wide environmental assessments of companies that were perspective investments for the fund.
The other member of Green Investments management team is Steve Burke. Steve hails from a financial background. Steve has an undergraduate degree in Finance from Seattle University and a MBA from the University of Washington. After school Steve went to work for Salomon Smith Barney in their investment department for eight years.
7.1 Personnel Plan
- Sarah: Company research, development of markers, sales.
- Steve: Sales, accounting and finance, account management, and marketing.
- Account manager: Customer support for their investment accounts.
- Administrative assistant: Assorted odd and ends.
- Bookkeeper: Handles the day to day accounts receivables and payable duties.
- Research assistant: Assisting Sarah on her research.
The positions will be phased in on an as needed basis. Please review the following chart for personnel forecasts.
| Personnel Plan | |||
| Year 1 | Year 2 | Year 3 | |
| Sarah | $30,000 | $40,000 | $40,000 |
| Steve | $30,000 | $40,000 | $40,000 |
| Account Manager | $27,000 | $36,000 | $36,000 |
| Administrative Assistant | $15,000 | $15,000 | $15,000 |
| Bookkeeper | $10,000 | $12,000 | $12,000 |
| Research Assistant | $8,250 | $9,000 | $9,000 |
| Total People | 6 | 6 | 6 |
| Total Payroll | $120,250 | $152,000 | $152,000 |
Financial Plan
The following sections will outline important financial information.
8.1 Important Assumptions
The following table details important Financial Assumptions.
| General Assumptions | |||
| Year 1 | Year 2 | Year 3 | |
| Plan Month | 1 | 2 | 3 |
| Current Interest Rate | 10.00% | 10.00% | 10.00% |
| Long-term Interest Rate | 10.00% | 10.00% | 10.00% |
| Tax Rate | 30.00% | 30.00% | 30.00% |
| Other | 0 | 0 | 0 |
8.2 Break-even Analysis
The Break-even Analysis is shown in the following table and chart.

| Break-even Analysis | |
| Monthly Revenue Break-even | $15,225 |
| Assumptions: | |
| Average Percent Variable Cost | 15% |
| Estimated Monthly Fixed Cost | $12,941 |
8.3 Projected Profit and Loss
The following table will indicate Projected Profit and Loss.


| Pro Forma Profit and Loss | |||
| Year 1 | Year 2 | Year 3 | |
| Sales | $77,635 | $230,298 | $261,991 |
| Direct Cost of Sales | $11,645 | $34,545 | $39,299 |
| Other Costs of Sales | $0 | $0 | $0 |
| Total Cost of Sales | $11,645 | $34,545 | $39,299 |
| Gross Margin | $65,990 | $195,753 | $222,692 |
| Gross Margin % | 85.00% | 85.00% | 85.00% |
| Expenses | |||
| Payroll | $120,250 | $152,000 | $152,000 |
| Sales and Marketing and Other Expenses | $0 | $0 | $0 |
| Depreciation | $3,804 | $317 | $317 |
| Rent | $7,800 | $7,800 | $7,800 |
| Utilities | $1,800 | $1,800 | $1,800 |
| Insurance | $1,800 | $1,800 | $1,800 |
| Payroll Taxes | $18,038 | $22,800 | $22,800 |
| Other | $1,800 | $1,800 | $1,800 |
| Total Operating Expenses | $155,292 | $188,317 | $188,317 |
| Profit Before Interest and Taxes | ($89,301) | $7,436 | $34,375 |
| EBITDA | ($85,497) | $7,753 | $34,692 |
| Interest Expense | $73 | $220 | $120 |
| Taxes Incurred | $0 | $2,165 | $10,277 |
| Net Profit | ($89,374) | $5,051 | $23,979 |
| Net Profit/Sales | -115.12% | 2.19% | 9.15% |
8.4 Projected Cash Flow
The following table and chart will indicate Projected Cash Flow.

| Pro Forma Cash Flow | |||
| Year 1 | Year 2 | Year 3 | |
| Cash Received | |||
| Cash from Operations | |||
| Cash Sales | $77,635 | $230,298 | $261,991 |
| Subtotal Cash from Operations | $77,635 | $230,298 | $261,991 |
| Additional Cash Received | |||
| Sales Tax, VAT, HST/GST Received | $0 | $0 | $0 |
| New Current Borrowing | $3,000 | $0 | $0 |
| New Other Liabilities (interest-free) | $0 | $0 | $0 |
| New Long-term Liabilities | $0 | $0 | $0 |
| Sales of Other Current Assets | $0 | $0 | $0 |
| Sales of Long-term Assets | $0 | $0 | $0 |
| New Investment Received | $0 | $0 | $0 |
| Subtotal Cash Received | $80,635 | $230,298 | $261,991 |
| Expenditures | Year 1 | Year 2 | Year 3 |
| Expenditures from Operations | |||
| Cash Spending | $120,250 | $152,000 | $152,000 |
| Bill Payments | $38,394 | $71,497 | $84,646 |
| Subtotal Spent on Operations | $158,644 | $223,497 | $236,646 |
| Additional Cash Spent | |||
| Sales Tax, VAT, HST/GST Paid Out | $0 | $0 | $0 |
| Principal Repayment of Current Borrowing | $300 | $1,000 | $1,000 |
| Other Liabilities Principal Repayment | $0 | $0 | $0 |
| Long-term Liabilities Principal Repayment | $0 | $0 | $0 |
| Purchase Other Current Assets | $0 | $0 | $0 |
| Purchase Long-term Assets | $0 | $0 | $0 |
| Dividends | $0 | $0 | $0 |
| Subtotal Cash Spent | $158,944 | $224,497 | $237,646 |
| Net Cash Flow | ($78,308) | $5,801 | $24,345 |
| Cash Balance | $692 | $6,492 | $30,837 |
8.5 Projected Balance Sheet
The following table will indicate the Projected Balance Sheet.
| Pro Forma Balance Sheet | |||
| Year 1 | Year 2 | Year 3 | |
| Assets | |||
| Current Assets | |||
| Cash | $692 | $6,492 | $30,837 |
| Other Current Assets | $7,000 | $7,000 | $7,000 |
| Total Current Assets | $7,692 | $13,492 | $37,837 |
| Long-term Assets | |||
| Long-term Assets | $19,000 | $19,000 | $19,000 |
| Accumulated Depreciation | $3,804 | $4,121 | $4,438 |
| Total Long-term Assets | $15,196 | $14,879 | $14,562 |
| Total Assets | $22,888 | $28,371 | $52,399 |
| Liabilities and Capital | Year 1 | Year 2 | Year 3 |
| Current Liabilities | |||
| Accounts Payable | $4,561 | $5,994 | $7,043 |
| Current Borrowing | $2,700 | $1,700 | $700 |
| Other Current Liabilities | $0 | $0 | $0 |
| Subtotal Current Liabilities | $7,261 | $7,694 | $7,743 |
| Long-term Liabilities | $0 | $0 | $0 |
| Total Liabilities | $7,261 | $7,694 | $7,743 |
| Paid-in Capital | $125,000 | $125,000 | $125,000 |
| Retained Earnings | ($20,000) | ($109,374) | ($104,323) |
| Earnings | ($89,374) | $5,051 | $23,979 |
| Total Capital | $15,626 | $20,677 | $44,656 |
| Total Liabilities and Capital | $22,888 | $28,371 | $52,399 |
| Net Worth | $15,626 | $20,677 | $44,656 |
8.6 Business Ratios
The following table indicates Business Ratios found within the industry of financial services as well as ratios specific to Green Investments. Please note that while there are some similarities between the general financial service industry and Green Investments, GI is more unusual in that they do their own assessment of companies, beyond typical research.
| Ratio Analysis | ||||
| Year 1 | Year 2 | Year 3 | Industry Profile | |
| Sales Growth | 0.00% | 196.64% | 13.76% | 8.79% |
| Percent of Total Assets | ||||
| Other Current Assets | 30.58% | 24.67% | 13.36% | 44.18% |
| Total Current Assets | 33.61% | 47.56% | 72.21% | 76.27% |
| Long-term Assets | 66.39% | 52.44% | 27.79% | 23.73% |
| Total Assets | 100.00% | 100.00% | 100.00% | 100.00% |
| Current Liabilities | 31.73% | 27.12% | 14.78% | 38.61% |
| Long-term Liabilities | 0.00% | 0.00% | 0.00% | 13.60% |
| Total Liabilities | 31.73% | 27.12% | 14.78% | 52.21% |
| Net Worth | 68.27% | 72.88% | 85.22% | 47.79% |
| Percent of Sales | ||||
| Sales | 100.00% | 100.00% | 100.00% | 100.00% |
| Gross Margin | 85.00% | 85.00% | 85.00% | 100.00% |
| Selling, General & Administrative Expenses | 200.12% | 82.81% | 75.85% | 82.68% |
| Advertising Expenses | 0.00% | 0.00% | 0.00% | 1.66% |
| Profit Before Interest and Taxes | -115.03% | 3.23% | 13.12% | 1.37% |
| Main Ratios | ||||
| Current | 1.06 | 1.75 | 4.89 | 1.59 |
| Quick | 1.06 | 1.75 | 4.89 | 1.22 |
| Total Debt to Total Assets | 31.73% | 27.12% | 14.78% | 3.09% |
| Pre-tax Return on Net Worth | -571.95% | 34.90% | 76.71% | 60.22% |
| Pre-tax Return on Assets | -390.49% | 25.43% | 65.37% | 7.76% |
| Additional Ratios | Year 1 | Year 2 | Year 3 | |
| Net Profit Margin | -115.12% | 2.19% | 9.15% | n.a |
| Return on Equity | -571.95% | 24.43% | 53.70% | n.a |
| Activity Ratios | ||||
| Accounts Payable Turnover | 9.42 | 12.17 | 12.17 | n.a |
| Payment Days | 27 | 26 | 28 | n.a |
| Total Asset Turnover | 3.39 | 8.12 | 5.00 | n.a |
| Debt Ratios | ||||
| Debt to Net Worth | 0.46 | 0.37 | 0.17 | n.a |
| Current Liab. to Liab. | 1.00 | 1.00 | 1.00 | n.a |
| Liquidity Ratios | ||||
| Net Working Capital | $430 | $5,798 | $30,094 | n.a |
| Interest Coverage | -1,231.74 | 33.80 | 286.46 | n.a |
| Additional Ratios | ||||
| Assets to Sales | 0.29 | 0.12 | 0.20 | n.a |
| Current Debt/Total Assets | 32% | 27% | 15% | n.a |
| Acid Test | 1.06 | 1.75 | 4.89 | n.a |
| Sales/Net Worth | 4.97 | 11.14 | 5.87 | n.a |
| Dividend Payout | 0.00 | 0.00 | 0.00 | n.a |
Appendix
| Sales Forecast | |||||||||||||
| Month 1 | Month 2 | Month 3 | Month 4 | Month 5 | Month 6 | Month 7 | Month 8 | Month 9 | Month 10 | Month 11 | Month 12 | ||
| Sales | |||||||||||||
| <$1 million worth customers | 0% | $0 | $0 | $0 | $2,500 | $3,545 | $4,545 | $5,878 | $6,335 | $7,474 | $7,558 | $8,255 | $8,656 |
| >$1 million worth customers | 0% | $0 | $0 | $0 | $0 | $0 | $2,136 | $2,763 | $2,977 | $3,513 | $3,552 | $3,880 | $4,068 |
| Total Sales | $0 | $0 | $0 | $2,500 | $3,545 | $6,681 | $8,641 | $9,312 | $10,987 | $11,110 | $12,135 | $12,724 | |
| Direct Cost of Sales | Month 1 | Month 2 | Month 3 | Month 4 | Month 5 | Month 6 | Month 7 | Month 8 | Month 9 | Month 10 | Month 11 | Month 12 | |
| <$1 million worth customers | $0 | $0 | $0 | $375 | $532 | $682 | $882 | $950 | $1,121 | $1,134 | $1,238 | $1,298 | |
| >$1 million worth customers | $0 | $0 | $0 | $0 | $0 | $320 | $414 | $447 | $527 | $533 | $582 | $610 | |
| Subtotal Direct Cost of Sales | $0 | $0 | $0 | $375 | $532 | $1,002 | $1,296 | $1,397 | $1,648 | $1,667 | $1,820 | $1,909 | |
| Personnel Plan | |||||||||||||
| Month 1 | Month 2 | Month 3 | Month 4 | Month 5 | Month 6 | Month 7 | Month 8 | Month 9 | Month 10 | Month 11 | Month 12 | ||
| Sarah | 0% | $2,500 | $2,500 | $2,500 | $2,500 | $2,500 | $2,500 | $2,500 | $2,500 | $2,500 | $2,500 | $2,500 | $2,500 |
| Steve | 0% | $2,500 | $2,500 | $2,500 | $2,500 | $2,500 | $2,500 | $2,500 | $2,500 | $2,500 | $2,500 | $2,500 | $2,500 |
| Account Manager | 0% | $0 | $0 | $1,500 | $2,000 | $2,500 | $3,000 | $3,000 | $3,000 | $3,000 | $3,000 | $3,000 | $3,000 |
| Administrative Assistant | 0% | $0 | $0 | $1,500 | $1,500 | $1,500 | $1,500 | $1,500 | $1,500 | $1,500 | $1,500 | $1,500 | $1,500 |
| Bookkeeper | 0% | $0 | $0 | $1,000 | $1,000 | $1,000 | $1,000 | $1,000 | $1,000 | $1,000 | $1,000 | $1,000 | $1,000 |
| Research Assistant | 0% | $0 | $750 | $750 | $750 | $750 | $750 | $750 | $750 | $750 | $750 | $750 | $750 |
| Total People | 2 | 3 | 6 | 6 | 6 | 6 | 6 | 6 | 6 | 6 | 6 | 6 | |
| Total Payroll | $5,000 | $5,750 | $9,750 | $10,250 | $10,750 | $11,250 | $11,250 | $11,250 | $11,250 | $11,250 | $11,250 | $11,250 | |
| General Assumptions | |||||||||||||
| Month 1 | Month 2 | Month 3 | Month 4 | Month 5 | Month 6 | Month 7 | Month 8 | Month 9 | Month 10 | Month 11 | Month 12 | ||
| Plan Month | 1 | 2 | 3 | 4 | 5 | 6 | 7 | 8 | 9 | 10 | 11 | 12 | |
| Current Interest Rate | 10.00% | 10.00% | 10.00% | 10.00% | 10.00% | 10.00% | 10.00% | 10.00% | 10.00% | 10.00% | 10.00% | 10.00% | |
| Long-term Interest Rate | 10.00% | 10.00% | 10.00% | 10.00% | 10.00% | 10.00% | 10.00% | 10.00% | 10.00% | 10.00% | 10.00% | 10.00% | |
| Tax Rate | 30.00% | 30.00% | 30.00% | 30.00% | 30.00% | 30.00% | 30.00% | 30.00% | 30.00% | 30.00% | 30.00% | 30.00% | |
| Other | 0 | 0 | 0 | 0 | 0 | 0 | 0 | 0 | 0 | 0 | 0 | 0 | |
| Pro Forma Profit and Loss | |||||||||||||
| Month 1 | Month 2 | Month 3 | Month 4 | Month 5 | Month 6 | Month 7 | Month 8 | Month 9 | Month 10 | Month 11 | Month 12 | ||
| Sales | $0 | $0 | $0 | $2,500 | $3,545 | $6,681 | $8,641 | $9,312 | $10,987 | $11,110 | $12,135 | $12,724 | |
| Direct Cost of Sales | $0 | $0 | $0 | $375 | $532 | $1,002 | $1,296 | $1,397 | $1,648 | $1,667 | $1,820 | $1,909 | |
| Other Costs of Sales | $0 | $0 | $0 | $0 | $0 | $0 | $0 | $0 | $0 | $0 | $0 | $0 | |
| Total Cost of Sales | $0 | $0 | $0 | $375 | $532 | $1,002 | $1,296 | $1,397 | $1,648 | $1,667 | $1,820 | $1,909 | |
| Gross Margin | $0 | $0 | $0 | $2,125 | $3,013 | $5,679 | $7,345 | $7,916 | $9,339 | $9,444 | $10,315 | $10,816 | |
| Gross Margin % | 0.00% | 0.00% | 0.00% | 85.00% | 85.00% | 85.00% | 85.00% | 85.00% | 85.00% | 85.00% | 85.00% | 85.00% | |
| Expenses | |||||||||||||
| Payroll | $5,000 | $5,750 | $9,750 | $10,250 | $10,750 | $11,250 | $11,250 | $11,250 | $11,250 | $11,250 | $11,250 | $11,250 | |
| Sales and Marketing and Other Expenses | $0 | $0 | $0 | $0 | $0 | $0 | $0 | $0 | $0 | $0 | $0 | $0 | |
| Depreciation | $317 | $317 | $317 | $317 | $317 | $317 | $317 | $317 | $317 | $317 | $317 | $317 | |
| Rent | $650 | $650 | $650 | $650 | $650 | $650 | $650 | $650 | $650 | $650 | $650 | $650 | |
| Utilities | $150 | $150 | $150 | $150 | $150 | $150 | $150 | $150 | $150 | $150 | $150 | $150 | |
| Insurance | $150 | $150 | $150 | $150 | $150 | $150 | $150 | $150 | $150 | $150 | $150 | $150 | |
| Payroll Taxes | 15% | $750 | $863 | $1,463 | $1,538 | $1,613 | $1,688 | $1,688 | $1,688 | $1,688 | $1,688 | $1,688 | $1,688 |
| Other | $150 | $150 | $150 | $150 | $150 | $150 | $150 | $150 | $150 | $150 | $150 | $150 | |
| Total Operating Expenses | $7,167 | $8,030 | $12,630 | $13,205 | $13,780 | $14,355 | $14,355 | $14,355 | $14,355 | $14,355 | $14,355 | $14,355 | |
| Profit Before Interest and Taxes | ($7,167) | ($8,030) | ($12,630) | ($11,080) | ($10,766) | ($8,676) | ($7,010) | ($6,439) | ($5,016) | ($4,911) | ($4,040) | ($3,539) | |
| EBITDA | ($6,850) | ($7,713) | ($12,313) | ($10,763) | ($10,449) | ($8,359) | ($6,693) | ($6,122) | ($4,699) | ($4,594) | ($3,723) | ($3,222) | |
| Interest Expense | $0 | $0 | $0 | $0 | $0 | $0 | $0 | $0 | $0 | $25 | $25 | $23 | |
| Taxes Incurred | $0 | $0 | $0 | $0 | $0 | $0 | $0 | $0 | $0 | $0 | $0 | $0 | |
| Net Profit | ($7,167) | ($8,030) | ($12,630) | ($11,080) | ($10,766) | ($8,676) | ($7,010) | ($6,439) | ($5,016) | ($4,936) | ($4,065) | ($3,561) | |
| Net Profit/Sales | 0.00% | 0.00% | 0.00% | -443.18% | -303.70% | -129.85% | -81.13% | -69.14% | -45.65% | -44.43% | -33.50% | -27.99% | |
| Pro Forma Cash Flow | |||||||||||||
| Month 1 | Month 2 | Month 3 | Month 4 | Month 5 | Month 6 | Month 7 | Month 8 | Month 9 | Month 10 | Month 11 | Month 12 | ||
| Cash Received | |||||||||||||
| Cash from Operations | |||||||||||||
| Cash Sales | $0 | $0 | $0 | $2,500 | $3,545 | $6,681 | $8,641 | $9,312 | $10,987 | $11,110 | $12,135 | $12,724 | |
| Subtotal Cash from Operations | $0 | $0 | $0 | $2,500 | $3,545 | $6,681 | $8,641 | $9,312 | $10,987 | $11,110 | $12,135 | $12,724 | |
| Additional Cash Received | |||||||||||||
| Sales Tax, VAT, HST/GST Received | 0.00% | $0 | $0 | $0 | $0 | $0 | $0 | $0 | $0 | $0 | $0 | $0 | $0 |
| New Current Borrowing | $0 | $0 | $0 | $0 | $0 | $0 | $0 | $0 | $0 | $3,000 | $0 | $0 | |
| New Other Liabilities (interest-free) | $0 | $0 | $0 | $0 | $0 | $0 | $0 | $0 | $0 | $0 | $0 | $0 | |
| New Long-term Liabilities | $0 | $0 | $0 | $0 | $0 | $0 | $0 | $0 | $0 | $0 | $0 | $0 | |
| Sales of Other Current Assets | $0 | $0 | $0 | $0 | $0 | $0 | $0 | $0 | $0 | $0 | $0 | $0 | |
| Sales of Long-term Assets | $0 | $0 | $0 | $0 | $0 | $0 | $0 | $0 | $0 | $0 | $0 | $0 | |
| New Investment Received | $0 | $0 | $0 | $0 | $0 | $0 | $0 | $0 | $0 | $0 | $0 | $0 | |
| Subtotal Cash Received | $0 | $0 | $0 | $2,500 | $3,545 | $6,681 | $8,641 | $9,312 | $10,987 | $14,110 | $12,135 | $12,724 | |
| Expenditures | Month 1 | Month 2 | Month 3 | Month 4 | Month 5 | Month 6 | Month 7 | Month 8 | Month 9 | Month 10 | Month 11 | Month 12 | |
| Expenditures from Operations | |||||||||||||
| Cash Spending | $5,000 | $5,750 | $9,750 | $10,250 | $10,750 | $11,250 | $11,250 | $11,250 | $11,250 | $11,250 | $11,250 | $11,250 | |
| Bill Payments | $62 | $1,854 | $1,983 | $2,578 | $3,020 | $3,262 | $3,799 | $4,087 | $4,193 | $4,437 | $4,484 | $4,636 | |
| Subtotal Spent on Operations | $5,062 | $7,604 | $11,733 | $12,828 | $13,770 | $14,512 | $15,049 | $15,337 | $15,443 | $15,687 | $15,734 | $15,886 | |
| Additional Cash Spent | |||||||||||||
| Sales Tax, VAT, HST/GST Paid Out | $0 | $0 | $0 | $0 | $0 | $0 | $0 | $0 | $0 | $0 | $0 | $0 | |
| Principal Repayment of Current Borrowing | $0 | $0 | $0 | $0 | $0 | $0 | $0 | $0 | $0 | $0 | $0 | $300 | |
| Other Liabilities Principal Repayment | $0 | $0 | $0 | $0 | $0 | $0 | $0 | $0 | $0 | $0 | $0 | $0 | |
| Long-term Liabilities Principal Repayment | $0 | $0 | $0 | $0 | $0 | $0 | $0 | $0 | $0 | $0 | $0 | $0 | |
| Purchase Other Current Assets | $0 | $0 | $0 | $0 | $0 | $0 | $0 | $0 | $0 | $0 | $0 | $0 | |
| Purchase Long-term Assets | $0 | $0 | $0 | $0 | $0 | $0 | $0 | $0 | $0 | $0 | $0 | $0 | |
| Dividends | $0 | $0 | $0 | $0 | $0 | $0 | $0 | $0 | $0 | $0 | $0 | $0 | |
| Subtotal Cash Spent | $5,062 | $7,604 | $11,733 | $12,828 | $13,770 | $14,512 | $15,049 | $15,337 | $15,443 | $15,687 | $15,734 | $16,186 | |
| Net Cash Flow | ($5,062) | ($7,604) | ($11,733) | ($10,328) | ($10,225) | ($7,831) | ($6,409) | ($6,025) | ($4,456) | ($1,577) | ($3,599) | ($3,461) | |
| Cash Balance | $73,938 | $66,335 | $54,602 | $44,275 | $34,049 | $26,218 | $19,809 | $13,785 | $9,329 | $7,752 | $4,153 | $692 | |
| Pro Forma Balance Sheet | |||||||||||||
| Month 1 | Month 2 | Month 3 | Month 4 | Month 5 | Month 6 | Month 7 | Month 8 | Month 9 | Month 10 | Month 11 | Month 12 | ||
| Assets | Starting Balances | ||||||||||||
| Current Assets | |||||||||||||
| Cash | $79,000 | $73,938 | $66,335 | $54,602 | $44,275 | $34,049 | $26,218 | $19,809 | $13,785 | $9,329 | $7,752 | $4,153 | $692 |
| Other Current Assets | $7,000 | $7,000 | $7,000 | $7,000 | $7,000 | $7,000 | $7,000 | $7,000 | $7,000 | $7,000 | $7,000 | $7,000 | $7,000 |
| Total Current Assets | $86,000 | $80,938 | $73,335 | $61,602 | $51,275 | $41,049 | $33,218 | $26,809 | $20,785 | $16,329 | $14,752 | $11,153 | $7,692 |
| Long-term Assets | |||||||||||||
| Long-term Assets | $19,000 | $19,000 | $19,000 | $19,000 | $19,000 | $19,000 | $19,000 | $19,000 | $19,000 | $19,000 | $19,000 | $19,000 | $19,000 |
| Accumulated Depreciation | $0 | $317 | $634 | $951 | $1,268 | $1,585 | $1,902 | $2,219 | $2,536 | $2,853 | $3,170 | $3,487 | $3,804 |
| Total Long-term Assets | $19,000 | $18,683 | $18,366 | $18,049 | $17,732 | $17,415 | $17,098 | $16,781 | $16,464 | $16,147 | $15,830 | $15,513 | $15,196 |
| Total Assets | $105,000 | $99,621 | $91,701 | $79,651 | $69,007 | $58,464 | $50,316 | $43,590 | $37,249 | $32,476 | $30,582 | $26,666 | $22,888 |
| Liabilities and Capital | Month 1 | Month 2 | Month 3 | Month 4 | Month 5 | Month 6 | Month 7 | Month 8 | Month 9 | Month 10 | Month 11 | Month 12 | |
| Current Liabilities | |||||||||||||
| Accounts Payable | $0 | $1,788 | $1,897 | $2,477 | $2,912 | $3,136 | $3,663 | $3,947 | $4,045 | $4,288 | $4,330 | $4,478 | $4,561 |
| Current Borrowing | $0 | $0 | $0 | $0 | $0 | $0 | $0 | $0 | $0 | $0 | $3,000 | $3,000 | $2,700 |
| Other Current Liabilities | $0 | $0 | $0 | $0 | $0 | $0 | $0 | $0 | $0 | $0 | $0 | $0 | $0 |
| Subtotal Current Liabilities | $0 | $1,788 | $1,897 | $2,477 | $2,912 | $3,136 | $3,663 | $3,947 | $4,045 | $4,288 | $7,330 | $7,478 | $7,261 |
| Long-term Liabilities | $0 | $0 | $0 | $0 | $0 | $0 | $0 | $0 | $0 | $0 | $0 | $0 | $0 |
| Total Liabilities | $0 | $1,788 | $1,897 | $2,477 | $2,912 | $3,136 | $3,663 | $3,947 | $4,045 | $4,288 | $7,330 | $7,478 | $7,261 |
| Paid-in Capital | $125,000 | $125,000 | $125,000 | $125,000 | $125,000 | $125,000 | $125,000 | $125,000 | $125,000 | $125,000 | $125,000 | $125,000 | $125,000 |
| Retained Earnings | ($20,000) | ($20,000) | ($20,000) | ($20,000) | ($20,000) | ($20,000) | ($20,000) | ($20,000) | ($20,000) | ($20,000) | ($20,000) | ($20,000) | ($20,000) |
| Earnings | $0 | ($7,167) | ($15,197) | ($27,826) | ($38,906) | ($49,672) | ($58,347) | ($65,357) | ($71,796) | ($76,812) | ($81,748) | ($85,813) | ($89,374) |
| Total Capital | $105,000 | $97,833 | $89,804 | $77,174 | $66,095 | $55,328 | $46,653 | $39,643 | $33,204 | $28,188 | $23,252 | $19,187 | $15,626 |
| Total Liabilities and Capital | $105,000 | $99,621 | $91,701 | $79,651 | $69,007 | $58,464 | $50,316 | $43,590 | $37,249 | $32,476 | $30,582 | $26,666 | $22,888 |
| Net Worth | $105,000 | $97,833 | $89,804 | $77,174 | $66,095 | $55,328 | $46,653 | $39,643 | $33,204 | $28,188 | $23,252 | $19,187 | $15,626 |

