
Domino Comptech Holdings
Executive Summary
Domino Comptech Holdings (DCH) was formed as a diversified financial holding company. The purpose of the company is to facilitate the acquisition of existing companies and provide additional capital to continue and increase the volume and the profitability of the acquired companies.
The overall business model created by establishing and funding this holding company effectively creates a complete business solution platform of unlimited marketing opportunities. This platform combines certain natural relationship marketing synergies and enables the combined companies to provide a wide variety of complete technology solutions at cost savings to the client.
Acquire an Internet Service Provider:
Domino Comptech acquired 100% of ZumoNet, an Internet Service Provider (ISP) company from Lynx Caracal last year in exchange for 1,500,000 shares of common stock of DCH. The company intends to enter into a marketing plan to expand ZumoNet’s customer base and drive additional recurring revenue. ZumoNet presently yields a revenue stream of approximately $20,000 annually and requires a record keeping and billing expense of approximately $3,600 annually. Expanding the marketing base of the company will yield increased profits proportionately as the revenue stream increases and the expense factor is held at minimal levels through consolidation of the record keeping merging into the overall operations of the holding company.
Acquire a Technology company which is a White Box computer manufacturer and also provides networking services and support:
Domino Comptech has entered into an agreement to acquire 100% of the common stock of Kettle-Moraine Computers, Incorporated (KMCI) from its founder Lynx Caracal in exchange for 20,000,000 shares of common stock of DCH and a loan of $5,000,000 bearing interest at the applicable federal rate for the first year and adjusted to the prime rate plus 1% with a minimum of 9% thereafter. The prime rate shall be as published in USA Today. This agreement allows Domino Comptech to immediately acquire and control 100% of KMCI including the revenue stream generated by daily operations. Mr. Caracal will receive guaranteed payments of at least $16,000 per month with the remaining interest payments due at December 31 each year until the stock loan is paid in full from proceeds raised from the first $16,000,000 in stock sales in this business plan. Mr. Caracal agreed to extend the loan period to five years from the signature date of the agreement to allow DCH five years to achieve its goals of capitalization and repayment of the loan. All the stock of KMCI will be held as collateral on this loan in the event of default.
KMCI provides technology hardware and servicing to its customer base, primarily in Gulfstate and Plainsstate. The business model of KMCI is directed toward becoming a Midwestern (and then national) full service Technology provider. The company has developed remarkable marketing inroads into state government procurement contracts and is presently moving into the Federal Government arena to facilitate expanded marketing opportunities of its manufactured computer products and servicing capabilities. Recently the company implemented a marketing strategy through it’s S.E.A.T. management program. Client’s will have the opportunity to purchase all their technology required hardware, software packages, and needed service protection all for one monthly fee. This concept of purchasing technology will allow the client to have access to the latest available equivalent while utilizing cost saving software packages that are tailored for that client’s data system needs.
Acquire a Software company which has a first class management software program:
DCH has identified a software company which developed and markets a strategic software program designed to help businesses better manage and increase profitability. Initial discussions with management of the company indicate the company can be purchased for approximately $87,000,000. The software company produces an EBITD of approximately $1,000,000 annually, has total assets of approximately $8,000,000 and equity of approximately $4,300,000.
The combination of the software company, ZumoNet and KMCI will capitalize on a marketing synergy brought about by the ability to cross market hardware and software products to the present client base of the companies and provide a total solution to address technology and management needs of business. It is anticipated the elimination of duplication between the companies will generate savings of approximately $500,000 annually.
Acquire a Technology Services company which specializes in data storage, telephony and security:
KMCI presently offers a variety of service, wiring, and network solutions. However, as technology is rapidly evolving there is a need to expand into data storage, telephony, and security issues. Government, banks, insurance companies and many other industries need these additional services as they worry about storage and security issues for large amounts of data. There is a need to develop a tailored secure system to protect each of their data systems from fraud, terrorism and/or natural disaster on a client-by-client basis.
Lynx Caracal, president of Domino Comptech Holdings has identified service providers which specialize in these additional services and begun acquisition discussions with one such company. This acquisition would further leverage the existing total solutions provided by the concatenation of a software company, KMCI, and ZumoNet. The end result would be a marketing force which could provide any entity with a total technology, management, and security solution. This synergy does not generally exist in the marketplace today. The capability of large corporate clients to afford and purchase these packages provides stability of income desired for DCH and insures the company of income diversification which will carry the company through uncontrollable downturn in the economy.
To accomplish this strategy, DCH has already completed first round funding of one million dollars ($1,000,000), and the board of directors is currently considering extending Phase II funding in the form of a Regulation 506 D private placement offering in the amount of 22 million dollars.
1.1 Objectives
- Acquire a Technology company which is a White Box computer manufacturer, and which also provides networking services and support.
- Acquire a Software company which has a first class management software program.
- Acquire a Technology Services company which specializes in data storage, telephony, and security.
1.2 Mission
Domino Comptech Holdings is a holding company. The purpose of the company is to facilitate the acquisition of existing companies and provide additional capital to increase the volume and the profitability of the acquired companies. This holding company creates a complete business solution platform of unlimited marketing opportunities. This platform combines certain marketing synergies and enables the combined companies to provide a wide variety of complete technology solutions at cost savings to the client.
1.3 About This Plan
Form Follows Function
This is the business plan for the holding company, Domino Comptech Holdings. However, for some key points we show the numbers that DCH expects from the KMCI division, its main revenue-generator. Specifically:
- The Sales Forecast table indicates the actual and projected sales that DCH expects from the KMCI division.
- The Personnel Plan table shows only the principals in the holding company. Other personnel costs, for the divisions, appear as a summary item only, in the projected Profit and Loss.
- The Profit and Loss table includes only very summarized projections of the divisions, and only the sales and costs of sales of the main (KMCI) division.
- The Cash Flow table presents a summarized and consolidated general cash flow that includes the assumed cash flow of the divisions, in aggregate and summary form.
- Many discussions focus on the holding company operations only. For example, the personnel plan discussion text presents the holding company only. Detailed personnel of the separate divisions are not included in this plan.
1.4 Keys to Success
The keys to success in this business are:

- Maintain and increase product quality by keeping the total product failure rate of Kettle-Moraine Computers, Inc., at or below the current level of five percent.
- Successfully market the S.E.A.T. management program.
- Successfully acquire an existing software company with positive cash flow, existing assets (building, land, and equipment), of at least three million dollars, and with an existing top notch management team.

Company Summary
Domino Comptech Holdings, (DCH) was formed under the laws of the State of Gulfstate, as a diversified financial holding company. The purpose of Domino Comptech Holdings is to facilitate the acquisition of existing companies and provide additional capital to increase the volume and the profitability of the acquired companies.
2.1 Company History
Domino Comptech Holdings, a financial holding company, was incorporated as a Gulfstate corporation in 2002. DCH has purchased existing companies that are revenue producing and have a history of strong revenue production, existing buildings, equipment, vehicles, employees and a minimum of 10 years of profitable business.
Kettle-Moraine Computers, Inc.
Last year, DCH purchased Kettle-Moraine Computers, Inc., (KMCI) a Gulfstate corporation that was started in 1990 by Lynx Caracal. Under his direction, the company has developed into a full-service provider of computer hardware and services. Aside from assembling and selling a trademarked brand of PCs, servers and laptops, KMCI is an authorized reseller or service provider for numerous leaders in the IT industry, such as Compaq, Dell, Gateway, Okidata, Enterasys, World Wide Technology, Structure Wise, Lexmark, Hewlett-Packard, Novell, Panasonic, Cisco, IBM and Nortel Networks.
In order to provide a full range of quality services, KMCI employs skilled and certified professionals that hold certifications including A+, Microsoft Certified Professional (MCP), ASE, Microsoft Certified System Engineer (MCSE), Novell CNA and CNE, ACT Compaq, Cisco, CCNA, IBM, Lexmark, Hewlett-Packard, Network + and Networking Essentials. These professionals have successfully fulfilled statewide hardware and maintenance contracts. As a part of those contracts they currently provide on-site service for computers in every county in the state of Gulfstate. In addition, they have contracts in parts of other states, such as Plainsstate and Hillystate.
ZumoNet
Also in Q4 last year, Domino Comptech purchased ZumoNet, an Internet Service Provider (ISP). ZumoNet was wholly owned by Lynx Caracal, and was merged via a stock swap. DCH received 100% of the shares, both issued and unissued, of the ISP, in exchange for 1,500,000 shares of DCH common stock. In addition to the customer base of the ISP, DCH receives an annual revenue stream of $20,000 annually. The total expenses of the ISP is only $3,600 showing a total annual profit of $16,400. ZumoNet service fees are small in comparison to AOL, Sprint, and Bell; however, ZumoNet only offers a 56K dial-up connection for a monthly fee of twenty dollars for unlimited access. The price for the service is on a sliding scale based on the type of billing; for example, Bi-Annual unlimited access is one hundred dollars, and if the customer pays annually the fee drops to a total of one hundred dollars. In addition, there is a one time sign-up fee of five dollars. DCH is currently investigating the most cost effective way to increase the ISP’s service to include DSL, T-1, and T-4; however, with the announcement of Sprint shutting down its ISP service, we are carefully looking at the ISP business model to make sure that the new services we offer are competitive and profitable. For this reason, we do not expect to increase our service offering within the next year.
Past Performance
Our past performance indicates the overall decline that effected the technology sector over the past three years. In the beginning of Year 1, we have seen a significant up-turn in the number of orders placed through our sales department. The management believes that this increase is directly related to:
- Companies and other entities, especially the state of Gulfstate, which previously had their budgets frozen, are now purchasing new hardware and software.
- The Governor of the state of Gulfstate has signed an executive order to enforce a Gulfstate state law making it mandatory that all state offices purchase equipment and services from companies which are based in Gulfstate. DCH maintains its corporate headquarters and plant facilities in Central City, the capital of Gulfstate.
- The implementation of the S.E.A.T.* Management program for all business, and educational institutions.
- The expansion of the S.E.A.T. Management program into the surrounding states.
*S.E.A.T. (Shrinking Expenses Advancing Technology) Management is a combined product/service offering whereby institutions can contract with us to outsource their full IT needs (hardware, software, service, tech support, and product replacement) on a three year renewable contract. This is discussed fully under Products and Services, below.
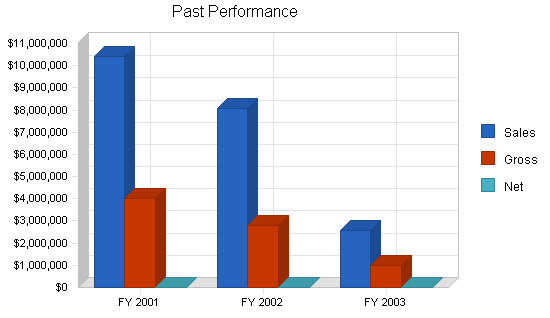
| Past Performance | |||
| FY 2001 | FY 2002 | FY 2003 | |
| Sales | $10,392,811 | $8,090,275 | $2,557,055 |
| Gross Margin | $4,019,873 | $2,814,145 | $977,387 |
| Gross Margin % | 38.68% | 34.78% | 38.22% |
| Operating Expenses | $3,975,828 | $3,622,506 | $1,288,385 |
| Collection Period (days) | 33 | 41 | 102 |
| Inventory Turnover | 8.76 | 8.19 | 3.01 |
| Balance Sheet | |||
| FY 2001 | FY 2002 | FY 2003 | |
| Current Assets | |||
| Cash | $24,045 | $13,239 | $7,709 |
| Accounts Receivable | $940,059 | $857,610 | $572,109 |
| Inventory | $727,207 | $561,143 | $487,587 |
| Other Current Assets | $385,915 | $190,731 | $193,429 |
| Total Current Assets | $2,077,226 | $1,622,723 | $1,260,834 |
| Long-term Assets | |||
| Long-term Assets | $1,396,982 | $1,464,032 | $1,479,498 |
| Accumulated Depreciation | $952,728 | $1,087,047 | $166,002 |
| Total Long-term Assets | $444,254 | $376,985 | $1,313,496 |
| Total Assets | $2,521,480 | $1,999,708 | $2,574,330 |
| Current Liabilities | |||
| Accounts Payable | $663,740 | $509,665 | $166,002 |
| Current Borrowing | $0 | $0 | $370,126 |
| Other Current Liabilities (interest free) | $246,210 | $637,873 | $335,462 |
| Total Current Liabilities | $909,950 | $1,147,538 | $871,590 |
| Long-term Liabilities | $2,221,869 | $2,091,938 | $1,973,421 |
| Total Liabilities | $3,131,819 | $3,239,476 | $2,845,011 |
| Paid-in Capital | $676,193 | $676,193 | $676,193 |
| Retained Earnings | ($1,286,532) | ($1,915,961) | ($946,874) |
| Earnings | $0 | $0 | $0 |
| Total Capital | ($610,339) | ($1,239,768) | ($270,681) |
| Total Capital and Liabilities | $2,521,480 | $1,999,708 | $2,574,330 |
| Other Inputs | |||
| Payment Days | 38 | 35 | 38 |
| Sales on Credit | $10,392,811 | $8,090,275 | $2,557,055 |
| Receivables Turnover | 11.06 | 9.43 | 4.47 |
2.2 Company Ownership
The company is a privately-held C corporation owned in majority by its founders, officers, and directors. There are thirteen shareholders with a total of 33,258,080 common shares. There are four major shareholders:
| Lynx Caracal | 19,733,040 shares |
| Kit Puma | 9,000,000 shares |
| Neve Palenque | 1,500,000 shares |
| Minerva Astarte | 1,204,800 shares |
2.3 Company Locations and Facilities
DCH is currently located in Central City, Gulfstate, and housed within the corporate administrative offices of Kettle-Moraine Computers. While we are in the same location as KMCI, we do maintain totally separate offices, with our own entrance and individual offices for Kit Puma and Tulum Margay, and we share a conference room with KMCI.
KMCI currently leases approximately 1,338 square feet of office space, divided into three separate locations within the same property. The KMCI retail space is located at street level, with good signage, directly across from the Capital Mall (a shopping mall with anchor tenants of JC Penny, Sears, and Dillards). In addition, immediately across the street are a large bank and a supermarket. From these three locations, the Kettle-Moraine Computers retail center is clearly visible. The KMCI retail center isn’t completely dependent on foot traffic for their sales, since KMCI does have a sales force.
The balance of the KMCI leased space is in two second-story office spaces. The administrative office, sales office, conference room, and the two offices used by Domino Comptech Holdings are located upstairs in suites on the third floor. KMCI also rents a third floor suite, which is Lynx Caracal’s private office.
KMCI also owns a 100,000 square foot building that houses the computer production facility with plenty of additional land for future explanation.
Products and Services
DCH provides the management, marketing, and financial expertise to assist those companies that we acquire in continuing to maintain a strong and steady growth pattern.
Kettle-Moraine is especially focused on providing network systems and services to small, medium, and large businesses. The systems include both PC-based LAN systems and minicomputer server-based systems. Our services include design and installation of network systems, servers, and printers in addition to full training, and support. KMCI’s production department assembles the branded lines of servers, workstations, and laptops where each phase of the production process is governed by an ISO 9001:2000 Quality Management System. This certification is also registered through British Standards Institution, Inc.
3.1 Product and Service Description
The hardware provided to KMCI’s customers includes servers, workstations, laptops, and network hardware. KMCI’s production department assembles the branded lines of servers, workstations, and laptops where each phase of the production process is governed by an ISO 9001:2000 Quality Management System. This certification is registered through British Standards Institution, Inc. KMCI is also a charter member of the North American System Builders Association (NASBA). Lynx Caracal, President and CEO of KMCI, currently serves on NASBA’s Board of Directors.
KMCI was the second company in North America to be ISO 9001:2000 certified to the newest standard by the British Standards Institute, the largest of six ISO auditors worldwide. Certification to ISO Standards for procedures and policies ensures KMCI products and services will be of consistently high quality, offering higher levels of assurance to KMCI customers. This certification allows KMCI the unique ability to compete for state, federal and international contracts as more companies require ISO certification in bid proposals.
KMCI’s trained engineers provide a full range of services. They are matched with the company’s experience in Local Area Networks (LAN), Wide Area Networks (WAN), and both single and multiple server installations. Network engineers hold certifications including Novell, Microsoft, Sun Microsystems, Cisco, Unix and Citrix.
KMCI provides on-site and remote services through trained professionals for the company’s branded product lines, as well as for IBM, Compaq, Lexmark, Hewlett-Packard, Dell, Gateway and others. The infrastructure services offered by KMCI include data network wiring, telephone cabling, CATV wiring, fiber optic cable, and wireless connection.
3.2 Competitive Comparison
Domino Comptech Holdings doesn’t compete with any other companies in or around Central City, the State of Gulfstate, or in the neighboring states; however, KMCI is in direct competition with several companies.
KMCI competes with IBM, Gateway, Dell, and Compaq and all original equipment manufacturers (OEMs). Recently Compaq, as well as many other OEM’s, announced they will focus more on computer services rather than hardware sales. KMCI has already capitalized on this strategy and will continue to place an emphasis on the company’s services, which have a proven higher margin than product assembly.
KMCIs greatest advantages over its competition are:
- We sell, build, test, and ship directly from our own facilities.
- We maintain a 5% or less failure rate.
- We have designed and Implemented Shrinking Expenses Advancing Technology (S.E.A.T.) Management
The S.E.A.T. Management program allows companies, institutions, schools, colleges, universities, and state government offices to purchase the technology (hardware, servers, printers, software, networks, on-site service, and help desk) as a line item expense (over a three year contract). When the contract terminates we remove the old technology, and replace it with brand new technology. The result is a guaranteed new sale every three years. Full disclosure and sales information are contained in the marketing section of the business plan.
3.3 Sales Literature
DCH is a holding company and as such doesn’t use sales literature; however, the companies that we own do. Samples of those pieces are attached.
3.4 Future Products and Services
Benefits of Acquiring a Software Company
Domino Comptech Holdings is aware of several companies which provide integrated business software solutions. These software programs generally provide fundamental business process management as well as expanded functions for multi-location product distribution, inventory management, customer service contract management, field service operations, help desk and sales force automation.
This type of system is designed to improve business operational performance and provide knowledge in order to achieve profitable growth. Generally these companies have a strategic focus on one industry, which makes their company dominant in their market. These companies have a proven track record of a long-term loyal customer base, positive cash flow, internally-generated capital and a very positive bottom line.
DCH proposes to acquire a software company such as this and use KMCI’s relationships and positions in the computer industry to enable the software company access to a vast new market of computer dealers. In addition, DCH will introduce the concept of S.E.A.T. Management to the new and existing software customers. This will allow them to forego the major up-front capital investment needed to update hardware and change software. In place of the traditional up-front cash outlay, the business will pay a license fee per month for each terminal, which will include all hardware, network and software services.
There is a large potential market of small dealers who have, in the past, been unable to afford the up-front capital expenditure required to purchase the product. By providing them a total solution which includes application software, hardware, and services, the newly merged company will drive sales and profits to a previously unreachable customer base.
The first step in conducting the merger will be to consolidate back room services. Upon completion of this consolidation, other departments will undergo integration based on further analysis. An effective integration of the companies is anticipated for completion within one year. The merger will result in the following outcomes:
- Creation of a business culture focused on fast growth.
- Completion of the graphic user-interfacing project within six months. Movement of the product to a SQL database platform.
- Launch of the product into several other verticals (computer dealers and the medical industry being the first targets).
- Provision of true business consultation.
- Acquisition of additional technical employees by relocating Programming and Development to a major metropolitan area (if deemed necessary).
- Increase deployment by delivering the software application via the ASP model* (defined below) for low-end users and customers that want to outsource their entire IT services.
*Definition of ASP: Application System Providers enable the use of business applications through the Internet and other low-cost communications vehicles. ASPs offer organizations low overhead combined with cost-effective and timely use of strategic business solutions. Using browsers or other thin client types of access, these customers — primarily small or mid-tier organizations — subscribe to the ASP’s applications. These applications include supply chain integration, distribution and human resource management. Using the ASP model, the customer is not required to purchase the hardware, operating systems, databases, licenses, IT staff, and ongoing overhead associated with buying or building an application. A subscription application offers end-user organizations an option more affordable and efficient than buying and maintaining a private network.
Benefits of Acquisitions of Storage, Telephony and Security company
The evolution of technology and services, combined with recent terrorist events, has created a new emphasis on storage, telephony and security. Because of the limited market size within a small area, DCH felt it best to look for an acquisition located in a major metropolitan area. We decided to incorporate these services through acquisition, rather than expansion of existing companies, because of the high level of training required for necessary technicians. Some of the various certifications needed in this area cost in excess of $100,000. Finding a company with multiple employees with the necessary certifications and an existing client base allows us to leverage the revenue stream. A further explanation of the three areas key to this acquisition follows:
Storage
Analysts predict storage area networks (SANs) will be deployed by 70% of all mid-to-large sized companies by 2002. As data grows enormously at a rate of 60% per year in normal businesses and up to 100% per year in e-businesses, SANs will help to ease data management and the storage capacity needed to maintain it. The market for disk storage systems is forecast to rise about 16% a year to $42 billion by 2002, according to industry analysts.
Storage Devices and Systems:
Fibre Channel is being provided as a standard disk interface. Industry leading RAID (Redundant Array of Independent Disks) manufacturers are shipping Fibre Channel systems. Soon, RAID providers will not be regarded as viable vendors unless they offer Fibre Channel.
Storage Area Network:
The network behind the servers linking one or more servers to one or more storage systems. Each storage system could be RAID, tape backup, tape library, CD-ROM library, or JBOD (Just a Bunch of Disks). Fibre Channel networks are robust and resilient with these features:
- Shared storage among systems
- Scalable network
- High performance
- Robust data integrity and reality
- Fast data access and backup
- Disaster Recovery
In a Fibre Channel network, legacy storage systems are interfaced using a Fibre Channel to SCSI bridge. IP is used for server to server and client/server communications. Storage networks operate with both SCSI and networking (IP) protocols. Servers and workstations use the Fibre Channel network for shared access to the same storage device or system. Legacy SCSI systems are interfaced using a Fibre Channel to SCSI bridge. Fibre Channel products have defined a new standard of performance, delivering a sustained bandwidth of over 97 MB/second for large file transfers and tens of thousands of I/Os per second for business-critical database applications on a Gigabit link. This new capability for open systems storage is the reason Fibre Channel is the connectivity standard for storage access.
Telephony
“Computer telephony” describes the technology that enables voice and data to travel the same network (LAN/WAN) and function in an integrated manner. In the past, all businesses maintained two totally separate network infrastructure, one for voice and one for data. Each infrastructure had its own independent communications links and hardware. Each infrastructure had its own separate set of applications for usage and management. As a result of the total isolation of voice and date networks, infrastructure costs were high, administration costs were high (because separate teams of engineers were needed to manage each), flexibility was limited, and interoperability was non-existent.
A new technology emerged that began closing the gap between voice and data. The new technology was Voice Over IP (VoIP). With VoIP, businesses could begin to leverage their existing, and much less expensive, data infrastructure to handle voice traffic as well. This opened the door to cost savings through lowering infrastructure costs (reducing the number of dedicated voice circuits) and lowering long distance costs between corporate sites (because voice calls could travel across pre-existing data links rather than the public switch phone network).
Seeing the great efficiencies of converging voice and data (and video for that matter) onto one IP-based network infrastructure, the demand for business applications has created a whole new industry. This hot new market is called IP Telephony (or computer telephony). IP Telephony has created the technological foundation for unified messaging (unifying e-mail, voice mail and faxes into a common inbox), interactive Web-based call centers, greatly simplified systems management and more. This new market is still in the emerging phase, so many more applications will be forthcoming.
In fact, the business applications are limited only by our creativity! To quote a Cisco article, “the numbers show that migrating to IP telephony is possible and profitable right now. According to a survey by Stamford, Conn. based Meta Group Inc., 26% of enterprises have already begun to move to integrated voice and data networks, and 42% plan to begin such a migration within the next two years. Two thousand Cisco Systems Inc. customers have already implemented such merged networks, ranging in size from several hundred phones to 25,000 phones.”
Security
Sensitivity to security issues has risen dramatically with the propagation of the Internet as a business tool, new government regulations regarding privacy, and concern with terrorism. The Internet has opened up the enterprise network to the world! But in reality, security has always been a serious issue. The Internet has simply illuminated and intensified awareness of the issue. Security services must assess the impact of security policies (or the lack thereof), practices and technologies at three main levels of the infrastructure:
- Physical security refers to the physical safety of electronic data from unauthorized physical access. For example, can just anyone walk up to a workstation on the network? Could someone literally grab a laptop off the desk and walk out with it, and the sensitive corporate data that it contains? These are examples of physical security issues.
- Systems security refers to the safety of server- or workstation-based user/application data to unauthorized access. For example, are there proper security parameters around system user accounts to prevent unauthorized user access to sensitive material, such as payroll data? Are auditing tools in place to detect unauthorized access attempts? Are clearly defined security policies in place?
- Infrastructure security refers to the safety of application data, system data, user information and other network traffic from unauthorized access, monitoring or impediment from outside entities. For example, does the organization utilize an optimized firewall? Are VLANs being utilized where it makes sense? What is the organization doing to prevent attacks from the outside that could overload routers or servers thereby denying access.
DCH will structure its future departments so as to facilitate collaboration in meeting our customers’ needs from all angles of technology use. This will allow KMCI to offer additional services to its customer base, and will allow the software company customer base to enjoy the benefits of the S.E.A.T. Management program.
3.5 Technology
From 2000 through 2002, the technology industries have taken a huge financial hit. The most noticeable change was that all companies, regardless of industry or size, simply stopped purchasing computer hardware and software in the same quantities as before. The companies switched their focus from replacement of antiquated equipment to upgrading that equipment (if possible). In addition, companies that had projected spending on hardware, software, and servers, immediately began revising their projections, and purchasing or upgrading fewer and fewer units. This change was felt across the industry.
In response to this downward trend, KMCI designed and implemented the S.E.A.T. Management program, which changes the entire way that companies purchase and service hardware and software. S.E.A.T Management encompasses the complete management of information technology assets from hardware to software, on-site service to removal and updating of all equipment. In an age of outsourcing, KMCI proposes treating information technology products and services the same as a utility such as electricity, water, or cable television. S.E.A.T. Management eliminates the need for large capital expenditures and reduces the need for grand funding or new bond issues.
S.E.A.T Management provides:
- State-of-the-art information technology.
- Installation of products and services selected from KMCI’s program menu.
- Resolution of problems in a prompt, professional manner.
- One convenient monthly invoice for all products and services.
- Removal of all hardware at the end of the 36 month contract period.
- Following removal, a replacement of equipment and software with new items, according to the customer’s current information technology needs.
S.E.A.T. Management benefits the customer:
- The customer stays current with state-of-the-art technology and service.
- Outsourcing:
- Eliminates technology maintenance tasks and reduces staffing requirements.
- Eliminates responsibility for information technology hardware removal and disposal.
- Eliminates the need for large up-front capital expenditures.
- Reduces the need for grant funding or proposal of new bond issues.
- Reduces the time and resources spent on costly bid processes.
- Eliminates Microsoft licensing issues.
- Offers accounting advantages in expense write-off versus depreciation of hardware.
- Allows technology products and services to become part of the customer’s recurring monthly expense budget.
- Offers a convenient single bill per month for information technology products and services.
KMCI is currently signing up dealers and customers at a 50% close rate on the first call.
3.6 Fulfillment
DCH acquires businesses that produce, market, and service their own products. This eliminates the middleman, and allows us to keep our products priced competitively when compared to the competition.
KMCI owns a 100,000 square foot manufacturing facility (the plant), which is completely paid for. In addition, KMCI builds every product to customers’ specifications, and therefore, eliminates the need for hardware inventory (computer and servers) that are already built, and may or may not sell. KMCI continues to deliver every order on time (on or before the promised delivery date), while maintaining a 5% or lower failure rate on every product KMCI produces.
In order to hold costs down, we only order the specific supplies that we need to complete the orders that have been made and paid for. This eliminates the problem that our competition has, of having non-current technology (computer parts) sitting in a warehouse. The secret to our business is to provide the most current technology, combined with outstanding service on everything that we build and sell, and make it easy for our customers to purchase from us. In addition, for those customers that require “brand names” we are a value added reseller (VAR) for Perpetual Systems, IBM, Compaq, Hewlett-Packard, Lexmark, and Cisco, to name a few.
Service and installation is a major part of our business, and also one of the most profitable ones. KMCI has hardware, software, wiring, backbone infrastructure, maintenance, and consulting capability. This eliminates the customers’ frustration in dealing with multiple vendors.
Market Analysis Summary
Domino Comptech Holdings’ computer division, Kettle-Moraine Computers, has focused on institutional clients, such as the government of the state of Gulfstate, law enforcement, and educational institutions. With the implementation of the S.E.A.T. Management program, we are now able to expand our target market to all state governments, law enforcement agencies (municipal, county, and federal), all educational institutions, and small, medium and large private and public companies across the United States.
In our market analysis, the figures for target market size and growth rates come from:
- The United States Census website
- The SBA business research website
- Individual state business censuses, retrieved from individual state websites
- The United States Business Census
4.1 Market Segmentation
The target markets Kettle-Moraine Computers has penetrated include education, law enforcement, government, and small business. Domino Comptech plans to utilize KMCI’s strong brand recognition among the large state institutions to broaden national coverage. Products and services are promoted through standard channels: print, radio, television, and direct mail; as well as seminars, product fairs, industry conferences, etc.
KMCI’s major advantages in the market include:
- KMCI is a value added reseller (VAR). KMCI’s product line includes Perpetual Systems, IBM, Compaq, Hewlett-Packard, Lexmark, Cisco, and others. This broad range of products allows KMCI to satisfy virtually any customers’ hardware needs.
- KMCI has hardware, software, wiring, backbone infrastructure, maintenance, and consulting capability. This eliminates the customers’ feelings of frustration in dealing with multiple vendors.
- KMCI has numerous Blue Chip contracts in place, providing name recognition and credibility when bidding for contracts.
- KMCI has had evident success developing strong strategic relationships. Some of the company’s key relationships include IBM, Microsoft, Intel, Cisco, World Wide Technology, Inc., Structure Wise, Inc., North American System Builders Association, Value Added Reseller Partners, and many others.
KMCI uses internal and external sales representatives who are offered competitive compensation packages. ISO approved marketing and sales procedures guarantee efficiency and customer satisfaction throughout the purchase process.

| Market Analysis | |||||||
| 2003 | 2004 | 2005 | 2006 | 2007 | |||
| Potential Customers | Growth | CAGR | |||||
| Home Offices | 15% | 200,000 | 230,000 | 264,500 | 304,175 | 349,801 | 15.00% |
| Educational Institution K-12 | 1% | 128,484 | 129,769 | 131,067 | 132,378 | 133,702 | 1.00% |
| Law Enforcement (state, local, federal) | 6% | 983,412 | 1,042,417 | 1,104,962 | 1,171,260 | 1,241,536 | 6.00% |
| State Government in several states | 7% | 322,419 | 344,988 | 369,137 | 394,977 | 422,625 | 7.00% |
| Total | 7.07% | 1,634,315 | 1,747,174 | 1,869,666 | 2,002,790 | 2,147,664 | 7.07% |
4.2 Target Market Segment Strategy
Our choice of target markets is strategic, and reflects our strengths and weaknesses. Quality is our primary focus. Currently we are operating on a 100% on-time delivery, with an equipment failure rate equal to or less than five percent. The industry standard for equipment failure is close to fifty percent. In addition we provide additional added value by providing the best installation and service of any company. As a result, we are picking up service contracts from companies who didn’t even purchase their hardware from KMCI, but have had such a high equipment failure rate, combined with poor service, that it has opened the doors for KMCI to penetrate that market, and secure the service contract, which in turn will lead to new equipment sales.
We don’t want to compete at the low end, because we realize that all except the high-end home buyer is going to look at computers as boxed prices and buy based mainly on price. This market belongs to the chain stores and office stores.
In the small business target market segment, we are looking for the types of small businesses that need at least five networked units. We will offer them network servers, network installation, maintenance, and software support. Many of our target market customers already have their own in-house IT department; however, we can offer them additional support. For those in our target market that do not have an IT staff, we provide that service on a contractual basis.
We are listed on the preferred provider list with all members of our primary target market, and we have expanded our marketing efforts to include all of the companies that have been on the fringe of our established target market. In addition, our new program, called S.E.A.T. Management, will allow companies to shift the purchase of new hardware and software from the traditional capital expense, to a line item expense via a lease feature. Now the company can lease the needed equipment, and pay for it monthly. KMCI will maintain the equipment and software, and then in three years, will replace the old equipment with new technology and update all software, thus generating a new sale.
4.2.1 Market Growth
At the time it was acquired by Domino Comptech Holdings, Kettle-Moraine Computers was experiencing three years of declining profits. While several factors contributed to this decline, the most important was the general economy of the United States. Businesses in general, and state governments and educational institutions, in particular, simply stopped purchasing computer hardware and software unless it was absolutely critical to their operations; then they would try to simply do a basic upgrade of their existing equipment. Every target market KMCI had established was cutting back spending at the exact same time. KMCI had to work harder, and submit bids with a much lower profit margin, to secure contracts.
Since the acquisition by DCH, KMCI has broadened its specific target market. We are still very active in the state of Gulfstate, working with state government offices and law enforcement, but KMCI has expanded this target market to the surrounding states as well. In addition, we have refocused our in-house sales organization to begin an aggressive campaign to penetrate further into the Small, Medium, and Large, public, and privately held corporations.
In a 1999 profile by the Small Business Administration, the Office of Advocacy ( http://www.sba.gov/gopher/Local-Information/99Pro/99us.txt ), states that, “the number of small businesses with employees increased by 2.6 percent.” The report further stated that, “37.1 percent of the total self-employment nationwide” was “Women-Owned businesses.” In addition, the SBA reported cited that 52% of all businesses in the United States were “small business with less (sic) than 500 employees,” and that the ethnic make up of these companies was varied. This is a huge untapped market, and KMCI has begun to aggressively market to these new potential market segments, while maintaining our established relationships with state and local governments and law enforcement.
4.2.2 Market Trends
The most obvious and important trend in the market is declining prices. This has been true for years, but the trend seems to be accelerating. We see the major brand-name manufacturers putting systems together with amazing specs — more power, more speed, more memory, more disk storage — at amazing prices. In the past, major companies have always filled their hardware needs on a bid basis. The larger companies, such as Dell, Gateway, and IBM, have had the advantage, because they could reduce the cost of the hardware, and make up the reduction in the service area. This trend has started to take a new direction. The market is demanding a more reliable piece of equipment with a failure rate of less than twenty-five percent. The major chain shops and many of the small computer manufacturers have targeted the home, student, and home office user. This target market is very sensitive to price and really does not show the brand loyalty that they once showed. In addition, this specific target market is comprised of consumers that are more of the do-it-yourself mindset, and will upgrade or replace computer components themselves, rather than to pay someone to do it for them.
This may be related to a second trend, which is the computer as throw-away appliance. By the time a system needs upgrading, it is cheaper to buy completely new. The increasing power and storage of a sub-$1,000 system means buyers are asking for less service.
A third trend is ever greater connectivity. Everybody wants onto the Internet, and every small office wants a LAN. A lot of small offices want their LAN connected to the Internet.
With the implementation of the S.E.A.T. program, we have successfully circumvented the existing trend to purchase items on bid, or to purchase inexpensive computers and upgrade or repair them in house. Within our specific target market namely state government, K–12 elementary schools, high schools, colleges, and universities, and law enforcement, S.E.A.T. has completely rewritten how equipment has been purchased. S.E.A.T. Management allows the capital expense that must have budgetary approval to move to a line item expense that does not require the bid process or special budgetary approval. S.E.A.T. simply requires a small monthly expense that will combine all hardware, software, service and installation into one small easy payment. This allows our target market to always have the latest technology and the best service with an affordable solution.
S.E.A.T. has eliminated the need to purchase cheaper equipment and then throw it away in a couple of years, by building into the contract a three year term. In other words, our client is effectively leasing the equipment, returning it at the end of the lease term (three years) and then replacing the old leased equipment with new equipment.
4.2.3 Market Needs
Since our target market is the service seeker, the most important market needs are support, service, training, and installation, in that order. One of the key points of our strategy is the focus on target segments that know and understand these needs and are willing to pay to have them filled.
All personal computer users need support and service. The self-reliant ones have supplied those needs themselves; however, this is changing. In an effort to become more competitive in the face of economic decline, many companies are downsizing their in-house IT departments, and have started using consultants. Within the state sector of our target market, budgets have been sliced, and for the past three years all capital expenditures with the exception of the most critical have been terminated. This means that this specific target market is using old equipment that is requiring more and more service. The critical service areas are hardware and software upgrades.
The market needs more than just the physical hardware and the service to support it: Our customers depend on their systems. They need the assurance that they can find help when they need it. KMCI has successfully captured a sizable position within all of our target markets, and we are increasing that position.
4.3 Service Business Analysis
We are part of the computer manufacturing and reselling business, which includes several kinds of businesses:
- Large manufacturers such as IBM, Dell, Compaq, and Gateway. These are our direct competitors, and it is interesting to note that three of these companies have a fairly high product failure rate, and they have all reduced their computer service to help desk, and telephone tech support.
- Computer dealers: storefront computer resellers, usually less than 5,000 square feet, often focused on a few main brands of hardware, usually offering only a minimum of software, and variable amounts of service and support. These are usually old-fashioned (1980s-style) computer stores and they usually offer relatively few reasons for buyers to shop with them. Their service and support is not usually very good and their prices are usually higher than the larger stores.
- Chain stores and computer superstores: these include major chains such as CompUSA, Computer City, Future Shop, etc. They are almost always more than 10,000 square feet of space, usually offer decent walk-in service, and are often warehouse-like locations where people go to find products in boxes with very aggressive pricing and little support.
- Mail order/Online: the market is served increasingly by mail order businesses that offer aggressive pricing of boxed product. For the purely price-driven buyer, who buys boxes and expects no service, these are very good options.
- Others: there are many other channels through which people buy their computers, usually variations of the main three types above.
4.3.1 Distribution Patterns
Our existing target market buyers are accustomed to buying from vendors who visit their offices. They expect the copy machine vendors, office products vendors, and office furniture vendors to visit their office to make their sales. We are accustomed to this type of selling, and our sales force has been assigned exclusive selling areas. Within this selling area, the individual representative is responsible for the continued sales and service, in addition to the cold calling, and sales prospecting for new business.
Unfortunately, our Home Office target buyers may not expect to buy from us. Many of them turn immediately to the superstores (office equipment, office supplies, and electronics) and mail order to look for the best price, without realizing that there is a better option for them for only a little bit more.
Once KMCI implemented the S.E.A.T. Management program, the response from our existing and newly identified target markets was so strong that Minerva Astarte, the VP of Sales, decided to contract the smaller computer dealerships, large, and medium sized IT consulting firms, and small individual IT consultants, to sell S.E.A.T. Management to their customers. Each and every product will pay the contracted individual or company a commission. The acceptance within this targeted group has been a 50% close and sign rate, on the first call. This means that KMCI is effectively increasing its sales force, while not having the burden of paying salaries, and employee benefits.
4.3.2 Competition and Buying Patterns
DCH is a holding company, and as such really doesn’t have a “target market,” “competitors,” or channels of distribution; however, KMCI, as the computer manufacturing division of DCH, does.
The target markets of KMCI usually work on a “personal relationship” basis with the sales representative, but the bottom line is still the bid process. KMCI has found that if two bids are very close, sometimes the buying decision may be swayed based on the relationship the winning company has with the clients, or the reputation for fulfilling the contract, on time, with excellent service, and a minimum of downtime for the installation. KMCI has an outstanding reputation within the state of Gulfstate, and that reputation is expanding into the neighboring states as well.
KMCI enjoys the advantage of building each workstation, server and network to the clients’ specifications. That means that the clients get exactly what they want, the way they want it, each and every time without exception. In addition, we are ISO Certified, which means the absolute highest quality of product. All of our products have less than a 5% failure rate. None of our competition can make such a claim.
Service is another area where the industry is pulling back, and KMCI is moving forward. In an interview with Tom Meredith the CFO of Dell Computer, on August 21, 1999 on The Motley Fool Radio Show, the co-founder Tom Gardner asked Mr. Meredith, “what stands out for you as a few of the highlights for Dell this quarter that might not pop up immediately on someone’s radar?” The response was, “I think perhaps the most compelling is the consistent performance, frankly, over the entire decade on our topline growth, on our market share gains, and our continuous focus on the low-cost provider and therefore the best value proposition while growing profitability.” Dell at the time of the interview was selling $30 million dollars in sales per day on the Internet. Mr. Meredith predicted that would increase, because “In fact, as part of that you have to understand we’re the ones passing the declining component cost through faster than any other single competitor, and that is what the Internet does…allow us to continue to enhance our customer touch, and at the same time bring our suppliers into contact more directly with our customers so they feel the pulse of real demand.” In addition, Mr. Meredith stated that 40% of all services issues are handled over the Internet, 70% of all order status, and 95% of Dell’s bill of materials hooked through their top 50 supplies are now online.
Dell Computer has reduced the amount of face-to-face contact, and service, exchanged it for a call center, “Help Desk” type of of service, and will send replacement parts to the end user, and then walk them through the proper repair or installation. This is great from a corporate bottom line situation; however, it is contrary to everything that KMCI clients, and many other IT consultants are saying that business clients want. Corporate and institutional clients want service after the sale, and they don’t want to have to pay extremely high prices for that service.
4.3.3 Main Competitors
IBM, Compaq, Lexmark, Hewlett-Packard, Dell, and Gateway:
- Strengths: national image, high volume, strong brand name, large advertising budgets, and economies of scale.
- Weaknesses: lack of company representation: IBM, for example, has their “contracted service providers” that will service IBM equipment for a price, and if it is an emergency they traditionally charge a “RUSH” fee on top of the regular service fee. Compaq, Lexmark, Hewlett-Packard, Dell, and Gateway, will either send the customer the replacement part, and have them install it with telephonic help desk support, or they will often request that the client send the item back. Only as a last resort will these companies seek out a contracted service provider to go to the site, and correct the problem.
Other local computer stores:
- We have lots of smaller computer stores that are in direct competition with our “store front.” In reality, these companies are not our competitors. Many of them carry our private labeled products, or have contracted with KMCI to build systems under their label. We maintain the service contracts for most of these companies.
4.3.4 Industry Participants
The national chains are a growing presence.
CompUSA, Computer City, Incredible Universe, Circuit City, and Sears, to name a few, benefit from national advertising, economies of scale, volume buying, and a general trend toward name-brand loyalty for buying in the channels as well as for products. National chains suffer from a huge weakness: to achieve good prices, they must purchase in huge quantities from manufacturers such as KMCI, and once the computer is built, and delivered to the chain, the hardware becomes a ticking bomb. The chain is forced to sell that product as quickly as possible, because technology is advancing so quickly, that in reality by the time they receive their shipment, and distribute it to the stores, the hardware is already out of date.
Local computer stores are threatened.
These tend to be small businesses, owned by people who started them because they liked computers. They are under-capitalized and under-managed. Margins are squeezed as they compete against the chains, in a competition based on price more than on service and support. The local computer store is also under the same time restraints as the national chain, unless they custom build the computer for the consumer. Due to their size, and the fact that most are under-capitalized, they cannot afford to purchase the individual components as inexpensively as KMCI can.
Strategy and Implementation Summary
Emphasize service and support.
We must differentiate ourselves from the box pushers. We need to establish our business offering as a clear and viable alternative for our target market, to the price-only kind of buyer.
Build a relationship-oriented business.
Build long-term relationships with clients, not single-transaction deals with customers. Become their computer department, not just a vendor. Make them understand the value of the relationship.
Focus on target markets.
We need to focus our offerings on small, medium, and large size businesses as the key market segment we should own. This means the 5-20 unit system, tied together in a local area network, in a company with 5-50 employees. Our values — training, installation, service, support, knowledge — are more clearly differentiated in this segment. We must continue to service our existing relationships, contracts, and even expand them into neighboring states; however, we must focus on all of our target markets, rather than just one segment as we have done in the past.
As a corollary, the high end of the home office market is also appropriate. We do not want to compete for the buyers who go to the chain stores or mail order, but we definitely want to be able to sell individual systems to the smart home office buyers who want a reliable, full-service vendor.
Differentiate and fulfill the promise.
We can’t just market and sell service and support, we must actually deliver as well. We need to make sure we have the knowledge-intensive business and service-intensive business we claim to have. In addition, we will continue to maintain the highest quality control.
5.1 Strategy Pyramid
Our strategy is emphasizing relationships. The tactics are marketing the company (instead of the products), more regular contacts with the customer, and increasing sales per customer. Programs for marketing the company include new sales literature, revised ad strategy, and direct mail. Programs for more regular contacts include call-backs after installation, direct mail, and sales management. Programs for increasing sales per customer include upgrade mailings (the S.E.A.T Management program), and sales training.
We have also formed strategic relationships with IT staffing companies and consulting groups; we are entering into a joint relationship with these individuals and companies for the express purpose of selling equipment, service, and network installations to their existing clientele. This produces a win–win situation for both the consultant and us. From the consultants’ point of view, they are selling our S.E.A.T. Management service to their existing clients, thereby further fortifying the relationship against a competitor. The benefit to DCH is that we are not having to convince a client to terminate a good relationship with their dealer, or consultant. We work seamlessly with each dealer, and consultant.
Once the acquisition of the software company is completed, we will immediately begin placing emphasis on service and support: our main tactics are good hardware, networking expertise, excellent training, and selling our own proprietary software/network administrative system specifically designed for business machine dealers. For developing our own proprietary systems, our programs are company direct mail marketing, and working with VARs (Value Added Resellers).
5.2 Competitive Edge
Our competitive edge is our positioning as a strategic ally with our clients, who are clients more than customers. By building a business based on long-standing relationships with satisfied clients, we simultaneously build defenses against competition. The longer the relationship stands, the more we help our clients understand what we offer them and why they need it.
Many of our existing contracts show huge potential but, over the past three years we have not addressed the changing needs of our clients. We are now specifically targeting each and every client with specific reasons that they should buy from us. In addition, we have implemented programs to make it very attractive for our existing client base to acquire their equipment from us, and we have started a strong outreach program within the community to increase our market share.
5.3 Marketing Strategy
- Emphasize service and support.
- Build a relationship business.
- Maintain our existing client base, and expand within that established base.
- Focus on small business and high-end home office as key target markets.
5.3.1 Promotion Strategy
We depend on word-of-mouth advertising and direct contact by our sales representatives as our main ways to reach new buyers. As we change strategies, however, we need to change the way we promote ourselves:
- Direct Contact: Our sales department directly makes contact via cold calling, combined with direct office visits. This has already been effective, but adds to the total length of time for the sales cycle. To reduce this time we have implemented:
- A online quoting system. This will enable the sales representatives to make a complete presentation, and offer an immediate quote. This also enables the sales representative to make a one call close, and come back with a signed contract.
- Signing up other IT dealers and consultants, and allowing us to sell to their clients for a piece of the commission. Currently we have a 50% first call close rate, with a 75% client conversion rate.
- Sales Brochure: All of our representatives and contracted dealers have full access to the online quoting, and full four-color sales brochures.
- Direct Mail: We have to radically improve our direct mail efforts, reaching our established customers with training, support services, upgrades, and seminars. We then follow up in writing with every prospect to whom we have spoken.
- Media: It’s time to work more closely with the local media. In the past we have had great success using press releases; however, we need to be much more agressive in our press release campaign. We could offer the local radio a regular talk show on technology for small business, or as we take in computers that need to be disposed we might donate this equipment to 503(c) organizations, and then follow this up with a strong press campaign to encourage other 503(c) organizations to submit a request for equipment. This is only one example.
5.3.2 Distribution Strategy
Domino Comptech Holding’s computer division, KMCI, focuses on the market need for customized and differentiated computer hardware, software, and networking requirements. All of our products are built entirely to the clients’ specifications. We have added customers through the VAR (Value-Added Resellers) channel. The VARs need to protect their special relationship with their customers, maintaining the sense of customization and personalized service. Each VAR is a direct extension of our company, and we respect each and every one of their clients, by providing the best equipment and the most reasonable pricing structure, with quality control that is second to none. Our company prides itself on achieving a total failure rate of less than 5%, which is well below the industry standard.
We will also maintain a strong presence in the high volume channels. We recognize that this is harder, because the overall sales cycle is longer; however, because we own our own manufacturing plant, we can offer the most competitive price, even if we are in competition with one of the Big 3 computer names.
5.3.3 Marketing Programs
DCH and KMCI do not have a Marketing Director. This is one of our management gaps, and we are currently interviewing, in an attempt to fill this position as quickly as possible. In lieu of having a formal “Marketing Plan” with well established milestones, we are currently implementing the marketing plan that was created by the former Marketing Director. The S.E.A.T. program is just one such example. As you can see in the Sales Forecast table, we expect to see a large increase in sales, because of the favorable response that our partner dealers have shown. We are currently seeing one call closes (something that the industry has not seen since the late 90’s).
KMCI doesn’t have the luxury to sit back and wait; we must capture the market ourselves, and the best way to do that is to establish strategic alliances with companies and individuals that already maintain a “book of business” and then exploit those relationships to the benefit of both KMCI and our strategic partners.
5.3.4 Pricing Strategy
We must charge appropriately for the high-end, high-quality service and support we offer. Our revenue structure has to match our cost structure, so the salaries we pay to assure good service and support must be balanced by the revenue we charge.
We cannot build the service and support revenue into the price of products. The market can’t bear the higher prices and the buyer feels ill-used when they see a similar product priced lower at the chains or with other competitors. Despite the logic behind this, the market doesn’t support this concept; however, we do build in help desk, on-site service, etc., to each and every one of our S.E.A.T. Management clients, because the overall cost per unit spread over a three year period (the length of the S.E.A.T. immediately contract) reduces the total cost for service to only a few pennies a month. Because the overall cost to the client using S.E.A.T. Management is so low, there is never an objection in charging for the service we provide.
5.3.5 Positioning Statement
For business people who want to be sure their computer systems will work reliably, KMCI is a vendor and trusted strategic ally who makes sure their systems work, their people are trained, and their downtime is minimal. Unlike the chain retail stores, and our other competition, the KMCI sales and service staff know the customers, go to their sites when needed, and offer proactive support, service, training, and installation.
5.4 Sales Strategy
DCH is divided into different divisions, with each division responsible for the implementation of their own individual sales strategy. Because each division differs in both products and services is it vital that each division maintain focus on its own priorities. With that said each division has certain similarities, and some crossover in strategy is evident. The common ground for each division is:
- We need to sell the company, not the product. We sell KMCI, not Apple, IBM, Hewlett-Packard, or Compaq, or any of our software brand names.
- We have to sell our service and support. The hardware is like the razor, and the support, service, software services, training, and seminars are the razor blades. We need to serve our customers with what they really need. Each of our divisions share approximately a 48% profit margin on service as opposed to between 15 – 20% on hardware, or software.
- We listen to our existing clients and give them exactly what they want, the way they want it, each and every time.
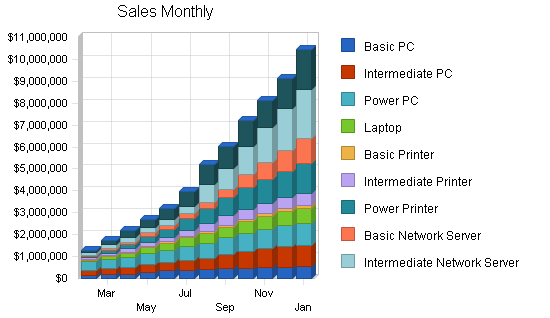
The sales table and charts, below, indicate KMCI’s projected sales, and how we plan to increase those sales in the immediate future.
5.4.1 Sales Forecast
The Sales Forecast table indicates the actual and projected sales that DCH expects from the KMCI division. In the past, KMCI did not have the captive sales force to generate these types of sales on a consistent basis; however, with the new marketing strategy of signing up dealers to sell S.E.A.T. Management on our behalf, and then paying these dealers a commission, we have in fact increased our present sales force by 200%. KMCI has also initiated an agressive hiring campaign to increase our in-house sales force. From a profit position, it really doesn’t matter if a dealer or an in-house sales person makes the sale; both are paid the same rate of commission.

| Sales Forecast | |||||
| FY 2004 | FY 2005 | FY 2006 | FY 2007 | FY 2008 | |
| Unit Sales | |||||
| Basic PC | 2,685 | 3,222 | 3,866 | 4,640 | 5,568 |
| Intermediate PC | 2,630 | 3,288 | 4,109 | 5,137 | 6,421 |
| Power PC | 2,550 | 3,315 | 4,310 | 5,602 | 7,283 |
| Laptop | 1,915 | 2,873 | 4,309 | 6,463 | 9,695 |
| Basic Printer | 2,130 | 2,663 | 3,328 | 4,160 | 5,200 |
| Intermediate Printer | 2,705 | 3,517 | 4,571 | 5,943 | 7,726 |
| Power Printer | 2,275 | 3,185 | 4,459 | 6,243 | 8,740 |
| Basic Network Server | 1,290 | 1,935 | 2,903 | 4,354 | 6,531 |
| Intermediate Network Server | 1,600 | 2,560 | 4,096 | 6,554 | 10,486 |
| Power Network Server | 1,015 | 1,827 | 3,289 | 5,919 | 10,655 |
| Other | 0 | 0 | 0 | 0 | 0 |
| Total Unit Sales | 20,795 | 28,383 | 39,240 | 55,014 | 78,303 |
| Unit Prices | FY 2004 | FY 2005 | FY 2006 | FY 2007 | FY 2008 |
| Basic PC | $1,634.00 | $1,634.00 | $1,634.00 | $1,634.00 | $1,634.00 |
| Intermediate PC | $2,523.00 | $2,523.00 | $2,523.00 | $2,523.00 | $2,523.00 |
| Power PC | $3,212.00 | $3,212.00 | $3,212.00 | $3,212.00 | $3,212.00 |
| Laptop | $2,483.00 | $2,483.00 | $2,483.00 | $2,483.00 | $2,483.00 |
| Basic Printer | $465.00 | $465.00 | $465.00 | $465.00 | $465.00 |
| Intermediate Printer | $1,393.00 | $1,393.00 | $1,393.00 | $1,393.00 | $1,393.00 |
| Power Printer | $3,368.00 | $3,368.00 | $3,368.00 | $3,368.00 | $3,368.00 |
| Basic Network Server | $3,883.00 | $3,883.00 | $3,883.00 | $3,883.00 | $3,883.00 |
| Intermediate Network Server | $6,351.00 | $6,351.00 | $6,351.00 | $6,351.00 | $6,351.00 |
| Power Network Server | $9,573.00 | $9,573.00 | $9,573.00 | $9,573.00 | $9,573.00 |
| Other | $0.00 | $0.00 | $0.00 | $0.00 | $0.00 |
| Sales | |||||
| Basic PC | $4,387,290 | $5,264,748 | $6,317,698 | $7,581,237 | $9,097,485 |
| Intermediate PC | $6,635,490 | $8,294,363 | $10,367,953 | $12,959,941 | $16,199,927 |
| Power PC | $8,190,600 | $10,647,780 | $13,842,114 | $17,994,748 | $23,393,173 |
| Laptop | $4,754,945 | $7,132,418 | $10,698,626 | $16,047,939 | $24,071,909 |
| Basic Printer | $990,450 | $1,238,063 | $1,547,578 | $1,934,473 | $2,418,091 |
| Intermediate Printer | $3,768,065 | $4,898,485 | $6,368,030 | $8,278,439 | $10,761,970 |
| Power Printer | $7,662,200 | $10,727,080 | $15,017,912 | $21,025,077 | $29,435,108 |
| Basic Network Server | $5,009,070 | $7,513,605 | $11,270,408 | $16,905,611 | $25,358,417 |
| Intermediate Network Server | $10,161,600 | $16,258,560 | $26,013,696 | $41,621,914 | $66,595,062 |
| Power Network Server | $9,716,595 | $17,489,871 | $31,481,768 | $56,667,182 | $102,000,928 |
| Other | $0 | $0 | $0 | $0 | $0 |
| Total Sales | $61,276,305 | $89,464,971 | $132,925,782 | $201,016,561 | $309,332,068 |
| Direct Unit Costs | FY 2004 | FY 2005 | FY 2006 | FY 2007 | FY 2008 |
| Basic PC | $490.20 | $490.20 | $490.20 | $490.20 | $490.20 |
| Intermediate PC | $756.90 | $756.90 | $756.90 | $756.90 | $756.90 |
| Power PC | $963.60 | $963.60 | $963.60 | $963.60 | $963.60 |
| Laptop | $744.90 | $744.90 | $744.90 | $744.90 | $744.90 |
| Basic Printer | $139.50 | $139.50 | $139.50 | $139.50 | $139.50 |
| Intermediate Printer | $417.90 | $417.90 | $417.90 | $417.90 | $417.90 |
| Power Printer | $1,010.40 | $1,010.40 | $1,010.40 | $1,010.40 | $1,010.40 |
| Basic Network Server | $1,164.90 | $1,164.90 | $1,164.90 | $1,164.90 | $1,164.90 |
| Intermediate Network Server | $1,905.30 | $1,905.30 | $1,905.30 | $1,905.30 | $1,905.30 |
| Power Network Server | $2,871.90 | $2,871.90 | $2,871.90 | $2,871.90 | $2,871.90 |
| Other | $0.00 | $0.00 | $0.00 | $0.00 | $0.00 |
| Direct Cost of Sales | |||||
| Basic PC | $1,316,187 | $1,579,424 | $1,895,309 | $2,274,371 | $2,729,245 |
| Intermediate PC | $1,990,647 | $2,488,309 | $3,110,386 | $3,887,982 | $4,859,978 |
| Power PC | $2,457,180 | $3,194,334 | $4,152,634 | $5,398,424 | $7,017,952 |
| Laptop | $1,426,484 | $2,139,725 | $3,209,588 | $4,814,382 | $7,221,573 |
| Basic Printer | $297,135 | $371,419 | $464,273 | $580,342 | $725,427 |
| Intermediate Printer | $1,130,420 | $1,469,545 | $1,910,409 | $2,483,532 | $3,228,591 |
| Power Printer | $2,298,660 | $3,218,124 | $4,505,374 | $6,307,523 | $8,830,532 |
| Basic Network Server | $1,502,721 | $2,254,082 | $3,381,122 | $5,071,683 | $7,607,525 |
| Intermediate Network Server | $3,048,480 | $4,877,568 | $7,804,109 | $12,486,574 | $19,978,519 |
| Power Network Server | $2,914,979 | $5,246,961 | $9,444,530 | $17,000,155 | $30,600,278 |
| Other | $0 | $0 | $0 | $0 | $0 |
| Subtotal Direct Cost of Sales | $18,382,892 | $26,839,491 | $39,877,735 | $60,304,968 | $92,799,620 |
5.4.2 Sales Programs
- Cold Calling: We have implemented an agressive cold call marketing campaign designed specifically to accomplish these goals.
- Make IT dealers and consultants aware that we would like to work with them, and their existing clients, as well as their future clients.
- Illustrate that there would be a strong financial benefit if they decided to join us.
- Make all of KMCI’s existing and future clients aware of a new way to acquire IT equipment without a capital expense.
- Direct mail: We are implementing a direct mail campaign specifically directed at referral dealers, who may be interested in representing S.E.A.T. Management.
- Seminars: Geared toward executive law enforcement administrators, executive branch of state government, schools, colleges, and universities.
- Agressive press release media campaign: Aimed specifically at branding of KMCI’s products, and services.
5.5 Strategic Alliances
We depend on our sales staff to maintain, and strengthen all of our strategic alliances for the express purpose of generating continuous leads for our add-on products. We need to make sure that our personnel are aware of the support and reciprocation that we share with our strategic partners.
5.6 Milestones
The accompanying table lists important program milestones, with dates and managers in charge, and budgets for each. The milestone schedule indicates our emphasis on planning for implementation.
What the table doesn’t show is the commitment behind it. Our business plan includes complete provisions for plan-vs.-actual analysis, and we will be holding follow-up meetings every month to discuss the variance and course corrections.

| Milestones | |||||
| Milestone | Start Date | End Date | Budget | Manager | Department |
| Secure Phase II funding $22 million | 2/10/2003 | 12/31/2003 | $20,000 | Puma | Administration |
| Aquire Software Company | 1/1/2003 | 1/15/2004 | $7,000,000 | Caracal/Puma | Administration |
| Increase Sales Revenue by 30 Percent | 1/1/2003 | 12/31/2003 | $0 | Astarte | Sales |
| Increase number of Sales Staff | 1/1/2003 | 12/31/2003 | $100,000 | Astarte | Sales |
| Reduce Product Failure rate by 1.5% | 1/1/2003 | 12/31/2003 | $0 | Margay | Quality Control |
| Sign a total of 25 S.E.A.T Partner | 6/1/2003 | 9/1/2003 | $0 | Astarte | Sales |
| Future Milestones | 12/31/2003 | 1/1/2004 | $0 | All | All |
| Totals | $7,120,000 | ||||
Management Summary
Our management philosophy is based on responsibility and mutual respect. People who work at DCH want to work at DCH, because we have an environment that encourages creativity and achievement. The team includes 13 members, representing over 106 years of experience. Because DCH has organized its team to draw the most successful individuals from various industries, DCH reaps the benefits of being able to look at changing situations, and make a quick and accurate analysis, and then quickly formulate a plan of action.
6.1 Organizational Structure
The team includes 13 executive team members, with Lynx Caracal serving as CEO and President of DCH.
DCH has at this time two divisions, KMCI, and ZumoNet. Lynx Caracal is serving as President of both of these divisions, and currently maintains the following management divisions: Sales, Marketing, Service, and Administration. Service handles service, support, training, and development.
6.2 Management Team
Chairman of Board of Directors:
Kit Puma, who has been an organizer in several companies, will serve as the Chairman of the Board of Directors. Mr. Puma was the founder and president of his last company and served as president of its wholly-owned life insurance company for the last four years. He has been repeatedly recognized for Sales and Sales Management Performance.
President:
Lynx Caracal serves as President, CEO and Director of the company, and will be in charge of all operations. He is also the President of Kettle-Moraine Computers, Inc. (KMCI), a large computer hardware company, which he founded and built over the last 12 years into a very successful multi-million dollar company.
Mr. Caracal has served as KMCI’s only President since inception and single-handedly built KMCI into a profitable manufacturer of computer hardware products and services.
Vice President:
Neve Palenque will serve as Vice President and hold a position on the Board of Directors. Ms. Palenque will be an employee of KMCI, focusing on normal sales of KMCI products and technology. Until recently, she was the President of a large insurance agency with over 12,000 clients. Ms. Palenque has also been highly decorated for performance in sales and sales management success.
Secretary:
Felidae Kalakmul recently retired as a Captain of the Gulfstate Highway Patrol. Mr. Kalakmul served as the Training Director prior to his retirement, and he also served as one of the state’s chief compliance officers for the Gulfstate Gaming Commission. Mr. Kalakmul, in addition to serving DCH, teaches business ethics and business law at BMOC College, in Central City, Gulfstate, and at Riverford University.
Treasurer:
Panthera Dos Pilas is a well-known CPA, in private practice in Central City. Ms. Dos Pilas is an authority in business analysis and tax law strategies.
The remainder of the Board of Directors and other corporate management team members will be selected for their reputation of success in business and their reputation for integrity.
6.3 Management Team Gaps
DCH currently needs to fill the position of Marketing Director. Other than that, DCH does not have any management team gaps, because we have acquired successful business that already have a successful management, and operations team in place; however, as DCH continues to grow, we will begin to identify gap areas, and as those areas are identified they will be filled by a qualified and successful individual.
6.4 Personnel Plan
The Personnel Plan reflects the immediate DCH team, as new acquisitions are made, there will be additions to this table. The advantage DCH has over other companies is our ability to identify outstanding companies, with excellent management, but for one reason or another have a weakness that DCH can fill. When we identify these companies, we will begin to conduct our own investigation and determine if we can acquire the company, and its most successful personnel. Our total employment as represented by the personnel table only reflects DCH, and not its individual divisions.
| Personnel Plan | |||||
| FY 2004 | FY 2005 | FY 2006 | FY 2007 | FY 2008 | |
| Kit Puma – Chairman of the Board | $99,300 | $99,300 | $104,265 | $109,478 | $114,952 |
| Lynx Caracal – President & CEO | $49,992 | $50,000 | $52,500 | $55,125 | $57,881 |
| Neve Palenque – Vice President | $47,400 | $48,000 | $50,400 | $52,920 | $55,566 |
| Felidae Kalakmul – Secretary | $45,000 | $45,000 | $47,250 | $49,613 | $52,093 |
| Panthera Dos Pilas, CPA – Treasurer | $18,000 | $18,000 | $18,900 | $19,845 | $20,837 |
| Marketing Director (not yet hired) | $37,500 | $45,000 | $47,250 | $49,613 | $52,093 |
| Other | $0 | $0 | $0 | $0 | $0 |
| Total People | 4 | 4 | 4 | 4 | 4 |
| Total Payroll | $297,192 | $305,300 | $320,565 | $336,593 | $353,423 |
Financial Plan
The most important element in the financial plan is the critical need for improving several of the key factors that impact cash flow:
- We must at any cost stop the slide in inventory turnover and develop better inventory management to bring the turnover back up to eight turns by the third year. This should also be a function of the shift in focus toward service revenues to add to the hardware revenues.
- We must also bring the gross margin back up. This, too, is related to improving the mix between hardware and service revenues, because the service revenues offer much better margins.
- We plan to extend our Private Placement for another two month. The funds will enable DCH to purchase the software company, and begin to market our hardware, and service to their established clients.
Our financial plan seems agressive when compared to our past performance; however, it really isn’t. We must use our sales force, and the dealers and consultants that have signed with us, to jointly sell the S.E.A.T. Management program to its fullest potential. This program officially started on July 1, 2003, and we have already closed sales in companies that we have not been able to sell to in the past.
7.1 Important Assumptions
The financial plan depends on important assumptions, most of which are shown in the following table. The key underlying assumptions are:
- We assume a slow-growth economy, without major recession.
- We assume of course that there are no unforeseen changes in technology to make products immediately obsolete.
- We assume access to equity capital and financing sufficient to maintain our financial plan as shown in the tables.
| General Assumptions | |||||
| FY 2004 | FY 2005 | FY 2006 | FY 2007 | FY 2008 | |
| Plan Month | 1 | 2 | 3 | 4 | 5 |
| Current Interest Rate | 10.00% | 10.00% | 10.00% | 10.00% | 10.00% |
| Long-term Interest Rate | 10.00% | 10.00% | 10.00% | 10.00% | 10.00% |
| Tax Rate | 30.00% | 30.00% | 30.00% | 30.00% | 30.00% |
| Other | 1 | 1 | 1 | 1 | 1 |
7.2 Break-even Analysis
For our break-even analysis, we assume fixed costs and margins based on projections for the coming year. We hope to attain high margin in the future. The chart shows what we need our divisions to produce in revenueper month to break even, according to these assumptions.

| Break-even Analysis | |
| Monthly Units Break-even | 392 |
| Monthly Revenue Break-even | $1,154,547 |
| Assumptions: | |
| Average Per-Unit Revenue | $2,946.68 |
| Average Per-Unit Variable Cost | $884.01 |
| Estimated Monthly Fixed Cost | $808,183 |
7.3 Projected Profit and Loss
The most important assumption in the Projected Profit and Loss statement is the Gross Margin, which is supposed to increase over the last year’s performance. The increase in Gross Margin is based on changing our sales and marketing mix, and it is critical.
DCH is housed in the corporate administrative offices of KMCI, and does not have to pay rent, utilities, office equipment depreciation and other insurance other than normal FICA, Social Security, and Medicare on its employees. Month-by-month assumptions for profit and loss are included in the appendices.


| Pro Forma Profit and Loss | |||||
| FY 2004 | FY 2005 | FY 2006 | FY 2007 | FY 2008 | |
| Sales | $61,276,305 | $89,464,971 | $132,925,782 | $201,016,561 | $309,332,068 |
| Direct Cost of Sales | $18,382,892 | $26,839,491 | $39,877,735 | $60,304,968 | $92,799,620 |
| Other Costs of Goods | $3,070,000 | $4,000,000 | $5,300,000 | $7,000,000 | $9,300,000 |
| Total Cost of Sales | $21,452,892 | $30,839,491 | $45,177,735 | $67,304,968 | $102,099,620 |
| Gross Margin | $39,823,414 | $58,625,480 | $87,748,048 | $133,711,593 | $207,232,448 |
| Gross Margin % | 64.99% | 65.53% | 66.01% | 66.52% | 66.99% |
| Expenses | |||||
| Payroll | $297,192 | $305,300 | $320,565 | $336,593 | $353,423 |
| Divisions payroll (see note) | $100,000 | $0 | $1,000,000 | $700,000 | $900,000 |
| Depreciation | $0 | $30,200,000 | $39,900,000 | $52,800,000 | $69,600,000 |
| Divisions operating expense (see note) | $9,300,000 | $12,000,000 | $16,000,000 | $21,100,000 | $27,800,000 |
| Payroll Taxes | $1,000 | $300,000 | $0 | $400,000 | $400,000 |
| Other | $0 | $0 | $0 | $0 | $0 |
| Total Operating Expenses | $9,698,192 | $42,805,300 | $57,220,565 | $75,336,593 | $99,053,423 |
| Profit Before Interest and Taxes | $30,125,222 | $15,820,180 | $30,527,483 | $58,375,000 | $108,179,025 |
| EBITDA | $30,125,222 | $46,020,180 | $70,427,483 | $111,175,000 | $177,779,025 |
| Interest Expense | $226,065 | $593,613 | $955,776 | $414,155 | ($53,823) |
| Taxes Incurred | $8,969,747 | $4,567,970 | $8,871,512 | $17,388,253 | $32,469,854 |
| Net Profit | $20,929,409 | $10,658,597 | $20,700,195 | $40,572,591 | $75,762,994 |
| Net Profit/Sales | 34.16% | 11.91% | 15.57% | 20.18% | 24.49% |
7.4 Projected Cash Flow
The cash flow depends on assumptions of sales by the KMCI sales team, and on servicing our existing clients. Our projected 60 day collection days is critical, and it is also reasonable. We do need to assume somewhat standard receivables-based credit line, but aside from that, which is supported entirely by receivables, we are not assuming any new borrowing, or funding to support the KMCI operation. KMCI is self supporting.
We have not included the revenue of the proposed acquisition of the software company. The software company does have, and has maintained a strong profit margin; however, we are too early into the acquisition process to begin to forecast additional revenues coming from this proposed acquisition.

| Pro Forma Cash Flow | |||||
| FY 2004 | FY 2005 | FY 2006 | FY 2007 | FY 2008 | |
| Cash Received | |||||
| Cash from Operations | |||||
| Cash Sales | $15,319,076 | $22,366,243 | $33,231,446 | $50,254,140 | $77,333,017 |
| Cash from Receivables | $32,062,938 | $60,443,815 | $89,433,903 | $134,687,228 | $206,427,414 |
| Subtotal Cash from Operations | $47,382,014 | $82,810,057 | $122,665,348 | $184,941,368 | $283,760,431 |
| Additional Cash Received | |||||
| Sales Tax, VAT, HST/GST Received | $0 | $0 | $0 | $0 | $0 |
| New Current Borrowing | $100,000 | $8,000,000 | $0 | $0 | $0 |
| New Other Liabilities (interest-free) | $0 | $0 | $0 | $0 | $0 |
| New Long-term Liabilities | $0 | $0 | $0 | $0 | $0 |
| Sales of Other Current Assets | $0 | $0 | $0 | $0 | $0 |
| Sales of Long-term Assets | $0 | $0 | $0 | $0 | $0 |
| New Investment Received | $0 | $0 | $0 | $0 | $0 |
| Subtotal Cash Received | $47,482,014 | $90,810,057 | $122,665,348 | $184,941,368 | $283,760,431 |
| Expenditures | FY 2004 | FY 2005 | FY 2006 | FY 2007 | FY 2008 |
| Expenditures from Operations | |||||
| Cash Spending | $297,192 | $305,300 | $320,565 | $336,593 | $353,423 |
| Bill Payments | $36,105,368 | $52,855,599 | $72,430,644 | $108,121,780 | $164,893,924 |
| Subtotal Spent on Operations | $36,402,560 | $53,160,899 | $72,751,209 | $108,458,373 | $165,247,347 |
| Additional Cash Spent | |||||
| Sales Tax, VAT, HST/GST Paid Out | $0 | $0 | $0 | $0 | $0 |
| Principal Repayment of Current Borrowing | $0 | $0 | $0 | $10,000,000 | ($1,529,874) |
| Other Liabilities Principal Repayment | $100,000 | $0 | $100,000 | $100,000 | $35,462 |
| Long-term Liabilities Principal Repayment | $327,241 | $360,354 | $396,390 | $436,029 | $453,407 |
| Purchase Other Current Assets | $300,000 | $900,000 | $1,300,000 | $4,000,000 | $6,200,000 |
| Purchase Long-term Assets | $180,000 | $400,000 | $2,700,000 | $2,000,000 | $6,200,000 |
| Dividends | $0 | $0 | $0 | $0 | $20,000,000 |
| Subtotal Cash Spent | $37,309,801 | $54,821,254 | $77,247,599 | $124,994,402 | $196,606,342 |
| Net Cash Flow | $10,172,213 | $35,988,803 | $45,417,749 | $59,946,966 | $87,154,089 |
| Cash Balance | $10,179,922 | $46,168,725 | $91,586,474 | $151,533,440 | $238,687,529 |
7.5 Projected Balance Sheet
The balance sheet is quite solid. We do not project any real trouble meeting our debt obligations–as long as we can achieve our specific objectives.
| Pro Forma Balance Sheet | |||||
| FY 2004 | FY 2005 | FY 2006 | FY 2007 | FY 2008 | |
| Assets | |||||
| Current Assets | |||||
| Cash | $10,179,922 | $46,168,725 | $91,586,474 | $151,533,440 | $238,687,529 |
| Accounts Receivable | $14,466,400 | $21,121,314 | $31,381,748 | $47,456,941 | $73,028,579 |
| Inventory | $3,446,543 | $5,032,041 | $7,476,535 | $11,306,365 | $17,398,672 |
| Other Current Assets | $493,429 | $1,393,429 | $2,693,429 | $6,693,429 | $12,893,429 |
| Total Current Assets | $28,586,294 | $73,715,509 | $133,138,186 | $216,990,175 | $342,008,208 |
| Long-term Assets | |||||
| Long-term Assets | $1,659,498 | $2,059,498 | $4,759,498 | $6,759,498 | $12,959,498 |
| Accumulated Depreciation | $166,002 | $30,366,002 | $70,266,002 | $123,066,002 | $192,666,002 |
| Total Long-term Assets | $1,493,496 | ($28,306,504) | ($65,506,504) | ($116,306,504) | ($179,706,504) |
| Total Assets | $30,079,790 | $45,409,005 | $67,631,682 | $100,683,671 | $162,301,704 |
| Liabilities and Capital | FY 2004 | FY 2005 | FY 2006 | FY 2007 | FY 2008 |
| Current Liabilities | |||||
| Accounts Payable | $7,069,294 | $4,100,266 | $6,119,138 | $9,134,565 | $13,948,599 |
| Current Borrowing | $470,126 | $8,470,126 | $8,470,126 | ($1,529,874) | $0 |
| Other Current Liabilities | $235,462 | $235,462 | $135,462 | $35,462 | $0 |
| Subtotal Current Liabilities | $7,774,882 | $12,805,854 | $14,724,726 | $7,640,153 | $13,948,599 |
| Long-term Liabilities | $1,646,180 | $1,285,826 | $889,436 | $453,407 | $0 |
| Total Liabilities | $9,421,062 | $14,091,680 | $15,614,162 | $8,093,560 | $13,948,599 |
| Paid-in Capital | $676,193 | $676,193 | $676,193 | $676,193 | $676,193 |
| Retained Earnings | ($946,874) | $19,982,535 | $30,641,132 | $51,341,327 | $71,913,918 |
| Earnings | $20,929,409 | $10,658,597 | $20,700,195 | $40,572,591 | $75,762,994 |
| Total Capital | $20,658,728 | $31,317,325 | $52,017,520 | $92,590,111 | $148,353,105 |
| Total Liabilities and Capital | $30,079,790 | $45,409,005 | $67,631,682 | $100,683,671 | $162,301,704 |
| Net Worth | $20,658,728 | $31,317,325 | $52,017,520 | $92,590,111 | $148,353,105 |
7.6 Business Ratios
The following table outlines some of the more important ratios from the Office Computer Automation Systems Integration industry. The final column, Industry Profile, details specific ratios based on the industry as it is classified by the Standard Industry Classification (SIC) code, 7373.0202.
| Ratio Analysis | ||||||
| FY 2004 | FY 2005 | FY 2006 | FY 2007 | FY 2008 | Industry Profile | |
| Sales Growth | 2296.36% | 46.00% | 48.58% | 51.22% | 53.88% | 9.53% |
| Percent of Total Assets | ||||||
| Accounts Receivable | 48.09% | 46.51% | 46.40% | 47.13% | 45.00% | 27.73% |
| Inventory | 11.46% | 11.08% | 11.05% | 11.23% | 10.72% | 5.15% |
| Other Current Assets | 1.64% | 3.07% | 3.98% | 6.65% | 7.94% | 47.52% |
| Total Current Assets | 95.03% | 162.34% | 196.86% | 215.52% | 210.72% | 80.40% |
| Long-term Assets | 4.97% | -62.34% | -96.86% | -115.52% | -110.72% | 19.60% |
| Total Assets | 100.00% | 100.00% | 100.00% | 100.00% | 100.00% | 100.00% |
| Current Liabilities | 25.85% | 28.20% | 21.77% | 7.59% | 8.59% | 35.94% |
| Long-term Liabilities | 5.47% | 2.83% | 1.32% | 0.45% | 0.00% | 21.59% |
| Total Liabilities | 31.32% | 31.03% | 23.09% | 8.04% | 8.59% | 57.53% |
| Net Worth | 68.68% | 68.97% | 76.91% | 91.96% | 91.41% | 42.47% |
| Percent of Sales | ||||||
| Sales | 100.00% | 100.00% | 100.00% | 100.00% | 100.00% | 100.00% |
| Gross Margin | 64.99% | 65.53% | 66.01% | 66.52% | 66.99% | 100.00% |
| Selling, General & Administrative Expenses | 21.55% | 21.37% | 21.25% | 21.17% | 21.11% | 82.72% |
| Advertising Expenses | 0.00% | 0.00% | 0.00% | 0.00% | 0.00% | 1.19% |
| Profit Before Interest and Taxes | 49.16% | 17.68% | 22.97% | 29.04% | 34.97% | 0.94% |
| Main Ratios | ||||||
| Current | 3.68 | 5.76 | 9.04 | 28.40 | 24.52 | 1.72 |
| Quick | 3.23 | 5.36 | 8.53 | 26.92 | 23.27 | 1.36 |
| Total Debt to Total Assets | 31.32% | 31.03% | 23.09% | 8.04% | 8.59% | 1.50% |
| Pre-tax Return on Net Worth | 144.73% | 48.62% | 56.85% | 62.60% | 72.96% | 65.79% |
| Pre-tax Return on Assets | 99.40% | 33.53% | 43.72% | 57.57% | 66.69% | 4.39% |
| Additional Ratios | FY 2004 | FY 2005 | FY 2006 | FY 2007 | FY 2008 | |
| Net Profit Margin | 34.16% | 11.91% | 15.57% | 20.18% | 24.49% | n.a |
| Return on Equity | 101.31% | 34.03% | 39.79% | 43.82% | 51.07% | n.a |
| Activity Ratios | ||||||
| Accounts Receivable Turnover | 3.18 | 3.18 | 3.18 | 3.18 | 3.18 | n.a |
| Collection Days | 55 | 97 | 96 | 95 | 95 | n.a |
| Inventory Turnover | 10.91 | 6.33 | 6.38 | 6.42 | 6.47 | n.a |
| Accounts Payable Turnover | 6.08 | 12.17 | 12.17 | 12.17 | 12.17 | n.a |
| Payment Days | 27 | 41 | 25 | 25 | 25 | n.a |
| Total Asset Turnover | 2.04 | 1.97 | 1.97 | 2.00 | 1.91 | n.a |
| Debt Ratios | ||||||
| Debt to Net Worth | 0.46 | 0.45 | 0.30 | 0.09 | 0.09 | n.a |
| Current Liab. to Liab. | 0.83 | 0.91 | 0.94 | 0.94 | 1.00 | n.a |
| Liquidity Ratios | ||||||
| Net Working Capital | $20,811,413 | $60,909,655 | $118,413,460 | $209,350,022 | $328,059,609 | n.a |
| Interest Coverage | 133.26 | 26.65 | 31.94 | 140.95 | 0.00 | n.a |
| Additional Ratios | ||||||
| Assets to Sales | 0.49 | 0.51 | 0.51 | 0.50 | 0.52 | n.a |
| Current Debt/Total Assets | 26% | 28% | 22% | 8% | 9% | n.a |
| Acid Test | 1.37 | 3.71 | 6.40 | 20.71 | 18.04 | n.a |
| Sales/Net Worth | 2.97 | 2.86 | 2.56 | 2.17 | 2.09 | n.a |
| Dividend Payout | 0.00 | 0.00 | 0.00 | 0.00 | 0.26 | n.a |
7.7 Long-term Plan
We expect to increase our KMCI sales substantially by 2008, while also increasing gross margin. To achieve this will require the sales force to sell reasonable numbers of units each month. In the past our greatest problem was simply that our sales force was not effective. We have designed and implemented programs to correct this problem, and it has been working.
Appendix
| Sales Forecast | |||||||||||||
| Feb | Mar | Apr | May | Jun | Jul | Aug | Sep | Oct | Nov | Dec | Jan | ||
| Unit Sales | |||||||||||||
| Basic PC | 0% | 75 | 100 | 125 | 180 | 210 | 220 | 250 | 275 | 290 | 300 | 320 | 340 |
| Intermediate PC | 0% | 100 | 110 | 120 | 140 | 150 | 180 | 200 | 250 | 300 | 340 | 370 | 370 |
| Power PC | 0% | 120 | 130 | 140 | 160 | 180 | 200 | 220 | 240 | 260 | 280 | 300 | 320 |
| Laptop | 0% | 25 | 50 | 75 | 100 | 125 | 160 | 180 | 200 | 220 | 240 | 260 | 280 |
| Basic Printer | 0% | 100 | 120 | 140 | 150 | 160 | 170 | 180 | 190 | 200 | 220 | 240 | 260 |
| Intermediate Printer | 0% | 50 | 75 | 100 | 125 | 150 | 200 | 250 | 300 | 325 | 350 | 380 | 400 |
| Power Printer | 0% | 20 | 40 | 60 | 80 | 100 | 150 | 200 | 250 | 300 | 325 | 350 | 400 |
| Basic Network Server | 0% | 10 | 20 | 30 | 40 | 50 | 60 | 80 | 100 | 150 | 200 | 250 | 300 |
| Intermediate Network Server | 0% | 25 | 30 | 35 | 40 | 45 | 50 | 125 | 150 | 200 | 250 | 300 | 350 |
| Power Network Server | 0% | 10 | 20 | 30 | 40 | 50 | 75 | 95 | 105 | 125 | 130 | 145 | 190 |
| Other | 0% | 0 | 0 | 0 | 0 | 0 | 0 | 0 | 0 | 0 | 0 | 0 | 0 |
| Total Unit Sales | 535 | 695 | 855 | 1,055 | 1,220 | 1,465 | 1,780 | 2,060 | 2,370 | 2,635 | 2,915 | 3,210 | |
| Unit Prices | Feb | Mar | Apr | May | Jun | Jul | Aug | Sep | Oct | Nov | Dec | Jan | |
| Basic PC | $1,634.00 | $1,634.00 | $1,634.00 | $1,634.00 | $1,634.00 | $1,634.00 | $1,634.00 | $1,634.00 | $1,634.00 | $1,634.00 | $1,634.00 | $1,634.00 | |
| Intermediate PC | $2,523.00 | $2,523.00 | $2,523.00 | $2,523.00 | $2,523.00 | $2,523.00 | $2,523.00 | $2,523.00 | $2,523.00 | $2,523.00 | $2,523.00 | $2,523.00 | |
| Power PC | $3,212.00 | $3,212.00 | $3,212.00 | $3,212.00 | $3,212.00 | $3,212.00 | $3,212.00 | $3,212.00 | $3,212.00 | $3,212.00 | $3,212.00 | $3,212.00 | |
| Laptop | $2,483.00 | $2,483.00 | $2,483.00 | $2,483.00 | $2,483.00 | $2,483.00 | $2,483.00 | $2,483.00 | $2,483.00 | $2,483.00 | $2,483.00 | $2,483.00 | |
| Basic Printer | $465.00 | $465.00 | $465.00 | $465.00 | $465.00 | $465.00 | $465.00 | $465.00 | $465.00 | $465.00 | $465.00 | $465.00 | |
| Intermediate Printer | $1,393.00 | $1,393.00 | $1,393.00 | $1,393.00 | $1,393.00 | $1,393.00 | $1,393.00 | $1,393.00 | $1,393.00 | $1,393.00 | $1,393.00 | $1,393.00 | |
| Power Printer | $3,368.00 | $3,368.00 | $3,368.00 | $3,368.00 | $3,368.00 | $3,368.00 | $3,368.00 | $3,368.00 | $3,368.00 | $3,368.00 | $3,368.00 | $3,368.00 | |
| Basic Network Server | $3,883.00 | $3,883.00 | $3,883.00 | $3,883.00 | $3,883.00 | $3,883.00 | $3,883.00 | $3,883.00 | $3,883.00 | $3,883.00 | $3,883.00 | $3,883.00 | |
| Intermediate Network Server | $6,351.00 | $6,351.00 | $6,351.00 | $6,351.00 | $6,351.00 | $6,351.00 | $6,351.00 | $6,351.00 | $6,351.00 | $6,351.00 | $6,351.00 | $6,351.00 | |
| Power Network Server | $9,573.00 | $9,573.00 | $9,573.00 | $9,573.00 | $9,573.00 | $9,573.00 | $9,573.00 | $9,573.00 | $9,573.00 | $9,573.00 | $9,573.00 | $9,573.00 | |
| Other | $0.00 | $0.00 | $0.00 | $0.00 | $0.00 | $0.00 | $0.00 | $0.00 | $0.00 | $0.00 | $0.00 | $0.00 | |
| Sales | |||||||||||||
| Basic PC | $122,550 | $163,400 | $204,250 | $294,120 | $343,140 | $359,480 | $408,500 | $449,350 | $473,860 | $490,200 | $522,880 | $555,560 | |
| Intermediate PC | $252,300 | $277,530 | $302,760 | $353,220 | $378,450 | $454,140 | $504,600 | $630,750 | $756,900 | $857,820 | $933,510 | $933,510 | |
| Power PC | $385,440 | $417,560 | $449,680 | $513,920 | $578,160 | $642,400 | $706,640 | $770,880 | $835,120 | $899,360 | $963,600 | $1,027,840 | |
| Laptop | $62,075 | $124,150 | $186,225 | $248,300 | $310,375 | $397,280 | $446,940 | $496,600 | $546,260 | $595,920 | $645,580 | $695,240 | |
| Basic Printer | $46,500 | $55,800 | $65,100 | $69,750 | $74,400 | $79,050 | $83,700 | $88,350 | $93,000 | $102,300 | $111,600 | $120,900 | |
| Intermediate Printer | $69,650 | $104,475 | $139,300 | $174,125 | $208,950 | $278,600 | $348,250 | $417,900 | $452,725 | $487,550 | $529,340 | $557,200 | |
| Power Printer | $67,360 | $134,720 | $202,080 | $269,440 | $336,800 | $505,200 | $673,600 | $842,000 | $1,010,400 | $1,094,600 | $1,178,800 | $1,347,200 | |
| Basic Network Server | $38,830 | $77,660 | $116,490 | $155,320 | $194,150 | $232,980 | $310,640 | $388,300 | $582,450 | $776,600 | $970,750 | $1,164,900 | |
| Intermediate Network Server | $158,775 | $190,530 | $222,285 | $254,040 | $285,795 | $317,550 | $793,875 | $952,650 | $1,270,200 | $1,587,750 | $1,905,300 | $2,222,850 | |
| Power Network Server | $95,730 | $191,460 | $287,190 | $382,920 | $478,650 | $717,975 | $909,435 | $1,005,165 | $1,196,625 | $1,244,490 | $1,388,085 | $1,818,870 | |
| Other | $0 | $0 | $0 | $0 | $0 | $0 | $0 | $0 | $0 | $0 | $0 | $0 | |
| Total Sales | $1,299,210 | $1,737,285 | $2,175,360 | $2,715,155 | $3,188,870 | $3,984,655 | $5,186,180 | $6,041,945 | $7,217,540 | $8,136,590 | $9,149,445 | $10,444,070 | |
| Direct Unit Costs | Feb | Mar | Apr | May | Jun | Jul | Aug | Sep | Oct | Nov | Dec | Jan | |
| Basic PC | 0.00% | $490.20 | $490.20 | $490.20 | $490.20 | $490.20 | $490.20 | $490.20 | $490.20 | $490.20 | $490.20 | $490.20 | $490.20 |
| Intermediate PC | 0.00% | $756.90 | $756.90 | $756.90 | $756.90 | $756.90 | $756.90 | $756.90 | $756.90 | $756.90 | $756.90 | $756.90 | $756.90 |
| Power PC | 0.00% | $963.60 | $963.60 | $963.60 | $963.60 | $963.60 | $963.60 | $963.60 | $963.60 | $963.60 | $963.60 | $963.60 | $963.60 |
| Laptop | 0.00% | $744.90 | $744.90 | $744.90 | $744.90 | $744.90 | $744.90 | $744.90 | $744.90 | $744.90 | $744.90 | $744.90 | $744.90 |
| Basic Printer | 0.00% | $139.50 | $139.50 | $139.50 | $139.50 | $139.50 | $139.50 | $139.50 | $139.50 | $139.50 | $139.50 | $139.50 | $139.50 |
| Intermediate Printer | 0.00% | $417.90 | $417.90 | $417.90 | $417.90 | $417.90 | $417.90 | $417.90 | $417.90 | $417.90 | $417.90 | $417.90 | $417.90 |
| Power Printer | 0.00% | $1,010.40 | $1,010.40 | $1,010.40 | $1,010.40 | $1,010.40 | $1,010.40 | $1,010.40 | $1,010.40 | $1,010.40 | $1,010.40 | $1,010.40 | $1,010.40 |
| Basic Network Server | 0.00% | $1,164.90 | $1,164.90 | $1,164.90 | $1,164.90 | $1,164.90 | $1,164.90 | $1,164.90 | $1,164.90 | $1,164.90 | $1,164.90 | $1,164.90 | $1,164.90 |
| Intermediate Network Server | 0.00% | $1,905.30 | $1,905.30 | $1,905.30 | $1,905.30 | $1,905.30 | $1,905.30 | $1,905.30 | $1,905.30 | $1,905.30 | $1,905.30 | $1,905.30 | $1,905.30 |
| Power Network Server | 0.00% | $2,871.90 | $2,871.90 | $2,871.90 | $2,871.90 | $2,871.90 | $2,871.90 | $2,871.90 | $2,871.90 | $2,871.90 | $2,871.90 | $2,871.90 | $2,871.90 |
| Other | 0.00% | $0.00 | $0.00 | $0.00 | $0.00 | $0.00 | $0.00 | $0.00 | $0.00 | $0.00 | $0.00 | $0.00 | $0.00 |
| Direct Cost of Sales | |||||||||||||
| Basic PC | $36,765 | $49,020 | $61,275 | $88,236 | $102,942 | $107,844 | $122,550 | $134,805 | $142,158 | $147,060 | $156,864 | $166,668 | |
| Intermediate PC | $75,690 | $83,259 | $90,828 | $105,966 | $113,535 | $136,242 | $151,380 | $189,225 | $227,070 | $257,346 | $280,053 | $280,053 | |
| Power PC | $115,632 | $125,268 | $134,904 | $154,176 | $173,448 | $192,720 | $211,992 | $231,264 | $250,536 | $269,808 | $289,080 | $308,352 | |
| Laptop | $18,623 | $37,245 | $55,868 | $74,490 | $93,113 | $119,184 | $134,082 | $148,980 | $163,878 | $178,776 | $193,674 | $208,572 | |
| Basic Printer | $13,950 | $16,740 | $19,530 | $20,925 | $22,320 | $23,715 | $25,110 | $26,505 | $27,900 | $30,690 | $33,480 | $36,270 | |
| Intermediate Printer | $20,895 | $31,343 | $41,790 | $52,238 | $62,685 | $83,580 | $104,475 | $125,370 | $135,818 | $146,265 | $158,802 | $167,160 | |
| Power Printer | $20,208 | $40,416 | $60,624 | $80,832 | $101,040 | $151,560 | $202,080 | $252,600 | $303,120 | $328,380 | $353,640 | $404,160 | |
| Basic Network Server | $11,649 | $23,298 | $34,947 | $46,596 | $58,245 | $69,894 | $93,192 | $116,490 | $174,735 | $232,980 | $291,225 | $349,470 | |
| Intermediate Network Server | $47,633 | $57,159 | $66,686 | $76,212 | $85,739 | $95,265 | $238,163 | $285,795 | $381,060 | $476,325 | $571,590 | $666,855 | |
| Power Network Server | $28,719 | $57,438 | $86,157 | $114,876 | $143,595 | $215,393 | $272,831 | $301,550 | $358,988 | $373,347 | $416,426 | $545,661 | |
| Other | $0 | $0 | $0 | $0 | $0 | $0 | $0 | $0 | $0 | $0 | $0 | $0 | |
| Subtotal Direct Cost of Sales | $389,763 | $521,186 | $652,608 | $814,547 | $956,661 | $1,195,397 | $1,555,854 | $1,812,584 | $2,165,262 | $2,440,977 | $2,744,834 | $3,133,221 | |
| Personnel Plan | |||||||||||||
| Feb | Mar | Apr | May | Jun | Jul | Aug | Sep | Oct | Nov | Dec | Jan | ||
| Kit Puma – Chairman of the Board | 0% | $8,500 | $8,500 | $5,800 | $8,500 | $8,500 | $8,500 | $8,500 | $8,500 | $8,500 | $8,500 | $8,500 | $8,500 |
| Lynx Caracal – President & CEO | 0% | $4,166 | $4,166 | $4,166 | $4,166 | $4,166 | $4,166 | $4,166 | $4,166 | $4,166 | $4,166 | $4,166 | $4,166 |
| Neve Palenque – Vice President | 0% | $3,950 | $3,950 | $3,950 | $3,950 | $3,950 | $3,950 | $3,950 | $3,950 | $3,950 | $3,950 | $3,950 | $3,950 |
| Felidae Kalakmul – Secretary | 0% | $3,750 | $3,750 | $3,750 | $3,750 | $3,750 | $3,750 | $3,750 | $3,750 | $3,750 | $3,750 | $3,750 | $3,750 |
| Panthera Dos Pilas, CPA – Treasurer | 0% | $1,500 | $1,500 | $1,500 | $1,500 | $1,500 | $1,500 | $1,500 | $1,500 | $1,500 | $1,500 | $1,500 | $1,500 |
| Marketing Director (not yet hired) | 0% | $0 | $0 | $3,750 | $3,750 | $3,750 | $3,750 | $3,750 | $3,750 | $3,750 | $3,750 | $3,750 | $3,750 |
| Other | 0% | $0 | $0 | $0 | $0 | $0 | $0 | $0 | $0 | $0 | $0 | $0 | $0 |
| Total People | 4 | 4 | 4 | 4 | 4 | 4 | 4 | 4 | 4 | 4 | 4 | 4 | |
| Total Payroll | $21,866 | $21,866 | $22,916 | $25,616 | $25,616 | $25,616 | $25,616 | $25,616 | $25,616 | $25,616 | $25,616 | $25,616 | |
| General Assumptions | |||||||||||||
| Feb | Mar | Apr | May | Jun | Jul | Aug | Sep | Oct | Nov | Dec | Jan | ||
| Plan Month | 1 | 2 | 3 | 4 | 5 | 6 | 7 | 8 | 9 | 10 | 11 | 12 | |
| Current Interest Rate | 10.00% | 10.00% | 10.00% | 10.00% | 10.00% | 10.00% | 10.00% | 10.00% | 10.00% | 10.00% | 10.00% | 10.00% | |
| Long-term Interest Rate | 10.00% | 10.00% | 10.00% | 10.00% | 10.00% | 10.00% | 10.00% | 10.00% | 10.00% | 10.00% | 10.00% | 10.00% | |
| Tax Rate | 30.00% | 30.00% | 30.00% | 30.00% | 30.00% | 30.00% | 30.00% | 30.00% | 30.00% | 30.00% | 30.00% | 30.00% | |
| Other | 1 | 1 | 1 | 1 | 1 | 1 | 1 | 1 | 1 | 1 | 1 | 1 | |
| Pro Forma Profit and Loss | |||||||||||||
| Feb | Mar | Apr | May | Jun | Jul | Aug | Sep | Oct | Nov | Dec | Jan | ||
| Sales | $1,299,210 | $1,737,285 | $2,175,360 | $2,715,155 | $3,188,870 | $3,984,655 | $5,186,180 | $6,041,945 | $7,217,540 | $8,136,590 | $9,149,445 | $10,444,070 | |
| Direct Cost of Sales | $389,763 | $521,186 | $652,608 | $814,547 | $956,661 | $1,195,397 | $1,555,854 | $1,812,584 | $2,165,262 | $2,440,977 | $2,744,834 | $3,133,221 | |
| Other Costs of Goods | 5% | $60,000 | $90,000 | $110,000 | $140,000 | $160,000 | $200,000 | $260,000 | $300,000 | $360,000 | $410,000 | $460,000 | $520,000 |
| Total Cost of Sales | $449,763 | $611,186 | $762,608 | $954,547 | $1,116,661 | $1,395,397 | $1,815,854 | $2,112,584 | $2,525,262 | $2,850,977 | $3,204,834 | $3,653,221 | |
| Gross Margin | $849,447 | $1,126,100 | $1,412,752 | $1,760,609 | $2,072,209 | $2,589,259 | $3,370,326 | $3,929,362 | $4,692,278 | $5,285,613 | $5,944,612 | $6,790,849 | |
| Gross Margin % | 65.38% | 64.82% | 64.94% | 64.84% | 64.98% | 64.98% | 64.99% | 65.03% | 65.01% | 64.96% | 64.97% | 65.02% | |
| Expenses | |||||||||||||
| Payroll | $21,866 | $21,866 | $22,916 | $25,616 | $25,616 | $25,616 | $25,616 | $25,616 | $25,616 | $25,616 | $25,616 | $25,616 | |
| Divisions payroll (see note) | 20% | $0 | $0 | $0 | $0 | $0 | $0 | $0 | $0 | $0 | $0 | $0 | $100,000 |
| Depreciation | 1% | $0 | $0 | $0 | $0 | $0 | $0 | $0 | $0 | $0 | $0 | $0 | $0 |
| Divisions operating expense (see note) | 38% | $200,000 | $300,000 | $300,000 | $400,000 | $500,000 | $600,000 | $800,000 | $900,000 | $1,100,000 | $1,200,000 | $1,400,000 | $1,600,000 |
| Payroll Taxes | 15% | $0 | $0 | $0 | $0 | $0 | $0 | $0 | $0 | $0 | $0 | $0 | $1,000 |
| Other | 1% | $0 | $0 | $0 | $0 | $0 | $0 | $0 | $0 | $0 | $0 | $0 | $0 |
| Total Operating Expenses | $221,866 | $321,866 | $322,916 | $425,616 | $525,616 | $625,616 | $825,616 | $925,616 | $1,125,616 | $1,225,616 | $1,425,616 | $1,726,616 | |
| Profit Before Interest and Taxes | $627,581 | $804,234 | $1,089,836 | $1,334,993 | $1,546,593 | $1,963,643 | $2,544,710 | $3,003,746 | $3,566,662 | $4,059,997 | $4,518,996 | $5,064,233 | |
| EBITDA | $627,581 | $804,234 | $1,089,836 | $1,334,993 | $1,546,593 | $1,963,643 | $2,544,710 | $3,003,746 | $3,566,662 | $4,059,997 | $4,518,996 | $5,064,233 | |
| Interest Expense | $19,313 | $19,927 | $19,706 | $19,484 | $19,260 | $19,033 | $18,805 | $18,575 | $18,343 | $18,109 | $17,874 | $17,636 | |
| Taxes Incurred | $182,481 | $235,292 | $321,039 | $394,653 | $458,200 | $583,383 | $757,771 | $895,551 | $1,064,496 | $1,212,566 | $1,350,337 | $1,513,979 | |
| Net Profit | $425,788 | $549,015 | $749,091 | $920,856 | $1,069,133 | $1,361,226 | $1,768,133 | $2,089,619 | $2,483,823 | $2,829,321 | $3,150,785 | $3,532,618 | |
| Net Profit/Sales | 32.77% | 31.60% | 34.44% | 33.92% | 33.53% | 34.16% | 34.09% | 34.59% | 34.41% | 34.77% | 34.44% | 33.82% | |
| Pro Forma Cash Flow | |||||||||||||
| Feb | Mar | Apr | May | Jun | Jul | Aug | Sep | Oct | Nov | Dec | Jan | ||
| Cash Received | |||||||||||||
| Cash from Operations | |||||||||||||
| Cash Sales | $324,803 | $434,321 | $543,840 | $678,789 | $797,218 | $996,164 | $1,296,545 | $1,510,486 | $1,804,385 | $2,034,148 | $2,287,361 | $2,611,018 | |
| Cash from Receivables | $286,055 | $318,535 | $985,359 | $1,313,916 | $1,645,015 | $2,048,209 | $2,411,547 | $3,018,529 | $3,911,029 | $4,560,849 | $5,436,131 | $6,127,764 | |
| Subtotal Cash from Operations | $610,857 | $752,856 | $1,529,199 | $1,992,704 | $2,442,232 | $3,044,373 | $3,708,092 | $4,529,016 | $5,715,414 | $6,594,996 | $7,723,493 | $8,738,781 | |
| Additional Cash Received | |||||||||||||
| Sales Tax, VAT, HST/GST Received | 0.00% | $0 | $0 | $0 | $0 | $0 | $0 | $0 | $0 | $0 | $0 | $0 | $0 |
| New Current Borrowing | $0 | $100,000 | $0 | $0 | $0 | $0 | $0 | $0 | $0 | $0 | $0 | $0 | |
| New Other Liabilities (interest-free) | $0 | $0 | $0 | $0 | $0 | $0 | $0 | $0 | $0 | $0 | $0 | $0 | |
| New Long-term Liabilities | $0 | $0 | $0 | $0 | $0 | $0 | $0 | $0 | $0 | $0 | $0 | $0 | |
| Sales of Other Current Assets | $0 | $0 | $0 | $0 | $0 | $0 | $0 | $0 | $0 | $0 | $0 | $0 | |
| Sales of Long-term Assets | $0 | $0 | $0 | $0 | $0 | $0 | $0 | $0 | $0 | $0 | $0 | $0 | |
| New Investment Received | $0 | $0 | $0 | $0 | $0 | $0 | $0 | $0 | $0 | $0 | $0 | $0 | |
| Subtotal Cash Received | $610,857 | $852,856 | $1,529,199 | $1,992,704 | $2,442,232 | $3,044,373 | $3,708,092 | $4,529,016 | $5,715,414 | $6,594,996 | $7,723,493 | $8,738,781 | |
| Expenditures | Feb | Mar | Apr | May | Jun | Jul | Aug | Sep | Oct | Nov | Dec | Jan | |
| Expenditures from Operations | |||||||||||||
| Cash Spending | $21,866 | $21,866 | $22,916 | $25,616 | $25,616 | $25,616 | $25,616 | $25,616 | $25,616 | $25,616 | $25,616 | $25,616 | |
| Bill Payments | $192,426 | $809,984 | $1,318,868 | $1,561,215 | $1,956,936 | $2,270,779 | $2,891,372 | $3,802,940 | $4,238,677 | $5,112,344 | $5,609,017 | $6,340,812 | |
| Subtotal Spent on Operations | $214,292 | $831,850 | $1,341,784 | $1,586,831 | $1,982,552 | $2,296,395 | $2,916,988 | $3,828,556 | $4,264,293 | $5,137,960 | $5,634,633 | $6,366,428 | |
| Additional Cash Spent | |||||||||||||
| Sales Tax, VAT, HST/GST Paid Out | $0 | $0 | $0 | $0 | $0 | $0 | $0 | $0 | $0 | $0 | $0 | $0 | |
| Principal Repayment of Current Borrowing | $0 | $0 | $0 | $0 | $0 | $0 | $0 | $0 | $0 | $0 | $0 | $0 | |
| Other Liabilities Principal Repayment | $100,000 | $0 | $0 | $0 | $0 | $0 | $0 | $0 | $0 | $0 | $0 | $0 | |
| Long-term Liabilities Principal Repayment | $26,043 | $26,260 | $26,479 | $26,699 | $26,922 | $27,146 | $27,372 | $27,600 | $27,830 | $28,062 | $28,296 | $28,532 | |
| Purchase Other Current Assets | $25,000 | $25,000 | $25,000 | $25,000 | $25,000 | $25,000 | $25,000 | $25,000 | $25,000 | $25,000 | $25,000 | $25,000 | |
| Purchase Long-term Assets | $15,000 | $15,000 | $15,000 | $15,000 | $15,000 | $15,000 | $15,000 | $15,000 | $15,000 | $15,000 | $15,000 | $15,000 | |
| Dividends | $0 | $0 | $0 | $0 | $0 | $0 | $0 | $0 | $0 | $0 | $0 | $0 | |
| Subtotal Cash Spent | $380,334 | $898,109 | $1,408,262 | $1,653,530 | $2,049,474 | $2,363,541 | $2,984,360 | $3,896,156 | $4,332,123 | $5,206,022 | $5,702,930 | $6,434,960 | |
| Net Cash Flow | $230,523 | ($45,253) | $120,937 | $339,175 | $392,758 | $680,832 | $723,732 | $632,859 | $1,383,291 | $1,388,974 | $2,020,563 | $2,303,822 | |
| Cash Balance | $238,232 | $192,978 | $313,916 | $653,090 | $1,045,849 | $1,726,680 | $2,450,412 | $3,083,272 | $4,466,563 | $5,855,537 | $7,876,100 | $10,179,922 | |
| Pro Forma Balance Sheet | |||||||||||||
| Feb | Mar | Apr | May | Jun | Jul | Aug | Sep | Oct | Nov | Dec | Jan | ||
| Assets | Starting Balances | ||||||||||||
| Current Assets | |||||||||||||
| Cash | $7,709 | $238,232 | $192,978 | $313,916 | $653,090 | $1,045,849 | $1,726,680 | $2,450,412 | $3,083,272 | $4,466,563 | $5,855,537 | $7,876,100 | $10,179,922 |
| Accounts Receivable | $572,109 | $1,260,462 | $2,244,891 | $2,891,052 | $3,613,502 | $4,360,140 | $5,300,422 | $6,778,510 | $8,291,439 | $9,793,565 | $11,335,159 | $12,761,112 | $14,466,400 |
| Inventory | $487,587 | $428,739 | $573,304 | $717,869 | $896,001 | $1,052,327 | $1,314,936 | $1,711,439 | $1,993,842 | $2,381,788 | $2,685,075 | $3,019,317 | $3,446,543 |
| Other Current Assets | $193,429 | $218,429 | $243,429 | $268,429 | $293,429 | $318,429 | $343,429 | $368,429 | $393,429 | $418,429 | $443,429 | $468,429 | $493,429 |
| Total Current Assets | $1,260,834 | $2,145,862 | $3,254,602 | $4,191,265 | $5,456,023 | $6,776,745 | $8,685,468 | $11,308,791 | $13,761,982 | $17,060,345 | $20,319,200 | $24,124,957 | $28,586,294 |
| Long-term Assets | |||||||||||||
| Long-term Assets | $1,479,498 | $1,494,498 | $1,509,498 | $1,524,498 | $1,539,498 | $1,554,498 | $1,569,498 | $1,584,498 | $1,599,498 | $1,614,498 | $1,629,498 | $1,644,498 | $1,659,498 |
| Accumulated Depreciation | $166,002 | $166,002 | $166,002 | $166,002 | $166,002 | $166,002 | $166,002 | $166,002 | $166,002 | $166,002 | $166,002 | $166,002 | $166,002 |
| Total Long-term Assets | $1,313,496 | $1,328,496 | $1,343,496 | $1,358,496 | $1,373,496 | $1,388,496 | $1,403,496 | $1,418,496 | $1,433,496 | $1,448,496 | $1,463,496 | $1,478,496 | $1,493,496 |
| Total Assets | $2,574,330 | $3,474,358 | $4,598,098 | $5,549,761 | $6,829,519 | $8,165,241 | $10,088,964 | $12,727,287 | $15,195,478 | $18,508,841 | $21,782,696 | $25,603,453 | $30,079,790 |
| Liabilities and Capital | Feb | Mar | Apr | May | Jun | Jul | Aug | Sep | Oct | Nov | Dec | Jan | |
| Current Liabilities | |||||||||||||
| Accounts Payable | $166,002 | $766,285 | $1,267,270 | $1,496,321 | $1,881,921 | $2,175,432 | $2,765,074 | $3,662,636 | $4,068,809 | $4,926,179 | $5,398,775 | $6,097,043 | $7,069,294 |
| Current Borrowing | $370,126 | $370,126 | $470,126 | $470,126 | $470,126 | $470,126 | $470,126 | $470,126 | $470,126 | $470,126 | $470,126 | $470,126 | $470,126 |
| Other Current Liabilities | $335,462 | $235,462 | $235,462 | $235,462 | $235,462 | $235,462 | $235,462 | $235,462 | $235,462 | $235,462 | $235,462 | $235,462 | $235,462 |
| Subtotal Current Liabilities | $871,590 | $1,371,873 | $1,972,858 | $2,201,909 | $2,587,509 | $2,881,020 | $3,470,662 | $4,368,224 | $4,774,397 | $5,631,767 | $6,104,363 | $6,802,631 | $7,774,882 |
| Long-term Liabilities | $1,973,421 | $1,947,378 | $1,921,119 | $1,894,640 | $1,867,941 | $1,841,019 | $1,813,873 | $1,786,501 | $1,758,901 | $1,731,071 | $1,703,008 | $1,674,712 | $1,646,180 |
| Total Liabilities | $2,845,011 | $3,319,251 | $3,893,977 | $4,096,549 | $4,455,450 | $4,722,039 | $5,284,536 | $6,154,725 | $6,533,297 | $7,362,838 | $7,807,371 | $8,477,343 | $9,421,062 |
| Paid-in Capital | $676,193 | $676,193 | $676,193 | $676,193 | $676,193 | $676,193 | $676,193 | $676,193 | $676,193 | $676,193 | $676,193 | $676,193 | $676,193 |
| Retained Earnings | ($946,874) | ($946,874) | ($946,874) | ($946,874) | ($946,874) | ($946,874) | ($946,874) | ($946,874) | ($946,874) | ($946,874) | ($946,874) | ($946,874) | ($946,874) |
| Earnings | $0 | $425,788 | $974,802 | $1,723,893 | $2,644,749 | $3,713,883 | $5,075,109 | $6,843,242 | $8,932,862 | $11,416,685 | $14,246,006 | $17,396,791 | $20,929,409 |
| Total Capital | ($270,681) | $155,107 | $704,121 | $1,453,212 | $2,374,068 | $3,443,202 | $4,804,428 | $6,572,561 | $8,662,181 | $11,146,004 | $13,975,325 | $17,126,110 | $20,658,728 |
| Total Liabilities and Capital | $2,574,330 | $3,474,358 | $4,598,098 | $5,549,761 | $6,829,519 | $8,165,241 | $10,088,964 | $12,727,287 | $15,195,478 | $18,508,841 | $21,782,696 | $25,603,453 | $30,079,790 |
| Net Worth | ($270,681) | $155,107 | $704,121 | $1,453,212 | $2,374,068 | $3,443,202 | $4,804,428 | $6,572,561 | $8,662,181 | $11,146,004 | $13,975,325 | $17,126,110 | $20,658,728 |

