
Latheethen Feeds
Executive Summary
The following plan is based on 16 years of experience, is highly focused and promises to follow a path of prosperity for its owners and staff. It is based on conservative sales figures, and actual sales may be higher. The projections contained herein are authentic and will be used as the budget for the business. Latheethen Feeds, Inc. will show a profit immediately, and will increase sales and profits each year thereafter.
Latheethen Feeds, Inc. is a well-established custom feed store. The company is engaged in the production of custom livestock feeds, bird feed, deer feed, and other animal products in relation to livestock animals, pets, etc. Latheethen Feeds, Inc. has recently expanded its production facility (custom mill) and is well-positioned to market its workroom production beyond its present client base. The company is dedicated to providing the highest quality customer service, meeting the agreed delivery dates, and keeping the sales prices controlled in accordance with ongoing market trends. The focus of this business plan is to identify future target clients, explain our marketing strategy, improve internal procedures so we can substantially increase profitability, and obtain the funding required to expand the business.
Latheethen Feeds, Inc. is located in Pleasantville, Michigan. The company is a privately owned corporation and has been operating for nearly 16 years. The previous owners live next door to the store, and are planning on moving to their retirement home in Northern Michigan, as soon as this business transaction is completed. However, since the current owners and new owners are in fact family, the current owners will be around if needed and to visit on a bi-weekly basis.
The six counties surrounding Latheethen Feeds contain an estimated 14,695 livestock farms, and 20,434 hunters. However, the entire state is an open market once delivery to customers is an option. Latheethen’s would then be in the market to compete for the business of 53,315 farms. USDA records show that a quarter of a billion dollars is spent annually on feed in the State of Michigan by these same farms. The company’s estimated existing share of the nearby market is less than 1%. Previously, the owners have established an estimated $140,000 of the state total on an annual basis. They have accomplished this without any form of advertisement, and without any outside sales. The new owners are focused on growing the business to gain a greater share, $260,000 annually, of the state total.
The marketing research and tailored marketing strategy described in this business plan will result in after-tax profits of $22,806 in Year 1 and increasing to nearly $30,000 in after-tax profits within three years, despite significant new advertising and renovation expenses.
To achieve these goals, Latheethen fields needs funding for two different phases of expansion. We are currently seeking a $15,000 short-term loan, to be repaid within two years. This loan will enable us to purchase a delivery truck, a key element of our new sales and marketing strategy. In early Year 2, we will need a second, long-term loan in the amount of $135,000, to build the area’s premier equine boarding stable. The addition of “Mid-Town Meadows” will not only be another source of revenue, but also another source of feed sales. Mid-Town Meadows will be a comfortable, inviting equine resort designed to make our customers and their horses feel as if they are enjoying VIP services in a world all to themselves. The decor and theme will be rustic (log exterior walls), yet formal (private club house overlooking the enclosed arena). The feed store is already located at the main entrance, next to a cascading water fountain and company signs.

1.1 Objectives
There are five primary objectives by which the success of Latheethen Feeds will be tracked:
- Maintain 100% of existing customer base by consistent customer service.
- Expand our customer base through direct referrals and agressive direct sales.
- Expand our product line gradually, based on customer requests.
- Expand our custom feed mill to meet the growing sales market.
- Expand the types of services offered to our customers, as their desires are identified.
1.2 Mission
Latheethen Feeds is a family owned and operated company, dedicated to providing our customers with the best premium products and services on the market. Latheethen’s offers all of our customers the direct personal attention they deserve. Our committment to customer service and satisfaction assures us that our customers are 100% satisfied with our products and services.
1.3 Keys to Success
The primary keys to the success of Latheethen Feeds are as follows:
- Product freshness and quality.
- Variety and price.
- Constant research of industry to keep knowledgeable of market needs.
- Management: products delivered on time, professional customer service, managing budgets.
- Constant evaluation of strengths and weaknesses with adjustments made as warranted.
Company Summary
Latheethen Feeds is a mid-Michigan based farm and feed store dedicated to providing our customers with professional services and high quality feed products. Latheethen’s offers only the best feed and products in the industry. Latheethen’s also offers our customers the option of a custom made feed. Our mill enables us to provide high levels of quality products that are always fresh and available. Latheethen’s primary focus is on keeping our customers satisfied. Professional and reliable service, competitive pricing, and a knowledgeable staff will provide for continued growth in the years to come.
Latheethen’s was founded in 1989 by Chris and Steve Latheethen. Their hard work and dedication has proven to be successful, as Latheethen’s is now one of the area’s premier feed stores and the only one specializing in custom-made feed.
The future of Latheethen’s is looking bright with younger family members taking over ownership. Our focus is on the core products, our sales and promotions emphasize our history and reputation for quality and customer service. With the addition of new energy and enthusiasm from younger owners, we will increase sales and the bottom line. Even though the new owners have the time, energy, interest and knowledge to invest in an already successful family business, our greatest asset will be our committment and pride in protecting and growing the business.
In the past, Latheethen’s has been just a feed store…in the future Latheethen’s will grow to become not only a larger provider of quality feeds, but also a boarding stable and resource for customer with inquiries about all areas of pet care.
2.1 Company Ownership
Latheethen Feeds, Inc. is a privately-held Michigan corporation. Chris Latheethen, Latheethen Feeds, Inc.’s founder, and her husband Steve Latheethen are the two current owners.

The new owners will share 50/50 ownership and they are as follows:
- Dennis Latheethen
- Kay Latheethen
2.2 Company History
Latheethen Feeds was founded in 1989 as a privately held corporation registered in Midland County, owned and operated by Chris and Steve Latheethen. It was originally a retail company that sold feed and supplies to local customers.
Chris and Steve recognized the need for more variety in products and more competitive pricing. Eventually this idea generated the need for a feed mill, which has greatly increased the success of the business. Producing custom feeds reduces the costs to almost 80% less than it costs to purchase a name brand feed. The custom-made feed has been Latheethen’s best seller because of quality and price.
The past performance table and chart show the increase in sales over the past three years. By adding a point of sale inventory and accounting system, we will be able to better track our best sellers and highest margin items, to increase net revenue. while our cost projections are accurate, the current owners have not tracked sales categories in as much detail as we will.
The previous year shows a large increase in the value of assets. This represents both the value of the acreage on which the business stands (contributed to the business by the current owners), and the recent purchase of the point of sale system which will be used to better track orders.

| Past Performance | |||
| FY 2002 | FY 2003 | FY 2004 | |
| Sales | $141,550 | $143,200 | $144,522 |
| Gross Margin | $37,314 | $39,930 | $28,695 |
| Gross Margin % | 26.36% | 27.88% | 19.86% |
| Operating Expenses | $34,497 | $33,896 | $28,940 |
| Inventory Turnover | 0.00 | 0.00 | 23.66 |
| Balance Sheet | |||
| FY 2002 | FY 2003 | FY 2004 | |
| Current Assets | |||
| Cash | $1,179 | $1,378 | $527 |
| Inventory | $2,198 | $2,198 | $8,904 |
| Other Current Assets | $0 | $0 | $75,463 |
| Total Current Assets | $3,377 | $3,576 | $84,894 |
| Long-term Assets | |||
| Long-term Assets | $39,625 | $39,625 | $170,000 |
| Accumulated Depreciation | $38,603 | $38,603 | $39,089 |
| Total Long-term Assets | $1,022 | $1,022 | $130,911 |
| Total Assets | $4,399 | $4,598 | $215,805 |
| Current Liabilities | |||
| Accounts Payable | $0 | $0 | $0 |
| Current Borrowing | $0 | $0 | $0 |
| Other Current Liabilities (interest free) | $0 | $0 | $0 |
| Total Current Liabilities | $0 | $0 | $0 |
| Long-term Liabilities | $0 | $0 | $0 |
| Total Liabilities | $0 | $0 | $0 |
| Paid-in Capital | $1,000 | $1,000 | $1,000 |
| Retained Earnings | $584 | ($2,436) | $205,465 |
| Earnings | $2,815 | $6,034 | $9,340 |
| Total Capital | $4,399 | $4,598 | $215,805 |
| Total Capital and Liabilities | $4,399 | $4,598 | $215,805 |
| Other Inputs | |||
| Payment Days | 0 | 0 | 0 |
Services
Latheethen Feeds, Inc. currently offers our customers products and supplies (Feed, Wormer, Treats, Beading, etc.) for the following animals:
- Birds (Caged and Wild)
- Cats and Dogs (Household Pets)
- Cattle
- Chickens
- Deer and Elk
- Horses
- Fish (Pond)
- Goats
- Pigs
- Llamas
- Lambs
- Rabbits
- Sheep
- Turkeys
Services
- Custom Made Feeds
- Delivery (Selective)
Latheethen Feeds will continue to offer all of the above great products, while evaluating the desire and need by our customers for the following items.
Products
- A Complete Line of Feeds for All Animals
- Books (Related to Animals)
- Deer Blinds
- Exotic Animal Feed
- Home and Garden Accessories
- Horse Tack
- Landscape Supplies
- Live Animals
- Organic Gardening
- Plants, Flowers and Trees
- Ponds and Water Gardens
- Shanties
- Tools and Gloves
Latheethen Feeds, Inc. will continue to offer the existing services, but we will also be expanding our services to include the following as customers demonstrate an interest in supporting the addition of such services.
Services
- Delivery (Full Time)
- Equine Massage
- Equine Boarding and Stable
Market Analysis Summary
Latheethen Feeds is the only custom feed manufacturer in the Midland, Michigan area and surrounding 50 mile radius. In the past, our market has been individual end users. Recent market analysis suggests that our custom feeds could be marketed to other direct feed stores outside of this 50 mile radius.
In reviewing our existing customer base, and recognize the broad range of local organizations such as 4-H and Future Farmers of America (FFA) and area farms and ranches, we have seen the possibilities for potential market growth. Latheethen’s has never had a direct sales force, advertised, or approached the specialized market they dominate with any zest for growth.
More than sixteen years in this business with success in the creation of formulas of high quality, cost-contained custom feed, mixed with the energy of youth and enthusiasm to grow this family business is greatly reinforced by the simple market analysis outlined below.
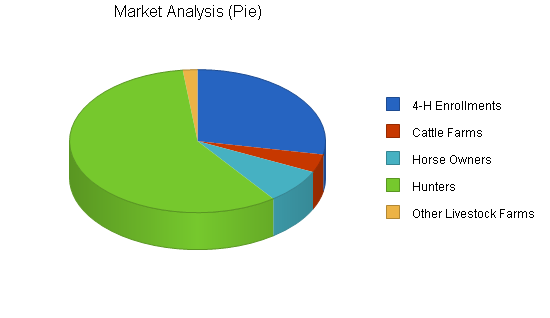
4.1 Market Segmentation
Latheethen Feeds, Inc. will focus on the following markets:
- 4-H Enrollments: Simply put, this segment of our market is our future. We are working with 4-H to further interest in animals, their nutritional needs, and means of cost containment. Through offering quality custom feeds we will provide success for today and many tomorrows as these youth become adult consumers (while annually, new youth will be targeted). This market will allow for sales of all our feed products as 4-H offers exposure to a variety of animals.
- Cattle Farms: The number of cattle farms within a 100 mile radius of Latheethen Feeds is quite phenomenal. There are many different purposes for these farms as well. Some raise cattle for auction and slaughter while some raise cattle for milk processing. All together, this is a market that is small, but would be very lucrative just by having a few of these commercial accounts purchase their feed from us on a weekly basis. The cattle market is very tough, but with our low prices and quality service, we should be able to obtain at least 10% of the overall market.
- Horse owners: We will provide custom feed while building customer relationships for long term growth and expansion into our goals of massage, boarding and other related services. Horse owners range from individual owners to ranches and even direct marketing to area race tracks will be undertaken.
- Hunters: These customers, of all ages and genders, have contributed a great deal of the Latheethen’s cash flow over the years. Expanding on simple hunter spontaneous purchases (jerky, nuts, dried fruit) will increase net revenue without an increase in labor, space or marketing costs. During the hunting season, “regulars” stop for beets, carrots, corn and apples on their way to their blind. Adding these impulse-purchase items will add to our bottom line.
- Livestock Farmers: This market is virtually up for grabs. Tax-exempt farmers look for the best in quality and price, both of which Latheethen’s offers to our customers. Farmers also look for availability of large quantities. Again, at Latheethen’s, we can handle any size order from less than a pound through orders containing thousands of pounds. Latheethen’s custom feed mill will again prove to be a big asset when dealing with the farmers.
| Market Analysis | |||||||
| 2004 | 2005 | 2006 | 2007 | 2008 | |||
| Potential Customers | Growth | CAGR | |||||
| 4-H Enrollments | 5% | 9,846 | 10,338 | 10,855 | 11,398 | 11,968 | 5.00% |
| Cattle Farms | 2% | 1,450 | 1,479 | 1,508 | 1,538 | 1,570 | 2.00% |
| Horse Owners | 5% | 2,750 | 2,887 | 3,032 | 3,183 | 3,343 | 5.00% |
| Hunters | 8% | 20,434 | 22,068 | 23,834 | 25,740 | 27,800 | 8.00% |
| Other Livestock Farms | 3% | 649 | 668 | 23,833 | 25,741 | 731 | 3.00% |
| Total | 6.63% | 35,129 | 37,440 | 63,062 | 67,600 | 45,411 | 6.63% |
4.2 Target Market Segment Strategy
Strategically targeting all the 4-H enrollments close to our business helps serve the needs and requirements of our local customers, and ties in logically with our marketing plan (see below) and our style of feed store. The youth of the 4-H are our future. These customers have regimented schedules, and find value in exceptional service, low prices and high quality feed. This first tier of our market segment is also the primary focus of our marketing plan, which has a deep commitment to focusing on the support of the 4-H kids and their community.
Our SECOND-TIER market group, Cattle Farms, will also find value in great service and quality feed, and will appreciate a supplier that keeps their products fresh and ready for immediate delivery. Finding the niche in all our targeted markets has been relatively easy… customers are looking for a feed supplier who maintains a complete line of fresh products and has the ability to deliver. Latheethen’s provides custom-made feed, much more economical than other name brand feeds, and as an added bonus we will deliver directly to their farms. This particular group is smaller in size, yet the number of cattle to feed on each farm is substantially larger than most other livestock farms. (The average size of each farm is 70 cattle.)
Our THIRD-TIER group, Horse Owners, will find that Latheethen’s special blend of oats and grains, all mixed in with our high quality minerals, results in premium feed at an affordable cost. All of these things are essential factors in a customer’s feed-buying decision. Our specialty horse feeds are made for both the average horse and for the equine racer, both of which are numerous in our area. We need to market the right avenues to gain industry share in this rapidly expanding market.
Our FOURTH-TIER, Hunters, is simply the largest in number of individual purchasers. Hunters are mostly seasonal customers, from the months of September through December we will see our numbers skyrocket when compared to the other eight months of the year. For projection purposes, we figured on having a low 30% of the total available market (69,232). This total potential market includes hunters from six of our surrounding counties (within a 50 mile radius). The actual number of hunters that stop by on their way to their cabins or blinds is substantially higher than forecasted.
Our FIFTH-TIER, Other Livestock Farms, represents a market that has an abundant number of feed users. Our custom feed mill allows us to manufacture any type of animal feed we desire, which help us acquire the available customers in this tier. From sheep and goat feed to rabbit and turkey feed, we make it all. Again, when we make our high quality feed, we make it with the highest quality products and sell it at wholesale prices. This market is basically up for grabs, as there are currently no competitors within a 125 mile radius that can supply these customers with such a high quality feed at the lowest costs possible.
We acquired our data for our market analysis from the Department of Natural Resources, the 4-H Council, and from USDA National Agricultural Statistics Service.
All of our projections are based on actual, real-life numbers (number of people/farms/etc.). We forecasted conservatively to show the actual amount of business we can easily obtain through a few advertisements and direct marketing.
4.3 Service Business Analysis
Currently, Latheethen Feeds, Inc. is involved in the manufacture and retail sale of custom feed and related products. Latheethen Feeds straddles two industries – manufacturers of feed, and retailers of feed and farm supplies. Latheethen’s 16 years of success in the custom feed industry is the strong foundation for the success and continued growth.
There are over 7,000 farm product raw materials businesses in the United States, according to the 2002 U.S. Census Economic report. According to the same source, farm supplies and raw materials wholesalers currently sell over $62,000,000 of goods per year. Of these, only 843 of these were selling poultry and livestock feeds mixed on location. With total sales of $8,141,368, businesses like ours sold an average of $9,658 in goods each, per year. This reflects the fact that most of the custom-feed mixers in the United States are very small operations; many of them are farmers who mix their own feed for their own livestock, and sell the extra to neighbors. Latheethen Feeds started out this way, but expanded its product line with snacks for people, and wild and exotic animal feed. By becoming a full-service custom-feed store, and developing a reputation for great service and high quality feed, we have far surpassed the industry average for revenue.
Our products are purchased from wholesale suppliers and re-sold to retail consumers. Our custom feed is a huge competitor with other retail products. The raw goods and time to manufacture cost at least 80% less than similar feeds. With more focus on the overall quality of our feeds, the cost savings to our customers will become more of a word of mouth advertising from end user to end user. Direct referrals are always the best source of committed customer and sustained reliable growth.
There really is no competitor within a 50 mile radius of Latheethen Feeds for custom feed for the wide variety of animals we provide for. Our tasks are to encourage our customers to make referrals, to implement direct marketing to groups such as the 4H and FFA, and to go out to the various ranches and livestock farms and introduce our company and our line of custom feeds.
At this point, we are a great-kept secret, when comparing our customer base to the existing market research potential.
4.3.1 Competition and Buying Patterns
Within the feed and farm supply industry, businesses compete on price, quality, customer service, and delivery. Customer service can include things like ability to produce a range of quantities, and custom-feed options. Customers must also trust the supplier for regular, reliable service and consistent quality, since sudden changes in feed can really disrupt their animals’ digestion and health.
Our existing customers have pretty routine buying patterns. The same customers come at the same time of the week or every other week. Their deliveries are scheduled for the same time, with the same volumes each time. When asking our customers why they use our products, they always have the same answer: “your custom feed is so good for my animal and it is priced just right.”
Most of our customers have been doing business with us for several years. Solid customer relationships, a friendly atmosphere and being available to provide quality products at a good price all add to a successful bottom line.
We strongly believe that by offering delivery services, we will gain a substantial number of new customers, both through the advantages of the new service, and with the new advertising (signs on our truck). We will gain the recognition of new customers through our focused marketing plan.
4.4 Sales Strategy
Latheethen Feeds, Inc. will be entering into direct sales for the first time. Starting in October and November, we will approach members of our target markets within 10 square miles both via phone and with direct visits. Where possible, we will ask existing customers to provide us with an introduction or to mention us to their neighbors and friends before we approach them. This will both lend credibility and pre-qualify potential customers as genuinely in need of our services, based on others’ knowledge of them.
We will tell them about our current products and services, and then ask them clearly what we need to do to earn their business. We will listen to their desires and individual goals. We will then mirror back to them what they have said, to be sure we understand their needs. Finally, we will create an individualized sales proposal with their specific needs (products, volumes, frequency, price, other services) included.
We will present the proposal as a written agreement ready for signature by both parties to begin doing business.
Details for each order will be entered into our customer database. We will then adjust our planned shipments of raw goods to include arrival of fresh product necessary for new orders, to be manufactured and delivered as agreed by the timeline. Deliveries will be automatically scheduled through our point of sale/delivery database. Each customer price grid, conditions and all specific comments will be clearly maintained for all to review and to guarantee complete customer satisfaction. Each order will be reviewed by one of the owners prior to delivery to guarantee quality, accuracy and completeness. Terms for payment will be COD and an invoice for each shipment will be faxed or called to each customer the day prior to delivery to ensure payment is ready at the time of delivery. (This will all be part of the agreement terms.)
Follow up calls will go to each customer within 24 hours of each delivery to ensure satisfaction. If for any reason there is an issue, it will be handled immediately by one of the owners directly with the customer.
Latheethen’s has previously been successful do to repeat customers. As the business switches hands we will also focus on keeping the existing customers happy and successfully introducing our new products and services. We will always focus on our repeat customers. The loyalty and respect we get from those customers will all play a big role in growing the business and taking it to the next level.
4.4.1 Sales Forecast
The sales forecast for Latheethen Feeds, Inc. includes all varieties of feed, as well as non-feed supplies and future forecasts for boarding stable revenue.
Adding the boarding stable will utilize vacant land and make it work for the company. The addition of the boarding stable will add to our company’s feed sales, and to the specialized services we offer. Boarding Stable costs include laundering of horse blankets, feed used by horses during their stay, and wear and tear on grooming instruments.
The annual growth rates fluctuate and are defined as:
- 2005 – 3.37%
- 2006 – 8.83%
- 2007 – 34.63%
- 2008 – 16.68%
- 2009 – 14.81%
The reasoning behind the initial dramatic increase in sales is due to accurate reporting and tracking, and growth of sales (generated through direct sales and advertising). For 2007, 2008 and 2009 we are forecasting significantly increases in our sales as we open the boarding stable. We anticipate that it will take three years to book out all of our stalls.
In 2009, we are forecasting a modest increase of 12.84%, based on the growth of feed sales and stable services alone. We are also planning on bringing back the rodeos and livestock shows that the previous owners have held in past years. This year could prove to be the year to bring back some of the good old days to the new Latheethen Feeds location.


| Sales Forecast | |||||
| FY 2005 | FY 2006 | FY 2007 | FY 2008 | FY 2009 | |
| Sales | |||||
| Equine Feed | $38,040 | $39,942 | $41,939 | $44,036 | $46,238 |
| Deer Feed | $12,000 | $12,960 | $13,997 | $15,117 | $16,326 |
| Livestock Feed | $93,346 | $102,680 | $112,948 | $124,243 | $136,668 |
| Misc. Products & Supplies | $6,000 | $7,000 | $8,000 | $9,000 | $10,000 |
| Boarding Stable | $0 | $0 | $42,000 | $63,000 | $84,000 |
| Total Sales | $149,386 | $162,582 | $218,884 | $255,396 | $293,232 |
| Direct Cost of Sales | FY 2005 | FY 2006 | FY 2007 | FY 2008 | FY 2009 |
| Corn, Oats, Molasses, Other Ingredients | $40,400 | $42,258 | $44,202 | $46,236 | $48,362 |
| Misc. Products & Supplies | $3,000 | $3,500 | $4,000 | $4,500 | $5,000 |
| Boarding Stable | $0 | $0 | $8,400 | $12,600 | $16,800 |
| Bags, Ties, Pallets, Labels | $1,440 | $1,506 | $1,575 | $1,648 | $1,724 |
| Subtotal Direct Cost of Sales | $44,840 | $47,264 | $58,177 | $64,984 | $71,886 |
Strategy and Implementation Summary
Emphasize customer service
We will differentiate ourselves with CUSTOMER SERVICE! We will establish our business as a clear and viable alternative for our target market, from the scores of competitors known for “do-it yourself,” “no we don’t offer that product,” and “no delivery available.”
Customer service is paramount in our business and our business plan. The management team will accomplish this goal by training employees and by providing encouragement.
The new management team of Latheethen Feeds, Inc. believes that an employee who is happy at work will enjoy working. It is always easier to please customers with staff that cares, a facility that is clean and equipment that is kept in proper working order.
Latheethen Feeds, Inc. will also work toward establishing community involvement programs that will demonstrate how the business can contribute to a better quality of community life. Community project groups such as the 4-H Council, the FFA, Schools, churches, and other groups will be welcomed for tours of the facilities and will be shown how the facility can be used to help raise funds for their needs.
Build a relationship-oriented business
Build long-term relationships with customers, not single-visit deals. Become their “feed dealer of choice.” Teach them the value of the relationship.
Focus on target markets
We need to focus our offerings on specific population groups as the key market segment we should own. We definitely want to be able to sell to smart, quality conscious customers.
5.1 Competitive Edge
Latheethen Feeds, Inc. has one of the most sought-after competitive edges in the industry. We have our own individual feed mill that can produce any animal feed requested. All we need is a few ingredients and some time to make our specialty custom feeds.
Our custom mill was built and wired with a 3-phase electrical system (industrial strength) and the best equipment on the market today. Other feed stores dream of having access to their own mill; this is where you make most of your money. Instead of having to be the middle man and purchase a large inventory of generic feeds, we custom-blend and produce our own feed to keep the costs down. When we can produce and market feed that costs us nearly 80% less than it costs to purchase a generic feed, we can keep our shelf prices lower than our competitors.
Let’s face it, lower prices + higher quality feed = money in the bank.
From the very first day Latheethen’s was open for business in 1989, the owners never advertised. They let the word get around (word-of-mouth advertising). This has obviously worked in their favor, as they are operating a profitable business, as is reflected in net profit increases annually.
In the future we, the new owners of Latheethen’s, will market our products to new customers in various strategic ways. This will aid in bringing in more customers…and will also aid in spreading the word that we are expanding our business. Most of the existing customers come from within a 30 mile radius of the store. Through delivery, we can offer our products and services to anyone willing to pay for it.
Our next competitive edge is that we will be running our delivery truck on a daily basis (once we implement delivery and obtain the necessary business). Most of our other competitors do not deliver or only deliver within a short distance from their location. Again, we will serve our customers with a higher quality feed, high level of professional service, and be willing to take it to their door.
Our strongest competitive edge is that we are family owned and operated and that our knowledge of the feed industry runs deep. With the resources available, the energy we can contribute at our young age, the raw talent for business and deep understanding of customer service, the potential to grow this already exciting business is tremendous.
5.2 Marketing Strategy
Latheethen Feeds, Inc. will implement the following Marketing Strategies upon the business transfer in the following order:
- Direct Marketing: we will personally market (sell face to face) our products to various feed stores, stables, boarding facilities, farms, clubs and race tracks.
- Customer Referral: we will provide customer incentives for direct referrals, in the form of price discounts.
- Website Marketing: we will implement our web plan and review the outcome to determine the efficiency it has on our customer base.
- Event Marketing: we will visit area livestock events (within 150 miles) to hand out flyers, business cards, and product catalogs, and to meet potential customers face to face.
Through marketing our products in these ways, we project that Latheethen’s will almost double its business within the first 2 years of new ownership.
5.3 Milestones
The following detailed milestone table shown identifies the primary tracking points for our initial company takeover, for our growth and our development process. We have included budgets for each subject and the name of which company came in with the lowest bid price.

| Milestones | |||||
| Milestone | Start Date | End Date | Budget | Manager | Department |
| Business Title Transfer | 10/4/2004 | 10/31/2004 | $0 | Chris | Department |
| Implement POS System | 11/1/2004 | 11/30/2004 | $6,000 | Dennis | Department |
| Print Product Catalogs | 11/1/2004 | 11/30/2004 | $250 | Dennis | Department |
| Buy Delivery Truck | 11/1/2004 | 12/1/2004 | $15,000 | Dennis | Department |
| Begin Delivery Service | 12/1/2004 | 12/5/2004 | $0 | Dennis | Department |
| Advertise in Newspapers | 11/1/2004 | 12/31/2004 | $1,000 | Dennis | Department |
| Affiliate with related website | 11/1/2004 | 12/31/2004 | $400 | Dennis | Department |
| Contact 200 potential customers | 11/15/2004 | 1/1/2005 | $0 | Dennis & Kay | Department |
| Build Web Site | 11/1/2004 | 1/15/2005 | $1,500 | Dennis | Department |
| Get 50 new contracts | 1/1/2005 | 3/1/2005 | $0 | Dennis & Kay | Department |
| Track hunter snack preferences | 11/1/2004 | 3/1/2005 | $0 | Dennis | Department |
| Average livestock feed sales of $7775/month | 11/1/2004 | 10/31/2005 | $0 | Dennis | Department |
| Renovate Boarding Stable | 3/1/2006 | 10/1/2006 | $100,000 | Dennis | Department |
| Landscaping, fencing, etc. | 10/1/2006 | 7/1/2007 | $25,000 | Dennis | Department |
| Totals | $149,150 | ||||
Web Plan Summary
Latheethen Feeds, Inc.’s website will enable us to offer customers current information on special sales, promos, new product releases, events, and public service announcements. We also plan on utilizing the Web to sell and market our products and services. An e-store will also be implemented into our web design, allowing customers to place orders for the feed they need right on our website. We will be able to accept and process check and credit card orders immediately online. Our customers will still have the options of paying by cash, check or money order as well.
6.1 Website Marketing Strategy
Our website will be promoted through the use of sponsor listings and affiliate memberships [confidential and proprietary information removed]. Our site will be registered with all of the major search engines. We will also share links with our distributors and manufacturers.
6.2 Development Requirements
Latheethen Feeds, Inc.’s website will be initially developed with few internal technical resources. IPowerWeb will host the site and provide the technical back end. MX-Productions will produce the graphics, logos, artwork, and flash media as they will be developing our website from scratch. Our site will be maintained by one of the owners.
Management Summary
Latheethen Feeds, Inc. is presently made up of three employees. The two current owners and one mill operator put in approximately 75 hours a week. As the new business ownership takes effect and various marketing plans are implemented, the product volume will increase. There is sufficient room in the production mill to expand and produce more feed daily. It is planned that the two new owners will oversee the production and day to day business practices.
We will also be contracting a new outside CPA to handle the corporate book keeping and business accounts (listed in the Profit and Loss table). We value and understand how important proper accounting and reporting of all sales activities are to the successful growth of a company. It is through development of this accuracy that true business growth will be verified and available for the continued security of this well-established family business.
7.1 Personnel Plan
Latheethen Feeds, Inc. is currently run and operated by one person in the mill and one person in the store. In time, as we implement our marketing plan, we will need to hire in an additional person to assist in the mill, and possibly another person to assist Kay in the store. We also could possibly need to hire a delivery person in the year 2005. When the business expands with new customers and larger feed orders, Dennis will need to be on site to assist Kay with inspecting the orders prior to delivery to ensure quality and accuracy of all orders. As growth evolves other family members may be of age to assist in the processes or employees may need to be placed.
As we expand we will hire independent contractors. We believe this way would best suite a company our size. Instead of spending the amount of money required by law to actually hire an employee, we feel we would all benefit more from setting up our personnel in this aspect.
| Personnel Plan | |||||
| FY 2005 | FY 2006 | FY 2007 | FY 2008 | FY 2009 | |
| Dennis | $12,000 | $18,000 | $20,000 | $25,000 | $25,000 |
| Kay | $12,000 | $15,000 | $15,000 | $15,000 | $15,000 |
| Extra Mill Operator | $7,000 | $12,000 | $18,000 | $18,000 | $24,000 |
| Extra Store Help | $0 | $0 | $10,000 | $15,000 | $18,000 |
| Total People | 3 | 3 | 4 | 4 | 4 |
| Total Payroll | $31,000 | $45,000 | $63,000 | $73,000 | $82,000 |
Financial Plan
The financial plan is to borrow $15,000 now as a short-term loan from Citizens Bank, at an interest rate of 7%, to buy a delivery truck suitable to our needs. We will repay this loan within two years from the cash flow of the business. This truck will allow us to expand our services to include delivery, giving us a further edge over the local competition and enabling us to further expand into our target market, while increasing recognition of our name and services.
The second phase of the plan is to borrow $135,000 in long-term loans from the bank in early 2006, to fund the renovation of the existing property’s barn and outbuilding into a structurally-sound, attractive, and livable horse boarding stable, and to install fencing and landscaping suitable to that purpose. This renovation will be completed within 7 months, although final landscaping and fencing is not expected to be finished until early 2007. We will repay this loan over 10 years. We will secure this loan with our equity in the value of the existing property. The boarding stable will open up a new revenue stream for the business, and attract new steady customers.
With aggressive target marketing and the sales strategies outlined above, we will increase sales over 3% in the first year. We expect a bigger increase in year two, with the extensive renovation generating some free publicity and with existing customers making referrals, but the largest expansion is planned for 2008, when we can first realize a full year’s revenue from the boarding stable.
From the very start, the new owners of Latheethen’s will start building the business and taking it to the highest level. The new owners have bright futures ahead of themselves, as does Latheethen Feeds, Inc. The once small, unknown feed store will be transformed into the area’s premier livestock feed store and equine boarding facility. The new Latheethen Feeds will be capable of hosting large scale rodeos and other livestock shows by the end of 2009.
8.1 Important Assumptions
This business plan was developed for Latheethen Feeds, Inc. assuming the following:
- Steady growth from good management, barring any unforseen local or national disasters such as the economic slowdown seen by most of the country following the September 11th, 2001 tragedies.
- An adequate loan amount to allow for initial implementation of plans.
- Competition and buying patterns remain similar to those used for forecasting.
- Existing customer base maintained.
- Market research is on target and current (received from different state organizations).
- New customers will be gained through direct sales and advertising.
- Long-term interest rate will be no more than 7%.
- Income tax rate is 30%.
- Sales tax rate is 6%.
| General Assumptions | |||||
| FY 2005 | FY 2006 | FY 2007 | FY 2008 | FY 2009 | |
| Plan Month | 1 | 2 | 3 | 4 | 5 |
| Current Interest Rate | 7.00% | 7.00% | 7.00% | 7.00% | 7.00% |
| Long-term Interest Rate | 7.00% | 7.00% | 7.00% | 7.00% | 7.00% |
| Tax Rate | 30.00% | 30.00% | 30.00% | 30.00% | 30.00% |
| Other | 0 | 0 | 0 | 0 | 0 |
8.2 Break-even Analysis
Break-even is based on fixed costs of approximately $5,900 including loan repayment, insurance, maintenance and labor. Additionally, controllables such as service labor, payroll taxes, property taxes, advertising and legal/professional fees are included.
The following chart shows that we need to produce approximately $8,500 from sales per month to break-even (according to the assumptions). That is less than what the previous owners have accomplished in previous years. We strongly believe we will succeed and provide handsome returns for our company and its owners.
Margins are harder to assume. Our FY 2005 gross margin is forecasted at 69.98%. In the following years our gross margin will continue to grow beyond our starting point because of the continued growth in total product sales and the release of our new equine boarding stable. The products manufactured in the mill cost about $3.50 for 50 pounds of feed on average. The lowest sale (market) price on those products is $5.50 with the highest coming in at $10.75. The majority of our gross profit on feed products is made directly as a result of having the luxury of our own custom mill.
Not only will we serve a much higher number of customers monthly than required by this break-even chart, we believe that we are going to possibly double the amount projected in our cash flow charts in this business plan, because we are going to be the only facility of its kind within a 150 mile radius. As advertising and direct sales follow suit from outside areas, our delivery service will prove to be valuable to our company and our customers.

| Break-even Analysis | |
| Monthly Revenue Break-even | $7,929 |
| Assumptions: | |
| Average Percent Variable Cost | 30% |
| Estimated Monthly Fixed Cost | $5,549 |
8.3 Projected Profit and Loss
Outlined below and in the following table and chart, are some of the intrinsic facets of the projected profit and loss for Latheethen Feeds, Inc.
Cost of sales reflects our cost to manufacture the feed and purchase all other non-manufactured products. Gross margin will continue to rise at a steady pace throughout the years forecasted.
Payroll expenses currently includes income for the two owners. As forecasted, additional employees will be brought aboard as required to keep up with the growing pace of Latheethen Feeds, Inc. Further details are available in our Personnel table (above).
Advertising and marketing expenses (news ads, magazine ads, etc.) are projected to increase as net profits increase and positive results are accomplished as a direct result of the same marketing and advertising. All direct sales and marketing is performed by Dennis. Commissions are not paid to him as a result of a gained customer as he is one of the two major owners of the corporation.
Depreciation forecasted includes normal wear and mechanical tune-ups on trucks, tractors and all equipment in the mill.
Fuel costs are projected to grow as the amount of sales made that require delivery increase. This projected expense includes fuel for the trucks, tractors, etc.
Utilities are projected to increase year to year. The current market prices for utilities will change as the years past. We have prepared for an annual $100 increase.
Insurance: Latheethen’s was quoted an insurance premium of $1,200/monthly, which includes liability, property, theft, fire, and personal insurance. The equipment (Mill machines, vehicles, and tractors) is also included in the monthly premium amount.
Payroll taxes include social security, unemployment and workers compensation, etc. Feed dealers permit and state sales tax license is projected to be paid in one annual installment in the month of January. Latheethen’s anticipates paying sales taxes monthly, and income tax quarterly, as required by law.
All website expenses are listed below, from initial development, to hosting, to account management for our e-commerce transactions.
Boarding Stable: The expensed portion of the barn renovations in year two is shown as an operating expense. The remainder ($125,000) is shown as purchase of new long-term assets in the Cash Flow table, representing the increased value of the property after renovation.


| Pro Forma Profit and Loss | |||||
| FY 2005 | FY 2006 | FY 2007 | FY 2008 | FY 2009 | |
| Sales | $149,386 | $162,582 | $218,884 | $255,396 | $293,232 |
| Direct Cost of Sales | $44,840 | $47,264 | $58,177 | $64,984 | $71,886 |
| Other Costs of Goods | $0 | $0 | $0 | $0 | $0 |
| Total Cost of Sales | $44,840 | $47,264 | $58,177 | $64,984 | $71,886 |
| Gross Margin | $104,546 | $115,318 | $160,707 | $190,412 | $221,346 |
| Gross Margin % | 69.98% | 70.93% | 73.42% | 74.56% | 75.48% |
| Expenses | |||||
| Payroll | $31,000 | $45,000 | $63,000 | $73,000 | $82,000 |
| Advertising & Marketing | $1,110 | $1,500 | $1,800 | $2,100 | $2,400 |
| Depreciation | $3,000 | $3,000 | $3,000 | $3,000 | $3,000 |
| Fuel | $7,185 | $7,490 | $7,822 | $9,000 | $9,600 |
| Maintenance of Delivery Truck | $3,000 | $3,500 | $3,500 | $3,500 | $3,600 |
| Utilities | $3,072 | $3,400 | $3,600 | $3,600 | $3,600 |
| Insurance | $14,400 | $14,400 | $15,400 | $15,400 | $15,400 |
| Payroll Taxes | $0 | $0 | $0 | $0 | $0 |
| Postage | $180 | $180 | $190 | $190 | $210 |
| Bank Charges | $240 | $240 | $240 | $240 | $240 |
| Stable Renovation Expenses | $0 | $10,000 | $0 | $0 | $0 |
| Accounting & Legal | $1,200 | $1,200 | $1,200 | $1,200 | $1,200 |
| Feed Dealers Permit | $15 | $15 | $15 | $15 | $15 |
| Website Development | $1,500 | $0 | $300 | $0 | $200 |
| Website hosting | $300 | $300 | $300 | $300 | $300 |
| Online Payment Account Mgmt | $360 | $360 | $380 | $380 | $400 |
| Sales Tax License | $25 | $25 | $25 | $25 | $25 |
| Total Operating Expenses | $66,587 | $90,610 | $100,772 | $111,950 | $122,190 |
| Profit Before Interest and Taxes | $37,959 | $24,708 | $59,935 | $78,462 | $99,156 |
| EBITDA | $40,959 | $27,708 | $62,935 | $81,462 | $102,156 |
| Interest Expense | $729 | $4,457 | $8,033 | $7,088 | $6,143 |
| Taxes Incurred | $11,169 | $6,076 | $15,571 | $21,412 | $27,904 |
| Net Profit | $26,061 | $14,176 | $36,332 | $49,962 | $65,109 |
| Net Profit/Sales | 17.45% | 8.72% | 16.60% | 19.56% | 22.20% |
8.4 Projected Cash Flow
The cash flow projection for Latheethen Feeds, Inc. shows that provisions for ongoing expenses are adequate to meet the needs of the company, as the business generates sufficient cash flow to support operations and future expansions.
Cash flow projections are critical to our success. The monthly cash flow is shown in the illustration, with one bar representing the cash flow per month and the other representing the monthly balance. The annual cash flow figures are included here and in our Cash Flow table. Detailed monthly numbers are included in the Appendix.
Cash Flow shows the purchase of long-term assets as follows:
- $15,000 for a delivery truck
- $125,000 for renovations of the barn to a horse boarding stable, which will improve the value of the property owned by the business
The table also shows the new loans required, and the projected repayment schedules.

| Pro Forma Cash Flow | |||||
| FY 2005 | FY 2006 | FY 2007 | FY 2008 | FY 2009 | |
| Cash Received | |||||
| Cash from Operations | |||||
| Cash Sales | $149,386 | $162,582 | $218,884 | $255,396 | $293,232 |
| Subtotal Cash from Operations | $149,386 | $162,582 | $218,884 | $255,396 | $293,232 |
| Additional Cash Received | |||||
| Sales Tax, VAT, HST/GST Received | $0 | $0 | $0 | $0 | $0 |
| New Current Borrowing | $15,000 | $0 | $0 | $0 | $0 |
| New Other Liabilities (interest-free) | $0 | $0 | $0 | $0 | $0 |
| New Long-term Liabilities | $0 | $135,000 | $0 | $0 | $0 |
| Sales of Other Current Assets | $0 | $0 | $0 | $0 | $0 |
| Sales of Long-term Assets | $0 | $0 | $0 | $0 | $0 |
| New Investment Received | $0 | $0 | $0 | $0 | $0 |
| Subtotal Cash Received | $164,386 | $297,582 | $218,884 | $255,396 | $293,232 |
| Expenditures | FY 2005 | FY 2006 | FY 2007 | FY 2008 | FY 2009 |
| Expenditures from Operations | |||||
| Cash Spending | $31,000 | $45,000 | $63,000 | $73,000 | $82,000 |
| Bill Payments | $75,770 | $103,070 | $116,585 | $129,680 | $143,333 |
| Subtotal Spent on Operations | $106,770 | $148,070 | $179,585 | $202,680 | $225,333 |
| Additional Cash Spent | |||||
| Sales Tax, VAT, HST/GST Paid Out | $0 | $0 | $0 | $0 | $0 |
| Principal Repayment of Current Borrowing | $9,167 | $5,833 | $0 | $0 | $0 |
| Other Liabilities Principal Repayment | $0 | $0 | $0 | $0 | $0 |
| Long-term Liabilities Principal Repayment | $0 | $13,500 | $13,500 | $13,500 | $13,500 |
| Purchase Other Current Assets | $0 | $0 | $0 | $0 | $0 |
| Purchase Long-term Assets | $15,000 | $125,000 | $0 | $0 | $0 |
| Dividends | $0 | $0 | $0 | $20,000 | $20,000 |
| Subtotal Cash Spent | $130,937 | $292,403 | $193,085 | $236,180 | $258,833 |
| Net Cash Flow | $33,449 | $5,179 | $25,799 | $19,216 | $34,399 |
| Cash Balance | $33,976 | $39,155 | $64,953 | $84,169 | $118,569 |
8.5 Projected Balance Sheet
The Balance Sheet shows healthy growth of net worth, and strong financial position. The monthly estimates are included in the Appendix. The balance sheet for Latheethen Feeds, Inc. is quite solid. We do not project any trouble meeting our debt obligations. Our management is strong enough and more than capable of keeping the business on track for total repayment of any obligations (loans).
Our major capital asset (the property and affixed buildings) is valued at about $170,000. Our current assets include all the mill equipment ($71,463) and the tractor ($4,000). These items will be purchased upon funding of the requested loan, for the amount of $100,000.
We (the new owners) will also be paying off some old personal debt that will allow us to lower our monthly personal expenses. This will enable us to work hard at growing the business and not have to worry about taking money out of the company for personal reasons. The payroll amounts forecasted will be more than sufficient to cover our personal income needs.
We will have a solid starting balance in the company account. This will allow us to start the business takeover with a security nest and will allow us to grow our cash balance at a more steady pace.
Our projected balance sheet is presented in the table below.
| Pro Forma Balance Sheet | |||||
| FY 2005 | FY 2006 | FY 2007 | FY 2008 | FY 2009 | |
| Assets | |||||
| Current Assets | |||||
| Cash | $33,976 | $39,155 | $64,953 | $84,169 | $118,569 |
| Inventory | $5,970 | $6,293 | $7,746 | $9,038 | $10,377 |
| Other Current Assets | $75,463 | $75,463 | $75,463 | $75,463 | $75,463 |
| Total Current Assets | $115,409 | $120,910 | $148,162 | $168,670 | $204,408 |
| Long-term Assets | |||||
| Long-term Assets | $185,000 | $310,000 | $310,000 | $310,000 | $310,000 |
| Accumulated Depreciation | $42,089 | $45,089 | $48,089 | $51,089 | $54,089 |
| Total Long-term Assets | $142,911 | $264,911 | $261,911 | $258,911 | $255,911 |
| Total Assets | $258,320 | $385,821 | $410,073 | $427,581 | $460,319 |
| Liabilities and Capital | FY 2005 | FY 2006 | FY 2007 | FY 2008 | FY 2009 |
| Current Liabilities | |||||
| Accounts Payable | $10,620 | $8,279 | $9,699 | $10,745 | $11,874 |
| Current Borrowing | $5,833 | $0 | $0 | $0 | $0 |
| Other Current Liabilities | $0 | $0 | $0 | $0 | $0 |
| Subtotal Current Liabilities | $16,453 | $8,279 | $9,699 | $10,745 | $11,874 |
| Long-term Liabilities | $0 | $121,500 | $108,000 | $94,500 | $81,000 |
| Total Liabilities | $16,453 | $129,779 | $117,699 | $105,245 | $92,874 |
| Paid-in Capital | $1,000 | $1,000 | $1,000 | $1,000 | $1,000 |
| Retained Earnings | $214,805 | $240,866 | $255,042 | $271,374 | $301,336 |
| Earnings | $26,061 | $14,176 | $36,332 | $49,962 | $65,109 |
| Total Capital | $241,866 | $256,042 | $292,374 | $322,336 | $367,446 |
| Total Liabilities and Capital | $258,320 | $385,821 | $410,073 | $427,581 | $460,319 |
| Net Worth | $241,866 | $256,042 | $292,374 | $322,336 | $367,446 |
8.6 Business Ratios
Latheethen Feeds, Inc.’s projected business ratios are provided in the table below. The final column, Industry Profile, shows significant ratios for the Feed Store Industry, as determined by the Standard Industry Classification (SIC) Index code 5999-0803.
| Ratio Analysis | ||||||
| FY 2005 | FY 2006 | FY 2007 | FY 2008 | FY 2009 | Industry Profile | |
| Sales Growth | 3.37% | 8.83% | 34.63% | 16.68% | 14.81% | 3.97% |
| Percent of Total Assets | ||||||
| Inventory | 2.31% | 1.63% | 1.89% | 2.11% | 2.25% | 38.92% |
| Other Current Assets | 29.21% | 19.56% | 18.40% | 17.65% | 16.39% | 24.26% |
| Total Current Assets | 44.68% | 31.34% | 36.13% | 39.45% | 44.41% | 79.54% |
| Long-term Assets | 55.32% | 68.66% | 63.87% | 60.55% | 55.59% | 20.46% |
| Total Assets | 100.00% | 100.00% | 100.00% | 100.00% | 100.00% | 100.00% |
| Current Liabilities | 6.37% | 2.15% | 2.37% | 2.51% | 2.58% | 43.26% |
| Long-term Liabilities | 0.00% | 31.49% | 26.34% | 22.10% | 17.60% | 14.36% |
| Total Liabilities | 6.37% | 33.64% | 28.70% | 24.61% | 20.18% | 57.62% |
| Net Worth | 93.63% | 66.36% | 71.30% | 75.39% | 79.82% | 42.38% |
| Percent of Sales | ||||||
| Sales | 100.00% | 100.00% | 100.00% | 100.00% | 100.00% | 100.00% |
| Gross Margin | 69.98% | 70.93% | 73.42% | 74.56% | 75.48% | 33.23% |
| Selling, General & Administrative Expenses | 0.00% | 0.00% | 0.00% | 0.00% | 0.00% | 20.52% |
| Advertising Expenses | 0.00% | 0.00% | 0.00% | 0.00% | 0.00% | 2.10% |
| Profit Before Interest and Taxes | 25.41% | 15.20% | 27.38% | 30.72% | 33.81% | 1.04% |
| Main Ratios | ||||||
| Current | 7.01 | 14.60 | 15.28 | 15.70 | 17.22 | 1.67 |
| Quick | 6.65 | 13.84 | 14.48 | 14.86 | 16.34 | 0.65 |
| Total Debt to Total Assets | 6.37% | 33.64% | 28.70% | 24.61% | 20.18% | 2.45% |
| Pre-tax Return on Net Worth | 15.39% | 7.91% | 17.75% | 22.14% | 25.31% | 62.21% |
| Pre-tax Return on Assets | 14.41% | 5.25% | 12.66% | 16.69% | 20.21% | 6.49% |
| Additional Ratios | FY 2005 | FY 2006 | FY 2007 | FY 2008 | FY 2009 | |
| Net Profit Margin | 17.45% | 8.72% | 16.60% | 19.56% | 22.20% | n.a |
| Return on Equity | 10.78% | 5.54% | 12.43% | 15.50% | 17.72% | n.a |
| Activity Ratios | ||||||
| Inventory Turnover | 11.97 | 7.71 | 8.29 | 7.74 | 7.41 | n.a |
| Accounts Payable Turnover | 8.13 | 12.17 | 12.17 | 12.17 | 12.17 | n.a |
| Payment Days | 27 | 34 | 28 | 29 | 29 | n.a |
| Total Asset Turnover | 0.58 | 0.42 | 0.53 | 0.60 | 0.64 | n.a |
| Debt Ratios | ||||||
| Debt to Net Worth | 0.07 | 0.51 | 0.40 | 0.33 | 0.25 | n.a |
| Current Liab. to Liab. | 1.00 | 0.06 | 0.08 | 0.10 | 0.13 | n.a |
| Liquidity Ratios | ||||||
| Net Working Capital | $98,955 | $112,631 | $138,463 | $157,925 | $192,535 | n.a |
| Interest Coverage | 52.05 | 5.54 | 7.46 | 11.07 | 16.14 | n.a |
| Additional Ratios | ||||||
| Assets to Sales | 1.73 | 2.37 | 1.87 | 1.67 | 1.57 | n.a |
| Current Debt/Total Assets | 6% | 2% | 2% | 3% | 3% | n.a |
| Acid Test | 6.65 | 13.84 | 14.48 | 14.86 | 16.34 | n.a |
| Sales/Net Worth | 0.62 | 0.63 | 0.75 | 0.79 | 0.80 | n.a |
| Dividend Payout | 0.00 | 0.00 | 0.00 | 0.40 | 0.31 | n.a |
8.7 Long-term Plan
Latheethen Feeds, Inc. is expected to grow at a steady pace. In conversations with other feed owners, this topic is already a common theme. Many feed stores are beginning to experience record breaking growth rates. This is an exciting time to purchase an already established and successful store in this market. As we expand our customer base, offer more products and bring the dreamed of equine boarding stable to life, we will be positioning Latheethen Feeds, Inc. amongst the elite dealers in the state of Michigan.
We will continuously review our business plan as we implement changes. By doing so we will ensure accuracy and stability. Our goal is to take over this great business, protect it, nurture it, and provide for it. Doing these things will enable us to grow and expand the business in a professional atmosphere.
| Long-term | ||||||||||
| FY 2005 | FY 2006 | FY 2007 | FY 2008 | FY 2009 | FY 2010 | FY 2011 | FY 2012 | FY 2013 | FY 2014 | |
| Sales | $149,386 | $162,582 | $218,884 | $255,396 | $293,232 | $0 | $0 | $0 | $0 | $0 |
| Cost of Sales | $44,840 | $47,264 | $58,177 | $64,984 | $71,886 | $0 | $0 | $0 | $0 | $0 |
| Gross Margin | $104,546 | $115,318 | $160,707 | $190,412 | $221,346 | $0 | $0 | $0 | $0 | $0 |
| Gross Margin % | 69.98% | 70.93% | 73.42% | 74.56% | 75.48% | 0.00% | 0.00% | 0.00% | 0.00% | 0.00% |
| Operating Expenses | $66,587 | $90,610 | $100,772 | $111,950 | $122,190 | $0 | $0 | $0 | $0 | $0 |
| Operating Income | $37,959 | $24,708 | $59,935 | $78,462 | $99,156 | $0 | $0 | $0 | $0 | $0 |
| Net Income | $26,061 | $14,176 | $36,332 | $49,962 | $65,109 | $0 | $0 | $0 | $0 | $0 |
| Current Assets | $115,409 | $120,910 | $148,162 | $168,670 | $204,408 | $0 | $0 | $0 | $0 | $0 |
| Long-term Assets | $142,911 | $264,911 | $261,911 | $258,911 | $255,911 | $0 | $0 | $0 | $0 | $0 |
| Current Liabilities | $16,453 | $8,279 | $9,699 | $10,745 | $11,874 | $0 | $0 | $0 | $0 | $0 |
| Long-term Liabilities | $0 | $121,500 | $108,000 | $94,500 | $81,000 | $0 | $0 | $0 | $0 | $0 |
| Equity | $241,866 | $256,042 | $292,374 | $322,336 | $367,446 | $0 | $0 | $0 | $0 | $0 |
Appendix
| Sales Forecast | |||||||||||||
| Nov | Dec | Jan | Feb | Mar | Apr | May | Jun | Jul | Aug | Sep | Oct | ||
| Sales | |||||||||||||
| Equine Feed | $3,170 | $3,170 | $3,170 | $3,170 | $3,170 | $3,170 | $3,170 | $3,170 | $3,170 | $3,170 | $3,170 | $3,170 | |
| Deer Feed | $2,800 | $2,800 | $100 | $100 | $100 | $100 | $100 | $100 | $100 | $100 | $2,800 | $2,800 | |
| Livestock Feed | $7,200 | $8,900 | $6,400 | $6,300 | $6,600 | $7,200 | $8,654 | $8,200 | $7,900 | $8,600 | $9,300 | $8,092 | |
| Misc. Products & Supplies | $500 | $500 | $500 | $500 | $500 | $500 | $500 | $500 | $500 | $500 | $500 | $500 | |
| Boarding Stable | $0 | $0 | $0 | $0 | $0 | $0 | $0 | $0 | $0 | $0 | $0 | $0 | |
| Total Sales | $13,670 | $15,370 | $10,170 | $10,070 | $10,370 | $10,970 | $12,424 | $11,970 | $11,670 | $12,370 | $15,770 | $14,562 | |
| Direct Cost of Sales | Nov | Dec | Jan | Feb | Mar | Apr | May | Jun | Jul | Aug | Sep | Oct | |
| Corn, Oats, Molasses, Other Ingredients | $5,600 | $2,800 | $2,800 | $2,800 | $2,800 | $2,800 | $2,800 | $2,800 | $2,800 | $2,800 | $4,000 | $5,600 | |
| Misc. Products & Supplies | $250 | $250 | $250 | $250 | $250 | $250 | $250 | $250 | $250 | $250 | $250 | $250 | |
| Boarding Stable | $0 | $0 | $0 | $0 | $0 | $0 | $0 | $0 | $0 | $0 | $0 | $0 | |
| Bags, Ties, Pallets, Labels | $120 | $120 | $120 | $120 | $120 | $120 | $120 | $120 | $120 | $120 | $120 | $120 | |
| Subtotal Direct Cost of Sales | $5,970 | $3,170 | $3,170 | $3,170 | $3,170 | $3,170 | $3,170 | $3,170 | $3,170 | $3,170 | $4,370 | $5,970 | |
| Personnel Plan | |||||||||||||
| Nov | Dec | Jan | Feb | Mar | Apr | May | Jun | Jul | Aug | Sep | Oct | ||
| Dennis | 0% | $1,000 | $1,000 | $1,000 | $1,000 | $1,000 | $1,000 | $1,000 | $1,000 | $1,000 | $1,000 | $1,000 | $1,000 |
| Kay | 0% | $1,000 | $1,000 | $1,000 | $1,000 | $1,000 | $1,000 | $1,000 | $1,000 | $1,000 | $1,000 | $1,000 | $1,000 |
| Extra Mill Operator | 0% | $0 | $0 | $0 | $0 | $0 | $1,000 | $1,000 | $1,000 | $1,000 | $1,000 | $1,000 | $1,000 |
| Extra Store Help | 0% | $0 | $0 | $0 | $0 | $0 | $0 | $0 | $0 | $0 | $0 | $0 | $0 |
| Total People | 3 | 3 | 3 | 3 | 3 | 3 | 3 | 3 | 3 | 3 | 3 | 3 | |
| Total Payroll | $2,000 | $2,000 | $2,000 | $2,000 | $2,000 | $3,000 | $3,000 | $3,000 | $3,000 | $3,000 | $3,000 | $3,000 | |
| General Assumptions | |||||||||||||
| Nov | Dec | Jan | Feb | Mar | Apr | May | Jun | Jul | Aug | Sep | Oct | ||
| Plan Month | 1 | 2 | 3 | 4 | 5 | 6 | 7 | 8 | 9 | 10 | 11 | 12 | |
| Current Interest Rate | 7.00% | 7.00% | 7.00% | 7.00% | 7.00% | 7.00% | 7.00% | 7.00% | 7.00% | 7.00% | 7.00% | 7.00% | |
| Long-term Interest Rate | 7.00% | 7.00% | 7.00% | 7.00% | 7.00% | 7.00% | 7.00% | 7.00% | 7.00% | 7.00% | 7.00% | 7.00% | |
| Tax Rate | 30.00% | 30.00% | 30.00% | 30.00% | 30.00% | 30.00% | 30.00% | 30.00% | 30.00% | 30.00% | 30.00% | 30.00% | |
| Other | 0 | 0 | 0 | 0 | 0 | 0 | 0 | 0 | 0 | 0 | 0 | 0 | |
| Pro Forma Profit and Loss | |||||||||||||
| Nov | Dec | Jan | Feb | Mar | Apr | May | Jun | Jul | Aug | Sep | Oct | ||
| Sales | $13,670 | $15,370 | $10,170 | $10,070 | $10,370 | $10,970 | $12,424 | $11,970 | $11,670 | $12,370 | $15,770 | $14,562 | |
| Direct Cost of Sales | $5,970 | $3,170 | $3,170 | $3,170 | $3,170 | $3,170 | $3,170 | $3,170 | $3,170 | $3,170 | $4,370 | $5,970 | |
| Other Costs of Goods | $0 | $0 | $0 | $0 | $0 | $0 | $0 | $0 | $0 | $0 | $0 | $0 | |
| Total Cost of Sales | $5,970 | $3,170 | $3,170 | $3,170 | $3,170 | $3,170 | $3,170 | $3,170 | $3,170 | $3,170 | $4,370 | $5,970 | |
| Gross Margin | $7,700 | $12,200 | $7,000 | $6,900 | $7,200 | $7,800 | $9,254 | $8,800 | $8,500 | $9,200 | $11,400 | $8,592 | |
| Gross Margin % | 56.33% | 79.38% | 68.83% | 68.52% | 69.43% | 71.10% | 74.48% | 73.52% | 72.84% | 74.37% | 72.29% | 59.00% | |
| Expenses | |||||||||||||
| Payroll | $2,000 | $2,000 | $2,000 | $2,000 | $2,000 | $3,000 | $3,000 | $3,000 | $3,000 | $3,000 | $3,000 | $3,000 | |
| Advertising & Marketing | $100 | $100 | $100 | $100 | $100 | $100 | $100 | $100 | $100 | $100 | $100 | $10 | |
| Depreciation | $250 | $250 | $250 | $250 | $250 | $250 | $250 | $250 | $250 | $250 | $250 | $250 | |
| Fuel | $629 | $672 | $542 | $539 | $547 | $562 | $598 | $587 | $579 | $597 | $682 | $652 | |
| Maintenance of Delivery Truck | $250 | $250 | $250 | $250 | $250 | $250 | $250 | $250 | $250 | $250 | $250 | $250 | |
| Utilities | $256 | $256 | $256 | $256 | $256 | $256 | $256 | $256 | $256 | $256 | $256 | $256 | |
| Insurance | $1,200 | $1,200 | $1,200 | $1,200 | $1,200 | $1,200 | $1,200 | $1,200 | $1,200 | $1,200 | $1,200 | $1,200 | |
| Payroll Taxes | 15% | $0 | $0 | $0 | $0 | $0 | $0 | $0 | $0 | $0 | $0 | $0 | $0 |
| Postage | $15 | $15 | $15 | $15 | $15 | $15 | $15 | $15 | $15 | $15 | $15 | $15 | |
| Bank Charges | $20 | $20 | $20 | $20 | $20 | $20 | $20 | $20 | $20 | $20 | $20 | $20 | |
| Stable Renovation Expenses | $0 | $0 | $0 | $0 | $0 | $0 | $0 | $0 | $0 | $0 | $0 | $0 | |
| Accounting & Legal | $100 | $100 | $100 | $100 | $100 | $100 | $100 | $100 | $100 | $100 | $100 | $100 | |
| Feed Dealers Permit | $0 | $0 | $15 | $0 | $0 | $0 | $0 | $0 | $0 | $0 | $0 | $0 | |
| Website Development | $500 | $500 | $500 | $0 | $0 | $0 | $0 | $0 | $0 | $0 | $0 | $0 | |
| Website hosting | $25 | $25 | $25 | $25 | $25 | $25 | $25 | $25 | $25 | $25 | $25 | $25 | |
| Online Payment Account Mgmt | 15% | $30 | $30 | $30 | $30 | $30 | $30 | $30 | $30 | $30 | $30 | $30 | $30 |
| Sales Tax License | $0 | $0 | $25 | $0 | $0 | $0 | $0 | $0 | $0 | $0 | $0 | $0 | |
| Total Operating Expenses | $5,375 | $5,418 | $5,328 | $4,785 | $4,793 | $5,808 | $5,844 | $5,833 | $5,825 | $5,843 | $5,928 | $5,808 | |
| Profit Before Interest and Taxes | $2,325 | $6,782 | $1,672 | $2,115 | $2,407 | $1,992 | $3,410 | $2,967 | $2,675 | $3,357 | $5,472 | $2,784 | |
| EBITDA | $2,575 | $7,032 | $1,922 | $2,365 | $2,657 | $2,242 | $3,660 | $3,217 | $2,925 | $3,607 | $5,722 | $3,034 | |
| Interest Expense | $88 | $83 | $78 | $73 | $68 | $63 | $58 | $53 | $49 | $44 | $39 | $34 | |
| Taxes Incurred | $671 | $2,010 | $478 | $613 | $702 | $579 | $1,005 | $874 | $788 | $994 | $1,630 | $825 | |
| Net Profit | $1,566 | $4,690 | $1,116 | $1,429 | $1,637 | $1,350 | $2,346 | $2,040 | $1,838 | $2,319 | $3,803 | $1,925 | |
| Net Profit/Sales | 11.46% | 30.51% | 10.97% | 14.19% | 15.79% | 12.31% | 18.88% | 17.04% | 15.75% | 18.75% | 24.12% | 13.22% | |
| Pro Forma Cash Flow | |||||||||||||
| Nov | Dec | Jan | Feb | Mar | Apr | May | Jun | Jul | Aug | Sep | Oct | ||
| Cash Received | |||||||||||||
| Cash from Operations | |||||||||||||
| Cash Sales | $13,670 | $15,370 | $10,170 | $10,070 | $10,370 | $10,970 | $12,424 | $11,970 | $11,670 | $12,370 | $15,770 | $14,562 | |
| Subtotal Cash from Operations | $13,670 | $15,370 | $10,170 | $10,070 | $10,370 | $10,970 | $12,424 | $11,970 | $11,670 | $12,370 | $15,770 | $14,562 | |
| Additional Cash Received | |||||||||||||
| Sales Tax, VAT, HST/GST Received | 0.00% | $0 | $0 | $0 | $0 | $0 | $0 | $0 | $0 | $0 | $0 | $0 | $0 |
| New Current Borrowing | $15,000 | $0 | $0 | $0 | $0 | $0 | $0 | $0 | $0 | $0 | $0 | $0 | |
| New Other Liabilities (interest-free) | $0 | $0 | $0 | $0 | $0 | $0 | $0 | $0 | $0 | $0 | $0 | $0 | |
| New Long-term Liabilities | $0 | $0 | $0 | $0 | $0 | $0 | $0 | $0 | $0 | $0 | $0 | $0 | |
| Sales of Other Current Assets | $0 | $0 | $0 | $0 | $0 | $0 | $0 | $0 | $0 | $0 | $0 | $0 | |
| Sales of Long-term Assets | $0 | $0 | $0 | $0 | $0 | $0 | $0 | $0 | $0 | $0 | $0 | $0 | |
| New Investment Received | $0 | $0 | $0 | $0 | $0 | $0 | $0 | $0 | $0 | $0 | $0 | $0 | |
| Subtotal Cash Received | $28,670 | $15,370 | $10,170 | $10,070 | $10,370 | $10,970 | $12,424 | $11,970 | $11,670 | $12,370 | $15,770 | $14,562 | |
| Expenditures | Nov | Dec | Jan | Feb | Mar | Apr | May | Jun | Jul | Aug | Sep | Oct | |
| Expenditures from Operations | |||||||||||||
| Cash Spending | $2,000 | $2,000 | $2,000 | $2,000 | $2,000 | $3,000 | $3,000 | $3,000 | $3,000 | $3,000 | $3,000 | $3,000 | |
| Bill Payments | $231 | $6,881 | $5,791 | $6,664 | $6,394 | $6,479 | $6,385 | $6,823 | $6,677 | $6,589 | $6,904 | $9,952 | |
| Subtotal Spent on Operations | $2,231 | $8,881 | $7,791 | $8,664 | $8,394 | $9,479 | $9,385 | $9,823 | $9,677 | $9,589 | $9,904 | $12,952 | |
| Additional Cash Spent | |||||||||||||
| Sales Tax, VAT, HST/GST Paid Out | $0 | $0 | $0 | $0 | $0 | $0 | $0 | $0 | $0 | $0 | $0 | $0 | |
| Principal Repayment of Current Borrowing | $0 | $833 | $833 | $833 | $833 | $833 | $833 | $833 | $834 | $834 | $834 | $834 | |
| Other Liabilities Principal Repayment | $0 | $0 | $0 | $0 | $0 | $0 | $0 | $0 | $0 | $0 | $0 | $0 | |
| Long-term Liabilities Principal Repayment | $0 | $0 | $0 | $0 | $0 | $0 | $0 | $0 | $0 | $0 | $0 | $0 | |
| Purchase Other Current Assets | $0 | $0 | $0 | $0 | $0 | $0 | $0 | $0 | $0 | $0 | $0 | $0 | |
| Purchase Long-term Assets | $15,000 | $0 | $0 | $0 | $0 | $0 | $0 | $0 | $0 | $0 | $0 | $0 | |
| Dividends | $0 | $0 | $0 | $0 | $0 | $0 | $0 | $0 | $0 | $0 | $0 | $0 | |
| Subtotal Cash Spent | $17,231 | $9,714 | $8,624 | $9,497 | $9,227 | $10,312 | $10,218 | $10,656 | $10,511 | $10,423 | $10,738 | $13,786 | |
| Net Cash Flow | $11,439 | $5,656 | $1,546 | $573 | $1,143 | $658 | $2,206 | $1,314 | $1,159 | $1,947 | $5,032 | $776 | |
| Cash Balance | $11,966 | $17,622 | $19,168 | $19,741 | $20,884 | $21,542 | $23,748 | $25,062 | $26,221 | $28,168 | $33,200 | $33,976 | |
| Pro Forma Balance Sheet | |||||||||||||
| Nov | Dec | Jan | Feb | Mar | Apr | May | Jun | Jul | Aug | Sep | Oct | ||
| Assets | Starting Balances | ||||||||||||
| Current Assets | |||||||||||||
| Cash | $527 | $11,966 | $17,622 | $19,168 | $19,741 | $20,884 | $21,542 | $23,748 | $25,062 | $26,221 | $28,168 | $33,200 | $33,976 |
| Inventory | $8,904 | $5,970 | $3,300 | $3,170 | $3,170 | $3,170 | $3,170 | $3,170 | $3,170 | $3,170 | $3,170 | $4,370 | $5,970 |
| Other Current Assets | $75,463 | $75,463 | $75,463 | $75,463 | $75,463 | $75,463 | $75,463 | $75,463 | $75,463 | $75,463 | $75,463 | $75,463 | $75,463 |
| Total Current Assets | $84,894 | $93,399 | $96,385 | $97,801 | $98,374 | $99,517 | $100,175 | $102,381 | $103,695 | $104,854 | $106,801 | $113,033 | $115,409 |
| Long-term Assets | |||||||||||||
| Long-term Assets | $170,000 | $185,000 | $185,000 | $185,000 | $185,000 | $185,000 | $185,000 | $185,000 | $185,000 | $185,000 | $185,000 | $185,000 | $185,000 |
| Accumulated Depreciation | $39,089 | $39,339 | $39,589 | $39,839 | $40,089 | $40,339 | $40,589 | $40,839 | $41,089 | $41,339 | $41,589 | $41,839 | $42,089 |
| Total Long-term Assets | $130,911 | $145,661 | $145,411 | $145,161 | $144,911 | $144,661 | $144,411 | $144,161 | $143,911 | $143,661 | $143,411 | $143,161 | $142,911 |
| Total Assets | $215,805 | $239,060 | $241,796 | $242,962 | $243,285 | $244,178 | $244,586 | $246,542 | $247,606 | $248,515 | $250,212 | $256,194 | $258,320 |
| Liabilities and Capital | Nov | Dec | Jan | Feb | Mar | Apr | May | Jun | Jul | Aug | Sep | Oct | |
| Current Liabilities | |||||||||||||
| Accounts Payable | $0 | $6,689 | $5,568 | $6,451 | $6,178 | $6,266 | $6,157 | $6,600 | $6,458 | $6,362 | $6,574 | $9,586 | $10,620 |
| Current Borrowing | $0 | $15,000 | $14,167 | $13,334 | $12,501 | $11,668 | $10,835 | $10,002 | $9,169 | $8,335 | $7,501 | $6,667 | $5,833 |
| Other Current Liabilities | $0 | $0 | $0 | $0 | $0 | $0 | $0 | $0 | $0 | $0 | $0 | $0 | $0 |
| Subtotal Current Liabilities | $0 | $21,689 | $19,735 | $19,785 | $18,679 | $17,934 | $16,992 | $16,602 | $15,627 | $14,697 | $14,075 | $16,253 | $16,453 |
| Long-term Liabilities | $0 | $0 | $0 | $0 | $0 | $0 | $0 | $0 | $0 | $0 | $0 | $0 | $0 |
| Total Liabilities | $0 | $21,689 | $19,735 | $19,785 | $18,679 | $17,934 | $16,992 | $16,602 | $15,627 | $14,697 | $14,075 | $16,253 | $16,453 |
| Paid-in Capital | $1,000 | $1,000 | $1,000 | $1,000 | $1,000 | $1,000 | $1,000 | $1,000 | $1,000 | $1,000 | $1,000 | $1,000 | $1,000 |
| Retained Earnings | $205,465 | $214,805 | $214,805 | $214,805 | $214,805 | $214,805 | $214,805 | $214,805 | $214,805 | $214,805 | $214,805 | $214,805 | $214,805 |
| Earnings | $9,340 | $1,566 | $6,256 | $7,372 | $8,801 | $10,439 | $11,789 | $14,135 | $16,175 | $18,013 | $20,332 | $24,136 | $26,061 |
| Total Capital | $215,805 | $217,371 | $222,061 | $223,177 | $224,606 | $226,244 | $227,594 | $229,940 | $231,980 | $233,818 | $236,137 | $239,941 | $241,866 |
| Total Liabilities and Capital | $215,805 | $239,060 | $241,796 | $242,962 | $243,285 | $244,178 | $244,586 | $246,542 | $247,606 | $248,515 | $250,212 | $256,194 | $258,320 |
| Net Worth | $215,805 | $217,371 | $222,061 | $223,177 | $224,606 | $226,244 | $227,594 | $229,940 | $231,980 | $233,818 | $236,137 | $239,941 | $241,866 |
| Inventory Detail | |||||||||||||
| Nov | Dec | Jan | Feb | Mar | Apr | May | Jun | Jul | Aug | Sep | Oct | ||
| Months of Inventory On-hand | 1.00 | 1.00 | 1.00 | 1.00 | 1.00 | 1.00 | 1.00 | 1.00 | 1.00 | 1.00 | 1.00 | 1.00 | |
| Minimum Inventory Purchase | $500 | ||||||||||||
| Inventory Balance | |||||||||||||
| Beginning Inventory Balance | $8,904 | $5,970 | $3,300 | $3,170 | $3,170 | $3,170 | $3,170 | $3,170 | $3,170 | $3,170 | $3,170 | $4,370 | |
| Less Inventory Used as COGS | $5,970 | $3,170 | $3,170 | $3,170 | $3,170 | $3,170 | $3,170 | $3,170 | $3,170 | $3,170 | $4,370 | $5,970 | |
| Plus Inventory Purchase | $3,036 | $500 | $3,040 | $3,170 | $3,170 | $3,170 | $3,170 | $3,170 | $3,170 | $3,170 | $5,570 | $7,570 | |
| Ending Inventory Balance | $5,970 | $3,300 | $3,170 | $3,170 | $3,170 | $3,170 | $3,170 | $3,170 | $3,170 | $3,170 | $4,370 | $5,970 | |

