
Kouros Brothers Ltd.
Executive Summary
Kouros Brothers Ltd. is an agriculture machinery and implements manufacturer importer and authorized reseller that sells A-Z series of heavy machinery and systems for Potatoes, Vegetables, Cereals, Stubble, and beach cleaning turn key projects and machinery. We have also patented and piloted four innovative machinery and systems the last 6 years for Vegetable and Cereal productions. Is also the sole and exclusive agent and dealer of 10 main agriculture manufacturers in Europe. It has managed to create communication links and to export its series of machinery in Middle East and Syria the last 3 years.
Kouros Brothers Ltd. has an experienced management team with direct knowledge of the industry, extensive research experience, and unique administrative skills. Its team includes Mr. Kouros and Mr Panikos Stella live in Larnaca, Cyprus. Both Owners have compiled an extensive list of customers/potential customers, vendors, and contacts for equipment consignment.
New Opportunity
Last week it was announced by the Ministry of Agriculture, Natural Resources and Environment that EU has available 256 million Euro for funding from 65%-80% of all units or producers intending to modernize and use technological advances in order to improve customers’ (Agriculture Producers’) product quality and to be able to export goods into European markets at competitive prices.
We have a good reputation locally, but sales are slow because local farmers cannot buy new equipment every year. With Cyprus’ admission to the EU, this large amount of funding will let farmers buy more and newer equipment. However, the local farmers will only buy equipment they know to be effective; the best way to convince them, in our experience, is to bring a sample of equipment to their fields to demonstrate.
Kouros Brothers Ltd. has good earnings and assets, but we do not have enough cash on hand to buy the wide range of demonstration equipment we need to meet the sales potential created by the upcoming Government funds to our customers. The company intents to employ local individuals and to provide extensive training about its products and services in order to promote its sales. Loyal customers help to expand the company’s business area by word-of-mouth.
We have already identified a list of potential customers and communities that are willing and able to try its new product series. Even more so, the pilot equipments will be used for the upcoming October International fair for Agriculture and Livestock that will take place, at Nicosia, Cyprus. And also, the company plans to participate in the Thesalloniki state Agricultural fair that will take place on the 28th January next. As a sole agent and sales representative for Cyprus, Greece and Syria for some series of Wheat planting systems, the company needs to promote its series of products to all available marketing opportunities.
The company is seeking funding of the amount of £50,000 for the purpose of expanding the business. Expansion plans include the purchase of additional equipments allowing the company to promote and to demonstrate its products and services, and also by hiring additional personnel. This loan will be paid back in 6 years, with principal payments of £5,833/year, at 8.5% interest. This is on top of the existing 10,000 loan, which will be paid back on the same time frame, at roughly £1,666/year.
With this new demonstration equipment, and well-funded customers, our projected revenues for Year 1 are expected to reach £274,200, and up to £400,000 by Year 5.
1.1 Objectives
The Kouros Brothers Ltd. directors believe that, there is a current untapped market opportunity for agriculture machinery because, existing providers of agriculture machinery and implements are too diversified to serve the increasingly specialized needs of the potato segment, by ignoring the crop needs for mechanization of Vegetables, Cereal, wheat and livestock sectors.
The company’s coverage area is constantly increasing, as customers are becoming aware of the company’s presence. European community offers a real business opportunity for such expansion, because now, there are 256 million Euro available for agriculture funding and support by EU agriculture committee, left to the Cyprus Government, to fund the Local Farmers and Agriculture producers for upgrading their production effectiveness and efficiency.
1.2 Mission
Kouros Brothers Ltd. mission is to become THE exclusive full-service equipment manufacturer and authorized importer, sales, and service company in agriculture machinery and implements in Cyprus and to expand its business to Middle East, with the ability to satisfy all needs of Livestock farmers and Agriculture producers.
Therefore, the company’s strategy is to create a limited geographical niche for itself, where there will be no potential competitors. Kouros Brothers Ltd. aims to offer high-quality agriculture equipments and machinery for crop mechanization of potato, vegetables and wheat crops at a price which is competitive in comparison to other premium-quality commercial machinery manufacturers in the local market.
1.3 Keys to Success
Kouros Brothers Ltd.’s keys to success will include:
- A high level of quality in its product line.
- A-Z equipment mechanization series for Vegetables, Cereals, Potatoes & Livestock.
- Maintaining and growing its referral networks to generate new and repeat sales.
- Significant investments in research and development of machinery with the aim to focus on precisely controlled equipment (Coriander seed, carrot machines etc.).
- Improving efficiencies of operations and to reduce the crop producers operating costs.
- Link with Consulting offices for Agriculture and Scientific support to its Customers.
- The machinery and Systems of Kouros Brothers Ltd. aim to help Cypriot farmers and Agriculture producers to export their products in the European market and to obey all European directives for product quality.

Company Summary
Kouros Brothers Ltd. is a manufacturer of heavy Agriculture equipments and Euro, with one location in industrial Estate area, Larnaca. The company began its operations since 1963 with little capital investment. The company combined 40 years of experience in the Agriculture machinery and Implements field to generate a large customer base, where until recently owned 80% of the local Potato machinery market.
The company is specialized into Potato planting and mechanization. After Cyprus accession into EU the company’s Directors decided to expand their field of products and to diversify into Cereal, vegetables and livestock. Kouros Brothers Ltd. hopes to initially make a successful effort to secure start-up financing to implement a new business opportunity.
2.1 Company Ownership
Kouros Brothers Ltd. is a limited liability company. Mr. Kouros Stella Zither, Mr. Panikos Stella, and Mr. Andreas Stella are the shareholders, owning 66%, 26% and 8% of the share capital, respectively.
2.2 Location & Facilities
The company has one office currently located in Industrial Area, at Our Town. The factory is only 3.5 kilometers from the center of town and is located on the front line of the industrial area. It has a 500 sq. meter showroom and is visible from the main road.
The factory has 3000m2 of shop floor area, where all manufacturing equipments and facilities are located and used for either maintenance or manufacturing of equipments and implements.

The factory facilities are open from 07:00 – 17:00 hours, Monday to Friday. The company does receive after hours calls or on weekends and provides assistance as needed.
2.3 Company History
Kouros Brothers Ltd. was founded in Our Town, Cyprus in 1963, to manufacture and to sell a complete A-Z series of potatoes crop mechanization. The company was formed by the Stella Zither family: Mr. Kouros Stella Zither, Mr. Panikos Stella, and Mr. Andreas Stella.
Kouros Brothers Ltd. has its principal offices and manufacturing unit of 3000 m2 , located at Our Town, Industrial estate area, Cyprus.
We have good earnings and Capital Assets (the value of the land and store), but do not have enough cash on hand to buy new samples of the equipment to demonstrate their effectiveness to farmers.
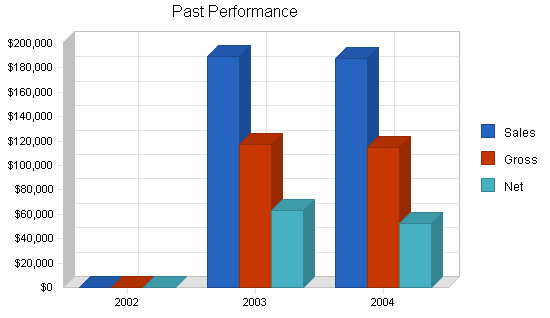
| Past Performance | |||
| 2002 | 2003 | 2004 | |
| Sales | £0 | £189,336 | £187,932 |
| Gross Margin | £0 | £117,104 | £114,356 |
| Gross Margin % | 0.00% | 61.85% | 60.85% |
| Operating Expenses | £0 | £53,688 | £62,156 |
| Collection Period (days) | 0 | 0 | 0 |
| Inventory Turnover | 0.00 | 28.89 | 9.81 |
| Balance Sheet | |||
| 2002 | 2003 | 2004 | |
| Current Assets | |||
| Cash | £0 | £37,233 | £22,870 |
| Accounts Receivable | £0 | £0 | £0 |
| Inventory | £0 | £5,000 | £10,000 |
| Other Current Assets | £0 | £10,700 | £13,980 |
| Total Current Assets | £0 | £52,933 | £46,850 |
| Long-term Assets | |||
| Long-term Assets | £0 | £100,000 | £100,000 |
| Accumulated Depreciation | £0 | £3,104 | £3,508 |
| Total Long-term Assets | £0 | £96,896 | £96,492 |
| Total Assets | £0 | £149,829 | £143,342 |
| Current Liabilities | |||
| Accounts Payable | £0 | £0 | £0 |
| Current Borrowing | £0 | £59,015 | £50,665 |
| Other Current Liabilities (interest free) | £0 | £23,702 | £13,501 |
| Total Current Liabilities | £0 | £82,717 | £64,166 |
| Long-term Liabilities | £0 | £10,000 | £10,000 |
| Total Liabilities | £0 | £92,717 | £74,166 |
| Paid-in Capital | £0 | £10,000 | £10,000 |
| Retained Earnings | £0 | (£16,304) | £6,976 |
| Earnings | £0 | £63,416 | £52,200 |
| Total Capital | £0 | £57,112 | £69,176 |
| Total Capital and Liabilities | £0 | £149,829 | £143,342 |
| Other Inputs | |||
| Payment Days | 0 | 30 | 30 |
| Sales on Credit | £0 | £0 | £0 |
| Receivables Turnover | 0.00 | 0.00 | 0.00 |
Products and Services
Kouros Brothers Ltd. is a manufacturer and Authorized dealer of imported Agriculture machinery and implements. The company is a manufacturer of the Potato A-Z mechanization such as Potato Planters, Diggers, Harvesters, Inter row cultivators, Taper Machines and Potato Fork-lift tractor mounted machines, Soil Preparation Machinery and Implements, Cereal Machinery and Implements, Transplanting machinery, Irrigation systems, Vegetable small seed planting machines, Wheat and Barley mechanization, Animal food factory and packing systems and Fire Fighting units designed for Agriculture areas.
Kouros Brothers Ltd. takes pride in having brought several new items for Livestock and Vegetable equipments that were otherwise unknown, such as the manure spreader machines, Cereal mechanization, and soil preparation machines. We also have designed and patented a new vegetable seed planting machine for Coriander, Onions, Beans, peas, broad beans, ground nuts, garlic, etc.
Kouros Brothers Ltd. has obtained the authorization to be a distributor for Beach Cleaning machines (French Patented systems). We are also a sole agent for beach creating technology and systems implementation.
Cereals
In the case of cereals, the farmers plant 50-120 kgs of seeds per hectare, while they could have the same results and even more production with 18 kgs seed per hectare. Cereal planting systems can save up to 70-100 kgs seed that is wasted in each hectare without reason.
Stubble Cultivator Implement
Stubble is an easy and inexpensive food for cows, sheep and other animals, and it decreases the use of fertilizers by 50%. Farmers who acquire the knowledge to increase stubble create their own forage, with the utilization of stable and barley.
If stubble is left in the fields, it can cause serious problems to the Wheat producers. The result is that soil is overloaded, there is a decrease of the fertility of soil and there is a continuous danger of fires which can burn hundreds of hectares of virgin forests and cause disasters to the environment as happens very ofter in summer. (EU directives have forbidden field-burning.)
Our unique Stubble cultivator machine can increase Wheat production and also can decrease the producer’s operating costs. By not exploiting stubble, farmers waste of tens of millions of pounds per year.
Potatoes
The potato producers lose huge quantities of potatoes that are abandoned in the fields without being collected, because they are only 5-10 cm below soil surface. From research, we found out that more than 1-1.5 tonnes of potatoes are abandoned in the soil in each hectare (1,000 t. meters), and in monetary terms we can say that the profit of the producer is abandoned in the field.
Our unique series of Potato mechanization systems and hectare that are exclusively manufactured into our Factory are tested for simplicity and are made with the best materials can warranty the potato quality and Low operating costs to the potato producer. These machines are satisfying the European directives requirements for Potato quality.
Livestock-farming
The cows in Cyprus produce 4-5 tonnes milk per year instead of 10-12 tones per year. For solving such problems our company has created last year a Pilot System of Cereals that can increase cereal production up to 1,000 -1,500 kgs per hectare clover for the livestock-farming and mixing of hay and pellets.
Our company has all the mechanization series and the associates with technology and know-how for animal food preparation and production from Cypriot materials such as Lolium, Loutex, Maze, Vetch, AA and trefoil.
Compost Machinery and Manure Spreader. Our Company has well-established European associates with the know-how and the technology to create compost, helping not only in farming sewage problems but also in quality of soil fertilization.
Wheat Planting Machines
The Wheat producer, in order to plant seed into 100 hectares, needs to use 250 kgs of Seed and to go to his field at least 4 times. This means 4 times more operating costs and even more so, Wheat prices dropped by 40% with the Cyprus accession into EU.
Our machine is designed such that it can do all four processes–soil cultivation, fertilizing and planting on line, seed cover with soil and corrugation–in one go. The producer needs only 80 kgs per 100 hectares, instead of 250 kgs. Fertilizer is dropped just 1 cm from soil surface, reducing fertilization costs by 50%, because the fertilizer is not moved away by wind or rain.
Seed Vegetable Planting Machines
Through research and development over the last 3 years, we have managed to create and to patent a unique Seed vegetable machine for a variety of vegetables such as onions, beans, garlic, coriander, etc. This machine is capable of planting all mentioned Vegetables by minimizing operational costs by up to 70% and can have the products made as per European Union directives as concern Size, Weight and Quality.
The company has already tested this machine for 3 years with several Cypriot vegetable producers and the results were beyond expectations. The machine has already been registered and patented rights are exclusively owned by our company. (Patent No. CY2351)
Market Analysis Summary
The overall market for agriculture machinery and implements is immense.
This business plan has identified over 1,800 agricultural producers and farmers in the local market that have a potential need to maintain and/or win customers or even more so are striving to survive. The funding schemes for agriculture and livestock support set by EU will allow them to stay competitive and this business opportunity is all about it.
Last week it was announced by the Ministry of Agriculture, Natural Resources and Environment that EU has available 256 million Euro for funding from 65%-80% of all units or producers intending to modernize and use technological advances in order to improve customers’ (Agriculture Producers’) product quality and to be able to export goods into European markets at competitive prices.
In reality, all agriculture and livestock businesses are in need of our products, because there are only 3 potential competitors locally who import or manufacture agricultural machinery and implements. Those involved with Potato mechanization have copied some of our unique series of products, whereas only 2 of them are involved with Cereal and Wheat implements. Kouros Brothers Ltd. has all machinery and implement series of equipments that will allow the Cypriot agriculturer and Livestock producer to stay competitive into European markets.
4.1 Market Segmentation
Our market segmentation scheme is fairly straightforward, and focuses on all agricultural and livestock sectors. The information contained in our customer analysis table is taken directly from the last statistics report published by the Ministry of Commerce and Industry and Tourism website and clearly shows that our largest market potential is more concentrated on the following sectors:
- Potato Crop Mechanization
- Cereals Crop Mechanization, including Wheat and Barley
- Vegetables crop Mechanization
- Packing Technology
- Livestock Machinery
- Beach Cleaning Machines and Beach Creation methodologies
- Fire Fighting Systems for rural areas
For more than 35 years, the company has owned almost 80% of the potato mechanization market. However, due to negative growth opportunities in this sector the last years, the prospects of this sector were unclear. Therefore, the company in order to survive has decided to invest in sectors such as new vegetable machine designs that will satisfy the vegetable producer needs (lower operational costs, low investment costs, simple machines, etc.) and also simultaneously through dealership of the main European agriculture machinery and implements manufacturers to become their sole agent and promoter in Cyprus and the Middle East area.
After 40 years of experience in agricultural machinery and implements manufacturing and design, the company has identified its strengths and weaknesses and has focused on vegetable, Cereals, Livestock and Beach Cleaning implements and technologies, allowing it to offer the same quality of service and support as are afforded by the larger businesses.
The strategy used for years was to bring in selected products, and then attempt to find a buyer. This resulted in inventory overstock, and obsolescence. The company already knows the customers’ needs and wants, therefore, as part of its marketing mix has decided to use the start up funding for buying a series of 6 main machinery that will have the most predicted demand and via marketing and promotion will try to promote its complete series of products.
After sales, services and spare parts provision to repeat customers is also part of our new Marketing strategy. The aim of the new marketing approach is to keep the existing customers and not to start building a new market share. Long-term relationships with customers is one of the key-success factors mentioned earlier and was one of the reasons that company survived and earned their business.
The company expects that by implementing a correct marketing mix, we will increase our share in this market segment by offering the same value-added service and support benefits that its commercial clients demand.

| Market Analysis | |||||||
| 2005 | 2006 | 2007 | 2008 | 2009 | |||
| Potential Customers | Growth | CAGR | |||||
| Potato Crop Mechanization | 2% | 465 | 474 | 483 | 493 | 503 | 1.98% |
| Cereals Crop Mechanization | 5% | 370 | 389 | 408 | 428 | 449 | 4.96% |
| Vegetables Crop Mechanization | 3% | 175 | 180 | 185 | 191 | 197 | 3.00% |
| Beach Cleaning Machines and Beach Creation systems | 2% | 125 | 128 | 131 | 134 | 137 | 2.32% |
| Fire Fighting Systems | 1% | 280 | 283 | 286 | 289 | 292 | 1.05% |
| Packing Technology and Equipments | 5% | 180 | 189 | 198 | 208 | 218 | 4.90% |
| Livestock Machinery | 7% | 72 | 77 | 82 | 88 | 94 | 6.89% |
| Total | 3.19% | 1,667 | 1,720 | 1,773 | 1,831 | 1,890 | 3.19% |
4.2 Target Market Segment Strategy
Our choice of target markets is based on comprehensive experience within the agriculture industry coupled with an in-depth understanding of the customers’ needs for more than 40 years.
We have taken a unique approach to satisfy our customers needs and wants and also simultaneously to answer all their questions and to air their fears about the effectiveness and efficiency of our products. The company identified that only the on-site testing of the agriculture machinery in the customers’ fields could calm down even the most resistive and questionable customer.
The company cannot be successful by just waiting for the customer to come for ordering. Instead, we must focus on the specific market segments whose needs match more to our series of products. Focusing on targeted segments is the key to company’s future.
Therefore, the company’s focus and marketing message will be not only the customer needs but also the after service and spare parts services offered. A good marketing mix will develop company’s message, communicate it, and fulfill its commitment to excellence.
Developing a market strategy is a departure from the way the company has been managed in the past. We will change the paradigm of being a product- and price-focused sales organization, to that of becoming a customer- and market-focused organization, aiming in sharing responsibility for customer satisfaction. We will accomplish this paradigm shift through the implementation of a balanced and continuous market research for agriculture needs and technology demands.
Planning and implementing specific strategies for each of the seven identified segments will be an ongoing process, and we will will consult with marketing specialists, and our manufacturers, to further refine these efforts as we develop an effective marketing plan.
4.3 Competition and Buying Patterns
Our customers want equipment that works well. They are paying a great deal of their annual income to purchase a machine, and will not buy anything unless they have a clear demonstration that it works, or a recommendation about buying from another farmer they trust. The Cypriot farmer and agriculture producer is the last minute man. He plans to buy a machinery only when it is critical and necessary, and when he identify the need, he wants immediate delivery.
Kouros Brothers Ltd.’s closest competitors are located in Next Town, Other Town and Our Town. They include the following five companies:
- IJK. Ltd.
- UVX. Ltd
- ABC. Ltd
All above listed competitors are offering standardized agriculture forbidden and implements for the potato industry and only 2 seek to satisfy somehow other sectors of the agriculture and Livestock Industry.
Strategy and Implementation Summary
Emphasize Customer Service
Kouros Brothers Ltd. has already differentiated itself from other manufacturers and importers of agriculture machinery and implements by offering a spare parts and service maintenance to their maintenance, professional advice to customers and custom solutions depending on customer demands.
Build a Relationship-Oriented Business
Build long-term relationships with clients, not just selling the equipments. Let them become dependent on company’s assistance to help out in many situations. Make them understand the value of the relationship.
Focus on Target Markets
The company plans to rapidly develop marketing alliances with agriculture consulting offices. The market strategy is to capitalize on Kouros Brothers Ltd. ever-increasing customer base and contacts by offering the latest products and after sales service.
The company’s goal in the next year is to exhibit its products in the Agriculture state fair that will take place at Nicosia next October which will allow for expanding the product service area with up-to-date servicing equipment.
Even more so, the company is planning to participate to the 2006 Agriculture machinery fair-exhibition at Thesalloniki, Greece at 28.1.2006 – 1.2.2006. The company as a sole Agent and sales representative of innovative new forbidden for Cyprus, Greece, and Syria will promote its latest wheat planting machine (to be patented in February, 2005), which is not only the latest technology in this field but also can reduce the operating costs of the wheat producers by 50%.
5.1 Competitive Edge
Our competitive edge is our positioning as a strategic ally with our clients, who are clients more than customers. By building a machinery based on long-standing relationships with satisfied clients, we simultaneously build defenses against competition. The longer the relationship stands, the more we help our clients understand what we offer them and why they should both stay with Kouros Brothers Ltd.. In close-knit communities like Cyprus, reputation is extremely important, and word-of-mouth advertising is invaluable.
The following differentiate Kouros Brothers Ltd. from its competitors:
- Wide Range of Machinery and Implements. The company’s machinery series satisfy all needs and wants of the Cypriot crop producer. Our latest technology systems and implements allow farmers to produce higher-quality products and give them a better competitive edge into European Markets.
- Low Overhead Cost. The company’s machinery systems provide a unique, low-cost production which was estimated to range from 30-70% of the crop operating cost.
5.2 Milestones
The following table lists important program milestones, with dates and managers in charge, and subjective budgets for each. The milestone schedule indicates our emphasis on planning for implementation. The most important programs are the sales and marketing programs listed in detail in the previous topics.
Company also is attributing a great emphasis on the 2005 Agriculture Fair which takes place every 2 years in the International State Fair, Nicosia and the Agriculture state fair at Thesalloniki, Greece in late January 2006.

| Milestones | |||||
| Milestone | Start Date | End Date | Budget | Manager | Department |
| Seek Financing | 5/13/2009 | 6/27/2009 | £1,000 | Kouros & Panikos | M&T + Accounting |
| Order of Equipments | 6/27/2009 | 8/11/2009 | £50,000 | Kouros & Panikos | M&T + Accounting |
| Spare Parts Orders | 6/27/2009 | 8/11/2009 | £4,000 | Kouros & Panikos | M&T + Accounting |
| Marketing associates Contact | 6/27/2009 | 8/21/2009 | £2,000 | Panikos | Accounting |
| Printing advertising stationery | 6/27/2009 | 9/5/2009 | £3,000 | Panikos | Accounting |
| DVD and CD creation | 6/27/2009 | 9/20/2009 | £1,500 | Kouros & Panikos | M&T + Accounting |
| Direct Marketing | 6/27/2009 | 10/30/2009 | £2,000 | Kouros | M&T |
| Contact Fair Organizers | 11/19/2009 | 12/19/2009 | £1,500 | Kouros & Panikos | M&T + Accounting |
| International Fair Participation, Nicosia | 3/4/2010 | 3/7/2010 | £2,000 | Kouros & Panikos | M&T + Accounting |
| Thesallonoki Fair Arrangements | 6/6/2010 | 6/10/2010 | £3,000 | Kouros & Panikos | M&T + Accounting |
| Totals | £70,000 | ||||
5.3 Marketing Strategy
The overall marketing plan for Kouros Brothers Ltd. products and services is based on the following fundamentals:
- The segment of the market(s) planned to reach.
- Distribution channels planned to be used to reach market segments: radio, sales associates, and Post cards, direct marketing, mailings, etc.
- Share of the market expected to capture over a fixed period of time.
Market Responsibilities
Kouros Brothers Ltd. is committed to an extensive promotional campaign. This will be done aggressively and on a broad scale. To accomplish initial sales goals, the company will require an extremely effective promotional campaign to accomplish two primary objectives:
- Attract quality sales/service personnel that have a desire to be successful.
- Attract customers that will constantly look to Kouros Brothers Ltd. for their marketing.
In addition, the company plans to advertise in magazines, newspapers, television, radio, and on billboards throughout the country.
Promotion
In addition to standard advertisement practices, Kouros Brothers Ltd. will gain considerable recognition through these additional promotional mediums:
- Press releases sent to major radio stations, newspapers, and magazines.
- Radio advertising on secondary stations.
- Incentives. As an extra incentive for customers and potential customers to Kouros Brothers Ltd. name, the company plans to distribute coffee mugs, T-shirts, pens, and other advertising specialties with the company logo. This will be an ongoing program for the company, when appropriate and where it is identified as beneficial.
- Brochures. The objective of brochures is to portray the company’s goals and products as an attractive functionality. It will also show to customers how to use the latest technology of innovations or what it relates to agricultural and Livestock sector.
Investment in Advertising and Promotion
For the first year of operation, advertising, and promotion is budgeted at a combined total of £10,000. A fixed amount of sales revenues will go toward the Kouros Brothers Ltd. advertisement campaign.
5.4 Sales Strategy
We will be offering a unique solution that will be introduced to the market through targeted advertising and direct sales. The direct sales force will consist of Mr. Kouros and Mr. Panayiotis Stella with coordination of their seasoned sales associate offices.
Mr. Kouros Stella will manage the direct sales through personal sales calls and direct visits to villages and customer premises. This market is a long term, repetitive business where relationships are a key component to success.
We will promote the company and its ability to act as an ally to agriculture producers and livestock farmers. We will make marketable Kouros Brothers Ltd., and keep the reputation as the industry-leading manufacturer it represents.
Pricing
Currently, Kouros Brothers Ltd. maintains a commercial credit policy for business customers with a net 30-day limit. Most of Kouros Brothers Ltd. customers choose to deal with their own financial sources.
The company offers competitive prices, which are subject to review when necessary. Knowledge of market and competitor prices gives to the company the advantage of pricing in-line with competitors. The Kouros Brothers Ltd. suppliers have and will continue to supply products that enable the company to meet the customers’ price ranges.
Most companies have a 15-20% markup on their merchandise. Having worked for most of the larger companies in the area, Mr. Kouros Stella has an advantage of knowing which companies are firm with the prices and how much others will decrease their prices.
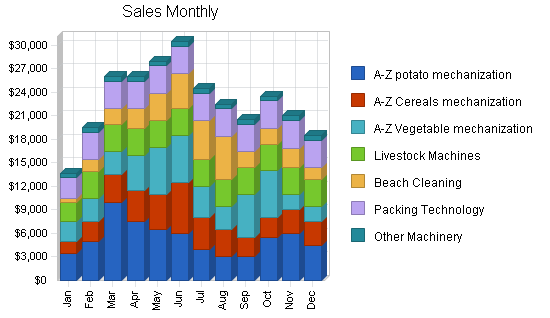
5.4.1 Sales Forecast
The important elements of the Sales Forecasts are shown in the chart and table below. Our sales are based on Government approval of funding for Agriculture and Livestock industries at the end of 2004, which will allow our customers to purchase more new equipment to remain competitive within the new EU market. Our exclusive contracts with European equipment manufacturers, our own patented designs, and our knowledge of the local Cyprus agricultural market and buying tendencies will allow us to capture a large part of that new funding. We project a sales increase over 50% next year. Beach Creation projects include a 10-12% commission.
Direct costs vary by category; in-house items like the potato mechanization equipment will have a lower direct cost than other equipment. We project an increase in gross margin as we gain market share and develop better contracts with our suppliers. Farmers buy equipment seasonally, so sales vary by month.

| Sales Forecast | |||||
| 2005 | 2006 | 2007 | 2008 | 2009 | |
| Sales | |||||
| A-Z potato mechanization | £64,500 | £70,950 | £78,045 | £85,850 | £94,434 |
| A-Z Cereals mechanization | £41,000 | £45,100 | £49,610 | £54,571 | £60,028 |
| A-Z Vegetable mechanization | £47,500 | £52,250 | £57,475 | £63,223 | £69,545 |
| Livestock Machines | £39,900 | £43,890 | £48,279 | £53,107 | £58,418 |
| Beach Cleaning | £32,900 | £36,190 | £39,809 | £43,790 | £48,169 |
| Packing Technology | £41,200 | £45,320 | £49,852 | £54,837 | £60,321 |
| Other Machinery | £7,200 | £7,920 | £8,712 | £9,583 | £10,542 |
| Total Sales | £274,200 | £301,620 | £331,782 | £364,960 | £401,456 |
| Direct Cost of Sales | 2005 | 2006 | 2007 | 2008 | 2009 |
| A-Z Potato Mechanization | £43,215 | £31,928 | £35,120 | £38,632 | £42,496 |
| A-Z Cereals Mechanization | £20,500 | £29,541 | £32,495 | £35,744 | £39,318 |
| A-Z Vegetables Mechanization | £23,750 | £35,530 | £39,083 | £42,991 | £47,290 |
| Livestock Machinery | £27,252 | £29,845 | £32,830 | £36,113 | £39,724 |
| Beach Cleaning Machines | £23,030 | £25,333 | £27,866 | £30,653 | £33,718 |
| Packing Technology | £26,780 | £29,458 | £29,911 | £32,902 | £36,193 |
| Other Machinery | £5,040 | £5,544 | £6,098 | £6,708 | £7,379 |
| Subtotal Direct Cost of Sales | £169,567 | £187,178 | £203,403 | £223,744 | £246,118 |
Management Summary
Kouros Brothers Ltd. management is comprised of experienced entrepreneurs and business professionals from the accounting, technology and marketing management industries. Our management team possesses a breadth of functional experience in Potato crop mechanization and were the leaders and manufacturers of agricultural attributing and implements since 1963. Mr Kouros. Zither was involved in a variety of product development projects designing new Farmers and implements according to customers specific needs and even more so, Mr. Kouros has managed to patent more than 4 innovative planting and Harvesting systems for Potatoes and Vegetables.
Mr. Panayiotis will be devoted on the senior management responsibilities for directing the sales/ marketing, finance, and distribution efforts and Mr. Kouros will be directing the development, operations, technological advancements and service operations.
6.1 Personnel Plan
Kouros Brothers Ltd. management is highly experienced and qualified. Its key management team includes Mr. Kouros and Mr. Panayiotis Stella. Jointly, they are responsible for processing quotes, arranging financing as needed, scheduling invoices for pickup and delivery, on-site testing and contract sales.
Mr. Kouros Stella, the General Director, has 35 years of marketing experience, sales experience, mechanical experience. Mr. Kouros makes all decisions concerning equipment purchases, and sometimes contacting customers when needed for providing advice and technological support when requested as this is his area of expertise.
Mr. Panayiotis, the Accounting Director, is in charge of obtaining all equipment for sales, completing contracts, working up quotes, setting up delivery of merchandise, arranging financing as needed, contacting customers, and verifying pickup and delivery. Mr Panayiotis has also 27 years of secretarial experience and 12 years accounts payable and receivable experience. Mr. Panayiotis, in conjunction with Mr. Kouros, answers the phone, faxes, does all the computer work, and if needed files any monthly or quarterly tax forms, compiles correspondence as needed, accounts receivable, accounts payable, meets with a bookkeeper for end of year tax return, keeps all office needs running smoothly, filing, typing, copies.
Future plans call for the hiring of a Marketing and Sales manager with hopes of adding 2 more Lathe men and a Welder/Fitter as needed.
| Personnel Plan | |||||
| 2005 | 2006 | 2007 | 2008 | 2009 | |
| General Director | £10,000 | £10,500 | £11,000 | £11,500 | £12,000 |
| Accounting Director | £10,000 | £7,500 | £8,000 | £8,500 | £9,000 |
| Lathe Man | £6,000 | £6,000 | £6,500 | £7,000 | £7,500 |
| Welder / Fitter | £6,000 | £6,000 | £6,500 | £7,000 | £7,500 |
| Salesperson | £6,000 | £6,000 | £6,500 | £7,000 | £7,500 |
| Total People | 5 | 5 | 5 | 5 | 5 |
| Total Payroll | £38,000 | £36,000 | £38,500 | £41,000 | £43,500 |
Financial Plan
The following sections shows in detail that Kouros Brothers Ltd. will be profitable and will easily repay its new loan within six years.
7.1 Important Assumptions
The key underlying assumptions of our financial plan shown in the following general assumption table are:
- We assume access to the funding necessary to re-shape the company, and to provide adequate initial capitalization for a wider range of demonstration equipment.
- We assume realistic to minimum sales, against highest expenses.
- We assume that European funding for agriculture support and development will take place early in 2005 and that the Cyprus Government will release those funds, allowing the farmers and agriculture producers to buy a complete series for their equipment needs.
Other key business assumptions are:
- As we join the EU marketplace, small farms will find it increasingly hard to stay in business, and only the well organized and standardized units will survive. (Based on trends in other recently-added EU member-nations.)
- Steady economic growth in Agriculture and Livestock sector, as predicted by the Ministry of Economics once funding for equipment is released by Cyprus Government.
| General Assumptions | |||||
| 2005 | 2006 | 2007 | 2008 | 2009 | |
| Plan Month | 1 | 2 | 3 | 4 | 5 |
| Current Interest Rate | 5.00% | 5.00% | 5.00% | 5.00% | 5.00% |
| Long-term Interest Rate | 8.50% | 8.50% | 8.50% | 8.50% | 8.50% |
| Tax Rate | 11.00% | 11.00% | 11.00% | 11.00% | 11.00% |
| Other | 0 | 0 | 0 | 0 | 0 |
7.2 Break-even Analysis
Our Break-even Analysis is shown in the following table and chart.
We will monitor direct costs very closely, and maintain them at or below 65% by taking advantage of all promotions and discounts offered by authorized manufacturers as they have tentatively agreed to offer us “end column” pricing as a new dealer incentive. We anticipate surpassing our break-even point once local farmers begin to spend their new government grant money.

| Break-even Analysis | |
| Monthly Revenue Break-even | £15,893 |
| Assumptions: | |
| Average Percent Variable Cost | 62% |
| Estimated Monthly Fixed Cost | £6,065 |
7.3 Projected Profit and Loss
The following table shows the projected Profit and Loss statement for the next five years. Our largest operating expenses are payroll-related, to cover necessary staff. We are adding a salesperson, and a welder/fitter and lathe man to work on repairs of existing equipment and to finish the in-house designed patented vegetable and cereal equipment.
Direct costs of goods reflects costs for purchasing inventory and having it delivered to our store. The third row shows additional direct costs for manufacturing our patented vegetable and cereal equipment.
Depreciation reflects the declining value of our long-term assets:
- £100,000 value of land and store, depreciated over 29 years (£3,400/year).
- £50,000 of new demo equipment depreciated over a term of 9 years (£5,556/year).
- In 2008 we will sell the depreciated demo equipment and buy £30,000 new assets, and depreciate that amount over 9 years (£3,333/year).


| Pro Forma Profit and Loss | |||||
| 2005 | 2006 | 2007 | 2008 | 2009 | |
| Sales | £274,200 | £301,620 | £331,782 | £364,960 | £401,456 |
| Direct Cost of Sales | £169,567 | £187,178 | £203,403 | £223,744 | £246,118 |
| Production Costs for Patented Planters | £8,850 | £9,735 | £10,709 | £11,779 | £12,957 |
| Total Cost of Sales | £178,417 | £196,913 | £214,112 | £235,523 | £259,075 |
| Gross Margin | £95,783 | £104,707 | £117,670 | £129,437 | £142,381 |
| Gross Margin % | 34.93% | 34.71% | 35.47% | 35.47% | 35.47% |
| Expenses | |||||
| Payroll | £38,000 | £36,000 | £38,500 | £41,000 | £43,500 |
| Marketing/Promotion | £6,000 | £6,000 | £5,000 | £5,000 | £5,000 |
| Depreciation | £8,489 | £8,952 | £8,952 | £6,733 | £6,733 |
| Insurance | £480 | £550 | £600 | £700 | £800 |
| Office consumables | £200 | £250 | £300 | £350 | £400 |
| Leasing | £600 | £650 | £650 | £650 | £650 |
| Trading expenses | £400 | £450 | £500 | £550 | £600 |
| Payroll Taxes | £0 | £0 | £0 | £0 | £0 |
| Electricity | £1,400 | £1,500 | £1,700 | £1,800 | £2,000 |
| Water | £2,004 | £0 | £0 | £0 | £0 |
| Fuels and Transport Expenses | £3,100 | £1,600 | £1,700 | £1,800 | £1,900 |
| Telex and Faxing | £4,500 | £2,400 | £2,400 | £2,400 | £2,400 |
| Banking rights | £1,100 | £1,000 | £1,000 | £1,100 | £1,200 |
| Travelling expenses | £4,500 | £5,000 | £5,000 | £5,000 | £5,000 |
| Tools Maintenance | £2,004 | £5,000 | £5,000 | £5,000 | £5,000 |
| Total Operating Expenses | £72,777 | £69,352 | £71,302 | £72,083 | £75,183 |
| Profit Before Interest and Taxes | £23,006 | £35,355 | £46,368 | £57,354 | £67,198 |
| EBITDA | £31,495 | £44,307 | £55,320 | £64,087 | £73,931 |
| Interest Expense | £5,814 | £4,830 | £3,802 | £2,775 | £1,747 |
| Taxes Incurred | £1,891 | £3,358 | £4,682 | £6,004 | £7,200 |
| Net Profit | £15,301 | £27,167 | £37,884 | £48,576 | £58,251 |
| Net Profit/Sales | 5.58% | 9.01% | 11.42% | 13.31% | 14.51% |
7.4 Projected Cash Flow
Cash flow reflects the seasonal purchasing of our customers. Our Cash Balance will increase as customers return to us for repeat sales, after their initial great experiences with us, based on the reasonable assumption of Funding support by Government, which is expected to be 256 millions for 2005-6. This agriculture development plan for 2004-2006 is supported by European Union for all its new members and this funding support will allow the Farmers and Agriculture crop producers to buy the neccessary equipments and to boost their sales and product quality.
The Cash Flow table shows the projected new long-term loan amount (£50,000), received in January, and the repayment of existing and new loans.
The table also shows how we will use this £50,000, to purchase a new, wider range of demonstration equipment, as long-term assets in January. This equipment is necessary to convince skeptical local farmers about the effectiveness of the new machines – we must have at least one model of each machine, which we can bring to their fields and demonstrate to them. Since this equipment is being used, we are depreciating it over nine years (see “Depreciation” in the Profit and Loss statement, above). We will sell this first round of demo equipment at the beginning of 2008, for its depreciated value, and buy another £30,000 of new demo equipment of the latest models, funded by cash flows from the business. This replacement equipment will also be depreciated over nine years.

| Pro Forma Cash Flow | |||||
| 2005 | 2006 | 2007 | 2008 | 2009 | |
| Cash Received | |||||
| Cash from Operations | |||||
| Cash Sales | £205,650 | £226,215 | £248,837 | £273,720 | £301,092 |
| Cash from Receivables | £64,079 | £74,958 | £82,454 | £90,699 | £99,769 |
| Subtotal Cash from Operations | £269,729 | £301,173 | £331,290 | £364,419 | £400,861 |
| Additional Cash Received | |||||
| Sales Tax, VAT, HST/GST Received | £0 | £0 | £0 | £0 | £0 |
| New Current Borrowing | £0 | £0 | £0 | £0 | £0 |
| New Other Liabilities (interest-free) | £0 | £0 | £0 | £0 | £0 |
| New Long-term Liabilities | £35,000 | £0 | £0 | £0 | £0 |
| Sales of Other Current Assets | £0 | £0 | £0 | £0 | £0 |
| Sales of Long-term Assets | £0 | £0 | £0 | £27,003 | £0 |
| New Investment Received | £0 | £0 | £0 | £0 | £0 |
| Subtotal Cash Received | £304,729 | £301,173 | £331,290 | £391,422 | £400,861 |
| Expenditures | 2005 | 2006 | 2007 | 2008 | 2009 |
| Expenditures from Operations | |||||
| Cash Spending | £38,000 | £36,000 | £38,500 | £41,000 | £43,500 |
| Bill Payments | £201,427 | £224,307 | £246,170 | £268,193 | £292,490 |
| Subtotal Spent on Operations | £239,427 | £260,307 | £284,670 | £309,193 | £335,990 |
| Additional Cash Spent | |||||
| Sales Tax, VAT, HST/GST Paid Out | £0 | £0 | £0 | £0 | £0 |
| Principal Repayment of Current Borrowing | £7,800 | £7,800 | £7,800 | £7,800 | £7,800 |
| Other Liabilities Principal Repayment | £3,372 | £3,375 | £3,375 | £3,379 | £0 |
| Long-term Liabilities Principal Repayment | £7,351 | £7,500 | £7,500 | £7,500 | £7,500 |
| Purchase Other Current Assets | £500 | £500 | £500 | £500 | £500 |
| Purchase Long-term Assets | £50,000 | £0 | £0 | £30,000 | £0 |
| Dividends | £0 | £0 | £0 | £0 | £0 |
| Subtotal Cash Spent | £308,450 | £279,482 | £303,845 | £358,372 | £351,790 |
| Net Cash Flow | (£3,721) | £21,691 | £27,446 | £33,051 | £49,071 |
| Cash Balance | £19,149 | £40,840 | £68,286 | £101,336 | £150,407 |
7.5 Projected Balance Sheet
Estimated balance sheets for the years 2005-2009 are provided below. The demonstration equipment we plan to buy shows up under long-term assets, bought in January of 2005, depreciated, sold in 2008, and replaced with £30,000 of new demo equipment. We project an increasing net worth.
| Pro Forma Balance Sheet | |||||
| 2005 | 2006 | 2007 | 2008 | 2009 | |
| Assets | |||||
| Current Assets | |||||
| Cash | £19,149 | £40,840 | £68,286 | £101,336 | £150,407 |
| Accounts Receivable | £4,471 | £4,918 | £5,410 | £5,951 | £6,546 |
| Inventory | £11,582 | £12,785 | £13,893 | £15,283 | £16,811 |
| Other Current Assets | £14,480 | £14,980 | £15,480 | £15,980 | £16,480 |
| Total Current Assets | £49,682 | £73,523 | £103,069 | £138,550 | £190,244 |
| Long-term Assets | |||||
| Long-term Assets | £150,000 | £150,000 | £150,000 | £152,997 | £152,997 |
| Accumulated Depreciation | £11,997 | £20,949 | £29,901 | £36,634 | £43,367 |
| Total Long-term Assets | £138,003 | £129,051 | £120,099 | £116,363 | £109,630 |
| Total Assets | £187,685 | £202,574 | £223,168 | £254,912 | £299,874 |
| Liabilities and Capital | 2005 | 2006 | 2007 | 2008 | 2009 |
| Current Liabilities | |||||
| Accounts Payable | £12,565 | £18,962 | £20,347 | £22,195 | £24,206 |
| Current Borrowing | £42,865 | £35,065 | £27,265 | £19,465 | £11,665 |
| Other Current Liabilities | £10,129 | £6,754 | £3,379 | £0 | £0 |
| Subtotal Current Liabilities | £65,559 | £60,781 | £50,991 | £41,660 | £35,871 |
| Long-term Liabilities | £37,649 | £30,149 | £22,649 | £15,149 | £7,649 |
| Total Liabilities | £103,208 | £90,930 | £73,640 | £56,809 | £43,520 |
| Paid-in Capital | £10,000 | £10,000 | £10,000 | £10,000 | £10,000 |
| Retained Earnings | £59,176 | £74,477 | £101,644 | £139,528 | £188,103 |
| Earnings | £15,301 | £27,167 | £37,884 | £48,576 | £58,251 |
| Total Capital | £84,477 | £111,644 | £149,528 | £198,103 | £256,354 |
| Total Liabilities and Capital | £187,685 | £202,574 | £223,168 | £254,912 | £299,874 |
| Net Worth | £84,477 | £111,644 | £149,528 | £198,103 | £256,354 |
7.6 Business Ratios
The table below presents common business ratios as a reference. Our business is part of the planting, haying, harvesting and processing machinery Industry (SIC Code 3523.01). Industry Profile Ratios are shown in the final column for comparison.
| Ratio Analysis | ||||||
| 2005 | 2006 | 2007 | 2008 | 2009 | Industry Profile | |
| Sales Growth | 45.90% | 10.00% | 10.00% | 10.00% | 10.00% | -0.95% |
| Percent of Total Assets | ||||||
| Accounts Receivable | 2.38% | 2.43% | 2.42% | 2.33% | 2.18% | 32.82% |
| Inventory | 6.17% | 6.31% | 6.23% | 6.00% | 5.61% | 34.00% |
| Other Current Assets | 7.72% | 7.39% | 6.94% | 6.27% | 5.50% | 14.34% |
| Total Current Assets | 26.47% | 36.29% | 46.18% | 54.35% | 63.44% | 81.16% |
| Long-term Assets | 73.53% | 63.71% | 53.82% | 45.65% | 36.56% | 18.84% |
| Total Assets | 100.00% | 100.00% | 100.00% | 100.00% | 100.00% | 100.00% |
| Current Liabilities | 34.93% | 30.00% | 22.85% | 16.34% | 11.96% | 26.15% |
| Long-term Liabilities | 20.06% | 14.88% | 10.15% | 5.94% | 2.55% | 23.74% |
| Total Liabilities | 54.99% | 44.89% | 33.00% | 22.29% | 14.51% | 49.89% |
| Net Worth | 45.01% | 55.11% | 67.00% | 77.71% | 85.49% | 50.11% |
| Percent of Sales | ||||||
| Sales | 100.00% | 100.00% | 100.00% | 100.00% | 100.00% | 100.00% |
| Gross Margin | 34.93% | 34.71% | 35.47% | 35.47% | 35.47% | 27.32% |
| Selling, General & Administrative Expenses | 29.35% | 25.71% | 24.05% | 22.16% | 20.96% | 14.62% |
| Advertising Expenses | 3.10% | 2.97% | 2.70% | 1.84% | 1.68% | 1.07% |
| Profit Before Interest and Taxes | 8.39% | 11.72% | 13.98% | 15.72% | 16.74% | 3.82% |
| Main Ratios | ||||||
| Current | 0.76 | 1.21 | 2.02 | 3.33 | 5.30 | 2.85 |
| Quick | 0.58 | 1.00 | 1.75 | 2.96 | 4.83 | 1.44 |
| Total Debt to Total Assets | 54.99% | 44.89% | 33.00% | 22.29% | 14.51% | 51.13% |
| Pre-tax Return on Net Worth | 20.35% | 27.34% | 28.47% | 27.55% | 25.53% | 5.77% |
| Pre-tax Return on Assets | 9.16% | 15.07% | 19.07% | 21.41% | 21.83% | 11.81% |
| Additional Ratios | 2005 | 2006 | 2007 | 2008 | 2009 | |
| Net Profit Margin | 5.58% | 9.01% | 11.42% | 13.31% | 14.51% | n.a |
| Return on Equity | 18.11% | 24.33% | 25.34% | 24.52% | 22.72% | n.a |
| Activity Ratios | ||||||
| Accounts Receivable Turnover | 15.33 | 15.33 | 15.33 | 15.33 | 15.33 | n.a |
| Collection Days | 29 | 23 | 23 | 23 | 23 | n.a |
| Inventory Turnover | 12.00 | 15.36 | 15.25 | 15.34 | 15.34 | n.a |
| Accounts Payable Turnover | 17.03 | 12.17 | 12.17 | 12.17 | 12.17 | n.a |
| Payment Days | 27 | 25 | 29 | 29 | 29 | n.a |
| Total Asset Turnover | 1.46 | 1.49 | 1.49 | 1.43 | 1.34 | n.a |
| Debt Ratios | ||||||
| Debt to Net Worth | 1.22 | 0.81 | 0.49 | 0.29 | 0.17 | n.a |
| Current Liab. to Liab. | 0.64 | 0.67 | 0.69 | 0.73 | 0.82 | n.a |
| Liquidity Ratios | ||||||
| Net Working Capital | (£15,877) | £12,742 | £52,078 | £96,890 | £154,374 | n.a |
| Interest Coverage | 3.96 | 7.32 | 12.20 | 20.67 | 38.46 | n.a |
| Additional Ratios | ||||||
| Assets to Sales | 0.68 | 0.67 | 0.67 | 0.70 | 0.75 | n.a |
| Current Debt/Total Assets | 35% | 30% | 23% | 16% | 12% | n.a |
| Acid Test | 0.51 | 0.92 | 1.64 | 2.82 | 4.65 | n.a |
| Sales/Net Worth | 3.25 | 2.70 | 2.22 | 1.84 | 1.57 | n.a |
| Dividend Payout | 0.00 | 0.00 | 0.00 | 0.00 | 0.00 | n.a |
Appendix
| Sales Forecast | |||||||||||||
| Jan | Feb | Mar | Apr | May | Jun | Jul | Aug | Sep | Oct | Nov | Dec | ||
| Sales | |||||||||||||
| A-Z potato mechanization | 0% | £3,500 | £5,000 | £10,000 | £7,500 | £6,500 | £6,000 | £4,000 | £3,000 | £3,000 | £5,500 | £6,000 | £4,500 |
| A-Z Cereals mechanization | 0% | £1,500 | £2,500 | £3,500 | £4,000 | £4,500 | £6,500 | £4,000 | £3,500 | £2,500 | £2,500 | £3,000 | £3,000 |
| A-Z Vegetable mechanization | 0% | £2,500 | £3,000 | £3,000 | £4,500 | £6,000 | £6,000 | £4,000 | £3,000 | £5,500 | £6,000 | £2,000 | £2,000 |
| Livestock Machines | 0% | £2,500 | £3,400 | £3,400 | £3,400 | £3,400 | £3,400 | £3,400 | £3,400 | £3,400 | £3,400 | £3,400 | £3,400 |
| Beach Cleaning | 0% | £400 | £1,500 | £2,000 | £2,500 | £3,500 | £4,500 | £5,000 | £5,500 | £2,000 | £2,000 | £2,500 | £1,500 |
| Packing Technology | 0% | £2,700 | £3,500 | £3,500 | £3,500 | £3,500 | £3,500 | £3,500 | £3,500 | £3,500 | £3,500 | £3,500 | £3,500 |
| Other Machinery | 0% | £600 | £600 | £600 | £600 | £600 | £600 | £600 | £600 | £600 | £600 | £600 | £600 |
| Total Sales | £13,700 | £19,500 | £26,000 | £26,000 | £28,000 | £30,500 | £24,500 | £22,500 | £20,500 | £23,500 | £21,000 | £18,500 | |
| Direct Cost of Sales | Jan | Feb | Mar | Apr | May | Jun | Jul | Aug | Sep | Oct | Nov | Dec | |
| A-Z Potato Mechanization | 67% | £2,345 | £3,350 | £6,700 | £5,025 | £4,355 | £4,020 | £2,680 | £2,010 | £2,010 | £3,685 | £4,020 | £3,015 |
| A-Z Cereals Mechanization | 50% | £750 | £1,250 | £1,750 | £2,000 | £2,250 | £3,250 | £2,000 | £1,750 | £1,250 | £1,250 | £1,500 | £1,500 |
| A-Z Vegetables Mechanization | 50% | £1,250 | £1,500 | £1,500 | £2,250 | £3,000 | £3,000 | £2,000 | £1,500 | £2,750 | £3,000 | £1,000 | £1,000 |
| Livestock Machinery | 68% | £1,708 | £2,322 | £2,322 | £2,322 | £2,322 | £2,322 | £2,322 | £2,322 | £2,322 | £2,322 | £2,322 | £2,322 |
| Beach Cleaning Machines | 70% | £280 | £1,050 | £1,400 | £1,750 | £2,450 | £3,150 | £3,500 | £3,850 | £1,400 | £1,400 | £1,750 | £1,050 |
| Packing Technology | 65% | £1,755 | £2,275 | £2,275 | £2,275 | £2,275 | £2,275 | £2,275 | £2,275 | £2,275 | £2,275 | £2,275 | £2,275 |
| Other Machinery | 70% | £420 | £420 | £420 | £420 | £420 | £420 | £420 | £420 | £420 | £420 | £420 | £420 |
| Subtotal Direct Cost of Sales | £8,508 | £12,167 | £16,367 | £16,042 | £17,072 | £18,437 | £15,197 | £14,127 | £12,427 | £14,352 | £13,287 | £11,582 | |
| Personnel Plan | |||||||||||||
| Jan | Feb | Mar | Apr | May | Jun | Jul | Aug | Sep | Oct | Nov | Dec | ||
| General Director | 0% | £833 | £833 | £833 | £833 | £833 | £833 | £833 | £833 | £833 | £833 | £833 | £833 |
| Accounting Director | 0% | £833 | £833 | £833 | £833 | £833 | £833 | £833 | £833 | £833 | £833 | £833 | £833 |
| Lathe Man | 0% | £500 | £500 | £500 | £500 | £500 | £500 | £500 | £500 | £500 | £500 | £500 | £500 |
| Welder / Fitter | 0% | £500 | £500 | £500 | £500 | £500 | £500 | £500 | £500 | £500 | £500 | £500 | £500 |
| Salesperson | 0% | £500 | £500 | £500 | £500 | £500 | £500 | £500 | £500 | £500 | £500 | £500 | £500 |
| Total People | 5 | 5 | 5 | 5 | 5 | 5 | 5 | 5 | 5 | 5 | 5 | 5 | |
| Total Payroll | £3,167 | £3,167 | £3,167 | £3,167 | £3,167 | £3,167 | £3,167 | £3,167 | £3,167 | £3,167 | £3,167 | £3,167 | |
| Pro Forma Profit and Loss | |||||||||||||
| Jan | Feb | Mar | Apr | May | Jun | Jul | Aug | Sep | Oct | Nov | Dec | ||
| Sales | £13,700 | £19,500 | £26,000 | £26,000 | £28,000 | £30,500 | £24,500 | £22,500 | £20,500 | £23,500 | £21,000 | £18,500 | |
| Direct Cost of Sales | £8,508 | £12,167 | £16,367 | £16,042 | £17,072 | £18,437 | £15,197 | £14,127 | £12,427 | £14,352 | £13,287 | £11,582 | |
| Production Costs for Patented Planters | 10% | £400 | £550 | £650 | £850 | £1,050 | £1,250 | £800 | £650 | £800 | £850 | £500 | £500 |
| Total Cost of Sales | £8,908 | £12,717 | £17,017 | £16,892 | £18,122 | £19,687 | £15,997 | £14,777 | £13,227 | £15,202 | £13,787 | £12,082 | |
| Gross Margin | £4,793 | £6,783 | £8,983 | £9,108 | £9,878 | £10,813 | £8,503 | £7,723 | £7,273 | £8,298 | £7,213 | £6,418 | |
| Gross Margin % | 34.98% | 34.78% | 34.55% | 35.03% | 35.28% | 35.45% | 34.71% | 34.32% | 35.48% | 35.31% | 34.35% | 34.69% | |
| Expenses | |||||||||||||
| Payroll | £3,167 | £3,167 | £3,167 | £3,167 | £3,167 | £3,167 | £3,167 | £3,167 | £3,167 | £3,167 | £3,167 | £3,167 | |
| Marketing/Promotion | £500 | £500 | £500 | £500 | £500 | £500 | £500 | £500 | £500 | £500 | £500 | £500 | |
| Depreciation | £283 | £746 | £746 | £746 | £746 | £746 | £746 | £746 | £746 | £746 | £746 | £746 | |
| Insurance | £40 | £40 | £40 | £40 | £40 | £40 | £40 | £40 | £40 | £40 | £40 | £40 | |
| Office consumables | £17 | £17 | £17 | £17 | £17 | £17 | £17 | £17 | £17 | £17 | £17 | £17 | |
| Leasing | £50 | £50 | £50 | £50 | £50 | £50 | £50 | £50 | £50 | £50 | £50 | £50 | |
| Trading expenses | £33 | £33 | £33 | £33 | £33 | £33 | £33 | £33 | £33 | £33 | £33 | £33 | |
| Payroll Taxes | 15% | £0 | £0 | £0 | £0 | £0 | £0 | £0 | £0 | £0 | £0 | £0 | £0 |
| Electricity | £117 | £117 | £117 | £117 | £117 | £117 | £117 | £117 | £117 | £117 | £117 | £117 | |
| Water | £167 | £167 | £167 | £167 | £167 | £167 | £167 | £167 | £167 | £167 | £167 | £167 | |
| Fuels and Transport Expenses | £258 | £258 | £258 | £258 | £258 | £258 | £258 | £258 | £258 | £258 | £258 | £258 | |
| Telex and Faxing | £375 | £375 | £375 | £375 | £375 | £375 | £375 | £375 | £375 | £375 | £375 | £375 | |
| Banking rights | £92 | £92 | £92 | £92 | £92 | £92 | £92 | £92 | £92 | £92 | £92 | £92 | |
| Travelling expenses | 15% | £375 | £375 | £375 | £375 | £375 | £375 | £375 | £375 | £375 | £375 | £375 | £375 |
| Tools Maintenance | £167 | £167 | £167 | £167 | £167 | £167 | £167 | £167 | £167 | £167 | £167 | £167 | |
| Total Operating Expenses | £5,641 | £6,103 | £6,103 | £6,103 | £6,103 | £6,103 | £6,103 | £6,103 | £6,103 | £6,103 | £6,103 | £6,103 | |
| Profit Before Interest and Taxes | (£848) | £679 | £2,879 | £3,004 | £3,774 | £4,709 | £2,399 | £1,619 | £1,169 | £2,194 | £1,109 | £314 | |
| EBITDA | (£565) | £1,425 | £3,625 | £3,750 | £4,520 | £5,455 | £3,145 | £2,365 | £1,915 | £2,940 | £1,855 | £1,060 | |
| Interest Expense | £524 | £517 | £510 | £502 | £495 | £488 | £481 | £474 | £467 | £460 | £452 | £445 | |
| Taxes Incurred | (£151) | £18 | £261 | £275 | £361 | £464 | £211 | £126 | £77 | £191 | £72 | (£14) | |
| Net Profit | (£1,221) | £145 | £2,109 | £2,227 | £2,919 | £3,757 | £1,707 | £1,020 | £625 | £1,544 | £585 | (£116) | |
| Net Profit/Sales | -8.91% | 0.74% | 8.11% | 8.56% | 10.42% | 12.32% | 6.97% | 4.53% | 3.05% | 6.57% | 2.78% | -0.63% | |
| Pro Forma Cash Flow | |||||||||||||
| Jan | Feb | Mar | Apr | May | Jun | Jul | Aug | Sep | Oct | Nov | Dec | ||
| Cash Received | |||||||||||||
| Cash from Operations | |||||||||||||
| Cash Sales | £10,275 | £14,625 | £19,500 | £19,500 | £21,000 | £22,875 | £18,375 | £16,875 | £15,375 | £17,625 | £15,750 | £13,875 | |
| Cash from Receivables | £114 | £3,473 | £4,929 | £6,500 | £6,517 | £7,021 | £7,575 | £6,108 | £5,608 | £5,150 | £5,854 | £5,229 | |
| Subtotal Cash from Operations | £10,389 | £18,098 | £24,429 | £26,000 | £27,517 | £29,896 | £25,950 | £22,983 | £20,983 | £22,775 | £21,604 | £19,104 | |
| Additional Cash Received | |||||||||||||
| Sales Tax, VAT, HST/GST Received | 0.00% | £0 | £0 | £0 | £0 | £0 | £0 | £0 | £0 | £0 | £0 | £0 | £0 |
| New Current Borrowing | £0 | £0 | £0 | £0 | £0 | £0 | £0 | £0 | £0 | £0 | £0 | £0 | |
| New Other Liabilities (interest-free) | £0 | £0 | £0 | £0 | £0 | £0 | £0 | £0 | £0 | £0 | £0 | £0 | |
| New Long-term Liabilities | £0 | £35,000 | £0 | £0 | £0 | £0 | £0 | £0 | £0 | £0 | £0 | £0 | £0 |
| Sales of Other Current Assets | £0 | £0 | £0 | £0 | £0 | £0 | £0 | £0 | £0 | £0 | £0 | £0 | |
| Sales of Long-term Assets | £0 | £0 | £0 | £0 | £0 | £0 | £0 | £0 | £0 | £0 | £0 | £0 | |
| New Investment Received | £0 | £0 | £0 | £0 | £0 | £0 | £0 | £0 | £0 | £0 | £0 | £0 | |
| Subtotal Cash Received | £45,389 | £18,098 | £24,429 | £26,000 | £27,517 | £29,896 | £25,950 | £22,983 | £20,983 | £22,775 | £21,604 | £19,104 | |
| Expenditures | Jan | Feb | Mar | Apr | May | Jun | Jul | Aug | Sep | Oct | Nov | Dec | |
| Expenditures from Operations | |||||||||||||
| Cash Spending | £3,167 | £3,167 | £3,167 | £3,167 | £3,167 | £3,167 | £3,167 | £3,167 | £3,167 | £3,167 | £3,167 | £3,167 | |
| Bill Payments | £333 | £10,283 | £19,271 | £24,023 | £19,624 | £22,265 | £23,910 | £15,668 | £16,423 | £14,452 | £19,817 | £15,356 | |
| Subtotal Spent on Operations | £3,499 | £13,449 | £22,438 | £27,190 | £22,791 | £25,432 | £27,077 | £18,835 | £19,590 | £17,619 | £22,984 | £18,523 | |
| Additional Cash Spent | |||||||||||||
| Sales Tax, VAT, HST/GST Paid Out | £0 | £0 | £0 | £0 | £0 | £0 | £0 | £0 | £0 | £0 | £0 | £0 | |
| Principal Repayment of Current Borrowing | £650 | £650 | £650 | £650 | £650 | £650 | £650 | £650 | £650 | £650 | £650 | £650 | |
| Other Liabilities Principal Repayment | £281 | £281 | £281 | £281 | £281 | £281 | £281 | £281 | £281 | £281 | £281 | £281 | |
| Long-term Liabilities Principal Repayment | £476 | £625 | £625 | £625 | £625 | £625 | £625 | £625 | £625 | £625 | £625 | £625 | |
| Purchase Other Current Assets | £42 | £42 | £42 | £42 | £42 | £42 | £42 | £42 | £42 | £42 | £42 | £42 | |
| Purchase Long-term Assets | £50,000 | £0 | £0 | £0 | £0 | £0 | £0 | £0 | £0 | £0 | £0 | £0 | |
| Dividends | £0 | £0 | £0 | £0 | £0 | £0 | £0 | £0 | £0 | £0 | £0 | £0 | |
| Subtotal Cash Spent | £54,948 | £15,047 | £24,036 | £28,788 | £24,389 | £27,030 | £28,674 | £20,433 | £21,188 | £19,216 | £24,582 | £20,121 | |
| Net Cash Flow | (£9,559) | £3,051 | £394 | (£2,788) | £3,128 | £2,866 | (£2,724) | £2,551 | (£204) | £3,559 | (£2,977) | (£1,016) | |
| Cash Balance | £13,311 | £16,363 | £16,756 | £13,968 | £17,097 | £19,963 | £17,238 | £19,789 | £19,585 | £23,143 | £20,166 | £19,149 | |
| Pro Forma Balance Sheet | |||||||||||||
| Jan | Feb | Mar | Apr | May | Jun | Jul | Aug | Sep | Oct | Nov | Dec | ||
| Assets | Starting Balances | ||||||||||||
| Current Assets | |||||||||||||
| Cash | £22,870 | £13,311 | £16,363 | £16,756 | £13,968 | £17,097 | £19,963 | £17,238 | £19,789 | £19,585 | £23,143 | £20,166 | £19,149 |
| Accounts Receivable | £0 | £3,311 | £4,713 | £6,283 | £6,283 | £6,767 | £7,371 | £5,921 | £5,437 | £4,954 | £5,679 | £5,075 | £4,471 |
| Inventory | £10,000 | £8,508 | £12,167 | £16,367 | £16,042 | £17,072 | £18,437 | £15,197 | £14,127 | £12,427 | £14,352 | £13,287 | £11,582 |
| Other Current Assets | £13,980 | £14,022 | £14,063 | £14,105 | £14,147 | £14,188 | £14,230 | £14,272 | £14,313 | £14,355 | £14,397 | £14,438 | £14,480 |
| Total Current Assets | £46,850 | £39,151 | £47,306 | £53,512 | £50,441 | £55,124 | £60,001 | £52,628 | £53,667 | £51,321 | £57,571 | £52,966 | £49,682 |
| Long-term Assets | |||||||||||||
| Long-term Assets | £100,000 | £150,000 | £150,000 | £150,000 | £150,000 | £150,000 | £150,000 | £150,000 | £150,000 | £150,000 | £150,000 | £150,000 | £150,000 |
| Accumulated Depreciation | £3,508 | £3,791 | £4,537 | £5,283 | £6,029 | £6,775 | £7,521 | £8,267 | £9,013 | £9,759 | £10,505 | £11,251 | £11,997 |
| Total Long-term Assets | £96,492 | £146,209 | £145,463 | £144,717 | £143,971 | £143,225 | £142,479 | £141,733 | £140,987 | £140,241 | £139,495 | £138,749 | £138,003 |
| Total Assets | £143,342 | £185,360 | £192,768 | £198,228 | £194,411 | £198,348 | £202,479 | £194,361 | £194,653 | £191,562 | £197,066 | £191,715 | £187,685 |
| Liabilities and Capital | Jan | Feb | Mar | Apr | May | Jun | Jul | Aug | Sep | Oct | Nov | Dec | |
| Current Liabilities | |||||||||||||
| Accounts Payable | £0 | £9,646 | £18,465 | £23,372 | £18,884 | £21,459 | £23,389 | £15,119 | £15,948 | £13,786 | £19,303 | £14,923 | £12,565 |
| Current Borrowing | £50,665 | £50,015 | £49,365 | £48,715 | £48,065 | £47,415 | £46,765 | £46,115 | £45,465 | £44,815 | £44,165 | £43,515 | £42,865 |
| Other Current Liabilities | £13,501 | £13,220 | £12,939 | £12,658 | £12,377 | £12,096 | £11,815 | £11,534 | £11,253 | £10,972 | £10,691 | £10,410 | £10,129 |
| Subtotal Current Liabilities | £64,166 | £72,881 | £80,769 | £84,745 | £79,326 | £80,970 | £81,969 | £72,768 | £72,666 | £69,573 | £74,159 | £68,848 | £65,559 |
| Long-term Liabilities | £10,000 | £44,524 | £43,899 | £43,274 | £42,649 | £42,024 | £41,399 | £40,774 | £40,149 | £39,524 | £38,899 | £38,274 | £37,649 |
| Total Liabilities | £74,166 | £117,405 | £124,668 | £128,019 | £121,975 | £122,994 | £123,368 | £113,542 | £112,815 | £109,097 | £113,058 | £107,122 | £103,208 |
| Paid-in Capital | £10,000 | £10,000 | £10,000 | £10,000 | £10,000 | £10,000 | £10,000 | £10,000 | £10,000 | £10,000 | £10,000 | £10,000 | £10,000 |
| Retained Earnings | £6,976 | £59,176 | £59,176 | £59,176 | £59,176 | £59,176 | £59,176 | £59,176 | £59,176 | £59,176 | £59,176 | £59,176 | £59,176 |
| Earnings | £52,200 | (£1,221) | (£1,076) | £1,033 | £3,260 | £6,179 | £9,936 | £11,643 | £12,663 | £13,288 | £14,832 | £15,417 | £15,301 |
| Total Capital | £69,176 | £67,955 | £68,100 | £70,209 | £72,436 | £75,355 | £79,112 | £80,819 | £81,839 | £82,464 | £84,008 | £84,593 | £84,477 |
| Total Liabilities and Capital | £143,342 | £185,360 | £192,768 | £198,228 | £194,411 | £198,348 | £202,479 | £194,361 | £194,653 | £191,562 | £197,066 | £191,715 | £187,685 |
| Net Worth | £69,176 | £67,955 | £68,100 | £70,209 | £72,436 | £75,355 | £79,112 | £80,819 | £81,839 | £82,464 | £84,008 | £84,593 | £84,477 |


