
Advanced Chiropractic Clinic
Executive Summary
Advanced Chiropractic Clinic will serve the St. Mary’s, Pennsylvania area. Dr. Jamey Azzato, a chiropractic doctor and recent graduate of Logan College of Chiropractic will be the owner and operator of the clinic. The clinic will specialize in the fastest growing alternative health care field, chiropractic.
The chiropractic approach to health care is holistic, stressing the patient’s overall health and wellness. It recognizes that many factors affect health, including exercise, diet, rest, environment, and heredity. Chiropractors provide natural, drugless, nonsurgical health treatments, and rely on the body’s inherent recuperative abilities.
The clinic will provide quality chiropractic services to people of all ages. The clinic will utilize new equipment and a trained staff, able to care for the individual needs of every patient that enters the clinic.
Our clinic’s keys to success are to put the patient’s health issues first and to treat each person as an individual, with individual health care needs.
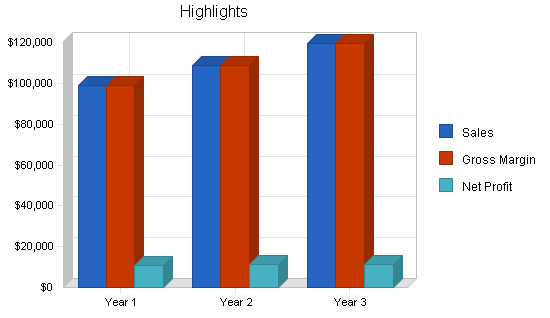
Sales are projected to increase from $99K the first year to about $120K the third, and profits almost negligible for the start-up phase of this business. We show a break-even point after seven months of business.
The projected net profit for the first three years is approximately $5,000/yr. We are projecting very conservatively regarding gross margin. Our client base should grow much faster than the projections. We prefer to project conservatively so that we make sure we have enough cash for unexplained costs.
1.1 Objectives
- Gross revenues of $120,000 in year three.
- Net profits of $5,000 for each year in the plan.
- Average patients visits per month of 165 during first year and 195 visits per month by year three.
- Patient visit average of 20 visits per patient per year.
- Collections of 95% or more and missed appointments under 5%.
The above figures are very conservative for patient visit averages when compared to the national average of 135 visits per week or 540 visits per month. We are keeping our figures on the low side to show that even if our clinic only produces one third the national average for patient visits per month that the business model is still viable.
1.2 Mission
The mission of Advanced Chiropractic is to promote the well-being of people in the St. Mary’s community (and surrounding areas) by providing accessible, quality chiropractic care for people of all ages, utilizing a service system that emphasizes trust, respect, confidentiality, and compassion.
We are committed to quality chiropractic care that focuses on the overall health of every patient, including rehabilitation and exercise advise, continuing patient education, ergonomics training, and nutritional support. We are further committed to the philosophy that we exist for the patient.
1.3 Keys to Success
Referral
Our internal marketing strategy emphasizes educating patients to the benefits of chiropractic care. This factor alone will provide referrals and build a solid patient base.
We will also network to obtain referrals from other professionals, such as lawyers, accountants, medical doctors, and other businesses in the area. Our educational procedures include patient focus groups, questionnaires, videos and mailings.
Systematic Procedures
By setting up our office to run efficiently and systematically we will decrease chance of errors and increase the number of patients we can see per hour. This translates into greater revenue and less internal complications.
Moreover, we will institute electronic billing procedures, which will cut down on paperwork and will increase ease of patient tracking. Our office floor plan is set up in such a way to also decrease the time it takes to provide quality chiropractic care per individual visit.
Reputation
Becoming well known in a community takes time, but once this trait is established it can increase the success of a clinic. Our clinic will accomplish this by going out into the community, church groups, high schools, and networking with other professionals in the area.
Location
Location is less important once you have the above factors in place. In the early stages of building up a chiropractic practice, having an office front on a busy street will definitely increase the likelihood of random walk-in patients.
Having accessible parking and being located where traffic isn’t too heavy can also attract those patients that don’t want to have the stress of “finding a parking place” or “paying for parking on a busy city street.” Being located in an area with a high patient to doctor ratio can also be beneficial.
Our clinic will be located on North Michael Street, which is in close proximity to downtown St. Mary’s.
Company Summary
The Advanced Chiropractic Clinic is a chiropractic practice started by Dr. Jamey Azzato in the newly opened clinic located at 252 North Michael Street, St. Mary’s, PA 15857.
The clinic will provide quality chiropractic services to people of all ages. The clinic will utilize new equipment and a trained staff, able to care for the individual needs of every patient that enters the clinic.
2.1 Company Ownership
The Advanced Chiropractic Clinic will be created as a Pennsylvania sole proprietorship based in Elk County, Pennsylvania owned and operated by Dr. Jamey Azzato.
2.2 Company Locations and Facilities
The clinic will be established in a new remodeled two story home located at 252 North Michael Street, St. Mary’s, PA 15857. The office will consist of a reception area with bathroom, xray suite, Dr. Azzato’s office, two treatment rooms and an exam room. Total office area will be approximately 1,000 square feet.
The office location is in close proximity to downtown St. Mary’s. The clinic will have new equipment, furniture, signage, and a large parking lot which is easily accessible from Oilwell Street. Patients may also park on North Michael Street. In addition, the office will be utilizing a high speed Internet server that will facilitate fast, secure electronic billing and communication.
2.3 Start-up Summary
It is estimated that start-up costs will be $35,000. This amount of money will be used to remodel the clinic, purchase xray/chiropractic/office equipment, furniture, stationary, and other start-up expenses.
The start-up costs are to be financed partially by Dr. Azzato’s personal funds of $5,000 and a $30,000 small business loan. An additional amount of $15,000 will be requested in the form a line of credit to offset any business expenses that occur in the first six months of business until the clinic can sustain itself.

| Start-up | |
| Requirements | |
| Start-up Expenses | |
| Remodeling | $10,000 |
| Chiropractic Xray Equipment | $10,000 |
| Chiropractic Tables | $5,200 |
| Other Chiropractic Equipment | $3,500 |
| Office Furniture (desks, PC, files, chairs) | $2,500 |
| Misc Expenses | $1,800 |
| Marketing Materials | $750 |
| Business Insurance | $750 |
| Stationery etc. | $250 |
| Legal/Accounting | $250 |
| Total Start-up Expenses | $35,000 |
| Start-up Assets | |
| Cash Required | $15,000 |
| Other Current Assets | $0 |
| Long-term Assets | $0 |
| Total Assets | $15,000 |
| Total Requirements | $50,000 |
| Start-up Funding | |
| Start-up Expenses to Fund | $35,000 |
| Start-up Assets to Fund | $15,000 |
| Total Funding Required | $50,000 |
| Assets | |
| Non-cash Assets from Start-up | $0 |
| Cash Requirements from Start-up | $15,000 |
| Additional Cash Raised | $0 |
| Cash Balance on Starting Date | $15,000 |
| Total Assets | $15,000 |
| Liabilities and Capital | |
| Liabilities | |
| Current Borrowing | $30,000 |
| Long-term Liabilities | $0 |
| Accounts Payable (Outstanding Bills) | $0 |
| Other Current Liabilities (interest-free) | $15,000 |
| Total Liabilities | $45,000 |
| Capital | |
| Planned Investment | |
| Dr. Azzato | $5,000 |
| Other | $0 |
| Additional Investment Requirement | $0 |
| Total Planned Investment | $5,000 |
| Loss at Start-up (Start-up Expenses) | ($35,000) |
| Total Capital | ($30,000) |
| Total Capital and Liabilities | $15,000 |
| Total Funding | $50,000 |
Services
The Advanced Chiropractic Clinic offers a complete chiropractic health care solution. Chiropractic is an alternative health care field that focuses on correcting joint misalignments called subluxations. Misalignments that occur in the spine and other places in the body cause interference to nervous system flow.

This interference will disrupt the way the body, organs, muscles, and other parts of the body function. It is the chiropractors job to remove these subluxations, thus removing the interference and returning the body to its normal functioning state.
3.1 Service Description
Dr. Azzato’s philosophy is that optimal health and performance can be attained through the proper balance of exercise, nutrition, and care of the body’s framework (skeleton).
In addition, maintaining a state of good health depends on a normally functioning nervous system. The most important and delicate organs of this nervous system are supported and protected by the skull and spinal vertebrae, when misaligned these structures can irritate and interfere with nerve impulses.
Chiropractors locate these points of interference and correct the spinal misalignments, so the body can reestablish its balance and heal itself to the best of its ability.
The Advanced Chiropractic Clinic offers treatment for various conditions including, but not limited to:
- Low back and leg pain.
- Neck and arm pain.
- Headaches.
- Athletic and work-related injuries.
- Shoulder, knee, and foot pain.
- Asthma, ear infections, and many other problems that begin when we are children.
If treated early on, these problems can be suppressed or fully corrected before the symptoms of the disorder become debilitating.
It is our focus at Advanced Chiropractic to care for each individual case that enters the clinic. After treating the patient, we educate them in rehabilitation, nutrition, and exercise. Our ultimate goal is that they have the opportunity and knowledge to adopt the chiropractic philosophy of health and share their experience with others.
3.2 Competitive Comparison
In general competition among fellow chiropractors is small. There is an average of only 10% of the United States population currently seeking chiropractic care.
With an ever increasing demand for cost effective health care, the chiropractic field is the fastest growing alternative health care option available in the United States. Moreover, there is an increasing number of “baby boomers” entering early retirement, which only increases the demand of chiropractic.
These facts along with the current success rate of chiropractors in the field and chiropractic as a profession over the last 100 years gives strong support that a well run chiropractic clinic can and will flourish.
Our clinic will be located on North Michael Street, which is close to the downtown area, giving our clinic great exposure in the community. Being located in close proximity to other businesses will also facilitate professional networking.
There are currently five chiropractors located in the city of St. Mary’s with approximately 15,000 people living within the St. Mary’s area. Moreover, only one of these five chiropractors serves the Emporium area, which has a population of 5,200. This is a very good patient to doctor ratio, also a number of surrounding areas have a limited chiropractic presence and many of these people commute to St. Mary’s for work and chiropractic care.
There are advantages to starting a practice in a community that already has a chiropractic presence. First, the community as a whole accepts and understands chiropractic because they have already been introduced to it.
This helps any new chiropractor because they have something to compare your office to. Our clinic will utilize the most recently taught techniques and equipment available to our profession. As a new graduate of one of the top rated chiropractic colleges in the U.S., Dr. Azzato has been exposed to the most recent academic and philosophical issues in the chiropractic profession.
This one fact alone will give our clinic an advantage when compared to the clinics that have been around for 20 plus years. Although, these older clinics have experience, they may lack the cutting edge knowledge that an ever changing profession must deal with to survive. Our clinic will have this knowledge and training.
Our clinic will also have an advantage in that it will be setup near Dr. Azzato’s home town. The Azzato family currently has family members employed in four of the major powered metal factories in St. Mary’s.
Also located in St. Mary’s are two other family-run businesses. One of which is the car dealership named AutoEdge, Inc. and a flower shop by the name of Forget-Me-Not-Creations. These community ties will increase the likelihood of a recognizable market presence and also provide valuable co-marketing tools for the future.
Furthermore, our clinic will promote patient education as high priority. We feel that this is sometimes overlooked by other chiropractors and can give us a large advantage in patient referrals and retention.
3.3 Sales Literature
The clinic will have a strong business relationship with Patient Media Inc., a chiropractic management firm, that has a number of patient friendly brochures, videos, mailing, and other materials used to promote a chiropractic office.
Literature and mailings for the initial market will be very important, with the need to establish a high-quality look and feel in order to create and fulfill the right sense of professionalism. We feel that Patient Media Inc. will fully support our marketing and sales efforts.
3.4 Fulfillment
Fulfillment and delivery will be provided by Dr. Azzato. The core value in our clinic will be professional expertise, provided by a combination of experience, hard work, and education. A limited number of staff will also provide services to our patients, all of which is influenced by Dr. Azzato.
Our clinic will turn to qualified chiropractic support specialists to assist with marketing and patient education. These marketing tools include brochures, mailings, educations videos and nutritional supplements to name a few.
Services will include performing chiropractic adjustments and therapy to our patients, as well as nutritional supplement and chiropractic orthotic product sales.
3.5 Technology
Our clinic understands that technology, when used properly, can increase the systematic approach of daily activities within an office and at the same time decrease chances of mistakes.
One step to a systematic approach that isn’t utilized by all offices is the use of electronic claim filing and patient tracking software. Our clinic will utilize high speed Internet servers and software for billing electronic medical claims.
There are many advantages associated with electronic claim filing. Health insurance carriers provide incentives like faster payment for processing insurance claims electronically, time-in-transit is reduced to speed payment, and administrative costs are lower.
In conjunction with electronic billing, there will be a clinic website where potential patients can learn about our clinic before ever setting foot in our office. The website will have articles related to patient’s specific conditions and nutritional supplements and orthotics available to purchase.
We will also use a number of therapies in the office including ultrasound, electric stimulation and electronic acupuncture. Our new patients will view educational videos to further enhance their visit and overall knowledge of chiropractic.
The clinic will maintain a high standard of professionalism with new chiropractic equipment, including adjusting tables and an xray unit.
We feel that all of these technological enhancements will increase our chances of success.
3.6 Future Services
As our clinic grows, we plan on increasing the number of treatment rooms and also expanding our staff to meet the increasing needs of our patient base. This will include newly developed chiropractic therapies and techniques.
Market Analysis Summary
Job prospects are expected to be good for persons who enter the chiropractic practice. Employment of chiropractors is expected to grow faster than average for all occupations through the year 2010 as consumer demand for alternative community grows.
Chiropractors emphasize the importance of healthy lifestyles and do not prescribe drugs or perform surgery. As a result, chiropractic care is appealing to many health-conscious Americans. Chiropractic treatment of back, neck, extremities, and other joint damage has become more accepted as a result of recent research and changing attitudes about alternative community practices.
The rapidly expanding older population, with their increased likelihood of mechanical and structural problems, also will increase demand in the chiropractic profession.
Demand for chiropractic treatment is also related to the ability of patients to pay, either directly or through health insurance. Although more insurance plans now cover chiropractic services, the extent of such coverage varies among plans.
Increasingly, chiropractors must educate communities about the benefits of chiropractic care in order to establish a successful practice.
In this occupation, replacement needs arise almost entirely from retirements. Chiropractors usually remain in the occupation until they retire; few transfer to other occupations. Establishing a new practice will be easiest in areas with a low concentration of chiropractors.
4.1 Market Segmentation
The Advanced Chiropractic Clinic will focus on the following market segments:
- Blue collar work force (age 18-44);
- Active baby-boomers (age 45-64);
- Retired (age 65 and up);
- Children (age 0-17);

4.2 Target Market Segment Strategy
Blue Collar Workforce
St. Mary’s and the surrounding area has a high number of blue-collar workers in a number of different work places.
These workers are in stressful job settings with little or no on the job training in work-related ergonomics. Many of these jobs require repetitive movements and lifting that cause stress and injury over time.
Chiropractic has an outstanding track record when treating work-related injuries, like low back pain and carpal tunnel syndrome. Dr. Azzato will have the added help when reaching out to these workers because he has a number of friends and family members, which have long standing careers at these work places.
Baby Boomers
The Baby Boomer age bracket is nearing the stage in their lives that demands chiropractic care to prevent many of the problems of aging. Many dysfunctions of the body occur as we age and this target market is a prime candidate for the services we provide.
Family oriented
The clinic will have a family oriented patient base, this includes patients of any age, gender, race, educational status, or religion.
All persons in the community and/or surrounding area are eligible patients. Advanced Chiropractic will also strive to educate patients who are parents, so they can have their children, regardless of health status, benefit from chiropractic care.
Family/Friend Referrals
A big advantage of starting a business near your hometown, where there is a large family base, is that in the early stages of building a patient base I expect to receive referrals and treat many of my family members.
I also have two family members who run small businesses in the area and I will be coordinating marketing projects through them to increase my presence in the area.
4.2.1 Market Needs
The need for chiropractic services is increasing in a dramatic fashion. More and more patients of the medical model are now looking for alternative cost-effective ways to prevent injury and remain in a state of health. This is even more important in the current recession economy where people more than ever many be facing employment and insurance problems. Chiropractic is a valuable tool that is very affordable for most people.
4.2.2 Market Trends
The aging of America is the single most dominant factor in the future of medicine, chiropractic, and the health industry. Today, one in ten Americans use chiropractic services; that will increase with the aging of the population.
The arithmetic is simple. Today there are approximately 33 million Americans over the age of 65. In 20 years – only a generation – there will be 60 million, almost doubling in size. By their sheer numbers, the elderly will propel the upward growth of all medical services across the spectrum of health care delivery.
Older Americans represent nearly 13 percent of the population today. Older Americans are surviving the acute episodes of chronic diseases – the heart attacks, strokes, mastectomies – and recovering to high-health lifestyles.
These age groups have substantial disposable income and will be investing in their own health. The aging of America will push demand upwards for medical and chiropractic services, and impel a closer working relationship between the DC and the MD for care of their older patients.
Chiropractic’s future is promising. Demand is rising; so are chiropractic expenditures and revenues. Growing health consciousness by American consumers is well-aligned with the chiropractic philosophy of fitness and natural treatment. The aging of the population should swell demand for chiropractic services.
4.2.3 Market Growth
Chiropractic is the fastest-growing and second-largest primary health care profession. There are approximately 60,000 doctors of chiropractic in active practice in the United States spread from rural areas to inner cities. More than 10,000 students are currently enrolled in chiropractic educational programs accredited by a federally recognized body (CCE).
Chiropractic services are in high demand. Tens of millions of Americans routinely opt for chiropractic services and this number is rapidly growing. In 1993, more than 30 million consumers made chiropractic a regular part of their health care program.
The “Fifth Annual Salary & Expense Survey Results” show a rise in chiropractic patient visits from 97 visits per week in 2000 to 117 visits per week in 2001 to 135 visits per week in 2002. The number of visits per week is a relatively good number to measure the strength of chiropractic as a business model. Also, the survey revealed a rising gross and net revenue over the past three years.
Job prospects are expected to be good for persons who enter the practice of chiropractic. Employment of chiropractors is expected to grow faster than the average, increasing 21 to 35%, for all occupations through the year 2010 as consumer demand for alternative health care grows.
Chiropractors emphasize the importance of healthy lifestyles and do not prescribe drugs or perform surgery. As a result, chiropractic care is appealing to many health-conscious Americans.
Chiropractic treatment of back, neck, extremities, and other joint damage has become more accepted as a result of recent research and changing attitudes about alternative fashion practices. The rapidly expanding older population, with their increased likelihood of mechanical and structural problems, also will increase demand.
Demand for chiropractic treatment is also related to the ability of patients to pay, either directly or through health insurance. Although more insurance plans now cover chiropractic services, the extent of such coverage varies among plans. Increasingly, chiropractors must educate communities about the benefits of chiropractic care in order to establish a successful practice.
In this occupation, replacement needs arise almost entirely from retirements. Chiropractors usually remain in the occupation until they retire; few transfer to other occupations. Establishing a new practice will be easiest in areas with a low concentration of chiropractors.
4.3 Service Business Analysis
Chiropractors, also known as doctors of chiropractic or chiropractic physicians, diagnose and treat patients whose health problems are associated with the body’s muscular, nervous, and skeletal systems, especially the spine.
Chiropractors believe interference with these systems impairs normal functions and lowers resistance to disease. They also hold that spinal or vertebral dysfunction alters many important body functions by affecting the nervous system, and that skeletal imbalance through joint or articular dysfunction, especially in the spine, can cause pain.
The chiropractic approach is holistic, stressing the patient’s overall health and wellness. It recognizes that many factors affect health, including exercise, diet, rest, environment, and heredity.
Chiropractors provide natural, drugless, nonsurgical health treatments, and rely on the body’s inherent recuperative abilities. They also recommend lifestyle changes – in eating, exercise, and sleeping habits, for example – to their patients. When appropriate, chiropractors consult with and refer patients to other health practitioners.
Like other health practitioners, chiropractors follow a standard routine to secure the information needed for diagnosis and treatment. They take the patient’s medical history, conduct physical, neurological, and orthopedic examinations, and may order laboratory tests. Xrays and other diagnostic images are important tools because of the emphasis on the spine and its proper function. Chiropractors also employ a postural and spinal analysis common to chiropractic diagnosis.
In cases in which difficulties can be traced to involvement of musculoskeletal structures, chiropractors manually adjust the spinal column. Some chiropractors use water, light, massage, ultrasound, electric, and heat therapy.
They also may apply supports such as straps, tapes, and braces. Chiropractors counsel patients about wellness concepts such as nutrition, exercise, lifestyle changes, and stress management, but do not prescribe drugs or perform surgery.
Some chiropractors specialize in sports injuries, neurology, orthopedics, pediatrics, nutrition, internal disorders, or diagnostic imaging.
Many chiropractors are solo or group practitioners who also have the administrative responsibilities of running a practice. In larger offices, chiropractors delegate these tasks to office managers and chiropractic assistants. Chiropractors in private practice are responsible for developing a patient base, hiring employees, and keeping records.
4.3.1 Business Participants
Chiropractors held about 50,000 jobs in 2000. Most chiropractors are in solo practice, although some are in group practice or work for other chiropractors. A small number teach, conduct research at chiropractic institutions, or work in hospitals and clinics.
Many chiropractors are located in small communities. There are geographic imbalances in the distribution of chiropractors, in part because many establish practices close to chiropractic institutions.
Strategy and Implementation Summary
The Advanced Chiropractic Clinic will focus on three fundamental business strategies, maintaining a professional business attitude when treating patients, using a systematic approach to manage patients, and educating patients and the community to the advantages of chiropractic care.
The target patient group will be blue collar workers and their families.
5.1 Value Proposition
The clinic will function under certain philosophies. These philosophies are set in place to maintain an ongoing committment to excellence. One such philosophy will be focused on business development.
Our clinic will constantly maintain a professional appearance and attitude. We will not deviate from patient treatment plans. We will track our business performance on a monthly basis with charting of patient visit averages, patient satisfaction surveys of our clinic and management team, and revenue streams to name of few.
Another step to our development will be to update our fee schedule to assure that our fees are in-line with our competitors. Moreover, our business will continually update our strategies with regards to our target markets and how we will access and market to each of them.
5.2 Marketing Strategy
The following are the marketing strategies that our clinic will focus on.
5.2.1 Positioning Statement
For patients of the St. Mary’s area that are seeking the most comprehensive, cost effective health care available, the Advanced Chiropractic Clinic is ready to meet your needs. Unlike many other health care professions that have a narrow scope of focus, our clinic’s focal point is on the patient as a whole.
We concentrate not only on the symptoms that the patient has, but more importantly why those symptoms are present. Some of the areas we will concentrate on are nutrition, patient education, ergonomics in the workplace, and an overall healthy lifestyle.
5.2.2 Pricing Strategy
The below fee schedule will be used in our clinic and is in-line with our competitors and the national averages.
| Radiology | Consultation/Examination |
| Full Spine 2 view series: $220 Cervical 3 view series: $165 Cervical 5 view series: $225 Cervical 7 view series: $315 Thoracic 2 view series: $110 Thoracic 3 view series: $165 Thoracic 4 view series: $220 Lumbar 3 view series: $165 Lumbar 5 view series: $275 Single views may vary |
New Patient Service: $150 Regional Exam: $45 Report of Findings: $40 |
| Professional Services |
Therapies | Misc |
| Adjustment 1 Region: $30 Adjustment 2 Region: $40 Adjustment Extremity: $15 Adjustment 3 or more regions: $60 |
Cryotherapy: $15 Electric Stim: $20 Ultrasound: $20 Intersegmental Traction: $20 |
Ice Pack: $8 |
5.2.3 Promotion Strategy
When opening up a new business regardless of the sector it is important to have the business recognized by potential customers. This also holds true when opening a chiropractic clinic. As part of our promotional strategy, our clinic plans on getting our name recognized in the public eye in a number of ways.
First, we will meet with other business owners in the area and explain the importance of work related injuries and ergonomics. Furthermore, our clinic will setup a number of workshops and open houses to let patients come in and see our new clinic. We will also provide blood pressure and chiropractic screening.
Another way the our clinic will promote itself will be with meeting a set number of people each month. The initial goal is to meet 100 individuals in the first 30 days of having the clinic open. This will be accomplished by going out into the public and introducing the clinic.
Lastly, we will give public health talks to the community, but more importantly, each new patient will be asked to come to a health awareness workshop. These workshops will be given Tuesday nights of each week. All new patients will be asked to bring at least one other person to the workshop.
At each workshop, a brief talk will be given by Dr. Azzato. New patients will have time to ask important questions about chiropractic and individuals who accompany the new patient will be introduced to our clinic.
We feel that the most important way to become established in a community is to go out and meet as many people as possible. The above strategies will help us achieve that goal.
5.3 Competitive Edge
The Advanced Chiropractic Clinic will have a competitive edge based on hard work, organization, trustworthiness, and the knowledge of the most recently taught techniques and training available in the chiropractic profession. All of these factors will lead to high internal referral rates do to patient satisfaction.
Our clinic will maintain a professional atmosphere, yet be personal enough where our patients feel comfortable and get the most out of each visit. Our clinic will maintain privacy and security with electronic billing procedures, so our patients can rest assured that their claims will be processed in the proper manner.
Another edge that we feel will help our clinic make a long lasting impression is that we will network within the community. Our networking will focus on the communities workforce because this group has the highest number of potential patients.
5.4 Sales Strategy
The following are the sales strategies that our clinic will focus on.
5.4.1 Sales Forecast
The Sales Forecast table is broken down by how many patient visits occur per month. The sales/revenue per visit is set at $50 per visit with a 20% growth rate per month of patient visits. This formula is carried out to forecast three years into the future.

| Sales Forecast | |||
| Year 1 | Year 2 | Year 3 | |
| Unit Sales | |||
| Average Visits Per Month | 1,979 | 2,177 | 2,395 |
| Other | 0 | 0 | 0 |
| Total Unit Sales | 1,979 | 2,177 | 2,395 |
| Unit Prices | Year 1 | Year 2 | Year 3 |
| Average Visits Per Month | $50.00 | $50.00 | $50.00 |
| Other | $0.00 | $0.00 | $0.00 |
| Sales | |||
| Average Visits Per Month | $98,950 | $108,845 | $119,730 |
| Other | $0 | $0 | $0 |
| Total Sales | $98,950 | $108,845 | $119,730 |
| Direct Unit Costs | Year 1 | Year 2 | Year 3 |
| Average Visits Per Month | $0.00 | $0.00 | $0.00 |
| Other | $0.00 | $0.00 | $0.00 |
| Direct Cost of Sales | |||
| Average Visits Per Month | $0 | $0 | $0 |
| Other | $0 | $0 | $0 |
| Subtotal Direct Cost of Sales | $0 | $0 | $0 |
5.5 Strategic Alliances
We depend on our alliances with other professionals, like lawyers, medical doctors, and other business owners, to generate patients for us.
We need to make sure our patients understand exactly what we do as a chiropractor, so they can in turn explain it to their friends and family, thus producing internal referrals. To accomplish this we have made an affiliation with Patient Media, Inc. They will handle all of the patient educational marketing products that we will use in our clinic.
Management Summary
The initial management team will consist of Dr. Azzato, a receptionist and/or a part-time clinician’s assistant. As we grow, we will take on additional personnel.
6.1 Organizational Structure
Our clinic will have two employees at its onset, yet the clinic has set some philosophies and strategies in place to maintain a proper organizational structure with regards to the clinic and its patients.
Our clinic will maintain a strict rule as to the privacy of our patients and their records. We hold a high standard of patient education and feel that this is very important to the management of our patients.
Each patient will be treated as an individual with specific needs that must be looked at in a unique and genuine way. Our clinic will not hold any prejudice towards any patient’s ethnic or economic status.
The employees of the clinic, including Dr. Azzato, will continually improve their skills and knowledge of the chiropractic business by reading trade journals and attending continuing education seminars. There will also be mandatory staff meeting held each Thursday to go over patient surveys and discuss issues to improve the clinic.
The staff of the clinic will have specific duties that they will perform on a daily basis. They will be responsible for their individual duties and must complete them in a systematic time-efficient manor. An annual bonus salary schedule will most likely be set in place for excellence in monthly performance reviews.
The clinic’s staff must also uphold a professional image when outside the clinic. The clinic will be involved in a number of activities to promote the business and chiropractic in general. During these events the staff will maintain a professional attitude.
All of these subtle strategies will put our clinic ahead of our competitors and give our patients the added assurance that they have received the best chiropractic care available.
6.2 Personnel Plan
The following table summarizes our personnel expenditures for the first three years, with compensation increasing from $60K the first year to about $79K in the third.
The increase is due to Dr. Azzato’s 20% pay increase each year. We believe this plan is a compromise between fairness and expedience, and meets the commitment of our mission statement.
An employee bonus pay structure will be developed after year three or the plan will be implemented during the first three years if there is a significant increase in sales/net profits.
| Personnel Plan | |||
| Year 1 | Year 2 | Year 3 | |
| Dr. Azzato | $42,000 | $50,400 | $60,480 |
| Receptionist/Clinician’s Assistant | $18,000 | $18,000 | $18,000 |
| Total People | 2 | 2 | 2 |
| Total Payroll | $60,000 | $68,400 | $78,480 |
Financial Plan
The following is the financial plan for the Advanced Chiropractic Clinic.
7.1 Important Assumptions
The financial plan depends on Important Assumptions, most of which are shown in the following table as annual assumptions. The monthly assumptions are included in the appendix.
From the beginning, we recognize that collection on services provided are critical, but not a factor we can influence easily. At least we are planning on the problem, and dealing with it. Interest rates, tax rates, and personnel burden are based on conservative assumptions.
Moreover, the patient visits per month that we used are very conservative. Our visit average is approximately one third that of the national average.
The national average according to the “Fifth Annual Salary & Expense Survey of 2002” was 135 patient visits per month or 540 visits per month. Our forecast for year one is only an average of 165 visits per month and year three shows approximately 200 patient visits per month.
Again this is well below the national average, we expect our business to be meeting or exceeding the national averages by year three, but we wanted to show that the business plan is still viable at these low numbers.
7.2 Break-even Analysis
The following chart and table summarize our Break-even Analysis. With fixed costs of $6,775 per month at the outset, our clinic will need to collect $6,775 of billings to cover our monthly costs.
Our average service charge collected will be $50, therefore we will need to have 136 patient visits per month (34 per week) to achieve a break-even point. We don’t expect to reach break-even until six months into the business operation, at which point our patient base will have expanded and internal referrals will be increasing each month.

| Break-even Analysis | |
| Monthly Units Break-even | 136 |
| Monthly Revenue Break-even | $6,775 |
| Assumptions: | |
| Average Per-Unit Revenue | $50.00 |
| Average Per-Unit Variable Cost | $0.00 |
| Estimated Monthly Fixed Cost | $6,775 |
7.3 Projected Profit and Loss
Our Projected Profit and Loss is shown on the following table, with sales increasing from $99K the first year to about $120K the third, and profits almost negligible for the start-up phase of this business. We show a break-even point after six months of business in December of 2003.
Our break-even point of sales per month is $7,395 or about 148 patient visits per month. Again this is about 1/4 the national average, but we would rather stay on the conservative side when forecasting, thus assuming little risk.
The projected net profit for the first three years is approximately $5,000/yr. These projections do not account for tax depreciation on equipment or deductions for a home office.
As with the break-even, we are projecting very conservatively regarding gross margin. Our client base should grow much faster than the projections. We prefer to project conservatively so that we make sure we have enough cash for unexplained costs.
The detailed monthly projections are included in the appendix.


| Pro Forma Profit and Loss | |||
| Year 1 | Year 2 | Year 3 | |
| Sales | $98,950 | $108,845 | $119,730 |
| Direct Cost of Sales | $0 | $0 | $0 |
| Other Costs of Sales | $0 | $0 | $0 |
| Total Cost of Sales | $0 | $0 | $0 |
| Gross Margin | $98,950 | $108,845 | $119,730 |
| Gross Margin % | 100.00% | 100.00% | 100.00% |
| Expenses | |||
| Payroll | $60,000 | $68,400 | $78,480 |
| Sales and Marketing and Other Expenses | $4,800 | $4,800 | $4,800 |
| Depreciation | $0 | $0 | $0 |
| Rent | $3,000 | $3,000 | $3,000 |
| Utilities & Phone | $2,400 | $2,400 | $2,400 |
| Insurance | $1,800 | $1,800 | $1,800 |
| Payroll Taxes | $9,000 | $10,260 | $11,772 |
| Other (misc) | $300 | $300 | $300 |
| Total Operating Expenses | $81,300 | $90,960 | $102,552 |
| Profit Before Interest and Taxes | $17,650 | $17,885 | $17,178 |
| EBITDA | $17,650 | $17,885 | $17,178 |
| Interest Expense | $2,560 | $1,734 | $990 |
| Taxes Incurred | $4,527 | $4,845 | $4,856 |
| Net Profit | $10,563 | $11,306 | $11,331 |
| Net Profit/Sales | 10.68% | 10.39% | 9.46% |
7.4 Projected Cash Flow
Cash Flow projections are critical to our success. The monthly cash flow is shown in the illustration, with one bar representing the cash flow per month, and the other the monthly cash balance. The annual cash flow figures are included here and the more important detailed monthly numbers are included in the appendix.
The clinic’s negative net cash flow in the initial start up phase (first six months) will be offset by a $15,000 line-of-credit obtained from the bank. This credit line will be used for any other expenditures that are not yet accounted for in this plan.

| Pro Forma Cash Flow | |||
| Year 1 | Year 2 | Year 3 | |
| Cash Received | |||
| Cash from Operations | |||
| Cash Sales | $98,950 | $108,845 | $119,730 |
| Subtotal Cash from Operations | $98,950 | $108,845 | $119,730 |
| Additional Cash Received | |||
| Sales Tax, VAT, HST/GST Received | $0 | $0 | $0 |
| New Current Borrowing | $0 | $0 | $0 |
| New Other Liabilities (interest-free) | $0 | $0 | $0 |
| New Long-term Liabilities | $0 | $0 | $0 |
| Sales of Other Current Assets | $0 | $0 | $0 |
| Sales of Long-term Assets | $0 | $0 | $0 |
| New Investment Received | $0 | $0 | $0 |
| Subtotal Cash Received | $98,950 | $108,845 | $119,730 |
| Expenditures | Year 1 | Year 2 | Year 3 |
| Expenditures from Operations | |||
| Cash Spending | $60,000 | $68,400 | $78,480 |
| Bill Payments | $23,123 | $32,008 | $29,854 |
| Subtotal Spent on Operations | $83,123 | $100,408 | $108,334 |
| Additional Cash Spent | |||
| Sales Tax, VAT, HST/GST Paid Out | $0 | $0 | $0 |
| Principal Repayment of Current Borrowing | $8,940 | $7,440 | $7,440 |
| Other Liabilities Principal Repayment | $0 | $0 | $0 |
| Long-term Liabilities Principal Repayment | $0 | $0 | $0 |
| Purchase Other Current Assets | $0 | $0 | $0 |
| Purchase Long-term Assets | $0 | $0 | $0 |
| Dividends | $0 | $0 | $0 |
| Subtotal Cash Spent | $92,063 | $107,848 | $115,774 |
| Net Cash Flow | $6,887 | $997 | $3,955 |
| Cash Balance | $21,887 | $22,884 | $26,839 |
7.5 Projected Balance Sheet
The Balance Sheet in the following table shows managed but sufficient growth of net worth, and a sufficiently healthy financial position by year three.
The net worth of the clinic remained negative in year one due to the $30,000 loan which appears as a liability on day one. The loan repayment is also shown in the monthly expense report. The monthly estimates are included in the appendix.
| Pro Forma Balance Sheet | |||
| Year 1 | Year 2 | Year 3 | |
| Assets | |||
| Current Assets | |||
| Cash | $21,887 | $22,884 | $26,839 |
| Other Current Assets | $0 | $0 | $0 |
| Total Current Assets | $21,887 | $22,884 | $26,839 |
| Long-term Assets | |||
| Long-term Assets | $0 | $0 | $0 |
| Accumulated Depreciation | $0 | $0 | $0 |
| Total Long-term Assets | $0 | $0 | $0 |
| Total Assets | $21,887 | $22,884 | $26,839 |
| Liabilities and Capital | Year 1 | Year 2 | Year 3 |
| Current Liabilities | |||
| Accounts Payable | $5,264 | $2,395 | $2,459 |
| Current Borrowing | $21,060 | $13,620 | $6,180 |
| Other Current Liabilities | $15,000 | $15,000 | $15,000 |
| Subtotal Current Liabilities | $41,324 | $31,015 | $23,639 |
| Long-term Liabilities | $0 | $0 | $0 |
| Total Liabilities | $41,324 | $31,015 | $23,639 |
| Paid-in Capital | $5,000 | $5,000 | $5,000 |
| Retained Earnings | ($35,000) | ($24,437) | ($13,131) |
| Earnings | $10,563 | $11,306 | $11,331 |
| Total Capital | ($19,437) | ($8,131) | $3,200 |
| Total Liabilities and Capital | $21,887 | $22,884 | $26,839 |
| Net Worth | ($19,437) | ($8,131) | $3,200 |
Appendix
| Sales Forecast | |||||||||||||
| Month 1 | Month 2 | Month 3 | Month 4 | Month 5 | Month 6 | Month 7 | Month 8 | Month 9 | Month 10 | Month 11 | Month 12 | ||
| Unit Sales | |||||||||||||
| Average Visits Per Month | 0% | 50 | 60 | 72 | 86 | 104 | 124 | 149 | 179 | 215 | 258 | 310 | 372 |
| Other | 0% | 0 | 0 | 0 | 0 | 0 | 0 | 0 | 0 | 0 | 0 | 0 | 0 |
| Total Unit Sales | 50 | 60 | 72 | 86 | 104 | 124 | 149 | 179 | 215 | 258 | 310 | 372 | |
| Unit Prices | Month 1 | Month 2 | Month 3 | Month 4 | Month 5 | Month 6 | Month 7 | Month 8 | Month 9 | Month 10 | Month 11 | Month 12 | |
| Average Visits Per Month | $50.00 | $50.00 | $50.00 | $50.00 | $50.00 | $50.00 | $50.00 | $50.00 | $50.00 | $50.00 | $50.00 | $50.00 | |
| Other | $0.00 | $0.00 | $0.00 | $0.00 | $0.00 | $0.00 | $0.00 | $0.00 | $0.00 | $0.00 | $0.00 | $0.00 | |
| Sales | |||||||||||||
| Average Visits Per Month | $2,500 | $3,000 | $3,600 | $4,300 | $5,200 | $6,200 | $7,450 | $8,950 | $10,750 | $12,900 | $15,500 | $18,600 | |
| Other | $0 | $0 | $0 | $0 | $0 | $0 | $0 | $0 | $0 | $0 | $0 | $0 | |
| Total Sales | $2,500 | $3,000 | $3,600 | $4,300 | $5,200 | $6,200 | $7,450 | $8,950 | $10,750 | $12,900 | $15,500 | $18,600 | |
| Direct Unit Costs | Month 1 | Month 2 | Month 3 | Month 4 | Month 5 | Month 6 | Month 7 | Month 8 | Month 9 | Month 10 | Month 11 | Month 12 | |
| Average Visits Per Month | 0.00% | $0.00 | $0.00 | $0.00 | $0.00 | $0.00 | $0.00 | $0.00 | $0.00 | $0.00 | $0.00 | $0.00 | $0.00 |
| Other | 0.00% | $0.00 | $0.00 | $0.00 | $0.00 | $0.00 | $0.00 | $0.00 | $0.00 | $0.00 | $0.00 | $0.00 | $0.00 |
| Direct Cost of Sales | |||||||||||||
| Average Visits Per Month | $0 | $0 | $0 | $0 | $0 | $0 | $0 | $0 | $0 | $0 | $0 | $0 | |
| Other | $0 | $0 | $0 | $0 | $0 | $0 | $0 | $0 | $0 | $0 | $0 | $0 | |
| Subtotal Direct Cost of Sales | $0 | $0 | $0 | $0 | $0 | $0 | $0 | $0 | $0 | $0 | $0 | $0 | |
| Personnel Plan | |||||||||||||
| Month 1 | Month 2 | Month 3 | Month 4 | Month 5 | Month 6 | Month 7 | Month 8 | Month 9 | Month 10 | Month 11 | Month 12 | ||
| Dr. Azzato | 0% | $3,500 | $3,500 | $3,500 | $3,500 | $3,500 | $3,500 | $3,500 | $3,500 | $3,500 | $3,500 | $3,500 | $3,500 |
| Receptionist/Clinician’s Assistant | 0% | $1,500 | $1,500 | $1,500 | $1,500 | $1,500 | $1,500 | $1,500 | $1,500 | $1,500 | $1,500 | $1,500 | $1,500 |
| Total People | 2 | 2 | 2 | 2 | 2 | 2 | 2 | 2 | 2 | 2 | 2 | 2 | |
| Total Payroll | $5,000 | $5,000 | $5,000 | $5,000 | $5,000 | $5,000 | $5,000 | $5,000 | $5,000 | $5,000 | $5,000 | $5,000 | |
| Pro Forma Profit and Loss | |||||||||||||
| Month 1 | Month 2 | Month 3 | Month 4 | Month 5 | Month 6 | Month 7 | Month 8 | Month 9 | Month 10 | Month 11 | Month 12 | ||
| Sales | $2,500 | $3,000 | $3,600 | $4,300 | $5,200 | $6,200 | $7,450 | $8,950 | $10,750 | $12,900 | $15,500 | $18,600 | |
| Direct Cost of Sales | $0 | $0 | $0 | $0 | $0 | $0 | $0 | $0 | $0 | $0 | $0 | $0 | |
| Other Costs of Sales | $0 | $0 | $0 | $0 | $0 | $0 | $0 | $0 | $0 | $0 | $0 | $0 | |
| Total Cost of Sales | $0 | $0 | $0 | $0 | $0 | $0 | $0 | $0 | $0 | $0 | $0 | $0 | |
| Gross Margin | $2,500 | $3,000 | $3,600 | $4,300 | $5,200 | $6,200 | $7,450 | $8,950 | $10,750 | $12,900 | $15,500 | $18,600 | |
| Gross Margin % | 100.00% | 100.00% | 100.00% | 100.00% | 100.00% | 100.00% | 100.00% | 100.00% | 100.00% | 100.00% | 100.00% | 100.00% | |
| Expenses | |||||||||||||
| Payroll | $5,000 | $5,000 | $5,000 | $5,000 | $5,000 | $5,000 | $5,000 | $5,000 | $5,000 | $5,000 | $5,000 | $5,000 | |
| Sales and Marketing and Other Expenses | $400 | $400 | $400 | $400 | $400 | $400 | $400 | $400 | $400 | $400 | $400 | $400 | |
| Depreciation | $0 | $0 | $0 | $0 | $0 | $0 | $0 | $0 | $0 | $0 | $0 | $0 | |
| Rent | $250 | $250 | $250 | $250 | $250 | $250 | $250 | $250 | $250 | $250 | $250 | $250 | |
| Utilities & Phone | $200 | $200 | $200 | $200 | $200 | $200 | $200 | $200 | $200 | $200 | $200 | $200 | |
| Insurance | $150 | $150 | $150 | $150 | $150 | $150 | $150 | $150 | $150 | $150 | $150 | $150 | |
| Payroll Taxes | 15% | $750 | $750 | $750 | $750 | $750 | $750 | $750 | $750 | $750 | $750 | $750 | $750 |
| Other (misc) | $25 | $25 | $25 | $25 | $25 | $25 | $25 | $25 | $25 | $25 | $25 | $25 | |
| Total Operating Expenses | $6,775 | $6,775 | $6,775 | $6,775 | $6,775 | $6,775 | $6,775 | $6,775 | $6,775 | $6,775 | $6,775 | $6,775 | |
| Profit Before Interest and Taxes | ($4,275) | ($3,775) | ($3,175) | ($2,475) | ($1,575) | ($575) | $675 | $2,175 | $3,975 | $6,125 | $8,725 | $11,825 | |
| EBITDA | ($4,275) | ($3,775) | ($3,175) | ($2,475) | ($1,575) | ($575) | $675 | $2,175 | $3,975 | $6,125 | $8,725 | $11,825 | |
| Interest Expense | $245 | $240 | $235 | $229 | $224 | $219 | $214 | $209 | $204 | $186 | $181 | $176 | |
| Taxes Incurred | ($1,356) | ($1,204) | ($1,023) | ($811) | ($540) | ($238) | $138 | $590 | $1,131 | $1,782 | $2,563 | $3,495 | |
| Net Profit | ($3,164) | ($2,810) | ($2,387) | ($1,893) | ($1,259) | ($556) | $323 | $1,376 | $2,640 | $4,157 | $5,981 | $8,155 | |
| Net Profit/Sales | -126.56% | -93.68% | -66.30% | -44.02% | -24.22% | -8.96% | 4.33% | 15.38% | 24.56% | 32.23% | 38.59% | 43.84% | |
| Pro Forma Cash Flow | |||||||||||||
| Month 1 | Month 2 | Month 3 | Month 4 | Month 5 | Month 6 | Month 7 | Month 8 | Month 9 | Month 10 | Month 11 | Month 12 | ||
| Cash Received | |||||||||||||
| Cash from Operations | |||||||||||||
| Cash Sales | $2,500 | $3,000 | $3,600 | $4,300 | $5,200 | $6,200 | $7,450 | $8,950 | $10,750 | $12,900 | $15,500 | $18,600 | |
| Subtotal Cash from Operations | $2,500 | $3,000 | $3,600 | $4,300 | $5,200 | $6,200 | $7,450 | $8,950 | $10,750 | $12,900 | $15,500 | $18,600 | |
| Additional Cash Received | |||||||||||||
| Sales Tax, VAT, HST/GST Received | 0.00% | $0 | $0 | $0 | $0 | $0 | $0 | $0 | $0 | $0 | $0 | $0 | $0 |
| New Current Borrowing | $0 | $0 | $0 | $0 | $0 | $0 | $0 | $0 | $0 | $0 | $0 | $0 | |
| New Other Liabilities (interest-free) | $0 | $0 | $0 | $0 | $0 | $0 | $0 | $0 | $0 | $0 | $0 | $0 | |
| New Long-term Liabilities | $0 | $0 | $0 | $0 | $0 | $0 | $0 | $0 | $0 | $0 | $0 | $0 | |
| Sales of Other Current Assets | $0 | $0 | $0 | $0 | $0 | $0 | $0 | $0 | $0 | $0 | $0 | $0 | |
| Sales of Long-term Assets | $0 | $0 | $0 | $0 | $0 | $0 | $0 | $0 | $0 | $0 | $0 | $0 | |
| New Investment Received | $0 | $0 | $0 | $0 | $0 | $0 | $0 | $0 | $0 | $0 | $0 | $0 | |
| Subtotal Cash Received | $2,500 | $3,000 | $3,600 | $4,300 | $5,200 | $6,200 | $7,450 | $8,950 | $10,750 | $12,900 | $15,500 | $18,600 | |
| Expenditures | Month 1 | Month 2 | Month 3 | Month 4 | Month 5 | Month 6 | Month 7 | Month 8 | Month 9 | Month 10 | Month 11 | Month 12 | |
| Expenditures from Operations | |||||||||||||
| Cash Spending | $5,000 | $5,000 | $5,000 | $5,000 | $5,000 | $5,000 | $5,000 | $5,000 | $5,000 | $5,000 | $5,000 | $5,000 | |
| Bill Payments | $22 | $669 | $816 | $994 | $1,202 | $1,469 | $1,768 | $2,142 | $2,591 | $3,131 | $3,768 | $4,550 | |
| Subtotal Spent on Operations | $5,022 | $5,669 | $5,816 | $5,994 | $6,202 | $6,469 | $6,768 | $7,142 | $7,591 | $8,131 | $8,768 | $9,550 | |
| Additional Cash Spent | |||||||||||||
| Sales Tax, VAT, HST/GST Paid Out | $0 | $0 | $0 | $0 | $0 | $0 | $0 | $0 | $0 | $0 | $0 | $0 | |
| Principal Repayment of Current Borrowing | $620 | $620 | $620 | $620 | $620 | $620 | $620 | $620 | $620 | $2,120 | $620 | $620 | |
| Other Liabilities Principal Repayment | $0 | $0 | $0 | $0 | $0 | $0 | $0 | $0 | $0 | $0 | $0 | $0 | |
| Long-term Liabilities Principal Repayment | $0 | $0 | $0 | $0 | $0 | $0 | $0 | $0 | $0 | $0 | $0 | $0 | |
| Purchase Other Current Assets | $0 | $0 | $0 | $0 | $0 | $0 | $0 | $0 | $0 | $0 | $0 | $0 | |
| Purchase Long-term Assets | $0 | $0 | $0 | $0 | $0 | $0 | $0 | $0 | $0 | $0 | $0 | $0 | |
| Dividends | $0 | $0 | $0 | $0 | $0 | $0 | $0 | $0 | $0 | $0 | $0 | $0 | |
| Subtotal Cash Spent | $5,642 | $6,289 | $6,436 | $6,614 | $6,822 | $7,089 | $7,388 | $7,762 | $8,211 | $10,251 | $9,388 | $10,170 | |
| Net Cash Flow | ($3,142) | ($3,289) | ($2,836) | ($2,314) | ($1,622) | ($889) | $62 | $1,188 | $2,539 | $2,649 | $6,112 | $8,430 | |
| Cash Balance | $11,858 | $8,569 | $5,733 | $3,419 | $1,798 | $908 | $970 | $2,158 | $4,697 | $7,345 | $13,457 | $21,887 | |
| Pro Forma Balance Sheet | |||||||||||||
| Month 1 | Month 2 | Month 3 | Month 4 | Month 5 | Month 6 | Month 7 | Month 8 | Month 9 | Month 10 | Month 11 | Month 12 | ||
| Assets | Starting Balances | ||||||||||||
| Current Assets | |||||||||||||
| Cash | $15,000 | $11,858 | $8,569 | $5,733 | $3,419 | $1,798 | $908 | $970 | $2,158 | $4,697 | $7,345 | $13,457 | $21,887 |
| Other Current Assets | $0 | $0 | $0 | $0 | $0 | $0 | $0 | $0 | $0 | $0 | $0 | $0 | $0 |
| Total Current Assets | $15,000 | $11,858 | $8,569 | $5,733 | $3,419 | $1,798 | $908 | $970 | $2,158 | $4,697 | $7,345 | $13,457 | $21,887 |
| Long-term Assets | |||||||||||||
| Long-term Assets | $0 | $0 | $0 | $0 | $0 | $0 | $0 | $0 | $0 | $0 | $0 | $0 | $0 |
| Accumulated Depreciation | $0 | $0 | $0 | $0 | $0 | $0 | $0 | $0 | $0 | $0 | $0 | $0 | $0 |
| Total Long-term Assets | $0 | $0 | $0 | $0 | $0 | $0 | $0 | $0 | $0 | $0 | $0 | $0 | $0 |
| Total Assets | $15,000 | $11,858 | $8,569 | $5,733 | $3,419 | $1,798 | $908 | $970 | $2,158 | $4,697 | $7,345 | $13,457 | $21,887 |
| Liabilities and Capital | Month 1 | Month 2 | Month 3 | Month 4 | Month 5 | Month 6 | Month 7 | Month 8 | Month 9 | Month 10 | Month 11 | Month 12 | |
| Current Liabilities | |||||||||||||
| Accounts Payable | $0 | $642 | $783 | $954 | $1,153 | $1,411 | $1,697 | $2,056 | $2,488 | $3,006 | $3,618 | $4,368 | $5,264 |
| Current Borrowing | $30,000 | $29,380 | $28,760 | $28,140 | $27,520 | $26,900 | $26,280 | $25,660 | $25,040 | $24,420 | $22,300 | $21,680 | $21,060 |
| Other Current Liabilities | $15,000 | $15,000 | $15,000 | $15,000 | $15,000 | $15,000 | $15,000 | $15,000 | $15,000 | $15,000 | $15,000 | $15,000 | $15,000 |
| Subtotal Current Liabilities | $45,000 | $45,022 | $44,543 | $44,094 | $43,673 | $43,311 | $42,977 | $42,716 | $42,528 | $42,426 | $40,918 | $41,048 | $41,324 |
| Long-term Liabilities | $0 | $0 | $0 | $0 | $0 | $0 | $0 | $0 | $0 | $0 | $0 | $0 | $0 |
| Total Liabilities | $45,000 | $45,022 | $44,543 | $44,094 | $43,673 | $43,311 | $42,977 | $42,716 | $42,528 | $42,426 | $40,918 | $41,048 | $41,324 |
| Paid-in Capital | $5,000 | $5,000 | $5,000 | $5,000 | $5,000 | $5,000 | $5,000 | $5,000 | $5,000 | $5,000 | $5,000 | $5,000 | $5,000 |
| Retained Earnings | ($35,000) | ($35,000) | ($35,000) | ($35,000) | ($35,000) | ($35,000) | ($35,000) | ($35,000) | ($35,000) | ($35,000) | ($35,000) | ($35,000) | ($35,000) |
| Earnings | $0 | ($3,164) | ($5,974) | ($8,361) | ($10,254) | ($11,513) | ($12,069) | ($11,746) | ($10,370) | ($7,730) | ($3,572) | $2,409 | $10,563 |
| Total Capital | ($30,000) | ($33,164) | ($35,974) | ($38,361) | ($40,254) | ($41,513) | ($42,069) | ($41,746) | ($40,370) | ($37,730) | ($33,572) | ($27,591) | ($19,437) |
| Total Liabilities and Capital | $15,000 | $11,858 | $8,569 | $5,733 | $3,419 | $1,798 | $908 | $970 | $2,158 | $4,697 | $7,345 | $13,457 | $21,887 |
| Net Worth | ($30,000) | ($33,164) | ($35,974) | ($38,361) | ($40,254) | ($41,513) | ($42,069) | ($41,746) | ($40,370) | ($37,730) | ($33,572) | ($27,591) | ($19,437) |

