
NovOculi
Executive Summary
This business plan has been developed to present NovOculi, Inc. to prospective investors and to assist in raising equity capital needed to begin production and to continue research and development of its patented products.
The Company
NovOculi, Inc. is a start-up company that has designed and plans to develop and market ophthalmological surgical tools and techniques. During the past two years, NovOculi’s principals have had extensive experience with refractive correction techniques (both laser and non-laser based). Building on this experience, the principals have developed and begun testing a unique method of incisionless refractive correction dubbed NICS (Non-Invasive Corneal Sculpting).
Current refractive techniques, including LASIK, PRK, and Intacs, all require destruction of at least a portion of the protective epithelial layer overlying the cornea of the eye and are accompanied by complications resulting from this loss of protection. The principals have developed a method involving iontophoresis, an ionic dye and a wavelength-specific laser to accomplish effective refraction without the troublesome destruction of epithelium.
Using NICS, NovOculi plans to take advantage of the opportunities for market development and penetration in the field of laser refraction in which demand is nearly doubling each year.
Based on the detailed financial projections prepared by the company’s management, it is estimated that equity investment is required to begin the company’s operations successfully. Funds will be used to produce, test and market NICS, as well as provide initial working capital for the first two years.
Market Potential
A massive potential market base exists for the laser refractive surgery industry. It is estimated that approximately 54% of the U.S. population (~162 million) has refractive errors, approximately 90% of which are eligible for correction using current techniques or those on the near horizon (Federal Air Surgeon’s Medical Bulletin). In contrast, only 900,000 Americans have had LASIK (the most popular laser correction technique) as of two years ago. This represents only 0.6% of the total current market, leaving the other 99.4% untapped. (“Bye-Bye Glasses,” EyeCare Business Online). Furthermore, the demand for laser refractive surgery is approximately doubling annually (“Bye-Bye Glasses,” EyeCare Business Online,).
The company has contacted nine of the leading ophthalmological medical institutions in the U.S. Seven of the nine have expressed interest in participating in collaborative research and, given encouraging research results, performing NICS commercially once it is available. Institutions expressing interest include: John Hopkins, Harvard, Stanford, Oregon Health Sciences, Duke University, and the University of California at San Francisco.
NovOculi’s principals have also conducted a preliminary market survey at a local grocery market in the Durham, NC area. Fifty consumers with refractive errors were randomly selected outside of a local grocery market and asked the questions in the survey. A copy of the survey and a summary of its findings may be found in the Market Survey topic.
Technology
The principals have developed and patented a revolutionary technique, NICS, and two novel devices which are used to accomplish incisionless refractive correction. The patented technique involves driving an ionic dye from its patented polymeric vehicle into the cornea of the patient using the patented iontophoretic device (a device that creates a charge which then repels or attracts other charges). Once the ionic dye has been effectively driven into the cornea and away from sensitive structures, a laser tuned to the wavelength of the dye is then used to target the dyed cornea and alter its shape, much as is done with current laser refraction protocols. After the procedure is completed, the iontophoretic device is reapplied, this time with opposite polarity, and the dye is drawn from the cornea due to the attraction of opposite charges. Through the use of the patented device and technique, the ophthalmologist performing the procedure will be able to avoid the most troublesome and complication-ridden aspect of current laser refraction surgery: the corneal incision. Over 90% of all complications of current laser refraction surgery are related to difficulties associated with the incision and the subsequent healing process, virtually all of which could be avoided with NovOculi’s technology.
Strategy
The key element in NovOculi’s strategy is to market its technology to both those performing the procedure as well as to those on which the procedure will be performed. Once research data and publicity have been generated, the sales force will step in to encourage the initial investment in the laser and equipment required for the procedure, creating a “demand push.” After this investment has been made, a “demand pull” will be generated for the components required for institutions to perform the procedure through marketing directly to patients.
The sales team will begin with six seasoned sales personnel and swell to forty-four members by Year 5. The sales team will work closely with laser manufacturers in order to promote the technology to patients and surgeons.
Ophthalmologist training for the NICS procedure will be available at six sites throughout the U.S.: San Francisco, Boston, Atlanta, Philadelphia, Kansas City, and Durham, NC. Each site will have in-depth training sessions led by a prominent ophthalmic surgeon.
Those performing the procedure will be able to charge a premium for providing patients with access to this superior technology. NovOculi will extract approximately half of the nearly $1,000 premium through licensing fees associated with its patented procedure and sales of the individual components.
Regulatory Issues
As with its predecessor, LASIK, the company’s product will not need to wait for FDA approval prior to widespread use. LASIK had been performed on almost 900,000 patients without approval by the FDA as of two years ago (Current Trends in Refractive Eye Surgery, 128th Annual Meeting of APHA).
This was made possible due to the fact that the “FDA does not approve procedures, only the equipment used in them” (“Eye centers set their sights on LASIK surgery growth,” Houston Business Journal, July 16) and the components of the procedure have already been approved by the FDA for medical use. NovOculi will not need to obtain approval to market their patented technique and devices due to the fact that the FDA has approved similar devices for medical use in the following arenas: 1) The 440 nm laser has been approved for dermatologic uses. 2) Iontophoretic devices has been approved for drug delivery on the epidermis. 3) Polymeric contact lenses have been approved and are commonly used as an external aid for refractive correction, and 4) The targeting dye, tartrazine, is the most ubiquitous food coloring additive on the market to date.
Major Milestones
The following are key milestones for the startup period:
- Completion of strategic business plan nine months before starting date.
- Research grants applied for by seven months before starting date.
- All patents, domestic and foreign, applied for by six months before starting date.
- Start-up capital raised by starting date.
- All other first-year milestones are currently on schedule in accordance to the business plan.
Competitive Advantage
NovOculi is uniquely positioned to take advantage of this market opportunity due to its protected, proprietary positions. Three patents have been filed in the U.S.: one for protecting the reversible iontophoretic device, the second protecting the technique involved in NICS, and the third protecting the unique vehicle for the ionic dye.

The principals, to date, have spent ample time on development and research of the current products which will satisfy the market demand for a safer, less complicated laser refraction correction technique.
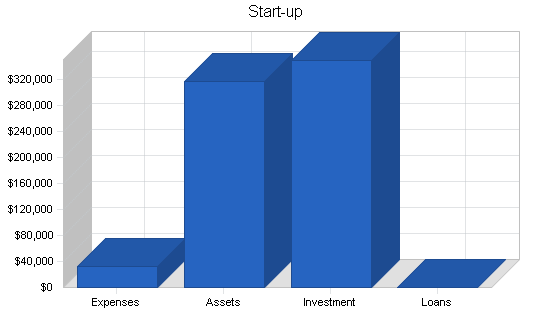
Financial Summary
Based on detailed financial projections, if the company receives its funding, it will operate profitably by Year 4 with a hefty net profit. The following chart summarizes the projected financial information.

1.1 Mission
To provide the field of ophthalmology with innovative designs which will facilitate the treatment of ophthalmologic diseases and conditions.
Company Summary
NovOculi, Inc. will research and develop biomedical devices to aid in the treatment of a variety of ophthalmologic diseases and conditions. Initially, its customers will be those individuals that desire permanent refractive correction but do not wish to risk the multitude of complications associated with the current procedure, LASIK.
The company is currently developing its patent-applied technology to final product and approval stage. It is also seeking to establish its corporate identity in the medical products field.
2.1 Company Ownership
The company will be incorporated in North Carolina. It will have authorized 15 million ordinary shares and 150,000 preferred shares. The rights and privileges of these shares will be stated in the company’s Articles of Incorporation.
The proposed share capital of the company prior to capital raising
|
Owner
|
Percentage of Shares Owned
|
|
Dr. Daniel Burnett
|
65%
|
|
Joseph Hewitt |
10% |
|
Andy Rubinson
|
10%
|
|
Joseph Walker |
10% |
|
Dr. Terry Kim
|
5%
|
The company has raised seed capital from its principals.
Additional working capital will be raised in two sections. Section 1 will be conducted in January of Year 1 and will raise money for use in accordance with the business plan. Section 2 will raise additional funds in Year 3 of the business plan, but will be conducted only if sufficient research grants are not obtained in Year 2. It is deemed likely by the company’s industry consultants that the research grants will be obtained and, therefore, section 2 will not be necessary.
2.2 Start-up Summary
The key elements in the start-up plan for the company are:
- Formulation of the strategic business plan.
- The establishment of a corporate identity.
- The establishment of a location and place of doing business.
- Funding of working capital requirements, purchases of other equipment and assets deemed necessary for the principle operating activities of the company, and additional capital raising alternatives.
- Initiation of Research and Development of existing and future products.
Costs of raising capital through private placement.
Startup seed funding was raised from the founders of the company for these purposes. This funding will be available in late 2001 and these tasks have either been completed successfully or are in the final process of completion.
These are treated purely as start-up expenses and initial working capital by this plan. The founders’ investment is treated as cash-on-hand as of the start of this plan on January 1, 2002. The remainder of the start-up capital required, as well as capital required, for the continuation of operations in the first six months will be provided by selling shares via a private placement to key investors. The capital obtained through this fund-raising exercise is expected to provide an additional boost and the business plan calls for these funds to be infused for the purposes of operating the business, in accordance with this business plan.
| Start-up | |
| Requirements | |
| Start-up Expenses | |
| Legal | $5,000 |
| Stationery etc. | $1,000 |
| Consultants | $5,000 |
| Insurance | $2,000 |
| Rent | $5,000 |
| Expensed equipment | $15,000 |
| Other | $0 |
| Total Start-up Expenses | $33,000 |
| Start-up Assets | |
| Cash Required | $317,000 |
| Start-up Inventory | $0 |
| Other Current Assets | $0 |
| Long-term Assets | $0 |
| Total Assets | $317,000 |
| Total Requirements | $350,000 |
| Start-up Funding | |
| Start-up Expenses to Fund | $33,000 |
| Start-up Assets to Fund | $317,000 |
| Total Funding Required | $350,000 |
| Assets | |
| Non-cash Assets from Start-up | $0 |
| Cash Requirements from Start-up | $317,000 |
| Additional Cash Raised | $0 |
| Cash Balance on Starting Date | $317,000 |
| Total Assets | $317,000 |
| Liabilities and Capital | |
| Liabilities | |
| Current Borrowing | $0 |
| Long-term Liabilities | $0 |
| Accounts Payable (Outstanding Bills) | $0 |
| Other Current Liabilities (interest-free) | $0 |
| Total Liabilities | $0 |
| Capital | |
| Planned Investment | |
| Dr. Daniel Burnett | $130,000 |
| Joseph Hewitt | $70,000 |
| Dr. Terry Kim | $70,000 |
| Andy Rubinson | $40,000 |
| Joseph Walker | $40,000 |
| Additional Investment Requirement | $0 |
| Total Planned Investment | $350,000 |
| Loss at Start-up (Start-up Expenses) | ($33,000) |
| Total Capital | $317,000 |
| Total Capital and Liabilities | $317,000 |
| Total Funding | $350,000 |
2.3 Company Locations and Facilities
The company will initially be based in the Research Triangle Park area in North Carolina. The website (www.NovOculi.com) has already been registered, and the trademark process has been initiated.
In view of the strategic plan to contract with a third party for all manufacturing requirements, the facilities needed will be mainly offices for personnel and storage space for inventory. After Year 5, when the market for our products reaches our anticipated milestone, the company will explore the feasibility of constructing its own manufacturing facilities.
Ophthalmologist training for the NICS procedure will be available at six collaborative research centers in the following cities: San Francisco, Boston, Atlanta, Philadelphia, Kansas City and Durham, NC. Each site will be coordinated by, but financially independent of, NovOculi and will have in-depth training sessions led by a prominent ophthalmic surgeon.
Initial research and development (R&D) will be accomplished through a collaborative effort with the Stanford University Department of Ophthalmology, who provides NovOculi’s initial research facilities.
Products
NovOculi’s technology is an improvement on the common laser refractive surgery procedure LASIK. In order to fully explain NovOculi’s technology, it is first necessary to develop an understanding of its predecessors in the laser refractive surgery industry. After this has been accomplished, NovOculi’s technology will be described, competing technologies will be analyzed, sourcing issues will be addressed and, finally, future products will be discussed.
Background
Refractive correction, in all forms, is accomplished through alteration of the contours of the cornea. This alteration is accomplished by destroying either the stroma (middle layer of the cornea) or the epithelium (outer, protective layer of the cornea) of the cornea, and in some cases, both.
Early procedures, such as PRK, used lasers to change the contour of the cornea by destroying both the epithelium and the stroma through simply blasting the cornea straight on without any preparation. This procedure was difficult for patients as the healing took weeks and the destruction of the epithelium left the eye permanently susceptible to infections and ulcers.
LASIK was an improvement over PRK due to the fact that most of the protective layer of epithelium was folded back, and only the stroma of the cornea was destroyed. In order to fold the epithelium back, though, a large, circular incision in the cornea was necessary. While LASIK was an advance in technology in that the epithelium was not destroyed, the incision itself was found to cause multiple problems such as night blindness, loss of sight, permanent sensation of irritation, etc.
3.1 Product Description
In an effort to avoid the complications associated with corneal incision and epithelial destruction utilized in laser refractive surgery procedures, NovOculi’s principals designed NICS (Non-Invasive Corneal Sculpting). NICS allows for effective laser refractive correction without the troublesome corneal incision. The subject matter of NovOculi’s technology is currently protected by Provisional Patent No. 60/243,031.
NovOculi’s technology involves using an ionically charged, contact lens-shaped plate to drive an ionically charged dye into the cornea without making an incision. This use of a charge to attract or repel another charge is termed iontophoresis, and since the charge on NovOculi’s plate can be reversed, to either attract or repel the dye, this component of NICS is referred to as the reversible polarity iontophoretic device (RPID). By exposing a charged dye to the RPID which has been set to the same polarity, the dye will effectively be driven through the relatively resistant corneal epithelium and stroma via the repulsion of similar charges. Without this electrostatic repulsion, it would take hours to allow the cornea to soak up the dye, making the procedure difficult, if not impossible.
The ionic dye used in NICS is tartrazine, a common food coloring additive. Tartrazine is a small, stable, yellow dye which absorbs visible light at 440 nanometer (nm) and is positively charged. In order to make sure that the tartrazine is delivered only to the cornea, NovOculi has developed a unique contact lens impregnated with tartrazine which incorporates a barrier to lateral diffusion. This barrier prevents the remainder of the eye from being exposed to the tartrazine and allows for more precise dye delivery.
By controlling the duration of the iontophoresis, during which the RPID will be positively charged to repel the tartrazine, the dye is selectively placed in the middle of the cornea, away from the sensitive epithelial and endothelial layers. Once this has been accomplished, the middle layer of the cornea can be selectively targeted by a 440 nm wavelength laser without ever having to destroy any portion of the protective epithelium.
After the cornea has been sculpted with the laser, the RPID is then reapplied with reversed polarity and the dye is extracted from the cornea, leaving a clear, sculpted cornea.
In summary, NICS is performed as follows:
- Drops are applied to the epithelium of the cornea to decrease sensation and increase dye permeability.
- A contact lens of varying polymeric density and charged with ionic dye, tartrazine, is placed on the epithelium of the cornea of the eye to be corrected, then the RPID (charge-inducing plate) in the shape of a contact lens is placed over the dye.
- The RPID is activated with a charge similar to the dye, thereby forcing the dye into the eye.
- The cornea is washed free of the dye and the iontophoretic plate is reapplied to drive the dye beyond the epithelial layer of the cornea, but above the endothelial layer.
- Once the dye is selectively located in the stromal layer of the cornea, a laser tuned to the wavelength of the dye, 440 nm, is used to sculpt the cornea using the standard laser refractive surgery protocol.
- The reversible iontophoretic device is then reapplied with its charge reversed in order to draw the dye out of the cornea due to their now opposite charges attracting.
- The eye heals and the stroma resorbs over the course of one to two weeks during which sight improves to 20/20 (or better!).
NovOculi’s novel technology is found in 1) The overall method of selectively ablating stromal corneal cells, 2) The Reversible Polarity Iontophoretic Device, and 3) The dye-impregnated polymeric contact lens, all of which are currently intellectual property of Daniel R. Burnett, one of the principals.
While NovOculi’s technology is novel, the principles on which it is founded are well established. The targeted destruction of certain cells through delivery, then stimulation, of a photoactive substance has been accomplished elsewhere in the human body in the treatment of cancer and has been termed Photodynamic Therapy (“Targeted intracellular delivery of photosensitizers to enhance photodynamic efficiency,” Immunology & Cell Biology, August 2000). Also, the delivery of ionic substances into the eye has been successfully accomplished in studies attempting to increase the ocular delivery of dilating drops and antibiotics (“The role of iontophoresis in ocular drug delivery,” Journal of Ocular Pharmacology, Spring 1994). Thus, the principles on which NovOculi’s technology rests have been proven in related studies, yet never applied in the laser refractive surgery until now, with the development of NovOculi’s patented method and devices.
3.2 Sourcing
Most of the components involved in NovOculi’s method of corneal sculpting are relatively inexpensive and common. The iontophoretic plate, for example, is constructed of standard electronic components and its power source can be either an outlet or a common battery. Tartrazine, the ionic dye, is the most common food coloring additive used in the United States, making this component ubiquitous.
The one component which will be more expensive and difficult to obtain will be the refractive laser tuned to the wavelength of the ionic dye. Partnership with a laser manufacturer would be beneficial in facilitating the development of this laser and well-received efforts have been made to form this relationship.
3.3 Future Products
Future products of NovOculi, Inc. will be medical devices in the field of ophthalmology. Two of the principals, Dr. Daniel Burnett and Dr. Terry Kim, as well as one of the consultants, Dr. Mark Blumenkranz, are intimately involved in the field of ophthalmology and have experience in the R&D of biomedical devices.
In order to capitalize on NovOculi’s core competency in ophthalmic devices, the company will focus its efforts in this arena. One example of a device currently in the R&D pipeline is a contact lens formed from a calcium alginate polymer impregnated with one of a variety of ophthalmically active drugs. Use of this slow-release, once-a-day therapy will allow many patients to be treated much more effectively and more conveniently than the current therapy which requires repetitive application of eye drops, sometimes as often as once an hour.
Market Analysis Summary
The market for NovOculi’s products currently consists of patients with refractive errors who desire to have sharper vision without external aids. Essentially, the potential market is the nearly identical to the potential market for LASIK, the current laser refractive surgery procedure. The markets are not exactly identical, though, as we expect there to be greater acceptance of a non-invasive refractive protocol versus the complication-ridden LASIK.
A massive potential market base exists for the laser refractive surgery industry. It is estimated that approximately 54% of the U.S. population (~162 million) has refractive errors, approximately 90% of which are eligible for correction using current techniques or those on the near horizon (Federal Air Surgeon’s Medical Bulletin, Winter 1998). Furthermore, the demand for laser refractive surgery is approximately doubling annually.
The company has contacted 9 of the leading ophthalmological medical institutions in the U.S., 7 of which have expressed interest in participating in collaborative research and, given encouraging research results, performing NICS once it is available. Institutions expressing interest include: John Hopkins, Harvard, Stanford, Oregon Health Sciences, Duke University, as well as the University of California at San Francisco.
Furthermore, NovOculi has conducted a preliminary market survey at a local grocery market in the Durham, NC area. Fifty patients chosen at random outside of the grocery market, all with refractive errors, completed the survey, a copy of which may be found in the Market Survey topic. The following sections refer to this market study in further expounding on the tremendous market potential for NovOculi.
4.1 Market Survey
The following survey was given to 107 consumers at a local grocery store in Durham, N.C. on January 12th and 13th:
SURVEY:
- Do you now have, or have you ever had, a refractive error (Vision that is worse than 20/20).
- Have you considered, or would you ever consider, permanent correction of your vision.
- If so, would you be willing to pay more money for the surgery in order to decrease the rate of significant complications (pain, night blindness, etc.) by 50%?
- If so, how much would you pay?
A) less than $500
B) $500-1,000
C) $1,000-2,000
D) more than $2000
RESULTS:
Once 50 participants answered “Yes” to questions number 1 and 2, the survey was terminated and the following results compiled:
| Surveyed | Refractive Error | Consider Surgery | Pay Premium |
| 107 | 72 | 50 | 46 |
Of those that would pay the premium in order to decrease the rate of complications, the following distribution was found:
| Less than $500 | $500-$1,000 | $1,000-$2,000 | more than $2,000 | Total |
| 10 | 19 | 7 | 10 | 46 |
The data clearly indicate that, of those consumers in this sample population with refractive errors who would consider surgery for permanent correction, an overwhelming majority would pay a premium for a decreased risk of significant complications. Of the premiums that would be paid, the most common value was $500-$1,000 with a mean dollar value of approximately $1,100 (using midpoints and assuming midpoint for more than $2,000 is $2,500).
4.2 Target Market Segment Strategy
NovOculi will focus its marketing strategies on building market share among the outcome-conscious refractive surgery patients. For this customer segment, NovOculi will offer a branded technology which will help the patient to gain increased visual acuity with less of a risk of complications. The market research shows that this customer segment is less price sensitive and will absorb price premiums charged by ophthalmologists that use the NovOculi technology.
4.2.1 Market Needs
The market needs of the target segment are straightforward – clients want to permanently improve their vision using a process with the lowest possible risk of complications. Good vision is of paramount importance for such patients as it allows them not only to be independent of visual aids but also to become healthier in general. There will be no need to buy new frames or to rinse contacts, and such patients will literary open up their eyes to the world.
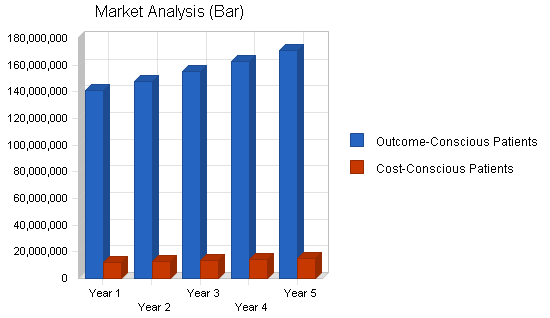
4.3 Market Segmentation
Patients desiring permanent refractive correction typically fall into two different groups with respect to their predominant concerns related to the procedure: Outcome-Conscious Patients and Cost-Conscious Patients. Outcome-Conscious Patients constitute the bulk of the refractive surgery market (46 out of 50 surveyed), and were willing to pay a premium in order to achieve a significant decrease in the rate of complications (defined as 50% less) with the procedure. The Cost-Conscious Patients typically felt that the decrease in rate of complications was not worth the extra expenditure.
Outcome-Conscious Patients
The bulk of the population, these patients seek out the highest quality procedure with the most skilled surgeon, typically regardless of price. Most patients realize the importance of their vision and will not take chances with respect to their sight. This group will be the primary target for NovOculi as they will tolerate NovOculi’s charging a premium for its superior procedure.
Cost-Conscious Patients
The small minority of the refractive error patient population, these patients will often fly to Canada or Mexico in order to capitalize on the large price differential with respect to the laser vision correction procedure between these countries and the United States. These patients will not be targeted by NovOculi initially as they are less interested in the superiority of technology and the skill of the surgeon as they are in the cost of the procedure.

| Market Analysis | |||||||
| Year 1 | Year 2 | Year 3 | Year 4 | Year 5 | |||
| Potential Customers | Growth | CAGR | |||||
| Outcome-Conscious Patients | 5% | 140,793,120 | 147,832,776 | 155,224,415 | 162,985,636 | 171,134,918 | 5.00% |
| Cost-Conscious Patients | 5% | 12,242,880 | 12,855,024 | 13,497,775 | 14,172,664 | 14,881,297 | 5.00% |
| Total | 5.00% | 153,036,000 | 160,687,800 | 168,722,190 | 177,158,300 | 186,016,215 | 5.00% |
4.4 Industry Analysis
Currently the industry is experiencing rapidly increasing competition in the form of price wars. The average consumer now pays approximately $1,650 per eye for LASIK, as opposed to greater than $2,500 per eye less than two years ago (“Laser Eye Centers Wage an All-Out Price War,” New York Times, December 9, 2000). With this price crunch, the valuation of existing companies has plummeted despite their continued growth in earnings.
Insurance companies are beginning to experiment with reimbursement for LASIK as well. Currently, though, the only insurance companies that pay for LASIK at all do so with a subsidy, which is a small discount to keep patients within their health system.
NovOculi will be affected by the current industry trends, but to a much lesser degree than LASIK providers. Due to the superiority of NovOculi’s technology over LASIK, NovOculi will be able to charge a premium. Also, due to its proprietary position, NovOculi is in a position to prevent the commoditization of NICS and thereby sustain economic profits for the duration of NovOculi’s patent.
4.4.1 Industry Participants
Currently, the major industry participants listed in “Laser Eye Centers Wage an All-Out Price War,” New York Times, from December 9, 2000 are as follows:
- Hospitals- 10%
- Corporate Chains- 48%
- Independent Ophthalmologists- 42%
The major corporate chain participants will be outlined in detail in the next section, Competition.
4.4.2 Distribution Patterns
Currently, the distribution pattern for the industry involves high-end sales with excellent manufacturer support. The lasers cost millions of dollars and are large investments for the purchasing institutions. No distributor is necessary for these lasers as the internal sales staff and distribution mechanisms suffice.
The microkeratomes involved in LASIK are also sold directly from the manufacturer to the LASIK provider. With the microkeratomes, though, the small, tightly knit medical device distribution channels are beginning to play a role. For NovOculi, these medical device distributors will play a key role due to the fact that components of the NovOculi procedure are single-use and will require frequent purchasing and delivery.
4.4.3 Competition and Buying Patterns
As was alluded to in the previous section, the current buying patterns for the LASIK procedure involve substantial, infrequent purchases with excellent manufacturer support. The only significant purchases necessary in order to perform LASIK are the laser and the microkeratome, both of which are long-term, multiple-use devices. This buying pattern is related to the fact that none of the components of the LASIK procedure are single-use. These buying patterns are expected to change once NovOculi begins to capture market share and the need for replenishment of its single-use, dye-impregnated contact lens increases. NovOculi will need to develop strategic relationships with existing distributors in order to take advantage of their well-established distribution infrastructure.
Competition
Competition in the field of refractive correction, both permanent and temporary, has been escalating. Not only are glasses, contact lenses, PRK, LASIK, Intacs, and others competing with each other, but competitive forces within these arenas is becoming fierce as well. LASIK providers, for example, are experiencing vicious price wars which are cutting deeply into profit margins.
NovOculi will rely on the superiority of its technology in order to thrive in this competitive market. NovOculi’s is still the only technology in the field of refractive surgery which provides permanent refractive correction without making any complication-ridden incisions into the cornea. This competitive advantage will help NovOculi navigate these competitive waters and capture a large portion of the refractive surgery market.
5.1 Competitive Technology
Competition in the refractive surgery arena is expected from three main sources: external aids, existing laser refractive surgery, and alternative non-laser surgical procedures.
External Aids
Contact lenses and glasses have been around for decades. The fact that LASIK has become so wildly popular, with demand doubling annually despite its complications, displays the fact that many patients who were once content with external aids now desire permanent refractive correction.
Existing Laser Refractive Surgery
It is expected that the largest source of competition will be from the LASIK industry. Much like LASIK has ousted the previously accepted procedure of PRK, NovOculi hopes to supplant LASIK with NICS. The competition NovOculi’s technology faces is significant as many institutions have already purchased the excimer lasers required for LASIK, a hefty investment which will create lock-in to the LASIK procedure. Once the details of the superiority of NovOculi’s procedure surface, laser refractive surgery centers will be pressured to invest in NICS by both ophthalmologists performing the procedure and patients desiring refractive surgery.
Another competing technology worth mention is the newly-developed technique employing femtolasers. This technology also hoped to correct refractive errors without an epithelial incision by using multiple lasers focused on a single position at which their destructive effects would be additive. Recent studies have found multiple, unavoidable technical complications, including formation of gas, debris, and cauterized tissue at the site of cellular destruction. It is highly unlikely that this technology will be able to overcome these hurdles and accomplish incisionless refraction without the use of some form of dye or chemical to target the selected tissues, a method which is the currently intellectual property of NovOculi.
Alternative Non-laser Surgical Procedures
In the U.S., the most popular, non-laser surgical technique in the industry is Intacs. Intacs are implanted into the stroma of the cornea where they bend the overall curvature to the desired angle so that the refractive error is corrected indefinitely, but reversibly.This procedure, as well as fully implantable contact lenses, have the added benefit of being reversible, but the disadvantage of still requiring a significant incision in the cornea with disruption of the stroma. Also, the procedure can only be performed on those with mild near-sightedness, approximately 20% of the existing market. Despite these disadvantages, these alternatives are gaining a niche in the market and will be a source of competition.
5.2 Competitive Comparison
Technology-wise, NICS has significant advantages over existing technologies. As was explained previously, current procedures all require destruction of a portion of the epithelium of the cornea. This destruction places the eye in danger of multiple complications, the overall rate of which is approximately 10%. The following are the most common complications associated with the epithelial incision in LASIK.
Common– (greater than 5% of the patient population)
- Pain (possibly chronic)
- Photophobia
- Induced Irregular Astigmatism (corneal flap wrinkling)
- Corneal Scarring (associated with continued glare and haloes and permanent loss of night vision
- Epithelial Ingrowth (extension of scarring in cornea)
- Damage to Iris
- Tearing/Excess Mucous- Dry Eye
- Corneal Edema
- Headaches
Less Common– (less than 5% of the patient population)
- Corneal Epithelial Flap Dislocation
- Corneal Rupture
- Complete Blindness
Virtually all of these complications are associated with the corneal epithelial incision and its subsequent post-operative healing. Due to this fact, the bulk of these complications could be effectively avoided through the use of NICS.
5.3 Main Competitors
NovOculi’s competitors can be divided into two categories: those competing within the field of laser refractive surgery and those with alternate refractive correction technology.
Laser Refractive Surgery Competitors
Competition will arise from both LASIK laser manufacturers and LASIK providers. Among these competitors, though, lies the possibility for the formation of strong, strategic alliances in both arenas.
LASIK Laser Manufacturers
The largest of the LASIK laser manufacturers is VISX (EYE). Down from its peak valuation of $100/share in July of 1999, VISX now trades at $13, with a market cap of $800 million and a price/earnings (p/e) ratio of 23. VISX is a good candidate for a potential ally in the development of a laser for NICS.
LASIK Providers
One of the largest commercial chains providing LASIK is TLC Laser Eye Centers (TLCV). Since its peak of $50 a share in July 1999, TLC has also experienced large devaluations associated with the increasingly competitive price wars in the LASIK industry. Due to these price cuts, TLC has experienced a negative 100% income growth. The fact that TLC has rapidly eroding margins associated with massive devaluations makes TLC an ideal target for a strategic alliance as well so that they may once again reap the rewards of a large sustainable profit margin. Currently, the stock trades at approximately $4, with a market cap of $129 million.
Non-Laser Refractive Correction Competitors
The greatest competition in this field is expected to arise from Intacs, the reversible corneal implants for refractive correction from KeraVision, Inc (KERA). Founded in 1986, KeraVision received 510K approval for its instruments in mid-1999. After meeting this milestone, KeraVision’s stock peaked at nearly $30 in July of 1999. Subsequently, as demand for laser refractive correction rose, KeraVision’s stock plummeted despite positive research results in human trials.
Currently with a stock price of $0.47, KeraVision’s most recent return on equity of -97.50% is below its five-year average of -60.90%, which is also below the five-year industry average of 11.50%. Also, NASDAQ has threatened to delist the company and proceedings are underway. It is the opinion of experts in the biotechnology industry that KeraVision will not be able to weather its current financial hardships and will soon file for bankruptcy.
5.4 Impact of Competition
NovOculi’s competition will have both a negative and a positive impact on the company’s success.
Negative Impact
The competing technologies outlined in section 5.1 all hold a significant portion of the current refractive correction market. Furthermore, especially with LASIK, the institutions performing these procedures have invested large sums in order to acquire the technology in order to perform these procedures. This is expected to create an element of lock-in in which many institutions performing LASIK will be reluctant to switch to NICS. For this reason, it is imperative that NovOculi accelerate its bench research and market entry of NICS as much as possible.
Also, competitors in this field have been engaging in a vicious price war. While NovOculi expects to be able to charge a premium, this premium is still based on the existing laser surgery price as a foundation. Further erosion of prices will have a negative impact on NovOculi as well.
Positive Impact
With the acceptance of each of these technologies, the potential diffusion rate of NICS grows. Competitors have already invested millions of dollars in convincing patients that they need refractive surgery, and further convincing many to have the procedure performed. As with any new technology, the acceptance of the pioneer is always slower than modifications of the pioneering technology. Therefore, market acceptance of NICS will be speeded by existing technology.
5.5 Competitive Edge
As was mentioned previously, NovOculi’s system of refractive correction has significant advantages over existing technologies. Current procedures all require destruction of a portion of the epithelium of the cornea which places the eye in danger of multiple complications, the overall rate of which is approximately 10%. NovOculi’s technology obviates the need for such an incision and will make the procedure safer and more attractive to patients with refractive errors.
NovOculi’s competitive advantage arises from its proprietary position with a patent on the reversible iontophoretic plate for delivery of the dye to the cornea, the method of sculpting the cornea using a targeting chemical and an energy source which will selectively stimulate the chemical, and the varying density polymeric contact lens impregnated with an ionic dye.
Strategy and Implementation Summary
The key element in NovOculi’s strategy is to market its technology to both those performing the procedure as well as to those on which the procedure will be performed. Once research data and publicity have been generated, the sales force will step in to encourage the initial investment in the laser required for the procedure, creating a “demand push.” After this investment has been made, a “demand pull” will be generated for the components required for institutions to perform the procedure.
Ophthalmologist training for the NICS procedure will be available at six sites throughout the U.S.: San Francisco, Boston, Atlanta, Philadelphia, Kansas City and Durham, NC. Each site will have in-depth training sessions led by a prominent ophthalmic surgeon.
The sales team will begin with six seasoned sales personnel and swell to forty-four members by Year 5. The sales team will work closely with laser manufacturers in order to promote the technology to patients and surgeons.
Those performing the procedure will be able to charge a premium for providing patients with access to this superior technology. NovOculi will extract approximately half of the nearly $1,000 premium through licensing fees associated with its patented procedure and sales of the individual components.
6.1 Value Proposition
The true value proposition for NovOculi’s technology lies with the patient. The patient stands to gain permanently increased visual acuity with a greatly decreased risk of complications. As vision is of paramount importance for the general patient population, they will be willing to pay a hefty premium in order to access the superior technology.
The value proposition for institutions and ophthalmologists to adopt the technology is two-fold: 1) Economic profit will be able to be sustained as NovOculi intends to charge approximately 50% of the total price increase associated with NovOculi’s procedure, and 2) Use of this procedure will constitute superior patient care for those providers to whom this matters.
6.2 Marketing Strategy
Promotion of NovOculi’s technology will involve targeting two different populations: 1) Ophthalmologists Performing Laser Refractive Surgery and 2) Patients with Refractive Errors. NovOculi’s success is dependent upon acceptance of its technology by both groups and its promotional strategies will be reflective of this fact. Of course, acceptance by either group will be helpful in obtaining acceptance by the other.
6.2.1 Promotion Strategy
NovOculi’s technology will be marketed using different tactics to target its two different target populations: 1) Ophthalmologists Performing Laser Refractive Surgery and 2) Patients with Refractive Errors.
Ophthalmologists Performing Laser Refractive Surgery
Acceptance amongst the nearly 3,400, and growing, ophthalmologists who perform refractive surgery will be one of the keys to NovOculi’s success. Even with strong patient demand, if the ophthalmologists are not willing to perform the procedure, then the market will remain untapped. Furthermore, ophthalmologists frequently have a privileged position in consulting patients concerning procedures and those that have embraced NovOculi’s technology will be powerful advocates.
In marketing the procedure to ophthalmologists, the main consideration will be the effectiveness of the procedure and its superiority over existing technology. The most important factor in promoting NovOculi’s technology will be concrete research results displaying its superiority over existing technologies. Once these studies have been completed, three main channels will need to be utilized to target ophthalmologists: 1) Publication in highly visible and reputable medical journals, 2) Advertising in these same medical journals, and 3) Presentations at national conventions. Using these channels, along with the free publicity associated with the introduction of a novel, superior technology, ophthalmologists performing refractive procedures will be effectively targeted and a demand “push” will be generated for patients to choose NovOculi’s procedure over existing options.
Patients with Refractive Errors
As with the ophthalmologist population, the most important factor in promoting NovOculi’s technology to the patient population will be concrete research results displaying its superiority over existing technologies. Once this has been established, NovOculi will embark on a large-scale, national advertising campaign focusing on television and printed media. Using these channels, along with as much free press as possible, NovOculi will be able to create a demand “pull” for its technology to complement the demand “push” which will arise from acceptance amongst ophthalmologists.
6.2.2 Pricing Strategy
As was mentioned in the topic on Market Segmentation, NovOculi will target the Outcome-Conscious Patient population and will not concern itself with the Cost-Conscious Patient population. In analyzing the results of the market survey, it was found that the Outcome-Conscious Patient population constituted 90% of the market. Also, this patient population was found to be much more price inelastic, willing, on average, to pay $500-$1,000 more for a procedure with significantly less complications.
NovOculi intends to charge a total of $200 per eye licensing fee for use of NovOculi’s patented procedure, then another $40 for each dye impregnated lens. Not including the reversible inotophoretic plate, NovOculi will charge approximately $480 per patient, assuming that both eyes will be corrected. Assuming that the ophthalmologists will be able to charge $1,000 more than the average current charge for LASIK, as was indicated in the survey results, this will leave over $500 per patient as the incentive for the ophthalmologists and institutions to make the investment and adopt NovOculi’s technology.
Considering that the average price for the LASIK procedure is currently $3,300 for both eyes (“Laser Eye Centers Wage an All-Out Price War,” New York Times, December 9, 2000), the price for NovOculi’s procedure is expected to be approximately $4,300 for both eyes. This is still well under the upper end of current prices for LASIK surgery which totals $6,000 for both eyes (“Laser Eye Centers Wage an All-Out Price War,” New York Times, December 9, 2000). Institutions using NovOculi’s technology will be able to charge this amount, even in the current increasingly price-competitive environment, due to the superiority of NovOculi’s technology.
The iontophoretic device will be a high margin, low volume item as this component of NICS will not need to be purchased with each additional procedure. Due to this fact, the iontophoretic device will be priced at $3,500.
6.3 Sales Strategy
NovOculi’s sales strategy will tie in with the sales strategy of the laser manufacturer. The key step in sales will be to initiate the investment in NovOculi’s technology by purchasing the laser to be used in the procedure. As with LASIK, the laser is a major investment, and the combined efforts of both NovOculi’s and the laser manufacturer’s sales forces will be required to encourage the initial investment. Once this investment has been made, the sales effort required from NovOculi will be decreased as the institutions performing the procedures will require the additional components sold by NovOculi in order to perform the refractive surgery. Therefore, the sales force will be relied on heavily for the initial demand push for the laser, then to a much lesser extent for the additional components for the procedure.
NovOculi’s sales force will initially consist of 6 sales personnel in Year 2. This number is expected to swell to 44 by Year 5 with expected dramatic increases in sales.
6.3.1 Sales Forecast
NovOculi’s technology is an improvement over LASIK, much the same as LASIK was an improvement over PRK. In fact, a poll of 10 Duke University and Stanford University ophthalmologists revealed that, on average, they felt that NovOculi’s technology was an improvement over LASIK of the same magnitude and caliber as LASIK was over PRK. Using this fact along with historical LASIK diffusion data (“Expanding the Horizons of Surgical Correction,” Review of Optometry, May, 1998) and the assumption that the diffusion constants will be similar between the two technologies, the following sales forecasts were compiled.
These forecasts do not take into account the fact that the market has become more receptive to ophthalmic laser surgery with the successes of LASIK and PRK and that the diffusion rate would probably be accelerated due to this increased acceptance of precedent technologies.
In developing the Sales Forecasts, it was modestly assumed that only 1/3 of all patients will require refractive correction bilaterally (both eyes). Current available data indicate that the actual fraction of patients requiring bilateral correction is closer to 2/3.

| Sales Forecast | |||||
| Year 1 | Year 2 | Year 3 | Year 4 | Year 5 | |
| Unit Sales | |||||
| Iontophoretic Device | 0 | 7 | 21 | 80 | 533 |
| Licensing Fees | 0 | 2,000 | 7,000 | 30,000 | 200,000 |
| Polymeric Vehicle | 0 | 3,000 | 9,000 | 36,000 | 240,000 |
| Other | 0 | 0 | 0 | 0 | 0 |
| Total Unit Sales | 0 | 5,007 | 16,021 | 66,080 | 440,533 |
| Unit Prices | Year 1 | Year 2 | Year 3 | Year 4 | Year 5 |
| Iontophoretic Device | $0.00 | $3,500.00 | $3,675.00 | $3,858.75 | $4,051.69 |
| Licensing Fees | $0.00 | $200.00 | $206.00 | $212.18 | $218.55 |
| Polymeric Vehicle | $0.00 | $40.00 | $42.00 | $44.10 | $46.31 |
| Other | $0.00 | $0.00 | $0.00 | $0.00 | $0.00 |
| Sales | |||||
| Iontophoretic Device | $0 | $24,500 | $77,175 | $308,700 | $2,159,549 |
| Licensing Fees | $0 | $400,000 | $1,442,000 | $6,365,400 | $43,709,080 |
| Polymeric Vehicle | $0 | $120,000 | $378,000 | $1,587,600 | $11,113,200 |
| Other | $0 | $0 | $0 | $0 | $0 |
| Total Sales | $0 | $544,500 | $1,897,175 | $8,261,700 | $56,981,829 |
| Direct Unit Costs | Year 1 | Year 2 | Year 3 | Year 4 | Year 5 |
| Iontophoretic Device | $0.00 | $150.00 | $142.50 | $135.38 | $128.61 |
| Licensing Fees | $0.00 | $10.00 | $5.00 | $4.75 | $4.51 |
| Polymeric Vehicle | $0.00 | $5.50 | $5.23 | $4.96 | $4.72 |
| Other | $0.00 | $0.00 | $0.00 | $0.00 | $0.00 |
| Direct Cost of Sales | |||||
| Iontophoretic Device | $0 | $1,050 | $2,993 | $10,830 | $68,547 |
| Licensing Fees | $0 | $20,000 | $35,000 | $142,500 | $902,500 |
| Polymeric Vehicle | $0 | $16,500 | $47,025 | $178,695 | $1,131,735 |
| Other | $0 | $0 | $0 | $0 | $0 |
| Subtotal Direct Cost of Sales | $0 | $37,550 | $85,018 | $332,025 | $2,102,782 |
6.4 Strategic Alliances
NovOculi will initially try to encourage strategic alliances in three different arenas: laser manufacturers, refractive surgery providers, and research institutions.
Laser Manufacturers
As NovOculi will provide all the components necessary to perform its patented procedure except for the laser, developing a strategic alliance with a laser manufacturer will be an important step. Existing laser manufacturers, including VISX and Alcon, are currently being approached as a prelude to this partnership.
Refractive Surgery Providers
Possibilities for strategic alliances abound in the current refractive surgery industry. Due to the increasingly fierce competition, LASIK providers are expected to be very receptive to a strategic alliance that would allow them access to a proprietary technology with which they could charge a sustainable premium. As was noted in section 4.2.1, 48% of all LASIK surgery is being done by corporate chains. A large corporate chain would be an ideal initial strategic alliance as it would provide excellent exposure and access to its well-established patient base and distribution networks.
Research Institutions
As the bulk of research on the procedure has already been arranged to be done in collaboration with Stanford University, this strategic alliance is already well-formed. NovOculi is open to further collaboration as well, and expects to utilize five additional institutions as NICS training sites, including research institutions in: Boston, Atlanta, Philadelphia, Kansas City, and Durham, NC.
6.5 Milestones
The following are the key milestones for the first year of operations:
- Completion of strategic business plan by March 1, 2001.
- Research Grants will be applied for by May 1, 2001.
- All patents, domestic and foreign, will be applied for by July 1, 2001.
- Animal trials initiated by October 1, 2001.
- Start-up capital will be raised by January 1, 2002.
- All other first year milestones are currently on schedule in accordance to the business plan.

| Milestones | |||||
| Milestone | Start Date | End Date | Budget | Manager | Department |
| Business Plan | 10/5/2000 | 3/1/2001 | $3,000 | Burnett | G & A |
| Patent Applications | 11/1/2000 | 7/1/2001 | $25,000 | ABC | Legal |
| Corporate Identity | 1/1/2001 | 1/31/2001 | $2,250 | Burnett | G & A |
| Supplier Selection | 3/1/2001 | 4/1/2001 | $10,000 | ABC | Marketing |
| CEO Hire | 9/1/2001 | 10/1/2001 | $25,000 | ABC | G & A |
| Information Systems Established | 4/1/2001 | 5/1/2001 | $65,000 | ABC | Marketing |
| Research Grant Application | 5/1/2001 | 6/1/2001 | $5,000 | Burnett | R&D |
| R & D- Animal Stage | 10/1/2001 | 6/1/2002 | $250,000 | Burnett | R&D |
| R & D- Human Stage | 3/1/2002 | 3/1/2003 | $1,000,000 | Burnett | R&D |
| National Sales Launch | 3/1/2003 | 9/1/2003 | $100,000 | ABC | Department |
| National Marketing Plan | 3/1/2003 | 9/1/2003 | $250,000 | ABC | Department |
| Investment- Tranche 1 | 1/1/2002 | 5/1/2002 | $0 | ABC | Department |
| Research Grant Received | 1/1/2003 | 12/1/2003 | $0 | Burnett | R&D |
| Investment- Tranche 2 (If No Grant) | 1/1/2004 | 5/1/2004 | $0 | ABC | Department |
| Totals | $1,735,250 | ||||
Regulatory Issues
Since the “FDA does not approve procedures, only the equipment used in them” (“Eye centers set their sights on LASIK surgery growth,” Houston Business Journal, July 16, 1999) and the components of the procedure have already been approved for FDA use, NovOculi’s products will be ready for the market as soon as medical research shows favorable results. The FDA has already approved the use of the 440 nm laser in the medical arena for dermatologic uses, and NovOculi will not need to obtain approval to use this device in the sculpting of the cornea. Similarly, iontophoretic devices, polymeric contact lenses and the targeting dye, tartrazine, have been approved by the FDA for human use and will require no additional approval at this juncture.
An example of such expedited market entrance can be seen with the laser vision correction procedure LASIK. Prior to its approval by the FDA in Winter of 1999, LASIK had been performed on 900,000 patients due to the fact that the laser used for LASIK, the excimer laser, had already been approved for medical use in PRK. (“Bye-Bye Glasses,” EyeCare Business Online, September 2000) We hope to similarly expedite market entrance.
Management Summary
NovOculi’s Management Team is undoubtedly one of its strengths. Among its five principals, NovOculi, Inc. boasts three MBAs, a Chemistry PhD, and two MDs in the field of ophthalmology, all with stellar records within their fields. NovOculi’s consultants are impressive as well, with consultation being provided by the highly successful entrepreneur and technology development expert, Jim Sheldon, the highly reputable and internationally known chairman of Stanford ophthalmology, Dr. Mark Blumenkranz, and an Intellectual Property guru, Trygve Laegrid.
8.1 Management Team
Principals:
Daniel Burnett: Currently an MD/MBA student at Duke University applying for a residency in ophthalmology, Mr. Burnett has a long history of biomedical device design and testing and has spent a total of 10 months at the Food and Drug Administration (FDA). In addition to currently pursuing an MD/MBA, Mr. Burnett also has invented a myringotomy tube insertion device (patent pending) and has created a magnetic nerve stimulation device (patent pending).
Terry Kim, MD: An ophthalmologist at the Duke University Eye Center, Dr. Kim has been performing LASIK laser surgery vision correction for the last five years. Dr. Kim has been profiled on the Discovery channel and has performed LASIK surgery on many high-profile figures, such as NBA-bound players on the Duke men’s basketball team.
Joseph Walker: A current MBA candidate at the Fuqua School of Business, Mr. Walker has detailed knowledge of the venture capital and start-up process derived from his experience at The Aurora Funds, Inc., a southeastern venture capital firm. Mr. Walker plans to pursue a career in venture capital and entrepreneurship.
Andy Rubinson: Currently attending MIT Sloan, in the New Product and Venture Development Track, Mr. Rubinson spent six years working for the Department of Defense at Boeing Space Systems where he helped improve product design and development and manufacturing processes for Delta Rockets and the International Space Station. He then spent two years assigned to Andersen Consulting’s (now Accenture) High Tech and Electronics Market Unit during which time he obtained experience in Product and Processes Development, Integrated Materials and Manufacturing, Procurement, and Manufacturing Strategy and Operations.
Joseph Hewitt: Currently pursuing a PhD in Chemistry at Duke University, Mr. Hewitt has research/teaching experience in both UV/Vis and Fluorescence spectroscopy. His dissertation research involves the application of Capillary Electrophoresis and Fluorescence Lifetime spectroscopy to characterize and study a class of environmental molecules called Humic Substances. As part of this research he has had extensive experience with both lasers and fluorescent dyes, making him a valuable addition to the management team.
Consultants:
James E. Sheldon: Mr. Sheldon’s background includes over twenty-five years experience in business, law, and education. For twelve years, he was one of two principals in The Synertech Group, Inc., a North Carolina-based venture development firm. Two public companies, Embrex and EnSys, resulted from Synertech’s efforts. Prior to founding Synertech, Mr. Sheldon was a principal in, or consultant to, several high technology start-up companies in the Research Triangle area.
Mark Blumenkranz, MD: Dr. Blumenkranz is Professor and Chairman of the Department of Ophthalmology at Stanford University. Dr. Blumenkranz is the author of more than 100 peer-reviewed publications and book chapters and was instrumental in developing the successful laser vision correction program at Stanford. He currently serves as a principal investigator on a number of clinical research trials at Stanford evaluating the effects of laser and pharmacologic agents on eye disease. Dr. Blumenkranz is an associate examiner for the American Board of Ophthalmology and a member of the Retina, Vitreous, Macula, and Gonin Societies. He has served on the Editorial Board of the journals Retina, Graefe’s Archives for Ophthalmology, and Ophthalmology. He is a past recipient of the Research to prevent Blindness Special Manpower Award, the Heed Award, the Rosenthal Award in Visual Sciences, and the American Academy of Ophthalmology Senior Honor Award.
Trygve Laegrid, PhD: Dr. Laegrid is currently pursuing an Executive MBA at the MIT Sloan School of Management. After obtaining a PhD in condensed matter physics, Dr. Laegrid became involved in licensing, valuation and management of intellectual property. He is currently the Manager for Intellectual Property and Commercialization for Statoil Industrial Development.
8.2 Management Team Gaps
An experienced CEO is actively being sought. The founders of the company will conduct the search. The desired profile is for a CEO experienced in the medical device arena, ideally who was part of a previous successful start-up venture.
The company will search for design engineers and consultants.
8.3 Personnel Plan
The Personnel Plan chronicles the growth of the organization to approximately 77 employees in the first 5 years. Each year may require a few additional people besides those indicated, based on the growth of the company in accordance with the Business Plan.
| Personnel Plan | |||||
| Year 1 | Year 2 | Year 3 | Year 4 | Year 5 | |
| Research Engineer | $60,000 | $120,000 | $240,000 | $400,000 | $400,000 |
| CFO | $16,000 | $100,000 | $110,000 | $121,000 | $133,100 |
| CEO | $30,000 | $125,000 | $137,500 | $151,250 | $166,375 |
| Administrative | $6,000 | $48,000 | $52,800 | $116,160 | $255,552 |
| Sales/Marketing | $24,000 | $180,000 | $360,000 | $865,000 | $4,130,000 |
| Total People | 9 | 14 | 24 | 44 | 77 |
| Total Payroll | $136,000 | $573,000 | $900,300 | $1,653,410 | $5,085,027 |
Financial Plan
CAPITAL RAISING (THE OFFER)
The company intends to raise an amount of seed capital. Startup investment has already been committed by management.
Current Capital Structure:
| Stock Type | Shares Authorized | Shares Issued |
| Common | 30,000,000 | 3,000,000 |
| Preferred | 2,000,000 | 0 |
Current Shareholders:
| Owner | Shares Granted | Stock Type |
| Daniel Burnett | 1,950,000 | Common |
| Joseph Hewitt | 300,000 | Common |
| Andy Rubinson | 300,000 | Common |
| Joseph Walker | 300,000 | Common |
| Dr. Terry Kim | 150,000 | Common |
For $1.5 million, the investing party will receive 1,500,000 preferred shares or 33.3% of the company. Preferred shares will include senior debt and anti-dilution provisions as negotiated.
The proceeds from the offer will be used to fund the working capital requirements of the Company (and its subsidiary and associated companies, if any).
Land building, plant and machinery, and other fixed assets will be purchased as and when deemed necessary to maximize the profits of the company.
Cashflows incidental to the normal business operations of the company.
Funds will be used for the purpose of business operations of the company.
Exit Considerations
The most likely exit afforded investors will be through acquisition. If the company’s actual operational and financial results are in any reasonable range of the projected results herein, the company will become an attractive asset to an acquisitive competitor or larger medical device company. No particular competitor or medical device company is thought to be more likely than another to be interested in NovOculi’s technology.
To the extent that actual operational results materially exceed those projected herein, the probability of an IPO exit increases. Exceptional results would enhance the NovOculi’s brand name and financial position, making new product development and the likelihood of new product success more plausible. In this scenario, the opportunity to raise capital and provide an investment exit to shareholders becomes more likely.
A third exit possibility for investors may be an acquisition after IPO. This strategy would allow an investor to delay exit until after capital from an IPO is invested in successful projects, further raising the value of the firm.
9.1 Important Assumptions
Market
- Growth of NICS will parallel that of LASIK.
- Expansion into foreign markets will not occur in this 5-year plan.
- Projections related to consumer acceptance were estimated using market survey.
- Total market size was based on only 1/3 of all patients having both eyes corrected (current data supports as much as 2/3).
Research
- Research Grant of $2 million applied for in May of 2001 will be received by December 2002.
- Stanford University backing of research proposal and offering of facilities will decrease total research and design expenditures by 50%.
Sales/Revenues
- Projections were based on continued rejection by insurance companies to reimburse for refractive correction.
- Acceptable premiums were developed using preliminary market survey of n=50.
| General Assumptions | |||||
| Year 1 | Year 2 | Year 3 | Year 4 | Year 5 | |
| Plan Month | 1 | 2 | 3 | 4 | 5 |
| Current Interest Rate | 10.00% | 10.00% | 10.00% | 10.00% | 10.00% |
| Long-term Interest Rate | 10.00% | 10.00% | 10.00% | 10.00% | 10.00% |
| Tax Rate | 25.42% | 25.00% | 25.42% | 25.00% | 25.42% |
| Other | 0 | 0 | 0 | 0 | 0 |
9.2 Break-even Analysis
With a fully operational average monthly fixed cost, NovOculi will break-even once the sales volume as shown in the table below is reached. Per-unit revenue and costs for the Iontophoretic Device, Licensing Fees, and the Polymeric Vehicle have been averaged. The management estimates that the company will reach this sales volume by the third year of operations, at which time the per-unit direct costs and direct costs of sales will begin decreasing.

| Break-even Analysis | |
| Monthly Units Break-even | 19 |
| Monthly Revenue Break-even | $65,769 |
| Assumptions: | |
| Average Per-Unit Revenue | $3,500.00 |
| Average Per-Unit Variable Cost | $150.00 |
| Estimated Monthly Fixed Cost | $62,950 |
9.3 Projected Profit and Loss
The Projected Profit and Loss table takes into account the significant subsidization of NovOculi’s research efforts by the Stanford University Department of Ophthalmology. Due to this strategic alliance, the company’s research expenditures have been nearly halved.


| Pro Forma Profit and Loss | |||||
| Year 1 | Year 2 | Year 3 | Year 4 | Year 5 | |
| Sales | $0 | $544,500 | $1,897,175 | $8,261,700 | $56,981,829 |
| Direct Cost of Sales | $0 | $37,550 | $85,018 | $332,025 | $2,102,782 |
| Other | $0 | $0 | $0 | $0 | $0 |
| Total Cost of Sales | $0 | $37,550 | $85,018 | $332,025 | $2,102,782 |
| Gross Margin | $0 | $506,950 | $1,812,158 | $7,929,675 | $54,879,047 |
| Gross Margin % | 0.00% | 93.10% | 95.52% | 95.98% | 96.31% |
| Expenses | |||||
| Payroll | $136,000 | $573,000 | $900,300 | $1,653,410 | $5,085,027 |
| Sales and Marketing and Other Expenses | $539,000 | $795,000 | $1,450,000 | $2,425,000 | $6,775,000 |
| Depreciation | $0 | $0 | $0 | $0 | $0 |
| Leased Equipment | $0 | $0 | $0 | $0 | $0 |
| Utilities | $12,000 | $0 | $0 | $0 | $0 |
| Insurance | $30,000 | $0 | $0 | $0 | $0 |
| Rent | $18,000 | $18,000 | $18,000 | $18,000 | $18,000 |
| Payroll Taxes | $20,400 | $85,950 | $135,045 | $248,012 | $762,754 |
| Other | $0 | $0 | $0 | $0 | $0 |
| Total Operating Expenses | $755,400 | $1,471,950 | $2,503,345 | $4,344,422 | $12,640,781 |
| Profit Before Interest and Taxes | ($755,400) | ($965,000) | ($691,188) | $3,585,254 | $42,238,266 |
| EBITDA | ($755,400) | ($965,000) | ($691,188) | $3,585,254 | $42,238,266 |
| Interest Expense | $0 | $0 | $0 | $0 | $0 |
| Taxes Incurred | $0 | $0 | $0 | $896,313 | $10,735,559 |
| Net Profit | ($755,400) | ($965,000) | ($691,188) | $2,688,940 | $31,502,707 |
| Net Profit/Sales | 0.00% | -177.23% | -36.43% | 32.55% | 55.29% |
9.4 Projected Cash Flow
Important points to note in Projected Cash Flow are as follows:
- In Year 1 of the business plan, the company expects to raise (Section 1) working capital.
- While the company has planned for additional capital raising (Section 2) in Year 3 of the business plan, it is expected that research grants will have been secured by this point and capital raising will not be necessary.

| Pro Forma Cash Flow | |||||
| Year 1 | Year 2 | Year 3 | Year 4 | Year 5 | |
| Cash Received | |||||
| Cash from Operations | |||||
| Cash Sales | $0 | $136,125 | $474,294 | $2,065,425 | $14,245,457 |
| Cash from Receivables | $0 | $408,375 | $1,422,881 | $6,196,275 | $42,736,372 |
| Subtotal Cash from Operations | $0 | $544,500 | $1,897,175 | $8,261,700 | $56,981,829 |
| Additional Cash Received | |||||
| Sales Tax, VAT, HST/GST Received | $0 | $0 | $0 | $0 | $0 |
| New Current Borrowing | $0 | $0 | $0 | $0 | $0 |
| New Other Liabilities (interest-free) | $0 | $0 | $0 | $0 | $0 |
| New Long-term Liabilities | $0 | $0 | $0 | $0 | $0 |
| Sales of Other Current Assets | $0 | $0 | $0 | $0 | $0 |
| Sales of Long-term Assets | $0 | $0 | $0 | $0 | $0 |
| New Investment Received | $1,500,000 | $0 | $1,000,000 | $0 | $0 |
| Subtotal Cash Received | $1,500,000 | $544,500 | $2,897,175 | $8,261,700 | $56,981,829 |
| Expenditures | Year 1 | Year 2 | Year 3 | Year 4 | Year 5 |
| Expenditures from Operations | |||||
| Cash Spending | $136,000 | $573,000 | $900,300 | $1,653,410 | $5,085,027 |
| Bill Payments | $594,315 | $884,612 | $1,626,290 | $3,735,956 | $19,040,007 |
| Subtotal Spent on Operations | $730,315 | $1,457,612 | $2,526,590 | $5,389,366 | $24,125,034 |
| Additional Cash Spent | |||||
| Sales Tax, VAT, HST/GST Paid Out | $0 | $0 | $0 | $0 | $0 |
| Principal Repayment of Current Borrowing | $0 | $0 | $0 | $0 | $0 |
| Other Liabilities Principal Repayment | $0 | $0 | $0 | $0 | $0 |
| Long-term Liabilities Principal Repayment | $0 | $0 | $0 | $0 | $0 |
| Purchase Other Current Assets | $0 | $0 | $0 | $0 | $0 |
| Purchase Long-term Assets | $0 | $0 | $0 | $0 | $0 |
| Dividends | $0 | $0 | $0 | $0 | $0 |
| Subtotal Cash Spent | $730,315 | $1,457,612 | $2,526,590 | $5,389,366 | $24,125,034 |
| Net Cash Flow | $769,685 | ($913,112) | $370,585 | $2,872,334 | $32,856,796 |
| Cash Balance | $1,086,685 | $173,573 | $544,157 | $3,416,491 | $36,273,287 |
9.5 Projected Balance Sheet
While Inventory on the Balance Sheet may appear disproportionately low in comparison to sales, this is due to the fact that one of the components of total sales, licensing fees, is not a durable good and will require no inventory.
| Pro Forma Balance Sheet | |||||
| Year 1 | Year 2 | Year 3 | Year 4 | Year 5 | |
| Assets | |||||
| Current Assets | |||||
| Cash | $1,086,685 | $173,573 | $544,157 | $3,416,491 | $36,273,287 |
| Accounts Receivable | $0 | $0 | $0 | $0 | $0 |
| Inventory | $0 | $0 | $0 | $0 | $0 |
| Other Current Assets | $0 | $0 | $0 | $0 | $0 |
| Total Current Assets | $1,086,685 | $173,573 | $544,157 | $3,416,491 | $36,273,287 |
| Long-term Assets | |||||
| Long-term Assets | $0 | $0 | $0 | $0 | $0 |
| Accumulated Depreciation | $0 | $0 | $0 | $0 | $0 |
| Total Long-term Assets | $0 | $0 | $0 | $0 | $0 |
| Total Assets | $1,086,685 | $173,573 | $544,157 | $3,416,491 | $36,273,287 |
| Liabilities and Capital | Year 1 | Year 2 | Year 3 | Year 4 | Year 5 |
| Current Liabilities | |||||
| Accounts Payable | $25,085 | $76,973 | $138,745 | $322,138 | $1,676,227 |
| Current Borrowing | $0 | $0 | $0 | $0 | $0 |
| Other Current Liabilities | $0 | $0 | $0 | $0 | $0 |
| Subtotal Current Liabilities | $25,085 | $76,973 | $138,745 | $322,138 | $1,676,227 |
| Long-term Liabilities | $0 | $0 | $0 | $0 | $0 |
| Total Liabilities | $25,085 | $76,973 | $138,745 | $322,138 | $1,676,227 |
| Paid-in Capital | $1,850,000 | $1,850,000 | $2,850,000 | $2,850,000 | $2,850,000 |
| Retained Earnings | ($33,000) | ($788,400) | ($1,753,400) | ($2,444,588) | $244,353 |
| Earnings | ($755,400) | ($965,000) | ($691,188) | $2,688,940 | $31,502,707 |
| Total Capital | $1,061,600 | $96,600 | $405,413 | $3,094,353 | $34,597,060 |
| Total Liabilities and Capital | $1,086,685 | $173,573 | $544,157 | $3,416,491 | $36,273,287 |
| Net Worth | $1,061,600 | $96,600 | $405,413 | $3,094,353 | $34,597,060 |
9.6 Business Ratios
The following table presents important ratios from the Opthalmic goods industry, as determined by the Standard Industry Classification (SIC) Index code 3851.
| Ratio Analysis | ||||||
| Year 1 | Year 2 | Year 3 | Year 4 | Year 5 | Industry Profile | |
| Sales Growth | 0.00% | 0.00% | 248.43% | 335.47% | 589.71% | 3.10% |
| Percent of Total Assets | ||||||
| Accounts Receivable | 0.00% | 0.00% | 0.00% | 0.00% | 0.00% | 24.20% |
| Inventory | 0.00% | 0.00% | 0.00% | 0.00% | 0.00% | 20.90% |
| Other Current Assets | 0.00% | 0.00% | 0.00% | 0.00% | 0.00% | 34.70% |
| Total Current Assets | 100.00% | 100.00% | 100.00% | 100.00% | 100.00% | 79.80% |
| Long-term Assets | 0.00% | 0.00% | 0.00% | 0.00% | 0.00% | 20.20% |
| Total Assets | 100.00% | 100.00% | 100.00% | 100.00% | 100.00% | 100.00% |
| Current Liabilities | 2.31% | 44.35% | 25.50% | 9.43% | 4.62% | 37.70% |
| Long-term Liabilities | 0.00% | 0.00% | 0.00% | 0.00% | 0.00% | 17.60% |
| Total Liabilities | 2.31% | 44.35% | 25.50% | 9.43% | 4.62% | 55.30% |
| Net Worth | 97.69% | 55.65% | 74.50% | 90.57% | 95.38% | 44.70% |
| Percent of Sales | ||||||
| Sales | 100.00% | 100.00% | 100.00% | 100.00% | 100.00% | 100.00% |
| Gross Margin | 0.00% | 93.10% | 95.52% | 95.98% | 96.31% | 52.50% |
| Selling, General & Administrative Expenses | 0.00% | 270.33% | 131.95% | 63.43% | 40.72% | 32.70% |
| Advertising Expenses | 0.00% | 45.91% | 18.45% | 9.08% | 6.14% | 1.70% |
| Profit Before Interest and Taxes | 0.00% | -177.23% | -36.43% | 43.40% | 74.13% | 2.80% |
| Main Ratios | ||||||
| Current | 43.32 | 2.25 | 3.92 | 10.61 | 21.64 | 2.10 |
| Quick | 43.32 | 2.25 | 3.92 | 10.61 | 21.64 | 1.30 |
| Total Debt to Total Assets | 2.31% | 44.35% | 25.50% | 9.43% | 4.62% | 55.30% |
| Pre-tax Return on Net Worth | -71.16% | -998.96% | -170.49% | 115.86% | 122.09% | 4.70% |
| Pre-tax Return on Assets | -69.51% | -555.96% | -127.02% | 104.94% | 116.44% | 10.50% |
| Additional Ratios | Year 1 | Year 2 | Year 3 | Year 4 | Year 5 | |
| Net Profit Margin | 0.00% | -177.23% | -36.43% | 32.55% | 55.29% | n.a |
| Return on Equity | -71.16% | -998.96% | -170.49% | 86.90% | 91.06% | n.a |
| Activity Ratios | ||||||
| Accounts Receivable Turnover | 0.00 | 0.00 | 0.00 | 0.00 | 0.00 | n.a |
| Collection Days | 0 | 0 | 0 | 0 | 0 | n.a |
| Inventory Turnover | 0.00 | 0.00 | 0.00 | 0.00 | 0.00 | n.a |
| Accounts Payable Turnover | 24.69 | 12.17 | 12.17 | 12.17 | 12.17 | n.a |
| Payment Days | 27 | 20 | 23 | 21 | 18 | n.a |
| Total Asset Turnover | 0.00 | 3.14 | 3.49 | 2.42 | 1.57 | n.a |
| Debt Ratios | ||||||
| Debt to Net Worth | 0.02 | 0.80 | 0.34 | 0.10 | 0.05 | n.a |
| Current Liab. to Liab. | 1.00 | 1.00 | 1.00 | 1.00 | 1.00 | n.a |
| Liquidity Ratios | ||||||
| Net Working Capital | $1,061,600 | $96,600 | $405,413 | $3,094,353 | $34,597,060 | n.a |
| Interest Coverage | 0.00 | 0.00 | 0.00 | 0.00 | 0.00 | n.a |
| Additional Ratios | ||||||
| Assets to Sales | n.a. | 0.32 | 0.29 | 0.41 | 0.64 | n.a |
| Current Debt/Total Assets | 2% | 44% | 25% | 9% | 5% | n.a |
| Acid Test | 43.32 | 2.25 | 3.92 | 10.61 | 21.64 | n.a |
| Sales/Net Worth | 0.00 | 5.64 | 4.68 | 2.67 | 1.65 | n.a |
| Dividend Payout | 0.00 | 0.00 | 0.00 | 0.00 | 0.00 | n.a |
Appendix
| Sales Forecast | |||||||||||||
| Month 1 | Month 2 | Month 3 | Month 4 | Month 5 | Month 6 | Month 7 | Month 8 | Month 9 | Month 10 | Month 11 | Month 12 | ||
| Unit Sales | |||||||||||||
| Iontophoretic Device | 0% | 0 | 0 | 0 | 0 | 0 | 0 | 0 | 0 | 0 | 0 | 0 | 0 |
| Licensing Fees | 0% | 0 | 0 | 0 | 0 | 0 | 0 | 0 | 0 | 0 | 0 | 0 | 0 |
| Polymeric Vehicle | 0% | 0 | 0 | 0 | 0 | 0 | 0 | 0 | 0 | 0 | 0 | 0 | 0 |
| Other | 0% | 0 | 0 | 0 | 0 | 0 | 0 | 0 | 0 | 0 | 0 | 0 | 0 |
| Total Unit Sales | 0 | 0 | 0 | 0 | 0 | 0 | 0 | 0 | 0 | 0 | 0 | 0 | |
| Unit Prices | Month 1 | Month 2 | Month 3 | Month 4 | Month 5 | Month 6 | Month 7 | Month 8 | Month 9 | Month 10 | Month 11 | Month 12 | |
| Iontophoretic Device | $0.00 | $0.00 | $0.00 | $0.00 | $0.00 | $0.00 | $0.00 | $0.00 | $0.00 | $0.00 | $0.00 | $0.00 | |
| Licensing Fees | $0.00 | $0.00 | $0.00 | $0.00 | $0.00 | $0.00 | $0.00 | $0.00 | $0.00 | $0.00 | $0.00 | $0.00 | |
| Polymeric Vehicle | $0.00 | $0.00 | $0.00 | $0.00 | $0.00 | $0.00 | $0.00 | $0.00 | $0.00 | $0.00 | $0.00 | $0.00 | |
| Other | $0.00 | $0.00 | $0.00 | $0.00 | $0.00 | $0.00 | $0.00 | $0.00 | $0.00 | $0.00 | $0.00 | $0.00 | |
| Sales | |||||||||||||
| Iontophoretic Device | $0 | $0 | $0 | $0 | $0 | $0 | $0 | $0 | $0 | $0 | $0 | $0 | |
| Licensing Fees | $0 | $0 | $0 | $0 | $0 | $0 | $0 | $0 | $0 | $0 | $0 | $0 | |
| Polymeric Vehicle | $0 | $0 | $0 | $0 | $0 | $0 | $0 | $0 | $0 | $0 | $0 | $0 | |
| Other | $0 | $0 | $0 | $0 | $0 | $0 | $0 | $0 | $0 | $0 | $0 | $0 | |
| Total Sales | $0 | $0 | $0 | $0 | $0 | $0 | $0 | $0 | $0 | $0 | $0 | $0 | |
| Direct Unit Costs | Month 1 | Month 2 | Month 3 | Month 4 | Month 5 | Month 6 | Month 7 | Month 8 | Month 9 | Month 10 | Month 11 | Month 12 | |
| Iontophoretic Device | 0.00% | $0.00 | $0.00 | $0.00 | $0.00 | $0.00 | $0.00 | $0.00 | $0.00 | $0.00 | $0.00 | $0.00 | $0.00 |
| Licensing Fees | 0.00% | $0.00 | $0.00 | $0.00 | $0.00 | $0.00 | $0.00 | $0.00 | $0.00 | $0.00 | $0.00 | $0.00 | $0.00 |
| Polymeric Vehicle | 0.00% | $0.00 | $0.00 | $0.00 | $0.00 | $0.00 | $0.00 | $0.00 | $0.00 | $0.00 | $0.00 | $0.00 | $0.00 |
| Other | 0.00% | $0.00 | $0.00 | $0.00 | $0.00 | $0.00 | $0.00 | $0.00 | $0.00 | $0.00 | $0.00 | $0.00 | $0.00 |
| Direct Cost of Sales | |||||||||||||
| Iontophoretic Device | $0 | $0 | $0 | $0 | $0 | $0 | $0 | $0 | $0 | $0 | $0 | $0 | |
| Licensing Fees | $0 | $0 | $0 | $0 | $0 | $0 | $0 | $0 | $0 | $0 | $0 | $0 | |
| Polymeric Vehicle | $0 | $0 | $0 | $0 | $0 | $0 | $0 | $0 | $0 | $0 | $0 | $0 | |
| Other | $0 | $0 | $0 | $0 | $0 | $0 | $0 | $0 | $0 | $0 | $0 | $0 | |
| Subtotal Direct Cost of Sales | $0 | $0 | $0 | $0 | $0 | $0 | $0 | $0 | $0 | $0 | $0 | $0 | |
| Personnel Plan | |||||||||||||
| Month 1 | Month 2 | Month 3 | Month 4 | Month 5 | Month 6 | Month 7 | Month 8 | Month 9 | Month 10 | Month 11 | Month 12 | ||
| Research Engineer | 0% | $5,000 | $5,000 | $5,000 | $5,000 | $5,000 | $5,000 | $5,000 | $5,000 | $5,000 | $5,000 | $5,000 | $5,000 |
| CFO | 0% | $0 | $0 | $0 | $0 | $0 | $0 | $0 | $0 | $0 | $0 | $8,000 | $8,000 |
| CEO | 0% | $0 | $0 | $0 | $0 | $0 | $0 | $0 | $0 | $0 | $10,000 | $10,000 | $10,000 |
| Administrative | 0% | $0 | $0 | $0 | $0 | $0 | $0 | $0 | $0 | $0 | $2,000 | $2,000 | $2,000 |
| Sales/Marketing | 0% | $0 | $0 | $0 | $0 | $0 | $0 | $0 | $0 | $0 | $8,000 | $8,000 | $8,000 |
| Total People | 2 | 2 | 2 | 2 | 2 | 2 | 2 | 2 | 2 | 8 | 9 | 9 | |
| Total Payroll | $5,000 | $5,000 | $5,000 | $5,000 | $5,000 | $5,000 | $5,000 | $5,000 | $5,000 | $25,000 | $33,000 | $33,000 | |
| General Assumptions | ||||||||||||
| Month 1 | Month 2 | Month 3 | Month 4 | Month 5 | Month 6 | Month 7 | Month 8 | Month 9 | Month 10 | Month 11 | Month 12 | |
| Plan Month | 1 | 2 | 3 | 4 | 5 | 6 | 7 | 8 | 9 | 10 | 11 | 12 |
| Current Interest Rate | 10.00% | 10.00% | 10.00% | 10.00% | 10.00% | 10.00% | 10.00% | 10.00% | 10.00% | 10.00% | 10.00% | 10.00% |
| Long-term Interest Rate | 10.00% | 10.00% | 10.00% | 10.00% | 10.00% | 10.00% | 10.00% | 10.00% | 10.00% | 10.00% | 10.00% | 10.00% |
| Tax Rate | 30.00% | 25.00% | 25.00% | 25.00% | 25.00% | 25.00% | 25.00% | 25.00% | 25.00% | 25.00% | 25.00% | 25.00% |
| Other | 0 | 0 | 0 | 0 | 0 | 0 | 0 | 0 | 0 | 0 | 0 | 0 |
| Pro Forma Profit and Loss | |||||||||||||
| Month 1 | Month 2 | Month 3 | Month 4 | Month 5 | Month 6 | Month 7 | Month 8 | Month 9 | Month 10 | Month 11 | Month 12 | ||
| Sales | $0 | $0 | $0 | $0 | $0 | $0 | $0 | $0 | $0 | $0 | $0 | $0 | |
| Direct Cost of Sales | $0 | $0 | $0 | $0 | $0 | $0 | $0 | $0 | $0 | $0 | $0 | $0 | |
| Other | $0 | $0 | $0 | $0 | $0 | $0 | $0 | $0 | $0 | $0 | $0 | $0 | |
| Total Cost of Sales | $0 | $0 | $0 | $0 | $0 | $0 | $0 | $0 | $0 | $0 | $0 | $0 | |
| Gross Margin | $0 | $0 | $0 | $0 | $0 | $0 | $0 | $0 | $0 | $0 | $0 | $0 | |
| Gross Margin % | 0.00% | 0.00% | 0.00% | 0.00% | 0.00% | 0.00% | 0.00% | 0.00% | 0.00% | 0.00% | 0.00% | 0.00% | |
| Expenses | |||||||||||||
| Payroll | $5,000 | $5,000 | $5,000 | $5,000 | $5,000 | $5,000 | $5,000 | $5,000 | $5,000 | $25,000 | $33,000 | $33,000 | |
| Sales and Marketing and Other Expenses | $500,000 | $0 | $0 | $0 | $0 | $0 | $0 | $0 | $0 | $10,000 | $13,000 | $16,000 | |
| Depreciation | $0 | $0 | $0 | $0 | $0 | $0 | $0 | $0 | $0 | $0 | $0 | $0 | |
| Leased Equipment | $0 | $0 | $0 | $0 | $0 | $0 | $0 | $0 | $0 | $0 | $0 | $0 | |
| Utilities | $1,000 | $1,000 | $1,000 | $1,000 | $1,000 | $1,000 | $1,000 | $1,000 | $1,000 | $1,000 | $1,000 | $1,000 | |
| Insurance | $2,500 | $2,500 | $2,500 | $2,500 | $2,500 | $2,500 | $2,500 | $2,500 | $2,500 | $2,500 | $2,500 | $2,500 | |
| Rent | $1,500 | $1,500 | $1,500 | $1,500 | $1,500 | $1,500 | $1,500 | $1,500 | $1,500 | $1,500 | $1,500 | $1,500 | |
| Payroll Taxes | 15% | $750 | $750 | $750 | $750 | $750 | $750 | $750 | $750 | $750 | $3,750 | $4,950 | $4,950 |
| Other | $0 | $0 | $0 | $0 | $0 | $0 | $0 | $0 | $0 | $0 | $0 | $0 | |
| Total Operating Expenses | $510,750 | $10,750 | $10,750 | $10,750 | $10,750 | $10,750 | $10,750 | $10,750 | $10,750 | $43,750 | $55,950 | $58,950 | |
| Profit Before Interest and Taxes | ($510,750) | ($10,750) | ($10,750) | ($10,750) | ($10,750) | ($10,750) | ($10,750) | ($10,750) | ($10,750) | ($43,750) | ($55,950) | ($58,950) | |
| EBITDA | ($510,750) | ($10,750) | ($10,750) | ($10,750) | ($10,750) | ($10,750) | ($10,750) | ($10,750) | ($10,750) | ($43,750) | ($55,950) | ($58,950) | |
| Interest Expense | $0 | $0 | $0 | $0 | $0 | $0 | $0 | $0 | $0 | $0 | $0 | $0 | |
| Taxes Incurred | $0 | $0 | $0 | $0 | $0 | $0 | $0 | $0 | $0 | $0 | $0 | $0 | |
| Net Profit | ($510,750) | ($10,750) | ($10,750) | ($10,750) | ($10,750) | ($10,750) | ($10,750) | ($10,750) | ($10,750) | ($43,750) | ($55,950) | ($58,950) | |
| Net Profit/Sales | 0.00% | 0.00% | 0.00% | 0.00% | 0.00% | 0.00% | 0.00% | 0.00% | 0.00% | 0.00% | 0.00% | 0.00% | |
| Pro Forma Cash Flow | |||||||||||||
| Month 1 | Month 2 | Month 3 | Month 4 | Month 5 | Month 6 | Month 7 | Month 8 | Month 9 | Month 10 | Month 11 | Month 12 | ||
| Cash Received | |||||||||||||
| Cash from Operations | |||||||||||||
| Cash Sales | $0 | $0 | $0 | $0 | $0 | $0 | $0 | $0 | $0 | $0 | $0 | $0 | |
| Cash from Receivables | $0 | $0 | $0 | $0 | $0 | $0 | $0 | $0 | $0 | $0 | $0 | $0 | |
| Subtotal Cash from Operations | $0 | $0 | $0 | $0 | $0 | $0 | $0 | $0 | $0 | $0 | $0 | $0 | |
| Additional Cash Received | |||||||||||||
| Sales Tax, VAT, HST/GST Received | 0.00% | $0 | $0 | $0 | $0 | $0 | $0 | $0 | $0 | $0 | $0 | $0 | $0 |
| New Current Borrowing | $0 | $0 | $0 | $0 | $0 | $0 | $0 | $0 | $0 | $0 | $0 | $0 | |
| New Other Liabilities (interest-free) | $0 | $0 | $0 | $0 | $0 | $0 | $0 | $0 | $0 | $0 | $0 | $0 | |
| New Long-term Liabilities | $0 | $0 | $0 | $0 | $0 | $0 | $0 | $0 | $0 | $0 | $0 | $0 | |
| Sales of Other Current Assets | $0 | $0 | $0 | $0 | $0 | $0 | $0 | $0 | $0 | $0 | $0 | $0 | |
| Sales of Long-term Assets | $0 | $0 | $0 | $0 | $0 | $0 | $0 | $0 | $0 | $0 | $0 | $0 | |
| New Investment Received | $1,500,000 | $0 | $0 | $0 | $0 | $0 | $0 | $0 | $0 | $0 | $0 | $0 | |
| Subtotal Cash Received | $1,500,000 | $0 | $0 | $0 | $0 | $0 | $0 | $0 | $0 | $0 | $0 | $0 | |
| Expenditures | Month 1 | Month 2 | Month 3 | Month 4 | Month 5 | Month 6 | Month 7 | Month 8 | Month 9 | Month 10 | Month 11 | Month 12 | |
| Expenditures from Operations | |||||||||||||
| Cash Spending | $5,000 | $5,000 | $5,000 | $5,000 | $5,000 | $5,000 | $5,000 | $5,000 | $5,000 | $25,000 | $33,000 | $33,000 | |
| Bill Payments | $16,858 | $489,083 | $5,750 | $5,750 | $5,750 | $5,750 | $5,750 | $5,750 | $5,750 | $6,183 | $18,890 | $23,050 | |
| Subtotal Spent on Operations | $21,858 | $494,083 | $10,750 | $10,750 | $10,750 | $10,750 | $10,750 | $10,750 | $10,750 | $31,183 | $51,890 | $56,050 | |
| Additional Cash Spent | |||||||||||||
| Sales Tax, VAT, HST/GST Paid Out | $0 | $0 | $0 | $0 | $0 | $0 | $0 | $0 | $0 | $0 | $0 | $0 | |
| Principal Repayment of Current Borrowing | $0 | $0 | $0 | $0 | $0 | $0 | $0 | $0 | $0 | $0 | $0 | $0 | |
| Other Liabilities Principal Repayment | $0 | $0 | $0 | $0 | $0 | $0 | $0 | $0 | $0 | $0 | $0 | $0 | |
| Long-term Liabilities Principal Repayment | $0 | $0 | $0 | $0 | $0 | $0 | $0 | $0 | $0 | $0 | $0 | $0 | |
| Purchase Other Current Assets | $0 | $0 | $0 | $0 | $0 | $0 | $0 | $0 | $0 | $0 | $0 | $0 | |
| Purchase Long-term Assets | $0 | $0 | $0 | $0 | $0 | $0 | $0 | $0 | $0 | $0 | $0 | $0 | |
| Dividends | $0 | $0 | $0 | $0 | $0 | $0 | $0 | $0 | $0 | $0 | $0 | $0 | |
| Subtotal Cash Spent | $21,858 | $494,083 | $10,750 | $10,750 | $10,750 | $10,750 | $10,750 | $10,750 | $10,750 | $31,183 | $51,890 | $56,050 | |
| Net Cash Flow | $1,478,142 | ($494,083) | ($10,750) | ($10,750) | ($10,750) | ($10,750) | ($10,750) | ($10,750) | ($10,750) | ($31,183) | ($51,890) | ($56,050) | |
| Cash Balance | $1,795,142 | $1,301,058 | $1,290,308 | $1,279,558 | $1,268,808 | $1,258,058 | $1,247,308 | $1,236,558 | $1,225,808 | $1,194,625 | $1,142,735 | $1,086,685 | |
| Pro Forma Balance Sheet | |||||||||||||
| Month 1 | Month 2 | Month 3 | Month 4 | Month 5 | Month 6 | Month 7 | Month 8 | Month 9 | Month 10 | Month 11 | Month 12 | ||
| Assets | Starting Balances | ||||||||||||
| Current Assets | |||||||||||||
| Cash | $317,000 | $1,795,142 | $1,301,058 | $1,290,308 | $1,279,558 | $1,268,808 | $1,258,058 | $1,247,308 | $1,236,558 | $1,225,808 | $1,194,625 | $1,142,735 | $1,086,685 |
| Accounts Receivable | $0 | $0 | $0 | $0 | $0 | $0 | $0 | $0 | $0 | $0 | $0 | $0 | $0 |
| Inventory | $0 | $0 | $0 | $0 | $0 | $0 | $0 | $0 | $0 | $0 | $0 | $0 | $0 |
| Other Current Assets | $0 | $0 | $0 | $0 | $0 | $0 | $0 | $0 | $0 | $0 | $0 | $0 | $0 |
| Total Current Assets | $317,000 | $1,795,142 | $1,301,058 | $1,290,308 | $1,279,558 | $1,268,808 | $1,258,058 | $1,247,308 | $1,236,558 | $1,225,808 | $1,194,625 | $1,142,735 | $1,086,685 |
| Long-term Assets | |||||||||||||
| Long-term Assets | $0 | $0 | $0 | $0 | $0 | $0 | $0 | $0 | $0 | $0 | $0 | $0 | $0 |
| Accumulated Depreciation | $0 | $0 | $0 | $0 | $0 | $0 | $0 | $0 | $0 | $0 | $0 | $0 | $0 |
| Total Long-term Assets | $0 | $0 | $0 | $0 | $0 | $0 | $0 | $0 | $0 | $0 | $0 | $0 | $0 |
| Total Assets | $317,000 | $1,795,142 | $1,301,058 | $1,290,308 | $1,279,558 | $1,268,808 | $1,258,058 | $1,247,308 | $1,236,558 | $1,225,808 | $1,194,625 | $1,142,735 | $1,086,685 |
| Liabilities and Capital | Month 1 | Month 2 | Month 3 | Month 4 | Month 5 | Month 6 | Month 7 | Month 8 | Month 9 | Month 10 | Month 11 | Month 12 | |
| Current Liabilities | |||||||||||||
| Accounts Payable | $0 | $488,892 | $5,558 | $5,558 | $5,558 | $5,558 | $5,558 | $5,558 | $5,558 | $5,558 | $18,125 | $22,185 | $25,085 |
| Current Borrowing | $0 | $0 | $0 | $0 | $0 | $0 | $0 | $0 | $0 | $0 | $0 | $0 | $0 |
| Other Current Liabilities | $0 | $0 | $0 | $0 | $0 | $0 | $0 | $0 | $0 | $0 | $0 | $0 | $0 |
| Subtotal Current Liabilities | $0 | $488,892 | $5,558 | $5,558 | $5,558 | $5,558 | $5,558 | $5,558 | $5,558 | $5,558 | $18,125 | $22,185 | $25,085 |
| Long-term Liabilities | $0 | $0 | $0 | $0 | $0 | $0 | $0 | $0 | $0 | $0 | $0 | $0 | $0 |
| Total Liabilities | $0 | $488,892 | $5,558 | $5,558 | $5,558 | $5,558 | $5,558 | $5,558 | $5,558 | $5,558 | $18,125 | $22,185 | $25,085 |
| Paid-in Capital | $350,000 | $1,850,000 | $1,850,000 | $1,850,000 | $1,850,000 | $1,850,000 | $1,850,000 | $1,850,000 | $1,850,000 | $1,850,000 | $1,850,000 | $1,850,000 | $1,850,000 |
| Retained Earnings | ($33,000) | ($33,000) | ($33,000) | ($33,000) | ($33,000) | ($33,000) | ($33,000) | ($33,000) | ($33,000) | ($33,000) | ($33,000) | ($33,000) | ($33,000) |
| Earnings | $0 | ($510,750) | ($521,500) | ($532,250) | ($543,000) | ($553,750) | ($564,500) | ($575,250) | ($586,000) | ($596,750) | ($640,500) | ($696,450) | ($755,400) |
| Total Capital | $317,000 | $1,306,250 | $1,295,500 | $1,284,750 | $1,274,000 | $1,263,250 | $1,252,500 | $1,241,750 | $1,231,000 | $1,220,250 | $1,176,500 | $1,120,550 | $1,061,600 |
| Total Liabilities and Capital | $317,000 | $1,795,142 | $1,301,058 | $1,290,308 | $1,279,558 | $1,268,808 | $1,258,058 | $1,247,308 | $1,236,558 | $1,225,808 | $1,194,625 | $1,142,735 | $1,086,685 |
| Net Worth | $317,000 | $1,306,250 | $1,295,500 | $1,284,750 | $1,274,000 | $1,263,250 | $1,252,500 | $1,241,750 | $1,231,000 | $1,220,250 | $1,176,500 | $1,120,550 | $1,061,600 |


