
Grutzen Watches
Executive Summary
Grutzen Watches is a start-up watch producer and distribution company. Its strategy is to serve the upscale niche markets of the watch industry. It will capitalize on the German engineering and manufacturing used to build the watches. There are many untapped potential markets within this industry that desire high-quality, stylish goods, but do not think they can afford them or do not know where to purchase them.
It is the firm’s intention to build and export its products to the United States and to make Grutzen Watches the number one selling European watch in the Western U.S. To do this the company’s long-term goals are to to achieve a 20% market share in the U.S, build brand image and brand equity through marketing, achieve a sustainable 55% profit margin, and eventually produce luxury watches in addition to the initial, moderately-priced line.
The Company
Grutzen Watches is a privately-held international corporation. Production takes place in Germany and sales and marketing are focused on the United States – California – for the short-term future.
Ownership is divided among three principal individuals who are putting up the initial investment. These include: Franz Grutzen – head of production department, Henry Winster – head of American division and sales and marketing division, and Walter Young – vice president of American division.
The German factory is located at 210 Autoroute 17, Frankfurt, Germany. The factory is 1,000 square meters and should be large enough for the first three years of the company’s growth. The watches will be shipped to and distributed from Henry Winster’s house at 343 Palm Avenue in Los Angeles, California. The watches will be initially sold in upscale watch stores in Los Angeles and San Francisco.
Grutzen’s sales force will consist of Henry Winster and two freelancing sales representatives. Order processing will be achieved through communication between Henry Winster in the U.S. and Franz Grutzen in Germany.
The Products
The initial product line will be elegant analog watches with sporting characteristics, able to be used to depths of 100 meters under water. The company plans to release two versions, the “sport” watch and the “night” watch.
The pricing strategy will be to initially undercut our main competitors by 10%, using a market penetration strategy. Then, pricing will be adjusted to be directly competitive with the other major competitors. The price per watch is expected to be around $100-$200.
The Market
Entry into the high-end watch industry comes at a propitious time. Over the past two years, the purchase of mid-level and high-level European watches has increased by 50 percent in the U.S. and this trend is expected to continue.
One of the most important recent trends is that potential watch buyers are willing to spend higher amounts on watches because of the enhanced image appeal. Therefore, a company that can build a substantial brand image in this industry gains a significant competitive advantage. It is the aim of Grutzen to capitalize on its high quality and reasonable price while pursuing the innovative styles necessary for brand building.
Financial Considerations
The company’s start up costs will be ~$226,000. Owners’ equity will provide $171,000. Another $30,000 in funding will consist of short-term borrowing, and the rest will be long-term loans. The majority of the start-up costs will consist of rent, research and development, initial inventory, and a strong cash account. The Break-even Analysis shows Grutzen Watches will be able to make a steady profit by the second year.

1.1 Objectives
- To make Grutzen Watches the number one selling European watch.
- To eventually produce luxury watches in addition to the moderately priced line.
- To achieve a 55% profit margin.
- To achieve a 20% market share in the U.S.
1.2 Mission
Grutzen Watches is a watch company that produces wrist watches for sale in the United States – initially in California. The company will build its image as a quality watch first, and then will begin selling higher profit, luxury watches.
1.3 Keys to Success
To succeed Grutzen Watches must:
- Build and sell high quality products.
- Achieve 100% customer satisfaction.
- Build brand image and brand equity through marketing.
Company Summary
Grutzen Watches sells quality watches and provides excellent customer service for customers seeking a reliable watch. In the future Grutzen Watches intends to enter the luxury watch market.
2.1 Company Ownership
Grutzen Watches is a privately held international corporation. Production takes place in Germany and sales and marketing are focused on the United States – California for the short-term future.
Ownership:
- Franz Grutzen: 55% (Germany)
- Henry Winster: 30% (U.S.)
- Walter Young: 15% (U.S.)
2.2 Start-up Summary
Sixty percent (60%) of start-up costs will go to assets. Start-up costs will be financed through the owners’ investments, and loans. The assumptions are shown in the following table and chart.
*NOTE: The tables in this sample plan were converted from German deutschmarks to dollars. However, the numbers do not reflect current monetary exchange rates.
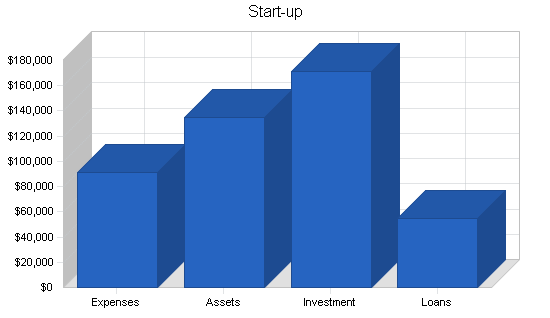
| Start-up | |
| Requirements | |
| Start-up Expenses | |
| Legal | $20,000 |
| Stationery etc. | $500 |
| Brochures | $3,000 |
| Consultants | $10,000 |
| Insurance | $10,000 |
| Rent | $20,000 |
| Research and Development | $10,000 |
| Expensed Equipment | $10,000 |
| Other | $7,500 |
| Total Start-up Expenses | $91,000 |
| Start-up Assets | |
| Cash Required | $70,000 |
| Start-up Inventory | $25,000 |
| Other Current Assets | $5,000 |
| Long-term Assets | $35,000 |
| Total Assets | $135,000 |
| Total Requirements | $226,000 |
| Start-up Funding | |
| Start-up Expenses to Fund | $91,000 |
| Start-up Assets to Fund | $135,000 |
| Total Funding Required | $226,000 |
| Assets | |
| Non-cash Assets from Start-up | $65,000 |
| Cash Requirements from Start-up | $70,000 |
| Additional Cash Raised | $0 |
| Cash Balance on Starting Date | $70,000 |
| Total Assets | $135,000 |
| Liabilities and Capital | |
| Liabilities | |
| Current Borrowing | $30,000 |
| Long-term Liabilities | $20,000 |
| Accounts Payable (Outstanding Bills) | $5,000 |
| Other Current Liabilities (interest-free) | $0 |
| Total Liabilities | $55,000 |
| Capital | |
| Planned Investment | |
| Investor 1 | $100,000 |
| Investor 2 | $71,000 |
| Other | $0 |
| Additional Investment Requirement | $0 |
| Total Planned Investment | $171,000 |
| Loss at Start-up (Start-up Expenses) | ($91,000) |
| Total Capital | $80,000 |
| Total Capital and Liabilities | $135,000 |
| Total Funding | $226,000 |
2.3 Company Locations and Facilities
- The German factory is located at 210 Autoroute 17, Frankfurt, Germany.
- The factory is 1000 square meters and should be large enough for the first three years of the company’s growth.
- The watches will be shipped to and distributed from Henry Winster’s house at 343 Palm Avenue in Los Angeles, California.
- The watches will be initially sold in upscale watch stores in Los Angeles and San Francisco.
Products
The watches will be mid-level all-around high-quality sports watches.
The price will be very competitive: $100-$200.
3.1 Product Description
Grutzen Watches are elegant analog watches with sporting characteristics, able to be used to depths of 100 meters under water.
- The “sport” watch will be made of a durable steel and hard rubber combination that will provide both style and durability.
- The “night” watch will be all black including the face with minimal white writing for the numbers on the face and will feature white hands as well.
3.2 Competitive Comparison
Grutzen Watches will have the following sustainable competitive advantages:
- German technology, experience, proficiency, and reputation.
- High quality at a moderate price.
- Elegant and ergonomic styling.
- Devoted German work force.
- American marketing skills.
3.3 Sales Literature
Grutzen Watches will use advertising, public relations, and sales programs to make the public aware of the watches.
- Advertisements and public relations pieces in local newspapers – particularly The Los Angeles Times and The San Francisco Chronicle.
- Full-color brochures will be distributed at the various outlets where the watches are sold.
3.4 Sourcing
Grutzen Watches will only sell watches produced at its German factory, therefore additional sourcing of watches will not be necessary. However, the sourcing of parts for the manufacturing of the watches will play a constant role in the firm’s profitability. Initially, most parts will be sourced from Eastern European suppliers, as the exchange rate is very beneficial for those purchasing with German Marks.

3.5 Technology
PC-based software will be used for accounts receivable/payable, inventory, purchasing, sales, shipping, and returns.
This business plan uses Business Plan Pro from Palo Alto Software, Inc. and it will be reviewed and updated as necessary.
3.6 Future Products
A luxury watch is the current main focus for a future product. Other future products could include alarm clocks, wall clocks, and clocks for luxury automobiles built in Germany.
Market Analysis Summary
The purchase of mid-level and high-level European watches has increased by 50 percent over the past two years. We expect the sales to continue growing, and to capitalize on this ever-present market for watches – people will always need and buy watches.
4.1 Market Segmentation
The market segmentation is divided into the leading target markets. The division reflects the differences in marketing strategy that will be used to target each different market.
- The “yuppies” who enjoy being the first on their block to have a new, “chic” and “hip” product.
- The “yuppies” who follow trends and buy products that everyone else has.
- Older adults who simply have good taste and a sense of style.
- Wealthier college students.
- Still fashionable senior citizens.
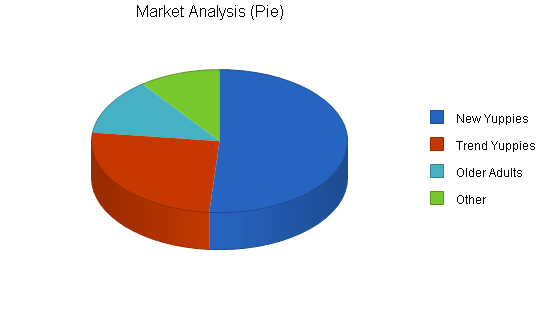
| Market Analysis | |||||||
| Year 1 | Year 2 | Year 3 | Year 4 | Year 5 | |||
| Potential Customers | Growth | CAGR | |||||
| New Yuppies | 5% | 100,000 | 105,000 | 110,250 | 115,763 | 121,551 | 5.00% |
| Trend Yuppies | 2% | 50,000 | 51,000 | 52,020 | 53,060 | 54,121 | 2.00% |
| Older Adults | 5% | 25,000 | 26,250 | 27,563 | 28,941 | 30,388 | 5.00% |
| Other | 4% | 20,000 | 20,800 | 21,632 | 22,497 | 23,397 | 4.00% |
| Total | 4.15% | 195,000 | 203,050 | 211,465 | 220,261 | 229,457 | 4.15% |
4.2 Target Market Segment Strategy
The watch industry, particularly the upscale markets, is growing faster than ever. Potential watch buyers are willing to spend moderate to high amounts on watches because they can make the customer look good – and hence feel good about themselves. In addition, Grutzen Watches will be built to last a lifetime – battery replacement every ten years will be the only necessary maintenance, therefore customers will see the inherent value in the watches.
The upscale niche market that Grutzen Watches has targeted is competitive because of the competitors and the discerning consumers it serves. However, the competition is based more on quality than price unlike the discount market.
4.2.1 Market Needs
The upscale watch industry is currently in a growth period, so now is an ideal time for entry.
4.2.2 Market Trends
Henry Winster will distribute the watches to Los Angeles and San Francisco outlets from his residence in Los Angeles.
- The cost of marketing the new product is expected to be the biggest challenge for Grutzen. The initial use of Henry Winster’s facilities as a distribution channel will allow for cost savings.
- The lack of an existing recognized brand name will be an initial problem, but in a few years Grutzen Watches intends to have achieved powerful brand equity – allowing it to rely on, and succeed because of its brand name.
4.2.3 Market Growth
The leading competitor is Swiss Army Watches.
Consumers often only buy a new watch every 5 to 10 years, yet they purchase them often as gifts. Therefore, advertising will be increased during the Christmas holiday season.
The intended retail outlets are full price and full service, therefore Grutzen will not need to use an extreme price penetration strategy to gain a foothold in the market.
4.2.4 Main Competitors
Our main competitor is Swiss Army Watches. Our next closest competitor is Tag Heuer. Both of these firms have strong brand equity, but there is room in this market for a new company as brand loyalty is not high on potential consumers’ reasons for purchasing.
Strategy and Implementation Summary
Grutzen Watches’ strategy is to serve niche markets of the watch industry. It will capitalize on the German engineering and manufacturing used to build the watches. There are many untapped potential markets that desire high-quality goods, but do not think they can afford them or do not know where to purchase them. Grutzen Watches’ marketing strategy will alleviate this problem.
5.1 Marketing Strategy
The marketing strategy will focus on two segments:
- The company will benchmark the objectives for promotion, outlet selling, and personal selling.
- The marketing budget will be $36,000 per year.
5.1.1 Pricing Strategy
The pricing strategy will be to initially undercut our main competitors by 10%, using a market penetration strategy. Then, pricing will be adjusted to be directly competitive with the other major competitors.
5.1.2 Promotion Strategy
Promotion will be initially spearheaded by public relations because of its low cost, and then through advertising once the company begins to increase cash flow to an acceptable figure.
5.2 Sales Strategy
Grutzen’s sales force will consist of Henry Winster and two freelancing sales representatives. Order processing will be achieved through communication between Henry Winster in the U.S. and Franz Grutzen in Germany.
5.2.1 Sales Forecast
The following table and chart show our present sales forecast.
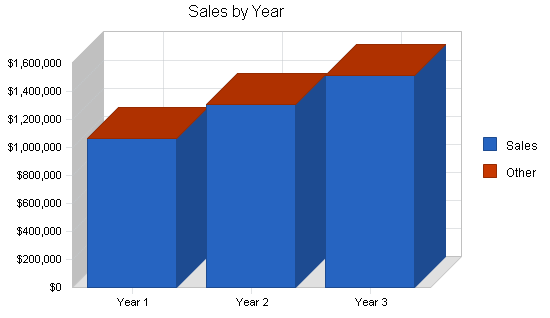
| Sales Forecast | |||
| Year 1 | Year 2 | Year 3 | |
| Sales | |||
| Sales | $1,066,000 | $1,307,000 | $1,515,000 |
| Other | $0 | $0 | $0 |
| Total Sales | $1,066,000 | $1,307,000 | $1,515,000 |
| Direct Cost of Sales | Year 1 | Year 2 | Year 3 |
| Sales | $410,000 | $500,000 | $610,000 |
| Other | $0 | $0 | $0 |
| Subtotal Direct Cost of Sales | $410,000 | $500,000 | $610,000 |
5.2.2 Sales Programs
Sales will be made by Henry Winster and the sales reps. Outlets that achieve the highest figures in sales will receive 2% discounts in order to encourage increasing sales.
5.3 Milestones
This table lists important program milestones, with dates and managers in charge and budgets for each. The milestone schedule indicates our emphasis on planning for implementation.
| Milestones | |||||
| Milestone | Start Date | End Date | Budget | Manager | Department |
| Business Plan | 4/16/1998 | 4/16/1998 | $4,000 | FG | Devpt |
| Factory Selection | 5/5/1998 | 5/5/1998 | $6,000 | FG | Finance |
| Retainer Contracts | 6/1/1998 | 6/1/1998 | $2,500 | HW | Sales |
| Brochures | 6/11/1998 | 6/11/1998 | $5,500 | HW | Marketing |
| Copywrite | 6/28/1998 | 6/28/1998 | $6,500 | WY | Legal |
| Totals | $24,500 | ||||
Management Summary
Grutzen Watches is currently not hiring any more employees. The decision has been made to postpone further hiring until the company begins to succeed.
After approximately one year, two employees will be added to the current six.
6.1 Organizational Structure
Grutzen Watches is split by both location and functionality. The production division is located in Germany where the factory is, and run by Franz Grutzen. The sales and marketing, and finance and administration divisions are located in Los Angeles and are run by Henry Winster and Walter Young.
6.2 Management Team
Franz Grutzen: president, founder, and head of production department. Grutzen was president of production at Swiss Army Watches before he decided to return to his native Germany to start his own company. He graduated from the University of Frankfurt, and received an MBA at The University of Paris at Sorbonne. Forty-eight years old, no children.
Henry Winster: head of american division and sales and marketing division. He has worked and co-owned Wright and Winster, an advertising agency, for fifteen years. BA from USC, MBA from Stanford. Fifty-six years old, three children.
Walter Young: vice president of american division. He was previously vice president of operations at Greentree Sports in Phoenix, AZ. He received his BA from Emory University and his MBA from UCLA.
6.3 Management Team Gaps
The following important gaps exist:
- The present team has little sales experience.
- There is no current in-house designer – this should be corrected within a year.
- There is no international manager.
6.4 Personnel Plan
The personnel plan calls for adding two employees by the end of the first year for a total of eight. After the second year, employment is expected to increase by another four. These new employees will go into production and sales.
| Personnel Plan | |||
| Year 1 | Year 2 | Year 3 | |
| President | $72,000 | $77,000 | $82,000 |
| Head of American Division | $66,000 | $70,000 | $74,000 |
| Vice President American Division | $54,000 | $58,000 | $62,000 |
| Other | $104,400 | $118,000 | $131,000 |
| Total People | 6 | 8 | 8 |
| Total Payroll | $296,400 | $323,000 | $349,000 |
Financial Plan
Growth will be supported by cash flow and owner investment. This will keep initial growth slow and manageable, and will allow the management to have complete control over the firm.
7.1 Important Assumptions
Grutzen’s financial plan relies on several important assumptions – most of which are shown in the following table.
The key assumptions are:
- Sufficient access to capital.
- Steady economy without a major recession.
- No unforeseen drastic technology changes.
| General Assumptions | |||
| Year 1 | Year 2 | Year 3 | |
| Plan Month | 1 | 2 | 3 |
| Current Interest Rate | 10.00% | 10.00% | 10.00% |
| Long-term Interest Rate | 9.00% | 9.00% | 9.00% |
| Tax Rate | 25.42% | 25.00% | 25.42% |
| Other | 0 | 0 | 0 |
7.2 Key Financial Indicators
- Keeping average collection days at 60 days or below is very important as this could become a major cause of cash flow problems for the first year.
- Gross margins must remain above 55%.

7.3 Break-even Analysis
The Break-even Analysis chart and table show that if the costs stay at the current, or relatively stable, level Grutzen Watches will be able to make a steady profit by the second year.

| Break-even Analysis | |
| Monthly Revenue Break-even | $74,602 |
| Assumptions: | |
| Average Percent Variable Cost | 38% |
| Estimated Monthly Fixed Cost | $45,909 |
7.4 Projected Profit and Loss
The following table and chart shows Grutzen’s expectations for profit and loss. The company will begin to make a profit in its second year of operation.

| Pro Forma Profit and Loss | |||
| Year 1 | Year 2 | Year 3 | |
| Sales | $1,066,000 | $1,307,000 | $1,515,000 |
| Direct Cost of Sales | $410,000 | $500,000 | $610,000 |
| Other | $33,000 | $38,000 | $43,000 |
| Total Cost of Sales | $443,000 | $538,000 | $653,000 |
| Gross Margin | $623,000 | $769,000 | $862,000 |
| Gross Margin % | 58.44% | 58.84% | 56.90% |
| Expenses | |||
| Payroll | $296,400 | $323,000 | $349,000 |
| Sales and Marketing and Other Expenses | $100,675 | $112,900 | $129,200 |
| Depreciation | $3,504 | $3,500 | $3,500 |
| Leased Equipment | $72,000 | $80,000 | $81,000 |
| Utilities | $6,325 | $7,000 | $8,000 |
| Insurance | $18,000 | $21,000 | $23,000 |
| Rent | $48,000 | $51,000 | $55,000 |
| Other | $6,000 | $6,300 | $6,500 |
| Payroll Taxes | $0 | $0 | $0 |
| Other | $0 | $0 | $0 |
| Total Operating Expenses | $550,904 | $604,700 | $655,200 |
| Profit Before Interest and Taxes | $72,096 | $164,300 | $206,800 |
| EBITDA | $75,600 | $167,800 | $210,300 |
| Interest Expense | $6,180 | $2,810 | $900 |
| Taxes Incurred | $16,480 | $40,373 | $52,333 |
| Net Profit | $49,437 | $121,118 | $153,567 |
| Net Profit/Sales | 4.64% | 9.27% | 10.14% |
7.5 Projected Cash Flow
Cash flow will be managed with a revolving line of credit. We expect to borrow $41,000 in the first year to cover our receivables.

| Pro Forma Cash Flow | |||
| Year 1 | Year 2 | Year 3 | |
| Cash Received | |||
| Cash from Operations | |||
| Cash Sales | $533,000 | $653,500 | $757,500 |
| Cash from Receivables | $453,350 | $635,493 | $741,959 |
| Subtotal Cash from Operations | $986,350 | $1,288,993 | $1,499,459 |
| Additional Cash Received | |||
| Sales Tax, VAT, HST/GST Received | $0 | $0 | $0 |
| New Current Borrowing | $41,000 | $0 | $0 |
| New Other Liabilities (interest-free) | $0 | $0 | $0 |
| New Long-term Liabilities | $0 | $0 | $0 |
| Sales of Other Current Assets | $0 | $0 | $0 |
| Sales of Long-term Assets | $0 | $0 | $0 |
| New Investment Received | $0 | $0 | $0 |
| Subtotal Cash Received | $1,027,350 | $1,288,993 | $1,499,459 |
| Expenditures | Year 1 | Year 2 | Year 3 |
| Expenditures from Operations | |||
| Cash Spending | $296,400 | $323,000 | $349,000 |
| Bill Payments | $677,740 | $849,960 | $1,005,944 |
| Subtotal Spent on Operations | $974,140 | $1,172,960 | $1,354,944 |
| Additional Cash Spent | |||
| Sales Tax, VAT, HST/GST Paid Out | $0 | $0 | $0 |
| Principal Repayment of Current Borrowing | $40,000 | $31,000 | $0 |
| Other Liabilities Principal Repayment | $0 | $0 | $0 |
| Long-term Liabilities Principal Repayment | $4,000 | $4,000 | $4,000 |
| Purchase Other Current Assets | $0 | $0 | $0 |
| Purchase Long-term Assets | $0 | $0 | $0 |
| Dividends | $0 | $0 | $0 |
| Subtotal Cash Spent | $1,018,140 | $1,207,960 | $1,358,944 |
| Net Cash Flow | $9,210 | $81,033 | $140,515 |
| Cash Balance | $79,210 | $160,243 | $300,758 |
7.6 Projected Balance Sheet
As seen in the balance sheet, a strong growth in net worth is expected over the next three years.
| Pro Forma Balance Sheet | |||
| Year 1 | Year 2 | Year 3 | |
| Assets | |||
| Current Assets | |||
| Cash | $79,210 | $160,243 | $300,758 |
| Accounts Receivable | $79,650 | $97,657 | $113,199 |
| Inventory | $35,200 | $42,927 | $52,371 |
| Other Current Assets | $5,000 | $5,000 | $5,000 |
| Total Current Assets | $199,060 | $305,827 | $471,327 |
| Long-term Assets | |||
| Long-term Assets | $35,000 | $35,000 | $35,000 |
| Accumulated Depreciation | $3,504 | $7,004 | $10,504 |
| Total Long-term Assets | $31,496 | $27,996 | $24,496 |
| Total Assets | $230,556 | $333,823 | $495,823 |
| Liabilities and Capital | Year 1 | Year 2 | Year 3 |
| Current Liabilities | |||
| Accounts Payable | $54,120 | $71,269 | $83,702 |
| Current Borrowing | $31,000 | $0 | $0 |
| Other Current Liabilities | $0 | $0 | $0 |
| Subtotal Current Liabilities | $85,120 | $71,269 | $83,702 |
| Long-term Liabilities | $16,000 | $12,000 | $8,000 |
| Total Liabilities | $101,120 | $83,269 | $91,702 |
| Paid-in Capital | $171,000 | $171,000 | $171,000 |
| Retained Earnings | ($91,000) | ($41,563) | $79,554 |
| Earnings | $49,437 | $121,118 | $153,567 |
| Total Capital | $129,437 | $250,554 | $404,121 |
| Total Liabilities and Capital | $230,556 | $333,823 | $495,823 |
| Net Worth | $129,437 | $250,554 | $404,121 |
7.7 Business Ratios
Standard business ratios are provided in the following table. The ratios show a strong, yet safe growth. Industry Profile ratios are based on Standard Industrial Classification (SIC) Index code 3873.
| Ratio Analysis | ||||
| Year 1 | Year 2 | Year 3 | Industry Profile | |
| Sales Growth | 0.00% | 22.61% | 15.91% | 3.90% |
| Percent of Total Assets | ||||
| Accounts Receivable | 34.55% | 29.25% | 22.83% | 27.20% |
| Inventory | 15.27% | 12.86% | 10.56% | 29.70% |
| Other Current Assets | 2.17% | 1.50% | 1.01% | 26.70% |
| Total Current Assets | 86.34% | 91.61% | 95.06% | 83.60% |
| Long-term Assets | 13.66% | 8.39% | 4.94% | 16.40% |
| Total Assets | 100.00% | 100.00% | 100.00% | 100.00% |
| Current Liabilities | 36.92% | 21.35% | 16.88% | 36.30% |
| Long-term Liabilities | 6.94% | 3.59% | 1.61% | 19.00% |
| Total Liabilities | 43.86% | 24.94% | 18.49% | 55.30% |
| Net Worth | 56.14% | 75.06% | 81.51% | 44.70% |
| Percent of Sales | ||||
| Sales | 100.00% | 100.00% | 100.00% | 100.00% |
| Gross Margin | 58.44% | 58.84% | 56.90% | 34.40% |
| Selling, General & Administrative Expenses | 58.66% | 54.01% | 50.88% | 23.80% |
| Advertising Expenses | 3.38% | 3.21% | 3.17% | 0.70% |
| Profit Before Interest and Taxes | 6.76% | 12.57% | 13.65% | 1.70% |
| Main Ratios | ||||
| Current | 2.34 | 4.29 | 5.63 | 2.42 |
| Quick | 1.93 | 3.69 | 5.01 | 1.31 |
| Total Debt to Total Assets | 43.86% | 24.94% | 18.49% | 55.30% |
| Pre-tax Return on Net Worth | 50.93% | 64.45% | 50.95% | 2.10% |
| Pre-tax Return on Assets | 28.59% | 48.38% | 41.53% | 4.80% |
| Additional Ratios | Year 1 | Year 2 | Year 3 | |
| Net Profit Margin | 4.64% | 9.27% | 10.14% | n.a |
| Return on Equity | 38.19% | 48.34% | 38.00% | n.a |
| Activity Ratios | ||||
| Accounts Receivable Turnover | 6.69 | 6.69 | 6.69 | n.a |
| Collection Days | 58 | 50 | 51 | n.a |
| Inventory Turnover | 10.91 | 12.80 | 12.80 | n.a |
| Accounts Payable Turnover | 13.43 | 12.17 | 12.17 | n.a |
| Payment Days | 27 | 26 | 28 | n.a |
| Total Asset Turnover | 4.62 | 3.92 | 3.06 | n.a |
| Debt Ratios | ||||
| Debt to Net Worth | 0.78 | 0.33 | 0.23 | n.a |
| Current Liab. to Liab. | 0.84 | 0.86 | 0.91 | n.a |
| Liquidity Ratios | ||||
| Net Working Capital | $113,941 | $234,558 | $387,625 | n.a |
| Interest Coverage | 11.67 | 58.47 | 229.78 | n.a |
| Additional Ratios | ||||
| Assets to Sales | 0.22 | 0.26 | 0.33 | n.a |
| Current Debt/Total Assets | 37% | 21% | 17% | n.a |
| Acid Test | 0.99 | 2.32 | 3.65 | n.a |
| Sales/Net Worth | 8.24 | 5.22 | 3.75 | n.a |
| Dividend Payout | 0.00 | 0.00 | 0.00 | n.a |
Appendix
| Sales Forecast | |||||||||||||
| Month 1 | Month 2 | Month 3 | Month 4 | Month 5 | Month 6 | Month 7 | Month 8 | Month 9 | Month 10 | Month 11 | Month 12 | ||
| Sales | |||||||||||||
| Sales | 0% | $81,000 | $81,000 | $81,000 | $175,000 | $81,000 | $81,000 | $81,000 | $81,000 | $81,000 | $81,000 | $81,000 | $81,000 |
| Other | 0% | $0 | $0 | $0 | $0 | $0 | $0 | $0 | $0 | $0 | $0 | $0 | $0 |
| Total Sales | $81,000 | $81,000 | $81,000 | $175,000 | $81,000 | $81,000 | $81,000 | $81,000 | $81,000 | $81,000 | $81,000 | $81,000 | |
| Direct Cost of Sales | Month 1 | Month 2 | Month 3 | Month 4 | Month 5 | Month 6 | Month 7 | Month 8 | Month 9 | Month 10 | Month 11 | Month 12 | |
| Sales | $32,000 | $32,000 | $32,000 | $58,000 | $32,000 | $32,000 | $32,000 | $32,000 | $32,000 | $32,000 | $32,000 | $32,000 | |
| Other | $0 | $0 | $0 | $0 | $0 | $0 | $0 | $0 | $0 | $0 | $0 | $0 | |
| Subtotal Direct Cost of Sales | $32,000 | $32,000 | $32,000 | $58,000 | $32,000 | $32,000 | $32,000 | $32,000 | $32,000 | $32,000 | $32,000 | $32,000 | |
| Personnel Plan | |||||||||||||
| Month 1 | Month 2 | Month 3 | Month 4 | Month 5 | Month 6 | Month 7 | Month 8 | Month 9 | Month 10 | Month 11 | Month 12 | ||
| President | 0% | $6,000 | $6,000 | $6,000 | $6,000 | $6,000 | $6,000 | $6,000 | $6,000 | $6,000 | $6,000 | $6,000 | $6,000 |
| Head of American Division | 0% | $5,500 | $5,500 | $5,500 | $5,500 | $5,500 | $5,500 | $5,500 | $5,500 | $5,500 | $5,500 | $5,500 | $5,500 |
| Vice President American Division | 0% | $4,500 | $4,500 | $4,500 | $4,500 | $4,500 | $4,500 | $4,500 | $4,500 | $4,500 | $4,500 | $4,500 | $4,500 |
| Other | 0% | $8,700 | $8,700 | $8,700 | $8,700 | $8,700 | $8,700 | $8,700 | $8,700 | $8,700 | $8,700 | $8,700 | $8,700 |
| Total People | 6 | 6 | 6 | 6 | 6 | 6 | 6 | 6 | 6 | 6 | 6 | 6 | |
| Total Payroll | $24,700 | $24,700 | $24,700 | $24,700 | $24,700 | $24,700 | $24,700 | $24,700 | $24,700 | $24,700 | $24,700 | $24,700 | |
| General Assumptions | |||||||||||||
| Month 1 | Month 2 | Month 3 | Month 4 | Month 5 | Month 6 | Month 7 | Month 8 | Month 9 | Month 10 | Month 11 | Month 12 | ||
| Plan Month | 1 | 2 | 3 | 4 | 5 | 6 | 7 | 8 | 9 | 10 | 11 | 12 | |
| Current Interest Rate | 10.00% | 10.00% | 10.00% | 10.00% | 10.00% | 10.00% | 10.00% | 10.00% | 10.00% | 10.00% | 10.00% | 10.00% | |
| Long-term Interest Rate | 9.00% | 9.00% | 9.00% | 9.00% | 9.00% | 9.00% | 9.00% | 9.00% | 9.00% | 9.00% | 9.00% | 9.00% | |
| Tax Rate | 30.00% | 25.00% | 25.00% | 25.00% | 25.00% | 25.00% | 25.00% | 25.00% | 25.00% | 25.00% | 25.00% | 25.00% | |
| Other | 0 | 0 | 0 | 0 | 0 | 0 | 0 | 0 | 0 | 0 | 0 | 0 | |
| Pro Forma Profit and Loss | |||||||||||||
| Month 1 | Month 2 | Month 3 | Month 4 | Month 5 | Month 6 | Month 7 | Month 8 | Month 9 | Month 10 | Month 11 | Month 12 | ||
| Sales | $81,000 | $81,000 | $81,000 | $175,000 | $81,000 | $81,000 | $81,000 | $81,000 | $81,000 | $81,000 | $81,000 | $81,000 | |
| Direct Cost of Sales | $32,000 | $32,000 | $32,000 | $58,000 | $32,000 | $32,000 | $32,000 | $32,000 | $32,000 | $32,000 | $32,000 | $32,000 | |
| Other | $2,750 | $2,750 | $2,750 | $2,750 | $2,750 | $2,750 | $2,750 | $2,750 | $2,750 | $2,750 | $2,750 | $2,750 | |
| Total Cost of Sales | $34,750 | $34,750 | $34,750 | $60,750 | $34,750 | $34,750 | $34,750 | $34,750 | $34,750 | $34,750 | $34,750 | $34,750 | |
| Gross Margin | $46,250 | $46,250 | $46,250 | $114,250 | $46,250 | $46,250 | $46,250 | $46,250 | $46,250 | $46,250 | $46,250 | $46,250 | |
| Gross Margin % | 57.10% | 57.10% | 57.10% | 65.29% | 57.10% | 57.10% | 57.10% | 57.10% | 57.10% | 57.10% | 57.10% | 57.10% | |
| Expenses | |||||||||||||
| Payroll | $24,700 | $24,700 | $24,700 | $24,700 | $24,700 | $24,700 | $24,700 | $24,700 | $24,700 | $24,700 | $24,700 | $24,700 | |
| Sales and Marketing and Other Expenses | $8,350 | $8,350 | $8,350 | $8,900 | $8,275 | $8,350 | $8,350 | $8,350 | $8,350 | $8,350 | $8,350 | $8,350 | |
| Depreciation | $292 | $292 | $292 | $292 | $292 | $292 | $292 | $292 | $292 | $292 | $292 | $292 | |
| Leased Equipment | $6,000 | $6,000 | $6,000 | $6,000 | $6,000 | $6,000 | $6,000 | $6,000 | $6,000 | $6,000 | $6,000 | $6,000 | |
| Utilities | $500 | $500 | $550 | $600 | $575 | $550 | $500 | $500 | $500 | $500 | $550 | $500 | |
| Insurance | $1,500 | $1,500 | $1,500 | $1,500 | $1,500 | $1,500 | $1,500 | $1,500 | $1,500 | $1,500 | $1,500 | $1,500 | |
| Rent | $4,000 | $4,000 | $4,000 | $4,000 | $4,000 | $4,000 | $4,000 | $4,000 | $4,000 | $4,000 | $4,000 | $4,000 | |
| Other | $500 | $500 | $500 | $500 | $500 | $500 | $500 | $500 | $500 | $500 | $500 | $500 | |
| Payroll Taxes | 12% | $0 | $0 | $0 | $0 | $0 | $0 | $0 | $0 | $0 | $0 | $0 | $0 |
| Other | $0 | $0 | $0 | $0 | $0 | $0 | $0 | $0 | $0 | $0 | $0 | $0 | |
| Total Operating Expenses | $45,842 | $45,842 | $45,892 | $46,492 | $45,842 | $45,892 | $45,842 | $45,842 | $45,842 | $45,842 | $45,892 | $45,842 | |
| Profit Before Interest and Taxes | $408 | $408 | $358 | $67,758 | $408 | $358 | $408 | $408 | $408 | $408 | $358 | $408 | |
| EBITDA | $700 | $700 | $650 | $68,050 | $700 | $650 | $700 | $700 | $700 | $700 | $650 | $700 | |
| Interest Expense | $397 | $395 | $392 | $732 | $729 | $727 | $557 | $555 | $552 | $383 | $381 | $378 | |
| Taxes Incurred | $3 | $3 | ($9) | $16,757 | ($80) | ($92) | ($37) | ($37) | ($36) | $6 | ($6) | $7 | |
| Net Profit | $7 | $10 | ($26) | $50,270 | ($241) | ($276) | ($112) | ($110) | ($108) | $19 | ($17) | $22 | |
| Net Profit/Sales | 0.01% | 0.01% | -0.03% | 28.73% | -0.30% | -0.34% | -0.14% | -0.14% | -0.13% | 0.02% | -0.02% | 0.03% | |
| Pro Forma Cash Flow | |||||||||||||
| Month 1 | Month 2 | Month 3 | Month 4 | Month 5 | Month 6 | Month 7 | Month 8 | Month 9 | Month 10 | Month 11 | Month 12 | ||
| Cash Received | |||||||||||||
| Cash from Operations | |||||||||||||
| Cash Sales | $40,500 | $40,500 | $40,500 | $87,500 | $40,500 | $40,500 | $40,500 | $40,500 | $40,500 | $40,500 | $40,500 | $40,500 | |
| Cash from Receivables | $0 | $1,350 | $40,500 | $40,500 | $42,067 | $85,933 | $40,500 | $40,500 | $40,500 | $40,500 | $40,500 | $40,500 | |
| Subtotal Cash from Operations | $40,500 | $41,850 | $81,000 | $128,000 | $82,567 | $126,433 | $81,000 | $81,000 | $81,000 | $81,000 | $81,000 | $81,000 | |
| Additional Cash Received | |||||||||||||
| Sales Tax, VAT, HST/GST Received | 0.00% | $0 | $0 | $0 | $0 | $0 | $0 | $0 | $0 | $0 | $0 | $0 | $0 |
| New Current Borrowing | $0 | $0 | $0 | $41,000 | $0 | $0 | $0 | $0 | $0 | $0 | $0 | $0 | |
| New Other Liabilities (interest-free) | $0 | $0 | $0 | $0 | $0 | $0 | $0 | $0 | $0 | $0 | $0 | $0 | |
| New Long-term Liabilities | $0 | $0 | $0 | $0 | $0 | $0 | $0 | $0 | $0 | $0 | $0 | $0 | |
| Sales of Other Current Assets | $0 | $0 | $0 | $0 | $0 | $0 | $0 | $0 | $0 | $0 | $0 | $0 | |
| Sales of Long-term Assets | $0 | $0 | $0 | $0 | $0 | $0 | $0 | $0 | $0 | $0 | $0 | $0 | |
| New Investment Received | $0 | $0 | $0 | $0 | $0 | $0 | $0 | $0 | $0 | $0 | $0 | $0 | |
| Subtotal Cash Received | $40,500 | $41,850 | $81,000 | $169,000 | $82,567 | $126,433 | $81,000 | $81,000 | $81,000 | $81,000 | $81,000 | $81,000 | |
| Expenditures | Month 1 | Month 2 | Month 3 | Month 4 | Month 5 | Month 6 | Month 7 | Month 8 | Month 9 | Month 10 | Month 11 | Month 12 | |
| Expenditures from Operations | |||||||||||||
| Cash Spending | $24,700 | $24,700 | $24,700 | $24,700 | $24,700 | $24,700 | $24,700 | $24,700 | $24,700 | $24,700 | $24,700 | $24,700 | |
| Bill Payments | $7,207 | $65,861 | $55,999 | $58,444 | $124,982 | $28,603 | $56,279 | $56,120 | $56,118 | $56,112 | $55,991 | $56,024 | |
| Subtotal Spent on Operations | $31,907 | $90,561 | $80,699 | $83,144 | $149,682 | $53,303 | $80,979 | $80,820 | $80,818 | $80,812 | $80,691 | $80,724 | |
| Additional Cash Spent | |||||||||||||
| Sales Tax, VAT, HST/GST Paid Out | $0 | $0 | $0 | $0 | $0 | $0 | $0 | $0 | $0 | $0 | $0 | $0 | |
| Principal Repayment of Current Borrowing | $0 | $0 | $0 | $0 | $0 | $0 | $20,000 | $0 | $0 | $20,000 | $0 | $0 | |
| Other Liabilities Principal Repayment | $0 | $0 | $0 | $0 | $0 | $0 | $0 | $0 | $0 | $0 | $0 | $0 | |
| Long-term Liabilities Principal Repayment | $334 | $334 | $334 | $334 | $333 | $333 | $333 | $333 | $333 | $333 | $333 | $333 | |
| Purchase Other Current Assets | $0 | $0 | $0 | $0 | $0 | $0 | $0 | $0 | $0 | $0 | $0 | $0 | |
| Purchase Long-term Assets | $0 | $0 | $0 | $0 | $0 | $0 | $0 | $0 | $0 | $0 | $0 | $0 | |
| Dividends | $0 | $0 | $0 | $0 | $0 | $0 | $0 | $0 | $0 | $0 | $0 | $0 | |
| Subtotal Cash Spent | $32,241 | $90,895 | $81,033 | $83,478 | $150,015 | $53,636 | $101,312 | $81,153 | $81,151 | $101,145 | $81,024 | $81,057 | |
| Net Cash Flow | $8,259 | ($49,045) | ($33) | $85,522 | ($67,448) | $72,797 | ($20,312) | ($153) | ($151) | ($20,145) | ($24) | ($57) | |
| Cash Balance | $78,259 | $29,215 | $29,181 | $114,703 | $47,255 | $120,052 | $99,740 | $99,587 | $99,436 | $79,291 | $79,267 | $79,210 | |
| Pro Forma Balance Sheet | |||||||||||||
| Month 1 | Month 2 | Month 3 | Month 4 | Month 5 | Month 6 | Month 7 | Month 8 | Month 9 | Month 10 | Month 11 | Month 12 | ||
| Assets | Starting Balances | ||||||||||||
| Current Assets | |||||||||||||
| Cash | $70,000 | $78,259 | $29,215 | $29,181 | $114,703 | $47,255 | $120,052 | $99,740 | $99,587 | $99,436 | $79,291 | $79,267 | $79,210 |
| Accounts Receivable | $0 | $40,500 | $79,650 | $79,650 | $126,650 | $125,083 | $79,650 | $79,650 | $79,650 | $79,650 | $79,650 | $79,650 | $79,650 |
| Inventory | $25,000 | $35,200 | $35,200 | $35,200 | $63,800 | $35,200 | $35,200 | $35,200 | $35,200 | $35,200 | $35,200 | $35,200 | $35,200 |
| Other Current Assets | $5,000 | $5,000 | $5,000 | $5,000 | $5,000 | $5,000 | $5,000 | $5,000 | $5,000 | $5,000 | $5,000 | $5,000 | $5,000 |
| Total Current Assets | $100,000 | $158,959 | $149,065 | $149,031 | $310,153 | $212,538 | $239,902 | $219,590 | $219,437 | $219,286 | $199,141 | $199,117 | $199,060 |
| Long-term Assets | |||||||||||||
| Long-term Assets | $35,000 | $35,000 | $35,000 | $35,000 | $35,000 | $35,000 | $35,000 | $35,000 | $35,000 | $35,000 | $35,000 | $35,000 | $35,000 |
| Accumulated Depreciation | $0 | $292 | $584 | $876 | $1,168 | $1,460 | $1,752 | $2,044 | $2,336 | $2,628 | $2,920 | $3,212 | $3,504 |
| Total Long-term Assets | $35,000 | $34,708 | $34,416 | $34,124 | $33,832 | $33,540 | $33,248 | $32,956 | $32,664 | $32,372 | $32,080 | $31,788 | $31,496 |
| Total Assets | $135,000 | $193,667 | $183,481 | $183,155 | $343,985 | $246,078 | $273,150 | $252,546 | $252,101 | $251,658 | $231,221 | $230,905 | $230,556 |
| Liabilities and Capital | Month 1 | Month 2 | Month 3 | Month 4 | Month 5 | Month 6 | Month 7 | Month 8 | Month 9 | Month 10 | Month 11 | Month 12 | |
| Current Liabilities | |||||||||||||
| Accounts Payable | $5,000 | $63,994 | $54,132 | $54,166 | $124,060 | $26,727 | $54,408 | $54,249 | $54,248 | $54,246 | $54,123 | $54,158 | $54,120 |
| Current Borrowing | $30,000 | $30,000 | $30,000 | $30,000 | $71,000 | $71,000 | $71,000 | $51,000 | $51,000 | $51,000 | $31,000 | $31,000 | $31,000 |
| Other Current Liabilities | $0 | $0 | $0 | $0 | $0 | $0 | $0 | $0 | $0 | $0 | $0 | $0 | $0 |
| Subtotal Current Liabilities | $35,000 | $93,994 | $84,132 | $84,166 | $195,060 | $97,727 | $125,408 | $105,249 | $105,248 | $105,246 | $85,123 | $85,158 | $85,120 |
| Long-term Liabilities | $20,000 | $19,666 | $19,332 | $18,998 | $18,664 | $18,331 | $17,998 | $17,665 | $17,332 | $16,999 | $16,666 | $16,333 | $16,000 |
| Total Liabilities | $55,000 | $113,660 | $103,464 | $103,164 | $213,724 | $116,058 | $143,406 | $122,914 | $122,580 | $122,245 | $101,789 | $101,491 | $101,120 |
| Paid-in Capital | $171,000 | $171,000 | $171,000 | $171,000 | $171,000 | $171,000 | $171,000 | $171,000 | $171,000 | $171,000 | $171,000 | $171,000 | $171,000 |
| Retained Earnings | ($91,000) | ($91,000) | ($91,000) | ($91,000) | ($91,000) | ($91,000) | ($91,000) | ($91,000) | ($91,000) | ($91,000) | ($91,000) | ($91,000) | ($91,000) |
| Earnings | $0 | $7 | $17 | ($9) | $50,261 | $50,020 | $49,744 | $49,632 | $49,521 | $49,413 | $49,431 | $49,414 | $49,437 |
| Total Capital | $80,000 | $80,007 | $80,017 | $79,991 | $130,261 | $130,020 | $129,744 | $129,632 | $129,521 | $129,413 | $129,431 | $129,414 | $129,437 |
| Total Liabilities and Capital | $135,000 | $193,667 | $183,481 | $183,155 | $343,985 | $246,078 | $273,150 | $252,546 | $252,101 | $251,658 | $231,221 | $230,905 | $230,556 |
| Net Worth | $80,000 | $80,007 | $80,017 | $79,991 | $130,261 | $130,020 | $129,744 | $129,632 | $129,521 | $129,413 | $129,431 | $129,414 | $129,437 |

