
Executive Search and Rescue Firm
Executive Summary
Introduction
The Executive Search & Rescue Placement Firm (Executive) is an executive search firm that specializes in emerging companies, with an emphasis on high technology firms. Executive will be serving metropolitan Portland, an active, growing market. Through a well connected network of colleagues in the emerging company market niche, and a sophisticated predictive screening system, The Executive Search & Rescue Placement Firm will steadily gain market share.
To achieve the desired growth and profitability of the company, management goals are to have at least four of the top 10 fastest growing Oregon companies utilizing Executive’s services, and to increase the number of clients served by 20% through superior service.
The Company
Executive is an Oregon registered corporation, founded and owned by Mr. Dan Bloodhound. Mr Bloodhound has over ten years experience in the emerging company and high tech market with excellent contacts that he will leverage into future clients. Executive plans to place a wide range of executive positions, including programmers, project managers, CEO’s and CFO’s. Executive will work on a contingency basis, meaning that they will be paid on placement. This arrangement allows them to work for many different clients at the same time.
The staff will consist of Mr. Bloodhound working full time. Executive will hire a full-time secretary/receptionist in month two, a part-time generalist in month three, and a full-time account executive in month four. From month four until the foreseeable future, the organization will be able to survive with a four person headcount.
The Market
The Executive Search & Rescue Placement Firm will be targeting the emerging company market in the Portland metropolitan market. Portland will be targeted because 1) it is where Mr. Bloodhound’s network is located 2) Portland is a prime place for emerging companies, it is part of the silicon forest and has the most VC money on the West coast behind Seattle and the Bay area.
Executive is concentrating on emerging companies for the reason that emerging companies need executives more often than less growth oriented companies. As a company grows, there is an increased demand for leadership.
Within the emerging market, Executive will be targeting both high-technology firms and non-high-technology firms. The high tech firms make up the largest group of emerging companies, up to 80% of the market. Although most emerging companies are high tech, not all are and Executive can still provide value-added services for these companies and will not ignore them.
The Executive Search & Rescue Placement Firm’s marketing strategy will be based on advertising and networking. The advertising will done in the several local journals that cater to emerging businesses. The most prominent is the Business Journal of Portland which Executive will often have a presence in.

1.1 Objectives
The objectives for the first three years include:
- To create a service-based company whose primary goal is to exceed customers’ expectations.
- The utilization of Executive in at least four of the top 10 fastest growing Oregon companies as listed by the Business Journal of Portland.
- To increase the number of clients served by 20% through superior service.
- To become profitable within the first year of operation.
1.2 Mission
The Executive Search & Rescue Placement Firm’s mission is to service emerging companies with outstanding executives. We exist to attract and maintain customers. When we adhere to this maxim, everything else will fall in to place. Our services will exceed the expectations of our customers.
Company Summary
Executive, soon to be located in downtown Portland, is an executive search firm for emerging companies. While the majority of Executive’s clients will be high technology clients, Executive will be able to serve any type of fast growing company.
Executives’ extensive networking system will allow them to have a high placement ratio. Additionally, Executives sophisticated screening system will ensure that the placements will be long lived.
2.1 Company Ownership
Executive is an Oregon Corporation, founded and owned by Dan Bloodhound.
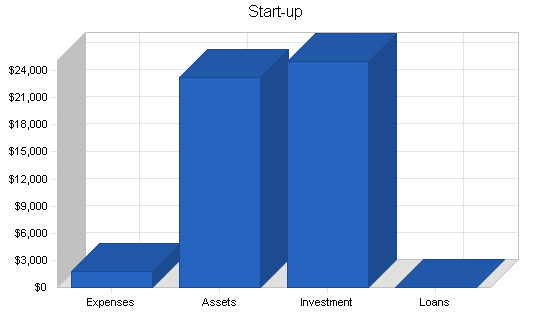
2.2 Start-up Summary
Executive will have the following start-up costs:
- Legal fees. For the formation of the business form as well as generation and review of assorted contracts.
- Office equipment. This includes desks, chairs, filing cabinets and couches, etc.
- Computer system. This will include the necessary computer equipment for a server and three workstations. Also needed will be a printer, CD-RW, and a DSL connection.
- Web creation fees. Executive will have a website and these are the costs associated with the development of the site.
- Advertising costs.
The assets that are used for more than a year will be listed as long-term assets and depreciated using the straight-line method.
| Start-up | |
| Requirements | |
| Start-up Expenses | |
| Legal | $1,000 |
| Stationery etc. | $250 |
| Brochures | $0 |
| Website Development | $500 |
| Insurance | $0 |
| Rent | $0 |
| Research and Development | $0 |
| Expensed Equipment | $0 |
| Other | $0 |
| Total Start-up Expenses | $1,750 |
| Start-up Assets | |
| Cash Required | $20,750 |
| Other Current Assets | $0 |
| Long-term Assets | $2,500 |
| Total Assets | $23,250 |
| Total Requirements | $25,000 |
| Start-up Funding | |
| Start-up Expenses to Fund | $1,750 |
| Start-up Assets to Fund | $23,250 |
| Total Funding Required | $25,000 |
| Assets | |
| Non-cash Assets from Start-up | $2,500 |
| Cash Requirements from Start-up | $20,750 |
| Additional Cash Raised | $0 |
| Cash Balance on Starting Date | $20,750 |
| Total Assets | $23,250 |
| Liabilities and Capital | |
| Liabilities | |
| Current Borrowing | $0 |
| Long-term Liabilities | $0 |
| Accounts Payable (Outstanding Bills) | $0 |
| Other Current Liabilities (interest-free) | $0 |
| Total Liabilities | $0 |
| Capital | |
| Planned Investment | |
| Dan | $25,000 |
| Investor 2 | $0 |
| Other | $0 |
| Additional Investment Requirement | $0 |
| Total Planned Investment | $25,000 |
| Loss at Start-up (Start-up Expenses) | ($1,750) |
| Total Capital | $23,250 |
| Total Capital and Liabilities | $23,250 |
| Total Funding | $25,000 |
Services
Executive will provide a wide range of placement services. Executive will specialize in the high-tech niche of emerging companies, but is equally competent for non-high tech companies. Executive can place a wide range of executive positions from CEO’s to CFO’s.
Executive works on a contingency basis, meaning that they are paid on placement. This arrangement allows them to work for many different clients at the same time.
Currently, there are approximately six different executive search firms in Portland. Because Portland is a part of the silicon forest, a hot bed of emerging technology firms, the market is growing at exciting rates.
Market Analysis Summary
The Executive Search & Rescue Placement Firm will be targeting the emerging company market in the Portland metropolitan market. Portland will be targeted because 1) it is where Dan’s network is located 2) Portland is a prime place for emerging companies, it is part of the silicon forest and has the most VC money on the West coast behind Seattle and the Bay area.
Within the emerging market, Executive will be targeting two groups, high-technology firms and non-high-technology firms. The high tech firms make up the largest group of emerging companies, up to 80% of the market. Those not in this segment, by default will be in the other group. Although most emerging companies are high tech, not all are and Executive can still provide value-added services for these companies and will not ignore them.
By virtue of Executive’s clients being emerging companies, they typically have the highest growth rate among other companies. Growing companies need more people and this is how Executive fits in, they help find people (executives) for these companies.
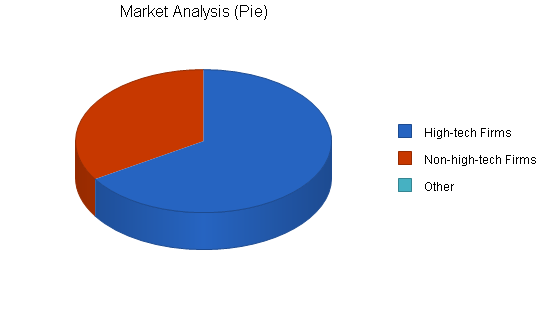
4.1 Market Segmentation
Our customers can be divided into two different groups:
- High-tech firms. The high-tech firm deals with some aspect of technology, it could be design, or manufacturing. These firms currently make up over 80% of the top 20 fastest growing companies in Oregon.
- Non-high-tech firms. While this category of emerging companies is far smaller then high-tech companies, it should by no means be neglected. There are plenty of fast growing companies in this segment and Executive will be able to serve them.

| Market Analysis | |||||||
| Year 1 | Year 2 | Year 3 | Year 4 | Year 5 | |||
| Potential Customers | Growth | CAGR | |||||
| High-tech Firms | 14% | 245 | 279 | 318 | 363 | 414 | 14.01% |
| Non-high-tech Firms | 10% | 126 | 139 | 153 | 168 | 185 | 10.08% |
| Other | 0% | 0 | 0 | 0 | 0 | 0 | 0.00% |
| Total | 12.72% | 371 | 418 | 471 | 531 | 599 | 12.72% |
4.2 Target Market Segment Strategy
Executive is concentrating on emerging companies for the intuitive reason that emerging companies need executives more often then more stagnant companies. As a company grows, there is an increased demand for leadership.
Within the emerging company label, there are predominantly high technology companies. While this has been tempered somewhat by the recent economic slowdown these companies are growing at astronomical rates.
An example at just how fast some companies are growing is a non-Oregon (for illustrative purposes) company called eBay. eBay’s CEO Meg Whitman used to be a executive at Hasboro Toys. After two years at eBay, Meg was worth more (from eBay stock) than the entire Hasboro family after over 30 years of business. Recently tech stocks have been hit, and eBay is no exception, however, they were hit less as they are a profitable Internet company. The point is that a lot of these companies are growing very fast and this is the perfect time and place for an executive search firm to fuel this growth.
4.3 Service Business Analysis
There are two business models for executive search firms:
- Retainer firms. These firms typically command 30-35% of the executives first year salary. The firm is paid regardless of finding a candidate. The benefit of using this firm is that the search firm is under extra pressure to find the right candidate and will spend extra time to get the person that “fits the bill.” This setup at the same time limits the number of positions that the search firm can look for at once, as they have an obligation to find the executive for the retainer fee. This is a more unusual set up.
- Contingency firms. This is the more common arrangement where a fee is paid when the search firm finds an appropriate candidate. The advantage to the client is that they only pay if services are rendered. This creates an economic incentive to perform, but when the company is in a hurry to find someone, the incentive is lost to some degree regarding speed. This set up is advantageous to the search firm because it allows them to search for a wide range of clients at once. The margins for the contingency model are generally the same as the retainer firms.
4.3.1 Competition and Buying Patterns
Portland currently has about six to 10 executive search firms. There are other search firms that handle many different positions other than executives.
Strategy and Implementation Summary
The Executive Search & Rescue Placement Firm’s marketing strategy will be based on advertising and networking. The advertising will done in the several local journals that cater to emerging businesses. The most prominent is the Business Journal of Portland which Executive will often have a presence in. The purpose of these advertisements is visibility for the executives looking for a firm for themselves. To some degree the advertisement will be geared toward bring companies on as clients, however, this will only be a secondary goal of the advertising. Executive will be relying on networking to set up companies as clients. As business continues, Executive’s track record will get more solid and its results will speak for themselves. This is the type of industry where associations counts for a lot, and when Executive scores a few big clients, many others will come through the door because they are impressed with who our clients are. This phenomenon is very similar to VC or Angel money, when the first investor steps up and contributes, the flood doors open for all the rest.
The marketing strategy will develop interest in the firm, while the sales strategy will then turn the leads into customers. This will be done with superior service based on interpersonal communication skills. The sales leads will call/inquire for more information and it will be the firm’s responsibility (initially Dan’s) to convince the lead that Executive would be a worthwhile investment of time based on the firm’s competitive advantages and track record (list of clients).
Lastly, Executive will have a website which will be a fairly comprehensive collection of information about Executive and the services they provide.
5.1 Competitive Edge
Executive has a two pronged competitive advantage that will allow it to rapidly gain market share:
- Networking. Dan has been in high-tech sales in Portland for the last 10 years. During this time Dan has gotten to know most of the key players in this intimate community. Additionally, Dan has been an active member in several of the Chambers of Commerce, the Portland Venture group, the Portland Angel Fund, and other organizations that are composed primarily of emerging companies. The activity in these organizations has allowed Dan to establish personal relationships with most of the emerging companies in the Portland area. This network presents a huge advantage in the executive search field. Other executive search firms certainly are connected with the community, however, Dan’s connections were made when he was a part of the community, not as an outside service provider, making his connections all the more valuable.
- Sophisticated screening/interviewing systems that are statistically more predictive. Dan will be implementing a structured behavioral interviewing system (SBI) to accurately screen candidates. SBI is based on several elements: it is structured and every applicant receives the same questions to allow a relative comparison to be made. It is behavioral because the questions ask the applicants how they would act in a certain situation. The theory (proven empirically) is that if you come up with analogous situations that the applicant is likely to encounter in the prospective position, then the answers that you receive are indicative of how they would behave. SBI is statistically more predictive than other interviewing methods if done correctly. One aspect of proper implementation/usage is the quality of the questions that are developed. Dan, having worked in the high-tech industry for 10 years, has the insight to know what is expected (to some degree) of an applicant applying for the stated position.
5.2 Sales Strategy
Executive’s sales strategy will be based on attracting emerging companies to sign us up as a service provider. Secondarily, we will need to be attractive enough to the prospective executives that they are coming to us to help them find a job.
Developing attraction to the emerging companies will be based on Executive’s ability to communicate their competitive advantages and how they translate those into finding qualified executives. This will be done by showing how truly “connected” Dan is in the emerging company industry. It is somewhat unusual for someone to start out in the industry and then open up a search firm. People from the recruitment industry do not often come from the industry they are searching for. They typically come from a sales or personnel background. Dan’s background provides him with additional contacts that are appealing to the companies.
Executive’s strategy will also be to show how effective the structured behavioral interviews are. If this can be done then this will be a significant advantage because it signals that Executive can pick more successful candidates through their screening process.
Having a long list of industry clients is helpful in attracting executives to The Executive Search & Rescue Placement Firm. If the executive feels that The Executive Search & Rescue Placement Firm is well connected in the industry and has an accomplished list of clients, then they will feel more confident that Executive will have a higher chance in finding them a job.
5.2.1 Sales Forecast
The first month will be spent setting up the office. It is unlikely that there will be much sales activity. In addition to dealing with legal and advertising issues, time will be spent with the physical assembly of the office and the development of the systems for the back end structure.
Additionally, during the first month Dan will be developing the structured behavioral interview system. By the second month the office will open and ready to go. Dan will be working with both emerging clients as well as bringing in executives and running them through the screening process once he knows what positions he is looking to fill.
Sales will steadily grow from month two. Executives expects to have a surge by month four and will respond by bringing on board an account executive to help handle the accounts.


| Sales Forecast | |||
| Year 1 | Year 2 | Year 3 | |
| Sales | |||
| High-tech Firms | $96,730 | $156,478 | $181,547 |
| Non-high-tech Firms | $22,930 | $25,654 | $31,254 |
| Total Sales | $119,660 | $182,132 | $212,801 |
| Direct Cost of Sales | Year 1 | Year 2 | Year 3 |
| High-tech Firms | $0 | $0 | $0 |
| Non-high-tech Firms | $0 | $0 | $0 |
| Subtotal Direct Cost of Sales | $0 | $0 | $0 |
5.3 Milestones
The Executive Search & Rescue Placement Firm will have several milestones early on:
- Business plan completion. This will be done as a road map for the organization. While we do not need a business plan to raise capital, it will be an indispensable tool for the ongoing performance and improvement of the company.
- Set-up office.
- Development of the structured behavioral interview processes.
- Bringing on an account executive.
| Milestones | |||||
| Milestone | Start Date | End Date | Budget | Manager | Department |
| Business Plan Completion | 1/1/2001 | 2/1/2001 | $0 | Dan | Marketing |
| Office Set-up | 1/1/2001 | 2/1/2001 | $0 | Dan | Department |
| Structured Behavioral Interview Development | 1/1/2001 | 2/1/2001 | $0 | Dan | Department |
| Bringing on an Account Executive | 1/1/2001 | 4/1/2001 | $0 | Dan | Department |
| Totals | $0 | ||||
Management Summary
The Executive Search & Rescue Placement Firm is owned by Dan Bloodhound. Dan received his undergraduate degree from the University of Portland, majoring in communications and computer science. Dan spent his first three years at a then emerging company called Tektronix. At Tektronix Dan did business-to-business sales. This experience was particularly valuable as it was his first introduction to sales in an emerging company. At the end of the three years, Dan was longing for a position that offered him more responsibility, so he moved to Mentor Graphics and took on a supervisory role in the sales department. The Mentor Graphics position was valuable because it gave Dan more interaction with the other departments in the company. Dan was responsible for coordinating the sales program with the different departments.
After Mentor Graphics, Dan fell into a wonderful opportunity at Timberline Software that provided him with even more responsibility within the company. The new responsibilities that Dan had, coupled with being introduced to an new sector in the high-tech community became quite an asset for Dan. He finally decided with his experience in the emerging business industry, in addition to his incredible network of colleagues, it made perfect sense to start his own executive search firm.
6.1 Personnel Plan
The staff will consist of Dan working full time. Executive will hire a full-time secretary/receptionist in month two, a part-time generalist in month three, and a full-time account executive in month four. From month four until the foreseeable future, the organization will be able to survive with a four person headcount.
| Personnel Plan | |||
| Year 1 | Year 2 | Year 3 | |
| Dan | $30,000 | $35,000 | $40,000 |
| Secretary/Receptionist | $16,500 | $18,000 | $18,000 |
| Part-time Employee | $8,000 | $9,600 | $9,600 |
| Account Executive | $28,800 | $38,400 | $40,000 |
| Total People | 4 | 4 | 4 |
| Total Payroll | $83,300 | $101,000 | $107,600 |
Financial Plan
The following sections will outline important financial information.
7.1 Important Assumptions
The following table details some of the important financial assumptions.
| General Assumptions | |||
| Year 1 | Year 2 | Year 3 | |
| Plan Month | 1 | 2 | 3 |
| Current Interest Rate | 10.00% | 10.00% | 10.00% |
| Long-term Interest Rate | 10.00% | 10.00% | 10.00% |
| Tax Rate | 25.42% | 25.00% | 25.42% |
| Other | 0 | 0 | 0 |
7.2 Break-even Analysis
The Break-even Analysis indicates what is needed in monthly revenue to break even. The sales forecasts are based on the company receiving the commission spread out over the entire year as opposed to a lump sum.

| Break-even Analysis | |
| Monthly Revenue Break-even | $10,052 |
| Assumptions: | |
| Average Percent Variable Cost | 0% |
| Estimated Monthly Fixed Cost | $10,052 |
7.3 Projected Profit and Loss
The following table will indicate projected profit and loss.


| Pro Forma Profit and Loss | |||
| Year 1 | Year 2 | Year 3 | |
| Sales | $119,660 | $182,132 | $212,801 |
| Direct Cost of Sales | $0 | $0 | $0 |
| Other | $0 | $0 | $0 |
| Total Cost of Sales | $0 | $0 | $0 |
| Gross Margin | $119,660 | $182,132 | $212,801 |
| Gross Margin % | 100.00% | 100.00% | 100.00% |
| Expenses | |||
| Payroll | $83,300 | $101,000 | $107,600 |
| Sales and Marketing and Other Expenses | $2,400 | $2,400 | $2,400 |
| Depreciation | $828 | $828 | $828 |
| Leased Equipment | $0 | $0 | $0 |
| Utilities | $2,100 | $2,100 | $2,100 |
| Insurance | $1,500 | $1,500 | $1,500 |
| Rent | $18,000 | $18,000 | $18,000 |
| Payroll Taxes | $12,495 | $15,150 | $16,140 |
| Other | $0 | $0 | $0 |
| Total Operating Expenses | $120,623 | $140,978 | $148,568 |
| Profit Before Interest and Taxes | ($963) | $41,154 | $64,233 |
| EBITDA | ($135) | $41,982 | $65,061 |
| Interest Expense | $0 | $0 | $0 |
| Taxes Incurred | $0 | $10,289 | $16,326 |
| Net Profit | ($963) | $30,866 | $47,907 |
| Net Profit/Sales | -0.80% | 16.95% | 22.51% |
7.4 Projected Cash Flow
The following chart and table will indicate projected cash flow.

| Pro Forma Cash Flow | |||
| Year 1 | Year 2 | Year 3 | |
| Cash Received | |||
| Cash from Operations | |||
| Cash Sales | $17,949 | $27,320 | $31,920 |
| Cash from Receivables | $77,790 | $142,324 | $174,750 |
| Subtotal Cash from Operations | $95,739 | $169,644 | $206,670 |
| Additional Cash Received | |||
| Sales Tax, VAT, HST/GST Received | $0 | $0 | $0 |
| New Current Borrowing | $0 | $0 | $0 |
| New Other Liabilities (interest-free) | $0 | $0 | $0 |
| New Long-term Liabilities | $0 | $0 | $0 |
| Sales of Other Current Assets | $0 | $0 | $0 |
| Sales of Long-term Assets | $0 | $0 | $0 |
| New Investment Received | $6,000 | $0 | $0 |
| Subtotal Cash Received | $101,739 | $169,644 | $206,670 |
| Expenditures | Year 1 | Year 2 | Year 3 |
| Expenditures from Operations | |||
| Cash Spending | $83,300 | $101,000 | $107,600 |
| Bill Payments | $33,402 | $48,468 | $55,888 |
| Subtotal Spent on Operations | $116,702 | $149,468 | $163,488 |
| Additional Cash Spent | |||
| Sales Tax, VAT, HST/GST Paid Out | $0 | $0 | $0 |
| Principal Repayment of Current Borrowing | $0 | $0 | $0 |
| Other Liabilities Principal Repayment | $0 | $0 | $0 |
| Long-term Liabilities Principal Repayment | $0 | $0 | $0 |
| Purchase Other Current Assets | $0 | $0 | $0 |
| Purchase Long-term Assets | $0 | $0 | $0 |
| Dividends | $0 | $0 | $0 |
| Subtotal Cash Spent | $116,702 | $149,468 | $163,488 |
| Net Cash Flow | ($14,962) | $20,175 | $43,182 |
| Cash Balance | $5,788 | $25,963 | $69,145 |
7.5 Projected Balance Sheet
The following table will indicate the projected balance sheet.
| Pro Forma Balance Sheet | |||
| Year 1 | Year 2 | Year 3 | |
| Assets | |||
| Current Assets | |||
| Cash | $5,788 | $25,963 | $69,145 |
| Accounts Receivable | $23,921 | $36,409 | $42,540 |
| Other Current Assets | $0 | $0 | $0 |
| Total Current Assets | $29,708 | $62,372 | $111,685 |
| Long-term Assets | |||
| Long-term Assets | $2,500 | $2,500 | $2,500 |
| Accumulated Depreciation | $828 | $1,656 | $2,484 |
| Total Long-term Assets | $1,672 | $844 | $16 |
| Total Assets | $31,380 | $63,216 | $111,701 |
| Liabilities and Capital | Year 1 | Year 2 | Year 3 |
| Current Liabilities | |||
| Accounts Payable | $3,093 | $4,063 | $4,641 |
| Current Borrowing | $0 | $0 | $0 |
| Other Current Liabilities | $0 | $0 | $0 |
| Subtotal Current Liabilities | $3,093 | $4,063 | $4,641 |
| Long-term Liabilities | $0 | $0 | $0 |
| Total Liabilities | $3,093 | $4,063 | $4,641 |
| Paid-in Capital | $31,000 | $31,000 | $31,000 |
| Retained Earnings | ($1,750) | ($2,713) | $28,153 |
| Earnings | ($963) | $30,866 | $47,907 |
| Total Capital | $28,287 | $59,153 | $107,060 |
| Total Liabilities and Capital | $31,380 | $63,216 | $111,701 |
| Net Worth | $28,287 | $59,153 | $107,060 |
7.6 Business Ratios
The following table outlines some of the more important ratios from the Human Resources and Executive Search Consulting industry. The final column, Industry Profile, details specific ratios based on the industry as it is classified by the NAICS code, 541612.
| Ratio Analysis | ||||
| Year 1 | Year 2 | Year 3 | Industry Profile | |
| Sales Growth | 0.00% | 52.21% | 16.84% | 9.59% |
| Percent of Total Assets | ||||
| Accounts Receivable | 76.23% | 57.59% | 38.08% | 25.69% |
| Other Current Assets | 0.00% | 0.00% | 0.00% | 48.94% |
| Total Current Assets | 94.67% | 98.66% | 99.99% | 78.12% |
| Long-term Assets | 5.33% | 1.34% | 0.01% | 21.88% |
| Total Assets | 100.00% | 100.00% | 100.00% | 100.00% |
| Current Liabilities | 9.86% | 6.43% | 4.15% | 36.06% |
| Long-term Liabilities | 0.00% | 0.00% | 0.00% | 24.25% |
| Total Liabilities | 9.86% | 6.43% | 4.15% | 60.31% |
| Net Worth | 90.14% | 93.57% | 95.85% | 39.69% |
| Percent of Sales | ||||
| Sales | 100.00% | 100.00% | 100.00% | 100.00% |
| Gross Margin | 100.00% | 100.00% | 100.00% | 100.00% |
| Selling, General & Administrative Expenses | 100.80% | 83.05% | 77.36% | 77.89% |
| Advertising Expenses | 2.01% | 1.32% | 1.13% | 1.74% |
| Profit Before Interest and Taxes | -0.80% | 22.60% | 30.18% | 1.43% |
| Main Ratios | ||||
| Current | 9.60 | 15.35 | 24.06 | 1.53 |
| Quick | 9.60 | 15.35 | 24.06 | 1.19 |
| Total Debt to Total Assets | 9.86% | 6.43% | 4.15% | 65.48% |
| Pre-tax Return on Net Worth | -3.40% | 69.57% | 60.00% | 4.35% |
| Pre-tax Return on Assets | -3.07% | 65.10% | 57.50% | 12.60% |
| Additional Ratios | Year 1 | Year 2 | Year 3 | |
| Net Profit Margin | -0.80% | 16.95% | 22.51% | n.a |
| Return on Equity | -3.40% | 52.18% | 44.75% | n.a |
| Activity Ratios | ||||
| Accounts Receivable Turnover | 4.25 | 4.25 | 4.25 | n.a |
| Collection Days | 56 | 71 | 80 | n.a |
| Accounts Payable Turnover | 11.80 | 12.17 | 12.17 | n.a |
| Payment Days | 27 | 26 | 28 | n.a |
| Total Asset Turnover | 3.81 | 2.88 | 1.91 | n.a |
| Debt Ratios | ||||
| Debt to Net Worth | 0.11 | 0.07 | 0.04 | n.a |
| Current Liab. to Liab. | 1.00 | 1.00 | 1.00 | n.a |
| Liquidity Ratios | ||||
| Net Working Capital | $26,615 | $58,309 | $107,044 | n.a |
| Interest Coverage | 0.00 | 0.00 | 0.00 | n.a |
| Additional Ratios | ||||
| Assets to Sales | 0.26 | 0.35 | 0.52 | n.a |
| Current Debt/Total Assets | 10% | 6% | 4% | n.a |
| Acid Test | 1.87 | 6.39 | 14.90 | n.a |
| Sales/Net Worth | 4.23 | 3.08 | 1.99 | n.a |
| Dividend Payout | 0.00 | 0.00 | 0.00 | n.a |
Appendix
| Sales Forecast | |||||||||||||
| Month 1 | Month 2 | Month 3 | Month 4 | Month 5 | Month 6 | Month 7 | Month 8 | Month 9 | Month 10 | Month 11 | Month 12 | ||
| Sales | |||||||||||||
| High-tech Firms | 0% | $0 | $4,500 | $6,454 | $7,154 | $7,985 | $8,125 | $8,678 | $9,125 | $9,654 | $10,854 | $11,547 | $12,654 |
| Non-high-tech Firms | 0% | $0 | $0 | $2,250 | $2,154 | $2,500 | $2,458 | $2,154 | $2,254 | $2,414 | $2,345 | $2,256 | $2,145 |
| Total Sales | $0 | $4,500 | $8,704 | $9,308 | $10,485 | $10,583 | $10,832 | $11,379 | $12,068 | $13,199 | $13,803 | $14,799 | |
| Direct Cost of Sales | Month 1 | Month 2 | Month 3 | Month 4 | Month 5 | Month 6 | Month 7 | Month 8 | Month 9 | Month 10 | Month 11 | Month 12 | |
| High-tech Firms | $0 | $0 | $0 | $0 | $0 | $0 | $0 | $0 | $0 | $0 | $0 | $0 | |
| Non-high-tech Firms | $0 | $0 | $0 | $0 | $0 | $0 | $0 | $0 | $0 | $0 | $0 | $0 | |
| Subtotal Direct Cost of Sales | $0 | $0 | $0 | $0 | $0 | $0 | $0 | $0 | $0 | $0 | $0 | $0 | |
| Personnel Plan | |||||||||||||
| Month 1 | Month 2 | Month 3 | Month 4 | Month 5 | Month 6 | Month 7 | Month 8 | Month 9 | Month 10 | Month 11 | Month 12 | ||
| Dan | 0% | $2,500 | $2,500 | $2,500 | $2,500 | $2,500 | $2,500 | $2,500 | $2,500 | $2,500 | $2,500 | $2,500 | $2,500 |
| Secretary/Receptionist | 0% | $0 | $1,500 | $1,500 | $1,500 | $1,500 | $1,500 | $1,500 | $1,500 | $1,500 | $1,500 | $1,500 | $1,500 |
| Part-time Employee | 0% | $0 | $0 | $800 | $800 | $800 | $800 | $800 | $800 | $800 | $800 | $800 | $800 |
| Account Executive | 0% | $0 | $0 | $0 | $3,200 | $3,200 | $3,200 | $3,200 | $3,200 | $3,200 | $3,200 | $3,200 | $3,200 |
| Total People | 1 | 2 | 3 | 4 | 4 | 4 | 4 | 4 | 4 | 4 | 4 | 4 | |
| Total Payroll | $2,500 | $4,000 | $4,800 | $8,000 | $8,000 | $8,000 | $8,000 | $8,000 | $8,000 | $8,000 | $8,000 | $8,000 | |
| General Assumptions | |||||||||||||
| Month 1 | Month 2 | Month 3 | Month 4 | Month 5 | Month 6 | Month 7 | Month 8 | Month 9 | Month 10 | Month 11 | Month 12 | ||
| Plan Month | 1 | 2 | 3 | 4 | 5 | 6 | 7 | 8 | 9 | 10 | 11 | 12 | |
| Current Interest Rate | 10.00% | 10.00% | 10.00% | 10.00% | 10.00% | 10.00% | 10.00% | 10.00% | 10.00% | 10.00% | 10.00% | 10.00% | |
| Long-term Interest Rate | 10.00% | 10.00% | 10.00% | 10.00% | 10.00% | 10.00% | 10.00% | 10.00% | 10.00% | 10.00% | 10.00% | 10.00% | |
| Tax Rate | 30.00% | 25.00% | 25.00% | 25.00% | 25.00% | 25.00% | 25.00% | 25.00% | 25.00% | 25.00% | 25.00% | 25.00% | |
| Other | 0 | 0 | 0 | 0 | 0 | 0 | 0 | 0 | 0 | 0 | 0 | 0 | |
| Pro Forma Profit and Loss | |||||||||||||
| Month 1 | Month 2 | Month 3 | Month 4 | Month 5 | Month 6 | Month 7 | Month 8 | Month 9 | Month 10 | Month 11 | Month 12 | ||
| Sales | $0 | $4,500 | $8,704 | $9,308 | $10,485 | $10,583 | $10,832 | $11,379 | $12,068 | $13,199 | $13,803 | $14,799 | |
| Direct Cost of Sales | $0 | $0 | $0 | $0 | $0 | $0 | $0 | $0 | $0 | $0 | $0 | $0 | |
| Other | $0 | $0 | $0 | $0 | $0 | $0 | $0 | $0 | $0 | $0 | $0 | $0 | |
| Total Cost of Sales | $0 | $0 | $0 | $0 | $0 | $0 | $0 | $0 | $0 | $0 | $0 | $0 | |
| Gross Margin | $0 | $4,500 | $8,704 | $9,308 | $10,485 | $10,583 | $10,832 | $11,379 | $12,068 | $13,199 | $13,803 | $14,799 | |
| Gross Margin % | 0.00% | 100.00% | 100.00% | 100.00% | 100.00% | 100.00% | 100.00% | 100.00% | 100.00% | 100.00% | 100.00% | 100.00% | |
| Expenses | |||||||||||||
| Payroll | $2,500 | $4,000 | $4,800 | $8,000 | $8,000 | $8,000 | $8,000 | $8,000 | $8,000 | $8,000 | $8,000 | $8,000 | |
| Sales and Marketing and Other Expenses | $200 | $200 | $200 | $200 | $200 | $200 | $200 | $200 | $200 | $200 | $200 | $200 | |
| Depreciation | $69 | $69 | $69 | $69 | $69 | $69 | $69 | $69 | $69 | $69 | $69 | $69 | |
| Leased Equipment | $0 | $0 | $0 | $0 | $0 | $0 | $0 | $0 | $0 | $0 | $0 | $0 | |
| Utilities | $175 | $175 | $175 | $175 | $175 | $175 | $175 | $175 | $175 | $175 | $175 | $175 | |
| Insurance | $125 | $125 | $125 | $125 | $125 | $125 | $125 | $125 | $125 | $125 | $125 | $125 | |
| Rent | $1,500 | $1,500 | $1,500 | $1,500 | $1,500 | $1,500 | $1,500 | $1,500 | $1,500 | $1,500 | $1,500 | $1,500 | |
| Payroll Taxes | 15% | $375 | $600 | $720 | $1,200 | $1,200 | $1,200 | $1,200 | $1,200 | $1,200 | $1,200 | $1,200 | $1,200 |
| Other | $0 | $0 | $0 | $0 | $0 | $0 | $0 | $0 | $0 | $0 | $0 | $0 | |
| Total Operating Expenses | $4,944 | $6,669 | $7,589 | $11,269 | $11,269 | $11,269 | $11,269 | $11,269 | $11,269 | $11,269 | $11,269 | $11,269 | |
| Profit Before Interest and Taxes | ($4,944) | ($2,169) | $1,115 | ($1,961) | ($784) | ($686) | ($437) | $110 | $799 | $1,930 | $2,534 | $3,530 | |
| EBITDA | ($4,875) | ($2,100) | $1,184 | ($1,892) | ($715) | ($617) | ($368) | $179 | $868 | $1,999 | $2,603 | $3,599 | |
| Interest Expense | $0 | $0 | $0 | $0 | $0 | $0 | $0 | $0 | $0 | $0 | $0 | $0 | |
| Taxes Incurred | $0 | $0 | $0 | $0 | $0 | $0 | $0 | $0 | $0 | $0 | $0 | $0 | |
| Net Profit | ($4,944) | ($2,169) | $1,115 | ($1,961) | ($784) | ($686) | ($437) | $110 | $799 | $1,930 | $2,534 | $3,530 | |
| Net Profit/Sales | 0.00% | -48.20% | 12.81% | -21.07% | -7.48% | -6.48% | -4.03% | 0.97% | 6.62% | 14.62% | 18.36% | 23.85% | |
| Pro Forma Cash Flow | |||||||||||||
| Month 1 | Month 2 | Month 3 | Month 4 | Month 5 | Month 6 | Month 7 | Month 8 | Month 9 | Month 10 | Month 11 | Month 12 | ||
| Cash Received | |||||||||||||
| Cash from Operations | |||||||||||||
| Cash Sales | $0 | $675 | $1,306 | $1,396 | $1,573 | $1,587 | $1,625 | $1,707 | $1,810 | $1,980 | $2,070 | $2,220 | |
| Cash from Receivables | $0 | $0 | $128 | $3,944 | $7,416 | $7,945 | $8,915 | $9,003 | $9,223 | $9,692 | $10,290 | $11,236 | |
| Subtotal Cash from Operations | $0 | $675 | $1,433 | $5,340 | $8,988 | $9,533 | $10,540 | $10,709 | $11,033 | $11,672 | $12,360 | $13,456 | |
| Additional Cash Received | |||||||||||||
| Sales Tax, VAT, HST/GST Received | 0.00% | $0 | $0 | $0 | $0 | $0 | $0 | $0 | $0 | $0 | $0 | $0 | $0 |
| New Current Borrowing | $0 | $0 | $0 | $0 | $0 | $0 | $0 | $0 | $0 | $0 | $0 | $0 | |
| New Other Liabilities (interest-free) | $0 | $0 | $0 | $0 | $0 | $0 | $0 | $0 | $0 | $0 | $0 | $0 | |
| New Long-term Liabilities | $0 | $0 | $0 | $0 | $0 | $0 | $0 | $0 | $0 | $0 | $0 | $0 | |
| Sales of Other Current Assets | $0 | $0 | $0 | $0 | $0 | $0 | $0 | $0 | $0 | $0 | $0 | $0 | |
| Sales of Long-term Assets | $0 | $0 | $0 | $0 | $0 | $0 | $0 | $0 | $0 | $0 | $0 | $0 | |
| New Investment Received | $0 | $0 | $0 | $0 | $6,000 | $0 | $0 | $0 | $0 | $0 | $0 | $0 | |
| Subtotal Cash Received | $0 | $675 | $1,433 | $5,340 | $14,988 | $9,533 | $10,540 | $10,709 | $11,033 | $11,672 | $12,360 | $13,456 | |
| Expenditures | Month 1 | Month 2 | Month 3 | Month 4 | Month 5 | Month 6 | Month 7 | Month 8 | Month 9 | Month 10 | Month 11 | Month 12 | |
| Expenditures from Operations | |||||||||||||
| Cash Spending | $2,500 | $4,000 | $4,800 | $8,000 | $8,000 | $8,000 | $8,000 | $8,000 | $8,000 | $8,000 | $8,000 | $8,000 | |
| Bill Payments | $79 | $2,383 | $2,604 | $2,736 | $3,200 | $3,200 | $3,200 | $3,200 | $3,200 | $3,200 | $3,200 | $3,200 | |
| Subtotal Spent on Operations | $2,579 | $6,383 | $7,404 | $10,736 | $11,200 | $11,200 | $11,200 | $11,200 | $11,200 | $11,200 | $11,200 | $11,200 | |
| Additional Cash Spent | |||||||||||||
| Sales Tax, VAT, HST/GST Paid Out | $0 | $0 | $0 | $0 | $0 | $0 | $0 | $0 | $0 | $0 | $0 | $0 | |
| Principal Repayment of Current Borrowing | $0 | $0 | $0 | $0 | $0 | $0 | $0 | $0 | $0 | $0 | $0 | $0 | |
| Other Liabilities Principal Repayment | $0 | $0 | $0 | $0 | $0 | $0 | $0 | $0 | $0 | $0 | $0 | $0 | |
| Long-term Liabilities Principal Repayment | $0 | $0 | $0 | $0 | $0 | $0 | $0 | $0 | $0 | $0 | $0 | $0 | |
| Purchase Other Current Assets | $0 | $0 | $0 | $0 | $0 | $0 | $0 | $0 | $0 | $0 | $0 | $0 | |
| Purchase Long-term Assets | $0 | $0 | $0 | $0 | $0 | $0 | $0 | $0 | $0 | $0 | $0 | $0 | |
| Dividends | $0 | $0 | $0 | $0 | $0 | $0 | $0 | $0 | $0 | $0 | $0 | $0 | |
| Subtotal Cash Spent | $2,579 | $6,383 | $7,404 | $10,736 | $11,200 | $11,200 | $11,200 | $11,200 | $11,200 | $11,200 | $11,200 | $11,200 | |
| Net Cash Flow | ($2,579) | ($5,708) | ($5,971) | ($5,396) | $3,788 | ($1,667) | ($660) | ($491) | ($167) | $472 | $1,160 | $2,256 | |
| Cash Balance | $18,171 | $12,463 | $6,492 | $1,097 | $4,885 | $3,218 | $2,557 | $2,067 | $1,900 | $2,371 | $3,532 | $5,788 | |
| Pro Forma Balance Sheet | |||||||||||||
| Month 1 | Month 2 | Month 3 | Month 4 | Month 5 | Month 6 | Month 7 | Month 8 | Month 9 | Month 10 | Month 11 | Month 12 | ||
| Assets | Starting Balances | ||||||||||||
| Current Assets | |||||||||||||
| Cash | $20,750 | $18,171 | $12,463 | $6,492 | $1,097 | $4,885 | $3,218 | $2,557 | $2,067 | $1,900 | $2,371 | $3,532 | $5,788 |
| Accounts Receivable | $0 | $0 | $3,825 | $11,096 | $15,064 | $16,560 | $17,611 | $17,903 | $18,572 | $19,608 | $21,135 | $22,578 | $23,921 |
| Other Current Assets | $0 | $0 | $0 | $0 | $0 | $0 | $0 | $0 | $0 | $0 | $0 | $0 | $0 |
| Total Current Assets | $20,750 | $18,171 | $16,288 | $17,588 | $16,160 | $21,445 | $20,828 | $20,460 | $20,639 | $21,507 | $23,506 | $26,109 | $29,708 |
| Long-term Assets | |||||||||||||
| Long-term Assets | $2,500 | $2,500 | $2,500 | $2,500 | $2,500 | $2,500 | $2,500 | $2,500 | $2,500 | $2,500 | $2,500 | $2,500 | $2,500 |
| Accumulated Depreciation | $0 | $69 | $138 | $207 | $276 | $345 | $414 | $483 | $552 | $621 | $690 | $759 | $828 |
| Total Long-term Assets | $2,500 | $2,431 | $2,362 | $2,293 | $2,224 | $2,155 | $2,086 | $2,017 | $1,948 | $1,879 | $1,810 | $1,741 | $1,672 |
| Total Assets | $23,250 | $20,602 | $18,650 | $19,881 | $18,384 | $23,600 | $22,914 | $22,477 | $22,587 | $23,386 | $25,316 | $27,850 | $31,380 |
| Liabilities and Capital | Month 1 | Month 2 | Month 3 | Month 4 | Month 5 | Month 6 | Month 7 | Month 8 | Month 9 | Month 10 | Month 11 | Month 12 | |
| Current Liabilities | |||||||||||||
| Accounts Payable | $0 | $2,296 | $2,513 | $2,629 | $3,093 | $3,093 | $3,093 | $3,093 | $3,093 | $3,093 | $3,093 | $3,093 | $3,093 |
| Current Borrowing | $0 | $0 | $0 | $0 | $0 | $0 | $0 | $0 | $0 | $0 | $0 | $0 | $0 |
| Other Current Liabilities | $0 | $0 | $0 | $0 | $0 | $0 | $0 | $0 | $0 | $0 | $0 | $0 | $0 |
| Subtotal Current Liabilities | $0 | $2,296 | $2,513 | $2,629 | $3,093 | $3,093 | $3,093 | $3,093 | $3,093 | $3,093 | $3,093 | $3,093 | $3,093 |
| Long-term Liabilities | $0 | $0 | $0 | $0 | $0 | $0 | $0 | $0 | $0 | $0 | $0 | $0 | $0 |
| Total Liabilities | $0 | $2,296 | $2,513 | $2,629 | $3,093 | $3,093 | $3,093 | $3,093 | $3,093 | $3,093 | $3,093 | $3,093 | $3,093 |
| Paid-in Capital | $25,000 | $25,000 | $25,000 | $25,000 | $25,000 | $31,000 | $31,000 | $31,000 | $31,000 | $31,000 | $31,000 | $31,000 | $31,000 |
| Retained Earnings | ($1,750) | ($1,750) | ($1,750) | ($1,750) | ($1,750) | ($1,750) | ($1,750) | ($1,750) | ($1,750) | ($1,750) | ($1,750) | ($1,750) | ($1,750) |
| Earnings | $0 | ($4,944) | ($7,113) | ($5,998) | ($7,959) | ($8,743) | ($9,429) | ($9,866) | ($9,756) | ($8,957) | ($7,027) | ($4,493) | ($963) |
| Total Capital | $23,250 | $18,306 | $16,137 | $17,252 | $15,291 | $20,507 | $19,821 | $19,384 | $19,494 | $20,293 | $22,223 | $24,757 | $28,287 |
| Total Liabilities and Capital | $23,250 | $20,602 | $18,650 | $19,881 | $18,384 | $23,600 | $22,914 | $22,477 | $22,587 | $23,386 | $25,316 | $27,850 | $31,380 |
| Net Worth | $23,250 | $18,306 | $16,137 | $17,252 | $15,291 | $20,507 | $19,821 | $19,384 | $19,494 | $20,293 | $22,223 | $24,757 | $28,287 |

