
Environmental Engines
Executive Summary
Environmental Engines Toyota Honda GM believes our future cars should save even more energy and produce even less pollution. Led by Jack Anderson, mechanical engineer and environmental guru; Jim Handy, public relations consultant; and Frank Lee Good, environmental and corporate attorney, Environmental Engines Toyota Honda GM is going to climb to the top of the auto sales industry. We invite everyone to join us in driving this exciting new technology.
Our strategic focus will attract courageous early-adopters who envision themselves as “energy pioneers,” the younger generation, and environmentalists. Each of these groups has outstanding projected growth rates, particularly the younger generation. Environmental Engines Toyota Honda GM holds a competitive edge by specializing in zero emissions vehicles and has franchised with every auto manufacturer that could offer any competition. Environmental Engines Toyota Honda GM will stand out as the preferable alternative to fossil fuel burning transportation systems. As visibility of our vehicles increases, sales among environmentalists and the younger generation will increase by 50% each month thereafter.
Profits will initially be repaid to the business to finance any overhead costs related to purchasing inventory, then to the rapidly expanding photovoltaic recharging station and mechanic’s garage, then to pay off the initial investments. Inventory will be purchased in advance to stock the showroom floor and to outfit every executive, sales person, and mechanic with a zero emissions vehicle to drive around town at their own cost. Their savings earned by investing in a zero emissions vehicle will spread by word-of-mouth, attract more customers, and bolster future growth at the same high rate of 50%.
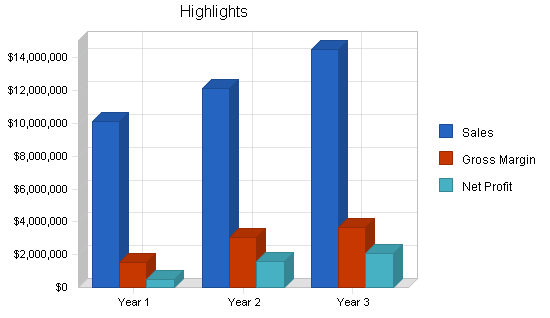
The highlights chart that follows affirms how exciting an opportunity this really is: with GM an anticipated a 50% monthly increase in sales starting small (selling six cars in the first month); a modest gross margin within the first year, rising in the second and net profits being healthy in years two and three.
Not only will the sky be cleaner through the success of our company, but the sky is the limit in terms of our potential market dominance as well. All of these profits can then be fed back into research and development opening the doorway to a secondary market role for Environmental Engines Toyota Honda GM as a patent holding company and clearing house.
1.1 Keys to Success
The keys to success for Environmental Engines Toyota Honda GM are:
- Marketing: dealing with barriers to entry and partnering with local consumer and environmental groups, solving problems with major advertising and promotion budgets.
- Product quality.
- Management: products delivered on time, costs controlled, marketing budgets managed. There is a temptation to fix on growth at the expense of profits.
1.2 Objectives
The objectives for Environmental Engines Toyota Honda GM during the first three years of operation include:
- To create a car dealership with a respectable gross margin in environmentally-friendlier automobiles.
- To develop a discerning and informed consumer base in new automobile buyers throughout the surrounding metropolis who will exercise their buying power to support a 100% yearly sales growth of automobiles with greater fuel efficiency standards and lower rates of carbon monoxide emissions.
- To achieve 1,000 unit sales of environmentally-friendlier automobiles in year one.
- To stabilize the fuel efficient automobile market by increasing the market share by 15% after three years.
1.3 Mission
The mission of Environmental Engines Toyota Honda GM is to provide early adopters and the younger generation within the Ann Arbor community with environmentally-friendlier automobile choices and to convert traditional new automobile buyers into conscientious consumers who are aware of external as well as internal costs associated with automobile transportation. We will attract courageous early-adopters who envision themselves as “energy pioneers,” the younger generation, and environmentalists. When we adhere to these principles everything will fall into place.
Company Summary
Environmental Engines Toyota Honda GM is an automobile dealership based in the Ann Arbor area. It is founded as a consumer-oriented and environmentally-friendly dealership, and is emphasizing consumer education to differentiate itself from less environmentally-concerned dealerships.
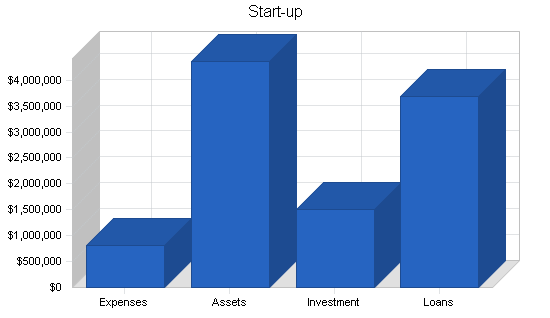
2.1 Start-up Summary
Environmental Engines Toyota Honda GM’s start-up costs will include dealership construction, all equipment needed for the office, legal costs, consulting costs, website creation, and advertising.
The inventory will be the largest chunk of start-up expenses. Start-up assets will include a mixed floor inventory of 10 hybrid and zero-emissions automobiles from Honda, Toyota, and GM. Construction costs will be second and will include a show room, three offices, fully-stocked mechanic’s garage, photovoltaic cells (charged by solar panels on the roof of the dealership), car wash, and automobile lot. The office equipment includes three computers, a fax machine, copier, four cellular phones, office supplies, additional land line, a DSL connection, and office furniture.
Start-up expenses will also include advertising. Four methods will be used: an interactive B-2-B website, the Yellow Pages, local newspapers, and direct marketing to local government, consumer-protection and environmental organizations.
| Start-up | |
| Requirements | |
| Start-up Expenses | |
| Construction | $320,000 |
| Mechanic’s Equipment | $1,500 |
| Photovoltaic Cells | $125,000 |
| Legal | $500 |
| Stationery etc. | $100 |
| Brochures | $1,000 |
| Consultants | $1,000 |
| Insurance | $1,200 |
| Real Estate Purchase | $120,000 |
| Research and Development | $1,000 |
| Website creation | $1,500 |
| Office Equipment | $500 |
| DSL Installation | $150 |
| Advertising | $180,000 |
| Franchise Royalties | $60,000 |
| Total Start-up Expenses | $813,450 |
| Start-up Assets | |
| Cash Required | $3,610,050 |
| Start-up Inventory | $125,000 |
| Other Current Assets | $189,500 |
| Long-term Assets | $440,000 |
| Total Assets | $4,364,550 |
| Total Requirements | $5,178,000 |
| Start-up Funding | |
| Start-up Expenses to Fund | $813,450 |
| Start-up Assets to Fund | $4,364,550 |
| Total Funding Required | $5,178,000 |
| Assets | |
| Non-cash Assets from Start-up | $754,500 |
| Cash Requirements from Start-up | $3,610,050 |
| Additional Cash Raised | $0 |
| Cash Balance on Starting Date | $3,610,050 |
| Total Assets | $4,364,550 |
| Liabilities and Capital | |
| Liabilities | |
| Current Borrowing | $2,000,000 |
| Long-term Liabilities | $1,500,000 |
| Accounts Payable (Outstanding Bills) | $0 |
| Other Current Liabilities (interest-free) | $178,000 |
| Total Liabilities | $3,678,000 |
| Capital | |
| Planned Investment | |
| Jack Anderson | $1,000,000 |
| Jim Handy | $150,000 |
| Frank Lee Good | $350,000 |
| Additional Investment Requirement | $0 |
| Total Planned Investment | $1,500,000 |
| Loss at Start-up (Start-up Expenses) | ($813,450) |
| Total Capital | $686,550 |
| Total Capital and Liabilities | $4,364,550 |
| Total Funding | $5,178,000 |
2.2 Company Ownership
Environmental Engines Toyota Honda GM is a privately-held Michigan corporation. Jack Anderson, Environmental Engines Toyota Honda GM’s founder, is the majority owner. Several members of the board of directors also hold minority stock positions.
Two of these are also vendors of outside services:
- Jim Handy, public relations consultant.
- Frank Lee Good, environmental and corporate attorney.
Products and Services
Environmental Engines Toyota Honda GM believes that driving our zero emissions vehicles and hybrid automobiles around will be the best way to get other early-adopters, the younger generation, and environmentalists involved with cleaner forms of transportation.
Environmental Engines Toyota Honda GM will showcase America’s most popular alternative vehicle, the four-door Toyota Prius. It runs on gasoline, like a regular car, but it also has an electric motor under the hood, which supplements the gas engine and sometimes takes over completely. The gas engine shuts off automatically whenever the Prius comes to a stop. The electric motor powers it up when you press on the accelerator. Unlike every other car on the highway, the Prius actually gets better mileage in stop-and-go city driving that while cruising at high speed. It’s in that stop-and-go driving than the car exhibits its most remarkable feature: whenever it switches to electric power, the Prius is dead quiet.
Since Toyota introduced the Prius to the United States two years ago, it has sold around 20,000 of the compact cars. Demand still exceeds supply, and other auto makers, like Honda and GM, have hybrid cars available or on the drawing board.
Environmental Engines Toyota Honda GM believes our future cars should save even more energy and produce even less pollution. To emphasize the point, members of the board of directors will drive around in a totally electric automobile borrowed from the showroom – an all-electric Toyota RAV4 sports utility vehicle. Instead of plugging into a standard outlet that supplies electricity from a coal or gas power plant, Environmental Engines Toyota Honda GM’s automobiles’ batteries will be recharged using photovoltaic cells – solar power. A solar-powered, five passenger electric car like this conserves energy and our environment.

Market Analysis Summary
Environmental Engines Toyota Honda GM’s customers can be divided into three groups: early-adopters, the younger generation, and cost-conscious-new-automobile-buyers.
- Early-adopters. Environmental Engines Toyota Honda GM’s first customers will likely be early-adopters. The reason for this is that these people will eagerly seek out the risks in purchasing an automobile that operates on alternative fuels in exchange for the status of being an automobile pioneer. This type of customer will range widely in age but will share an interest in automobile engineering and maintenance. Therefore, these customers will be most easily accessed by advertising in magazines marketed to automobile enthusiasts, engineers, hobbyists, mechanics and scientists. Other members of this customer-group will be attracted by consumer protection reports that have given favorable ratings to our products.
- The younger generation. The younger generation will be likely to purchase zero emission automobiles because these automobiles affect their future. These automobiles will not pollute their air or guzzle their gas. The reason for this is that after past generations have ignored the warning signs of global warning, the younger generations are now witnessing the cumulative and destructive effects that carbon-based-fuel systems are having on the environment and global eco-political structures.
- Environmentalists. Environmental Engines Toyota Honda GM’s customers will also include environmentalists. This category of customer exercises their purchasing power for the obvious environmental benefits and future rewards of zero emissions transportation systems. Therefore, these customers will be most easily accessed by direct marketing campaigns to local conservation groups, outdoors athletic clubs, and environmentally-sensitive political parties.
4.1 Market Segmentation
Early-adopters. Environmental Engines Toyota Honda GM’s will be targeting early-adopters who characteristically can be described as: over 28 years of age; either vocational (mechanical education) or higher education (four-year college degree or higher); mechanical or professional occupation earning a higher income (over $50,000); living within the city limits of Ann Arbor or Detroit; attracted by consumer protection reports that have given favorable ratings to our vehicles.
The younger generation. Environmental Engines Toyota Honda GM’s will be targeting urban youths between the ages of 14 and 27; who are athletically or academically active; come from upper middle to upper class homes (household incomes over $50,000); tend to make big ticket purchases; and need individual transportation.
Environmentalists. Environmental Engines Toyota Honda GM’s will be targeting environmentalists who characteristically can be described as: over twenty-one years of age; higher education (four-year college degree or higher); professional occupation earning a higher income (over $50,000); living within the city limits of Ann Arbor or Detroit; tending to buy organic and eco-friendly products; accessible by direct marketing to local conservation groups, outdoors athletic clubs, and environmentally-sensitive political parties.

| Market Analysis | |||||||
| Year 1 | Year 2 | Year 3 | Year 4 | Year 5 | |||
| Potential Customers | Growth | CAGR | |||||
| Early-adopters | 15% | 625 | 719 | 827 | 951 | 1,094 | 15.02% |
| The younger generation | 100% | 365 | 730 | 1,460 | 2,920 | 5,840 | 100.00% |
| Environmentalists | 50% | 100 | 150 | 225 | 338 | 507 | 50.06% |
| Total | 61.64% | 1,090 | 1,599 | 2,512 | 4,209 | 7,441 | 61.64% |
4.2 Target Market Segment Strategy
Environmental Engines Toyota Honda GM’s will be targeting early-adopters for four reasons.
- Early-adopters will eagerly seek out the risks in purchasing an automobile that operates on alternative fuels in exchange for the status of being an automobile pioneer.
- Favorable reviews by these customers will lend credibility to zero emissions vehicles as not only environmentally-friendly, but also as the economically preferable transportation option.
- These customers will be most easily accessed by advertising in magazines marketed to automobile enthusiasts, engineers, hobbyists, mechanics and scientists, and through good ratings in consumer protection reports.
- The younger generation will be attracted to zero-emissions vehicles once they see early-adopters driving these automobiles around.
Environmental Engines Toyota Honda GM’s will be targeting the younger generation for three reasons.
- The younger generation is not vested in perpetuating fossil-fuel-based transportation and economic systems and therefore, requires less marketing to demonstrate the advantages of zero-emissions vehicles.
- The younger generation will be likely to purchase an automobile of some sort between age sixteen and twenty-one. If the younger generation buys into the former gasoline-based automobile market, there will be more gas-burning vehicles on the road. More gas guzzling vehicles will pollute the air. Therefore, converting the next wave of vehicle consumers to a non-fossil-fuel-dependent form of transportation will more likely achieve Environmental Engines Toyota Honda GM’s mission of a zero-emission transportation system nationwide.
- Most importantly, investing in the future customer base of the younger generation will ensure exponential increase in Environmental Engines Toyota Honda GM’s sales for years to come.
Environmental Engines Toyota Honda GM’s will be targeting environmentalists for two reasons.
- These people will accept the risks in purchasing an automobile that operates on alternative fuels in exchange for the obvious environmental benefits and future rewards of zero emissions transportation systems.
- These customers will be accessible by direct marketing to local conservation groups, outdoors athletic clubs, and environmentally-sensitive political parties.
4.3 Service Business Analysis
Auto sales is one of the largest industries in the world.
The automobile industry is diversified into many large and small sub-groups, each supplied with high concentrations of capital. Many sub-groups enjoy support from classic car and eclectic engineering enthusiasts.
Services are bought and sold upon word-of-mouth recommendations and product image.
Specific competitors in the niche industry of zero emission vehicles will be franchised and supportive of Environmental Engines Toyota Honda GM.
4.3.1 Competition and Buying Patterns
Auto sales is about transportation for the individual. Customers seem to choose their vehicle based on their self image. One automobile maker’s success depends on image and trends in one part of the market, and on advertising and word-of-mouth recommendations in another.
Visibility, delivery, reliability, and features are critical. While price is less a factor in this industry than delivery and reliability, materials used by manufacturers in volume must come from reliable sources because the niche industry of zero emission vehicles should not be subject to risky fluctuations in wholesale and subsequently retail values. Features will also be important because our vehicles must be viewed as the highest technology.
Target customers choose between competing vehicles based on brand name image and word-of-mouth. Vehicle performance and image are major factors in developing word-of-mouth recommendations. Customers like that their choice of zero emissions vehicles protects the environment.
Strategy and Implementation Summary
Environmental Engines Toyota Honda GM holds a competitive edge by specializing in zero emissions vehicles and has franchised with every auto manufacturer that could offer any competition.
Environmental Engines Toyota Honda GM will grow from three executives plus a small group of three sales persons and one mechanic, all of who will bring their professional expertise and contacts to provide a solid foundation of connections for future marketing ventures.
Environmental Engines Toyota Honda GM’s media strategy will focus on direct marketing to local groups and clubs, as well as advertising in magazines. Sales prospects will be finalized in person, through mail-order, over the phone, and via the Internet.
As visibility of our vehicles increases, sales among environmentalists and the younger generation will increase by 50% each month thereafter.
5.1 Sales Strategy
The sales strategy of Environmental Engines Toyota Honda GM will optimize selling by focusing on serving the immediate needs of the customer – foster the “energy pioneer” image, individual transportation, reducing dependence on fossil fuels, and minimizing the automobile’s impact on the environment. Informed by the customer’s immediate needs, our sales team will focus on informing the customer of the benefits to driving our vehicles.
Sales prospects will be finalized in person, through mail-order, over the phone, and via the Internet. Sales people will be compensated with a two percent commission. Sales persons will be trained in Web-based publishing and database management to optimize order processing.
Prices, delivery and conditions of sale are negotiable within the bounds of profitability.
5.1.1 Sales Forecast
Beginning in January of the first year sales will start small (2 Toyota Priuses, 1 RAV4, 1 Honda) among the early-adopters because the general market has not yet been developed.
As visibility of our vehicles increases, sales among environmentalists and the younger generation will increase by 20% each month thereafter. As word spreads, this rate of increase will maintain steady for at least ten years because the younger generation, one of our target markets, will only continue to grow.
This high rate of growth is believable because the industry is in its start-up stage and will not reach saturation at any foreseeable point in the future. Furthermore, if gasoline prices will continue to rise our non-fossil fuel burning vehicles will only become more attractive. If gasoline prices do not rise, then our sales team will focus on the obvious environmental benefits and future rewards of zero emissions transportation systems.


| Sales Forecast | |||
| Year 1 | Year 2 | Year 3 | |
| Sales | |||
| Toyota Prius | $5,937,075 | $7,124,490 | $8,549,388 |
| Toyota RAV4 | $2,770,635 | $3,324,762 | $3,989,715 |
| Honda | $989,513 | $1,187,415 | $1,424,898 |
| GM | $0 | $0 | $0 |
| Mechanic Labor | $395,805 | $474,966 | $569,959 |
| Total Sales | $10,093,028 | $12,111,634 | $14,533,960 |
| Direct Cost of Sales | Year 1 | Year 2 | Year 3 |
| Toyota Prius | $4,749,660 | $4,987,143 | $5,984,572 |
| Toyota RAV4 | $2,216,508 | $2,327,334 | $2,792,800 |
| Honda | $791,610 | $831,191 | $997,429 |
| GM | $0 | $0 | $0 |
| Mechanic Labor | $316,644 | $332,476 | $398,971 |
| Subtotal Direct Cost of Sales | $8,074,422 | $8,478,144 | $10,173,772 |
5.2 Milestones
Environmental Engines Toyota Honda GM set 12 realistic milestones for itself within the first year. Achievement of each of these organizational and marketing milestones will build momentum within the organization. The culmination of our first year in the sale of 1,000 vehicles will feedback into our mission statement and reaffirm the purpose and success of Environmental Engines Toyota Honda GM.
| Milestones | |||||
| Milestone | Start Date | End Date | Budget | Manager | Department |
| First Thousand Vehicles Sold | 1/1/2003 | 1/1/2004 | $0 | Jack Anderson | Management |
| First Marketing Campaign | 1/1/2003 | 1/15/2003 | $1,000 | Jim Handy | Marketing |
| Publishing Website | 1/15/2003 | 2/15/2003 | $1,000 | Jim Handy | Web |
| Receive First Internet Sale | 2/15/2003 | 3/15/2003 | $0 | Sales Staff | Web |
| Develop Employee Policies | 1/1/2003 | 1/15/2003 | $0 | Frank Lee Good | Legal |
| Service First Customer’s Vehicle | 1/1/2003 | 1/15/2003 | $0 | Mechanic Staff | Mechanic |
| Refuel First Customer’s Vehicle | 1/1/2003 | 1/15/2003 | $0 | Jack Anderson | Photovoltaics |
| First Consumer Protection Review | 1/1/2003 | 3/15/2003 | $0 | Jack Anderson | Management |
| Second Marketing Campaign | 2/15/2003 | 3/15/2003 | $1,000 | Jim Handy | Marketing |
| Hire Sales and Mechanic | 1/1/2003 | 1/15/2003 | $0 | Board of Directors | Board of Directors |
| Totals | $3,000 | ||||
5.3 Marketing Strategy
Environmental Engines Toyota Honda GM’s media strategy will focus on direct marketing to local conservation groups, outdoors athletic clubs, and environmentally-sensitive political parties, as well as advertising in magazines marketed to automobile enthusiasts, engineers, hobbyists, mechanics and scientists, and through good ratings in consumer protection reports. Impact will grow from three executives (Jack Anderson, Jim Handy, and Frank Lee Good) plus a small group of three sales persons and one mechanic, all of who will bring their professional expertise and avocational contacts to Environmental Engines Toyota Honda GM and provide a solid foundation of connections for future marketing ventures.
5.4 Competitive Edge
Environmental Engines Toyota Honda GM holds a competitive edge by specializing in zero emissions vehicles and has franchised with every auto manufacturer that could offer any competition. Environmental Engines Toyota Honda GM will stand out as the preferable alternative to fossil fuel burning transportation systems. As visibility of our vehicles increases, sales among environmentalists and the younger generation will increase by 50% each month thereafter. As word spreads, this rate of increase will maintain steady for at least ten years amongst our target market in the younger generation who will continue to grow and develop over time.
Furthermore, our vehicles will readily attract new investment because we introduce the concept of sustainability to individual transportation systems by bringing fuel efficiency, economy of size, and environmentally friendlier alternatives to the market.
As the central distribution point of environmentally friendlier engines, Environmental Engines Toyota Honda GM will bring unparalleled know-how and will also aim to serve as a clearing house for product innovations and design patents.
Web Plan Summary
Environmental Engines Toyota Honda GM will host a site on the World Wide Web to serve as an educational tool, offering a menu of custom vehicle options to potential walk-in and telephone customers and as a B-2-B ordering site for a few very reliable purchasers, such as large corporations and municipalities.
The menu of custom vehicle options will require as little bandwidth as possible while providing as much photographic and text detail as possible to the potential customer. These potential customers will be the early-adopters who will encounter the exciting prospect of being an energy-pioneer, the younger generation surfing for the next cool look, and the environmentalist in search of alternative transportation options.
The B-2-B site will be accessible through an account number and will allow large corporations and municipalities with large bandwidth capacity to design large orders of vehicles to facilitate customized mass production orders to be forwarded on to Toyota, Honda and GM. Our B-2-B site can pivot off of the success of Toyota’s, Honda’s and GM’s online ordering.
6.1 Website Marketing Strategy
Environmental Engines Toyota Honda GM will host a site on the World Wide Web to serve as an educational tool, offering a menu of custom vehicle options to potential walk-in and telephone customers and as a B-2-B ordering site for a few very reliable purchasers, such as large corporations and municipalities.
6.2 Development Requirements
The menu of custom vehicle options will require as little bandwidth as possible while providing as much photographic and text detail as possible to the potential customer.
The B-2-B site will be accessible through an account number and will allow large corporations and municipalities with large bandwidth capacity to design large orders of vehicles to facilitate customized mass production orders to be forwarded on to Toyota, Honda and GM.
Management Summary
The founders and executive board of Environmental Engines Toyota Honda GM include such industry leaders as Jack Anderson, Jim Handy, and Frank Lee Good.
Jack Anderson, the majority owner, is renowned in both scientific and environmentalist communities throughout the nation. Jack Anderson earned two degrees from the University of Michigan the first in mechanical engineering, the second in business. Though Jack Anderson excelled academically, his sites were set even higher as president of the University of Michigan Mountaineering Club. Through his contacts in the mountaineering club Jack Anderson also developed an interest in consumer protection and environmentalism and served the Environmentalists For Future Occupationally Responsible Technicians (EFFORT) as treasurer. Through Jack’s activism in EFFORT, he met Jim Handy and Frank Lee Good.
After college, Jack managed an Internet-based custom-ordering automobile-hobbyist distribution company where he increased overall product sales by over 50% in three years. During this time, Jack also developed correspondence with columnists at the New York Times, the Scientific American, and Consumer Reports. In order to keep Jack as manager, the company offered Jack a 10% interest in the company’s stock, motivating Jack to increase the company’s value by 100% in the next five years. Throughout Jack’s eight years of managerial and ownership experience in auto sales, Jack has learned the finer points in eclectic car sales and marketing as well as the technical side of automobile engineering.
Jim Handy, public relations consultant, and Frank Lee Good, environmental and corporate attorney, can lend their professional services to the success of Environmental Engines Toyota Honda GM and are also vendors of outside services through which they may also lend clients and contacts for marketing purposes.
7.1 Personnel Plan
Jack Anderson will act as manager for the first three years for a minimal salary of $36,000 in exchange for his commitment of energy and know-how.
The executive staff will be compensated for their services by a return of profits on their investment.
Three sales staff will work the sales floor for the first year compensated solely by commissions earned on a 5% pay scale.
Two mechanics, specializing in alternative energy vehicles, will be paid $3,200 monthly. The mechanics’ salaries will steadily increase every year by 5% to reflect the increased human capital acquired by the mechanics’ maintenance experience with our vehicles and our photovoltaic cells.
The maintenance and secretarial staff will take care of administrative matters and sales room decorum.
| Personnel Plan | |||
| Year 1 | Year 2 | Year 3 | |
| Jack Anderson | $36,000 | $36,000 | $36,000 |
| Frank Lee Good | $0 | $0 | $0 |
| Jim Handy | $0 | $0 | $0 |
| Sales Person 1 | $12,480 | $13,104 | $13,759 |
| Sales Person 2 | $12,480 | $13,104 | $13,759 |
| Sales Person 3 | $12,480 | $13,104 | $13,759 |
| Sales Person 4 | $0 | $12,480 | $13,104 |
| Sales Person 5 | $0 | $0 | $12,480 |
| Sales Person 6 | $0 | $0 | $12,480 |
| Mechanic 1 | $38,400 | $40,320 | $42,336 |
| Maintenance | $12,480 | $13,104 | $13,759 |
| Secretary | $12,480 | $13,104 | $13,759 |
| Mechanic 2 | $38,400 | $40,320 | $42,336 |
| Total People | 0 | 0 | 0 |
| Total Payroll | $175,200 | $194,640 | $227,532 |
Financial Plan
Environmental Engines Toyota Honda GM is expected to grow in sales at a rate of 20% per month, starting from the conservative estimate of six cars sold. The financing will come initially from the executive board, allowing plenty of opportunity for credit to cover unforeseen expenses, if necessary. Growth will be rapid and produce profits almost immediately.
Profits will initially be repaid to the business to finance any overhead costs related to purchasing inventory and to pay down the principal on outstanding debt, then to the rapidly expanding photovoltaic recharging station and mechanic’s garage, then to pay off the initial investments.
Inventory will be purchased in advance to stock the showroom floor and to outfit every executive, sales person, and mechanic with a zero emissions vehicle to drive around town at their own cost. Their savings earned by investing in a zero emissions vehicle will spread by word-of-mouth, attract more customers, and bolster future growth at the same high rate of 20%.
8.1 Important Assumptions
Environmental Engines Toyota Honda GM has made some important assumptions about the costs of building business capacity and acquiring inventory. We will build our business capacity steadily based on the assumption of roughly $175,000 in annual payroll, 10% current and long-term interest rates, a 30% tax rate, and an available inventory totaling $9,616,733. Assuming demand does not outstrip supply, these conservative assumptions project immediate success for Environmental Engines Toyota Honda GM.
While we are prepared for our manufacturers to release new products during the next 12 months, drastic increases in the price of inventory could threaten the stability of our business. Such fluctuations would only be threatening if they were industry-wide (i.e., Toyota, Honda and GM all doubled the dealer’s wholesale cost of purchasing inventory.) Barring monopolistic manipulations of the supply of inventory, success is just around the corner.
| General Assumptions | |||
| Year 1 | Year 2 | Year 3 | |
| Plan Month | 1 | 2 | 3 |
| Current Interest Rate | 10.00% | 10.00% | 10.00% |
| Long-term Interest Rate | 10.00% | 10.00% | 10.00% |
| Tax Rate | 30.00% | 30.00% | 30.00% |
| Other | 0 | 0 | 0 |
8.2 Break-even Analysis
For our break-even analysis, we assume normal monthly running costs per month, as shown below, which include our full payroll, lease, marketing, utilities, and an estimation of other running expences. Payroll alone, at our present run rate, is only about $48,000 for two mechanics while all sales staff operate on commission.
Margins are harder to assume as the average per unit costs do not include marketing costs, promotions, or salesman commissions. Our overall average per unit revenue over per unit costs is based on past sales from other dealerships. We hope to attain a margin that high in the future.
The chart shows what we need to sell per month to break-even, according to these assumptions. This is less than one percent of our planned 2003 sales level, and significantly below last year’s average dealership sales level, so we believe we can maintain it.

| Break-even Analysis | |
| Monthly Revenue Break-even | $203,450 |
| Assumptions: | |
| Average Percent Variable Cost | 80% |
| Estimated Monthly Fixed Cost | $40,690 |
8.3 Projected Profit and Loss
Environmental Engines Toyota Honda GM anticipates a heady monthly increase in sales starting small (selling 6 cars in the first month). The gross margin within the first year will be modest, rising in the second and third year.
Key budget items will include salary, rent, sales and marketing expenses, utilities (including costs of photovoltaic cell maintenance), insurance, taxes and licensing.
Net profits will reach outstanding levels in the first year, escalating in the second and the third year! All of these profits can then be fed back into research and development opening the doorway to a secondary market role for Environmental Engines Toyota Honda GM as a patent holding company and clearing house.


| Pro Forma Profit and Loss | |||
| Year 1 | Year 2 | Year 3 | |
| Sales | $10,093,028 | $12,111,634 | $14,533,960 |
| Direct Cost of Sales | $8,074,422 | $8,478,144 | $10,173,772 |
| Sales Commission | $504,651 | $605,582 | $726,698 |
| Total Cost of Sales | $8,579,074 | $9,083,725 | $10,900,470 |
| Gross Margin | $1,513,954 | $3,027,908 | $3,633,490 |
| Gross Margin % | 15.00% | 25.00% | 25.00% |
| Expenses | |||
| Payroll | $175,200 | $194,640 | $227,532 |
| Sales and Marketing and Other Expenses | $180,000 | $189,000 | $198,450 |
| Depreciation | $14,400 | $14,400 | $14,400 |
| Rent | $60,000 | $60,000 | $60,000 |
| Utilities (Including costs of photovoltaic cell maintenance) | $18,000 | $18,900 | $19,845 |
| Insurance | $2,400 | $2,400 | $2,400 |
| Payroll Taxes | $26,280 | $29,196 | $34,130 |
| Licensing | $12,000 | $12,000 | $12,000 |
| Total Operating Expenses | $488,280 | $520,536 | $568,757 |
| Profit Before Interest and Taxes | $1,025,674 | $2,507,372 | $3,064,733 |
| EBITDA | $1,040,074 | $2,521,772 | $3,079,133 |
| Interest Expense | $304,500 | $224,000 | $140,000 |
| Taxes Incurred | $216,352 | $685,012 | $877,420 |
| Net Profit | $504,822 | $1,598,361 | $2,047,313 |
| Net Profit/Sales | 5.00% | 13.20% | 14.09% |
8.4 Projected Cash Flow
This table and chart show our exciting month-by-month cash flow for the next three years.

| Pro Forma Cash Flow | |||
| Year 1 | Year 2 | Year 3 | |
| Cash Received | |||
| Cash from Operations | |||
| Cash Sales | $2,523,257 | $3,027,908 | $3,633,490 |
| Cash from Receivables | $5,004,070 | $8,570,585 | $10,284,702 |
| Subtotal Cash from Operations | $7,527,327 | $11,598,494 | $13,918,192 |
| Additional Cash Received | |||
| Sales Tax, VAT, HST/GST Received | $0 | $0 | $0 |
| New Current Borrowing | $0 | $0 | $0 |
| New Other Liabilities (interest-free) | $0 | $0 | $0 |
| New Long-term Liabilities | $0 | $0 | $0 |
| Sales of Other Current Assets | $0 | $0 | $0 |
| Sales of Long-term Assets | $0 | $0 | $0 |
| New Investment Received | $0 | $0 | $0 |
| Subtotal Cash Received | $7,527,327 | $11,598,494 | $13,918,192 |
| Expenditures | Year 1 | Year 2 | Year 3 |
| Expenditures from Operations | |||
| Cash Spending | $175,200 | $194,640 | $227,532 |
| Bill Payments | $9,005,828 | $11,468,912 | $12,413,432 |
| Subtotal Spent on Operations | $9,181,028 | $11,663,552 | $12,640,964 |
| Additional Cash Spent | |||
| Sales Tax, VAT, HST/GST Paid Out | $0 | $0 | $0 |
| Principal Repayment of Current Borrowing | $360,000 | $360,000 | $360,000 |
| Other Liabilities Principal Repayment | $0 | $0 | $0 |
| Long-term Liabilities Principal Repayment | $480,000 | $480,000 | $480,000 |
| Purchase Other Current Assets | $0 | $0 | $0 |
| Purchase Long-term Assets | $0 | $0 | $0 |
| Dividends | $0 | $0 | $0 |
| Subtotal Cash Spent | $10,021,028 | $12,503,552 | $13,480,964 |
| Net Cash Flow | ($2,493,701) | ($905,058) | $437,228 |
| Cash Balance | $1,116,349 | $211,291 | $648,518 |
8.5 Projected Balance Sheet
The Balance Sheet includes all assets, liabilities, and capital of Environmental Engines Toyota Honda GM.
| Pro Forma Balance Sheet | |||
| Year 1 | Year 2 | Year 3 | |
| Assets | |||
| Current Assets | |||
| Cash | $1,116,349 | $211,291 | $648,518 |
| Accounts Receivable | $2,565,701 | $3,078,841 | $3,694,609 |
| Inventory | $1,667,311 | $1,750,676 | $2,100,812 |
| Other Current Assets | $189,500 | $189,500 | $189,500 |
| Total Current Assets | $5,538,860 | $5,230,308 | $6,633,439 |
| Long-term Assets | |||
| Long-term Assets | $440,000 | $440,000 | $440,000 |
| Accumulated Depreciation | $14,400 | $28,800 | $43,200 |
| Total Long-term Assets | $425,600 | $411,200 | $396,800 |
| Total Assets | $5,964,460 | $5,641,508 | $7,030,239 |
| Liabilities and Capital | Year 1 | Year 2 | Year 3 |
| Current Liabilities | |||
| Accounts Payable | $1,935,088 | $853,775 | $1,035,193 |
| Current Borrowing | $1,640,000 | $1,280,000 | $920,000 |
| Other Current Liabilities | $178,000 | $178,000 | $178,000 |
| Subtotal Current Liabilities | $3,753,088 | $2,311,775 | $2,133,193 |
| Long-term Liabilities | $1,020,000 | $540,000 | $60,000 |
| Total Liabilities | $4,773,088 | $2,851,775 | $2,193,193 |
| Paid-in Capital | $1,500,000 | $1,500,000 | $1,500,000 |
| Retained Earnings | ($813,450) | ($308,628) | $1,289,733 |
| Earnings | $504,822 | $1,598,361 | $2,047,313 |
| Total Capital | $1,191,372 | $2,789,733 | $4,837,046 |
| Total Liabilities and Capital | $5,964,460 | $5,641,508 | $7,030,239 |
| Net Worth | $1,191,372 | $2,789,733 | $4,837,046 |
8.6 Business Ratios
The business ratios table is based on accurate research of a collection of standard business ratios for a zero emissions car dealership specializing in hybrid and electric vehicles. Our projections for this niche market are compared to a collection of standard business ratios for other auto sales industries.
The variance between our ratios and those of other auto sales industries is a function of the exact nature of Environmental Engines Toyota Honda GM.
- Where market saturation has stifled our competitors’ sales growth, our sales growth reaches respecatable levels after the first year because this is a pre-boom market. Environmental Engines Toyota Honda GM is an industry-pioneer in an auto sales market that is about to experience tremendous growth.
- Where our accounts receivable seem high relative to our competitors, we have targeted the younger generation as one of our key growth markets and have calculated a high ratio of sales on credit accordingly.
- Our inventory will remain low, overcoming a weakness of other auto sales companies because we emphasize customized vehicle design, ensuring each vehicle satisfies every customer and limiting our overhead in inventory.
Each of these values are acceptable, and in fact, preferable to the ratios demonstrated by industry competitors.
| Ratio Analysis | ||||
| Year 1 | Year 2 | Year 3 | Industry Profile | |
| Sales Growth | 0.00% | 20.00% | 20.00% | 6.06% |
| Percent of Total Assets | ||||
| Accounts Receivable | 43.02% | 54.57% | 52.55% | 14.27% |
| Inventory | 27.95% | 31.03% | 29.88% | 62.82% |
| Other Current Assets | 3.18% | 3.36% | 2.70% | 14.66% |
| Total Current Assets | 92.86% | 92.71% | 94.36% | 91.75% |
| Long-term Assets | 7.14% | 7.29% | 5.64% | 8.25% |
| Total Assets | 100.00% | 100.00% | 100.00% | 100.00% |
| Current Liabilities | 62.92% | 40.98% | 30.34% | 40.75% |
| Long-term Liabilities | 17.10% | 9.57% | 0.85% | 8.35% |
| Total Liabilities | 80.03% | 50.55% | 31.20% | 49.10% |
| Net Worth | 19.97% | 49.45% | 68.80% | 50.90% |
| Percent of Sales | ||||
| Sales | 100.00% | 100.00% | 100.00% | 100.00% |
| Gross Margin | 15.00% | 25.00% | 25.00% | 7.81% |
| Selling, General & Administrative Expenses | 9.86% | 11.49% | 10.48% | 3.80% |
| Advertising Expenses | 0.00% | 0.00% | 0.00% | 0.93% |
| Profit Before Interest and Taxes | 10.16% | 20.70% | 21.09% | 0.31% |
| Main Ratios | ||||
| Current | 1.48 | 2.26 | 3.11 | 2.16 |
| Quick | 1.03 | 1.51 | 2.12 | 0.56 |
| Total Debt to Total Assets | 80.03% | 50.55% | 31.20% | 52.00% |
| Pre-tax Return on Net Worth | 60.53% | 81.85% | 60.47% | 2.74% |
| Pre-tax Return on Assets | 12.09% | 40.47% | 41.60% | 5.70% |
| Additional Ratios | Year 1 | Year 2 | Year 3 | |
| Net Profit Margin | 5.00% | 13.20% | 14.09% | n.a |
| Return on Equity | 42.37% | 57.29% | 42.33% | n.a |
| Activity Ratios | ||||
| Accounts Receivable Turnover | 2.95 | 2.95 | 2.95 | n.a |
| Collection Days | 54 | 113 | 113 | n.a |
| Inventory Turnover | 10.91 | 4.96 | 5.28 | n.a |
| Accounts Payable Turnover | 5.65 | 12.17 | 12.17 | n.a |
| Payment Days | 27 | 49 | 27 | n.a |
| Total Asset Turnover | 1.69 | 2.15 | 2.07 | n.a |
| Debt Ratios | ||||
| Debt to Net Worth | 4.01 | 1.02 | 0.45 | n.a |
| Current Liab. to Liab. | 0.79 | 0.81 | 0.97 | n.a |
| Liquidity Ratios | ||||
| Net Working Capital | $1,785,772 | $2,918,533 | $4,500,246 | n.a |
| Interest Coverage | 3.37 | 11.19 | 21.89 | n.a |
| Additional Ratios | ||||
| Assets to Sales | 0.59 | 0.47 | 0.48 | n.a |
| Current Debt/Total Assets | 63% | 41% | 30% | n.a |
| Acid Test | 0.35 | 0.17 | 0.39 | n.a |
| Sales/Net Worth | 8.47 | 4.34 | 3.00 | n.a |
| Dividend Payout | 0.00 | 0.00 | 0.00 | n.a |
Appendix
| Sales Forecast | |||||||||||||
| Month 1 | Month 2 | Month 3 | Month 4 | Month 5 | Month 6 | Month 7 | Month 8 | Month 9 | Month 10 | Month 11 | Month 12 | ||
| Sales | |||||||||||||
| Toyota Prius | 0% | $150,000 | $180,000 | $216,000 | $259,200 | $311,040 | $373,248 | $447,898 | $537,477 | $644,973 | $773,967 | $928,760 | $1,114,513 |
| Toyota RAV4 | 0% | $70,000 | $84,000 | $100,800 | $120,960 | $145,152 | $174,182 | $209,019 | $250,823 | $300,987 | $361,185 | $433,422 | $520,106 |
| Honda | 0% | $25,000 | $30,000 | $36,000 | $43,200 | $51,840 | $62,208 | $74,650 | $89,580 | $107,495 | $128,995 | $154,793 | $185,752 |
| GM | 0% | $0 | $0 | $0 | $0 | $0 | $0 | $0 | $0 | $0 | $0 | $0 | $0 |
| Mechanic Labor | 0% | $10,000 | $12,000 | $14,400 | $17,280 | $20,736 | $24,883 | $29,860 | $35,832 | $42,998 | $51,598 | $61,917 | $74,301 |
| Total Sales | $255,000 | $306,000 | $367,200 | $440,640 | $528,768 | $634,522 | $761,426 | $913,711 | $1,096,453 | $1,315,744 | $1,578,893 | $1,894,671 | |
| Direct Cost of Sales | Month 1 | Month 2 | Month 3 | Month 4 | Month 5 | Month 6 | Month 7 | Month 8 | Month 9 | Month 10 | Month 11 | Month 12 | |
| Toyota Prius | $120,000 | $144,000 | $172,800 | $207,360 | $248,832 | $298,598 | $358,318 | $429,982 | $515,978 | $619,174 | $743,008 | $891,610 | |
| Toyota RAV4 | $56,000 | $67,200 | $80,640 | $96,768 | $116,122 | $139,346 | $167,215 | $200,658 | $240,790 | $288,948 | $346,737 | $416,085 | |
| Honda | $20,000 | $24,000 | $28,800 | $34,560 | $41,472 | $49,766 | $59,720 | $71,664 | $85,996 | $103,196 | $123,835 | $148,602 | |
| GM | $0 | $0 | $0 | $0 | $0 | $0 | $0 | $0 | $0 | $0 | $0 | $0 | |
| Mechanic Labor | $8,000 | $9,600 | $11,520 | $13,824 | $16,589 | $19,907 | $23,888 | $28,665 | $34,399 | $41,278 | $49,534 | $59,441 | |
| Subtotal Direct Cost of Sales | $204,000 | $244,800 | $293,760 | $352,512 | $423,014 | $507,617 | $609,141 | $730,969 | $877,163 | $1,052,595 | $1,263,114 | $1,515,737 | |
| Personnel Plan | |||||||||||||
| Month 1 | Month 2 | Month 3 | Month 4 | Month 5 | Month 6 | Month 7 | Month 8 | Month 9 | Month 10 | Month 11 | Month 12 | ||
| Jack Anderson | 0% | $3,000 | $3,000 | $3,000 | $3,000 | $3,000 | $3,000 | $3,000 | $3,000 | $3,000 | $3,000 | $3,000 | $3,000 |
| Frank Lee Good | 0% | $0 | $0 | $0 | $0 | $0 | $0 | $0 | $0 | $0 | $0 | $0 | $0 |
| Jim Handy | 0% | $0 | $0 | $0 | $0 | $0 | $0 | $0 | $0 | $0 | $0 | $0 | $0 |
| Sales Person 1 | 0% | $1,040 | $1,040 | $1,040 | $1,040 | $1,040 | $1,040 | $1,040 | $1,040 | $1,040 | $1,040 | $1,040 | $1,040 |
| Sales Person 2 | 0% | $1,040 | $1,040 | $1,040 | $1,040 | $1,040 | $1,040 | $1,040 | $1,040 | $1,040 | $1,040 | $1,040 | $1,040 |
| Sales Person 3 | 0% | $1,040 | $1,040 | $1,040 | $1,040 | $1,040 | $1,040 | $1,040 | $1,040 | $1,040 | $1,040 | $1,040 | $1,040 |
| Sales Person 4 | 0% | $0 | $0 | $0 | $0 | $0 | $0 | $0 | $0 | $0 | $0 | $0 | $0 |
| Sales Person 5 | 0% | $0 | $0 | $0 | $0 | $0 | $0 | $0 | $0 | $0 | $0 | $0 | $0 |
| Sales Person 6 | 0% | $0 | $0 | $0 | $0 | $0 | $0 | $0 | $0 | $0 | $0 | $0 | $0 |
| Mechanic 1 | 0% | $3,200 | $3,200 | $3,200 | $3,200 | $3,200 | $3,200 | $3,200 | $3,200 | $3,200 | $3,200 | $3,200 | $3,200 |
| Maintenance | 0% | $1,040 | $1,040 | $1,040 | $1,040 | $1,040 | $1,040 | $1,040 | $1,040 | $1,040 | $1,040 | $1,040 | $1,040 |
| Secretary | 0% | $1,040 | $1,040 | $1,040 | $1,040 | $1,040 | $1,040 | $1,040 | $1,040 | $1,040 | $1,040 | $1,040 | $1,040 |
| Mechanic 2 | 0% | $3,200 | $3,200 | $3,200 | $3,200 | $3,200 | $3,200 | $3,200 | $3,200 | $3,200 | $3,200 | $3,200 | $3,200 |
| Total People | 0 | 0 | 0 | 0 | 0 | 0 | 0 | 0 | 0 | 0 | 0 | 0 | |
| Total Payroll | $14,600 | $14,600 | $14,600 | $14,600 | $14,600 | $14,600 | $14,600 | $14,600 | $14,600 | $14,600 | $14,600 | $14,600 | |
| General Assumptions | |||||||||||||
| Month 1 | Month 2 | Month 3 | Month 4 | Month 5 | Month 6 | Month 7 | Month 8 | Month 9 | Month 10 | Month 11 | Month 12 | ||
| Plan Month | 1 | 2 | 3 | 4 | 5 | 6 | 7 | 8 | 9 | 10 | 11 | 12 | |
| Current Interest Rate | 10.00% | 10.00% | 10.00% | 10.00% | 10.00% | 10.00% | 10.00% | 10.00% | 10.00% | 10.00% | 10.00% | 10.00% | |
| Long-term Interest Rate | 10.00% | 10.00% | 10.00% | 10.00% | 10.00% | 10.00% | 10.00% | 10.00% | 10.00% | 10.00% | 10.00% | 10.00% | |
| Tax Rate | 30.00% | 30.00% | 30.00% | 30.00% | 30.00% | 30.00% | 30.00% | 30.00% | 30.00% | 30.00% | 30.00% | 30.00% | |
| Other | 0 | 0 | 0 | 0 | 0 | 0 | 0 | 0 | 0 | 0 | 0 | 0 | |
| Pro Forma Profit and Loss | |||||||||||||
| Month 1 | Month 2 | Month 3 | Month 4 | Month 5 | Month 6 | Month 7 | Month 8 | Month 9 | Month 10 | Month 11 | Month 12 | ||
| Sales | $255,000 | $306,000 | $367,200 | $440,640 | $528,768 | $634,522 | $761,426 | $913,711 | $1,096,453 | $1,315,744 | $1,578,893 | $1,894,671 | |
| Direct Cost of Sales | $204,000 | $244,800 | $293,760 | $352,512 | $423,014 | $507,617 | $609,141 | $730,969 | $877,163 | $1,052,595 | $1,263,114 | $1,515,737 | |
| Sales Commission | $12,750 | $15,300 | $18,360 | $22,032 | $26,438 | $31,726 | $38,071 | $45,686 | $54,823 | $65,787 | $78,945 | $94,734 | |
| Total Cost of Sales | $216,750 | $260,100 | $312,120 | $374,544 | $449,453 | $539,343 | $647,212 | $776,654 | $931,985 | $1,118,382 | $1,342,059 | $1,610,471 | |
| Gross Margin | $38,250 | $45,900 | $55,080 | $66,096 | $79,315 | $95,178 | $114,214 | $137,057 | $164,468 | $197,362 | $236,834 | $284,201 | |
| Gross Margin % | 15.00% | 15.00% | 15.00% | 15.00% | 15.00% | 15.00% | 15.00% | 15.00% | 15.00% | 15.00% | 15.00% | 15.00% | |
| Expenses | |||||||||||||
| Payroll | $14,600 | $14,600 | $14,600 | $14,600 | $14,600 | $14,600 | $14,600 | $14,600 | $14,600 | $14,600 | $14,600 | $14,600 | |
| Sales and Marketing and Other Expenses | $15,000 | $15,000 | $15,000 | $15,000 | $15,000 | $15,000 | $15,000 | $15,000 | $15,000 | $15,000 | $15,000 | $15,000 | |
| Depreciation | $1,200 | $1,200 | $1,200 | $1,200 | $1,200 | $1,200 | $1,200 | $1,200 | $1,200 | $1,200 | $1,200 | $1,200 | |
| Rent | $5,000 | $5,000 | $5,000 | $5,000 | $5,000 | $5,000 | $5,000 | $5,000 | $5,000 | $5,000 | $5,000 | $5,000 | |
| Utilities (Including costs of photovoltaic cell maintenance) | $1,500 | $1,500 | $1,500 | $1,500 | $1,500 | $1,500 | $1,500 | $1,500 | $1,500 | $1,500 | $1,500 | $1,500 | |
| Insurance | $200 | $200 | $200 | $200 | $200 | $200 | $200 | $200 | $200 | $200 | $200 | $200 | |
| Payroll Taxes | 15% | $2,190 | $2,190 | $2,190 | $2,190 | $2,190 | $2,190 | $2,190 | $2,190 | $2,190 | $2,190 | $2,190 | $2,190 |
| Licensing | $1,000 | $1,000 | $1,000 | $1,000 | $1,000 | $1,000 | $1,000 | $1,000 | $1,000 | $1,000 | $1,000 | $1,000 | |
| Total Operating Expenses | $40,690 | $40,690 | $40,690 | $40,690 | $40,690 | $40,690 | $40,690 | $40,690 | $40,690 | $40,690 | $40,690 | $40,690 | |
| Profit Before Interest and Taxes | ($2,440) | $5,210 | $14,390 | $25,406 | $38,625 | $54,488 | $73,524 | $96,367 | $123,778 | $156,672 | $196,144 | $243,511 | |
| EBITDA | ($1,240) | $6,410 | $15,590 | $26,606 | $39,825 | $55,688 | $74,724 | $97,567 | $124,978 | $157,872 | $197,344 | $244,711 | |
| Interest Expense | $28,583 | $28,000 | $27,417 | $26,833 | $26,250 | $25,667 | $25,083 | $24,500 | $23,917 | $23,333 | $22,750 | $22,167 | |
| Taxes Incurred | ($9,307) | ($6,837) | ($3,908) | ($428) | $3,713 | $8,646 | $14,532 | $21,560 | $29,958 | $40,001 | $52,018 | $66,403 | |
| Net Profit | ($21,716) | ($15,953) | ($9,119) | ($999) | $8,663 | $20,175 | $33,908 | $50,307 | $69,903 | $93,337 | $121,376 | $154,941 | |
| Net Profit/Sales | -8.52% | -5.21% | -2.48% | -0.23% | 1.64% | 3.18% | 4.45% | 5.51% | 6.38% | 7.09% | 7.69% | 8.18% | |
| Pro Forma Cash Flow | |||||||||||||
| Month 1 | Month 2 | Month 3 | Month 4 | Month 5 | Month 6 | Month 7 | Month 8 | Month 9 | Month 10 | Month 11 | Month 12 | ||
| Cash Received | |||||||||||||
| Cash from Operations | |||||||||||||
| Cash Sales | $63,750 | $76,500 | $91,800 | $110,160 | $132,192 | $158,630 | $190,356 | $228,428 | $274,113 | $328,936 | $394,723 | $473,668 | |
| Cash from Receivables | $0 | $6,375 | $192,525 | $231,030 | $277,236 | $332,683 | $399,220 | $479,064 | $574,877 | $689,852 | $827,822 | $993,387 | |
| Subtotal Cash from Operations | $63,750 | $82,875 | $284,325 | $341,190 | $409,428 | $491,314 | $589,576 | $707,492 | $848,990 | $1,018,788 | $1,222,545 | $1,467,055 | |
| Additional Cash Received | |||||||||||||
| Sales Tax, VAT, HST/GST Received | 0.00% | $0 | $0 | $0 | $0 | $0 | $0 | $0 | $0 | $0 | $0 | $0 | $0 |
| New Current Borrowing | $0 | $0 | $0 | $0 | $0 | $0 | $0 | $0 | $0 | $0 | $0 | $0 | |
| New Other Liabilities (interest-free) | $0 | $0 | $0 | $0 | $0 | $0 | $0 | $0 | $0 | $0 | $0 | $0 | |
| New Long-term Liabilities | $0 | $0 | $0 | $0 | $0 | $0 | $0 | $0 | $0 | $0 | $0 | $0 | |
| Sales of Other Current Assets | $0 | $0 | $0 | $0 | $0 | $0 | $0 | $0 | $0 | $0 | $0 | $0 | |
| Sales of Long-term Assets | $0 | $0 | $0 | $0 | $0 | $0 | $0 | $0 | $0 | $0 | $0 | $0 | |
| New Investment Received | $0 | $0 | $0 | $0 | $0 | $0 | $0 | $0 | $0 | $0 | $0 | $0 | |
| Subtotal Cash Received | $63,750 | $82,875 | $284,325 | $341,190 | $409,428 | $491,314 | $589,576 | $707,492 | $848,990 | $1,018,788 | $1,222,545 | $1,467,055 | |
| Expenditures | Month 1 | Month 2 | Month 3 | Month 4 | Month 5 | Month 6 | Month 7 | Month 8 | Month 9 | Month 10 | Month 11 | Month 12 | |
| Expenditures from Operations | |||||||||||||
| Cash Spending | $14,600 | $14,600 | $14,600 | $14,600 | $14,600 | $14,600 | $14,600 | $14,600 | $14,600 | $14,600 | $14,600 | $14,600 | |
| Bill Payments | $12,011 | $360,007 | $353,144 | $416,911 | $493,513 | $585,516 | $696,002 | $828,667 | $987,947 | $1,179,164 | $1,408,706 | $1,684,239 | |
| Subtotal Spent on Operations | $26,611 | $374,607 | $367,744 | $431,511 | $508,113 | $600,116 | $710,602 | $843,267 | $1,002,547 | $1,193,764 | $1,423,306 | $1,698,839 | |
| Additional Cash Spent | |||||||||||||
| Sales Tax, VAT, HST/GST Paid Out | $0 | $0 | $0 | $0 | $0 | $0 | $0 | $0 | $0 | $0 | $0 | $0 | |
| Principal Repayment of Current Borrowing | $30,000 | $30,000 | $30,000 | $30,000 | $30,000 | $30,000 | $30,000 | $30,000 | $30,000 | $30,000 | $30,000 | $30,000 | |
| Other Liabilities Principal Repayment | $0 | $0 | $0 | $0 | $0 | $0 | $0 | $0 | $0 | $0 | $0 | $0 | |
| Long-term Liabilities Principal Repayment | $40,000 | $40,000 | $40,000 | $40,000 | $40,000 | $40,000 | $40,000 | $40,000 | $40,000 | $40,000 | $40,000 | $40,000 | |
| Purchase Other Current Assets | $0 | $0 | $0 | $0 | $0 | $0 | $0 | $0 | $0 | $0 | $0 | $0 | |
| Purchase Long-term Assets | $0 | $0 | $0 | $0 | $0 | $0 | $0 | $0 | $0 | $0 | $0 | $0 | |
| Dividends | $0 | $0 | $0 | $0 | $0 | $0 | $0 | $0 | $0 | $0 | $0 | $0 | |
| Subtotal Cash Spent | $96,611 | $444,607 | $437,744 | $501,511 | $578,113 | $670,116 | $780,602 | $913,267 | $1,072,547 | $1,263,764 | $1,493,306 | $1,768,839 | |
| Net Cash Flow | ($32,861) | ($361,732) | ($153,419) | ($160,321) | ($168,685) | ($178,803) | ($191,026) | ($205,776) | ($223,557) | ($244,976) | ($270,761) | ($301,784) | |
| Cash Balance | $3,577,189 | $3,215,458 | $3,062,038 | $2,901,717 | $2,733,032 | $2,554,230 | $2,363,203 | $2,157,428 | $1,933,871 | $1,688,894 | $1,418,133 | $1,116,349 | |
| Pro Forma Balance Sheet | |||||||||||||
| Month 1 | Month 2 | Month 3 | Month 4 | Month 5 | Month 6 | Month 7 | Month 8 | Month 9 | Month 10 | Month 11 | Month 12 | ||
| Assets | Starting Balances | ||||||||||||
| Current Assets | |||||||||||||
| Cash | $3,610,050 | $3,577,189 | $3,215,458 | $3,062,038 | $2,901,717 | $2,733,032 | $2,554,230 | $2,363,203 | $2,157,428 | $1,933,871 | $1,688,894 | $1,418,133 | $1,116,349 |
| Accounts Receivable | $0 | $191,250 | $414,375 | $497,250 | $596,700 | $716,040 | $859,248 | $1,031,098 | $1,237,317 | $1,484,781 | $1,781,737 | $2,138,084 | $2,565,701 |
| Inventory | $125,000 | $224,400 | $269,280 | $323,136 | $387,763 | $465,316 | $558,379 | $670,055 | $804,066 | $964,879 | $1,157,855 | $1,389,426 | $1,667,311 |
| Other Current Assets | $189,500 | $189,500 | $189,500 | $189,500 | $189,500 | $189,500 | $189,500 | $189,500 | $189,500 | $189,500 | $189,500 | $189,500 | $189,500 |
| Total Current Assets | $3,924,550 | $4,182,339 | $4,088,613 | $4,071,924 | $4,075,680 | $4,103,888 | $4,161,357 | $4,253,856 | $4,388,311 | $4,573,030 | $4,817,986 | $5,135,143 | $5,538,860 |
| Long-term Assets | |||||||||||||
| Long-term Assets | $440,000 | $440,000 | $440,000 | $440,000 | $440,000 | $440,000 | $440,000 | $440,000 | $440,000 | $440,000 | $440,000 | $440,000 | $440,000 |
| Accumulated Depreciation | $0 | $1,200 | $2,400 | $3,600 | $4,800 | $6,000 | $7,200 | $8,400 | $9,600 | $10,800 | $12,000 | $13,200 | $14,400 |
| Total Long-term Assets | $440,000 | $438,800 | $437,600 | $436,400 | $435,200 | $434,000 | $432,800 | $431,600 | $430,400 | $429,200 | $428,000 | $426,800 | $425,600 |
| Total Assets | $4,364,550 | $4,621,139 | $4,526,213 | $4,508,324 | $4,510,880 | $4,537,888 | $4,594,157 | $4,685,456 | $4,818,711 | $5,002,230 | $5,245,986 | $5,561,943 | $5,964,460 |
| Liabilities and Capital | Month 1 | Month 2 | Month 3 | Month 4 | Month 5 | Month 6 | Month 7 | Month 8 | Month 9 | Month 10 | Month 11 | Month 12 | |
| Current Liabilities | |||||||||||||
| Accounts Payable | $0 | $348,306 | $339,332 | $400,562 | $474,117 | $562,463 | $668,556 | $795,947 | $948,895 | $1,132,511 | $1,352,930 | $1,617,512 | $1,935,088 |
| Current Borrowing | $2,000,000 | $1,970,000 | $1,940,000 | $1,910,000 | $1,880,000 | $1,850,000 | $1,820,000 | $1,790,000 | $1,760,000 | $1,730,000 | $1,700,000 | $1,670,000 | $1,640,000 |
| Other Current Liabilities | $178,000 | $178,000 | $178,000 | $178,000 | $178,000 | $178,000 | $178,000 | $178,000 | $178,000 | $178,000 | $178,000 | $178,000 | $178,000 |
| Subtotal Current Liabilities | $2,178,000 | $2,496,306 | $2,457,332 | $2,488,562 | $2,532,117 | $2,590,463 | $2,666,556 | $2,763,947 | $2,886,895 | $3,040,511 | $3,230,930 | $3,465,512 | $3,753,088 |
| Long-term Liabilities | $1,500,000 | $1,460,000 | $1,420,000 | $1,380,000 | $1,340,000 | $1,300,000 | $1,260,000 | $1,220,000 | $1,180,000 | $1,140,000 | $1,100,000 | $1,060,000 | $1,020,000 |
| Total Liabilities | $3,678,000 | $3,956,306 | $3,877,332 | $3,868,562 | $3,872,117 | $3,890,463 | $3,926,556 | $3,983,947 | $4,066,895 | $4,180,511 | $4,330,930 | $4,525,512 | $4,773,088 |
| Paid-in Capital | $1,500,000 | $1,500,000 | $1,500,000 | $1,500,000 | $1,500,000 | $1,500,000 | $1,500,000 | $1,500,000 | $1,500,000 | $1,500,000 | $1,500,000 | $1,500,000 | $1,500,000 |
| Retained Earnings | ($813,450) | ($813,450) | ($813,450) | ($813,450) | ($813,450) | ($813,450) | ($813,450) | ($813,450) | ($813,450) | ($813,450) | ($813,450) | ($813,450) | ($813,450) |
| Earnings | $0 | ($21,716) | ($37,669) | ($46,788) | ($47,787) | ($39,124) | ($18,949) | $14,959 | $65,266 | $135,169 | $228,505 | $349,881 | $504,822 |
| Total Capital | $686,550 | $664,834 | $648,881 | $639,762 | $638,763 | $647,426 | $667,601 | $701,509 | $751,816 | $821,719 | $915,055 | $1,036,431 | $1,191,372 |
| Total Liabilities and Capital | $4,364,550 | $4,621,139 | $4,526,213 | $4,508,324 | $4,510,880 | $4,537,888 | $4,594,157 | $4,685,456 | $4,818,711 | $5,002,230 | $5,245,986 | $5,561,943 | $5,964,460 |
| Net Worth | $686,550 | $664,834 | $648,881 | $639,762 | $638,763 | $647,426 | $667,601 | $701,509 | $751,816 | $821,719 | $915,055 | $1,036,431 | $1,191,372 |


