
Green Power Consultancy
Executive Summary
Green Power Consultancy is a start-up organization in Burlington, VT that offers designs and advice to architects and consumers regarding environmentally sensitive buildings as well as energy consumption recommendations. Green Power has identified three keys to its success. The first is the need to only offer solutions which are based on market demand. The second is to ensure that all of its offerings are based on economic justifications; the solution should make sense beyond the environmental considerations because it has long-term economic value.
Green Power will be targeting architects and individual consumers. Green Power will work closely with several architects providing them the ability to offer environmental solutions to their customers. This group is growing at 7% and there are 23 potential customers in the area. The second customer group is individual consumers; an environmentally conscious group that have sought out a service provider to help them implement their personal ethics into the design of their new or existing structure.
Green Power is an environmental energy consultancy that offers a wide range of services: advice regarding passive heating, grey water usage recommendations, renewable energy considerations and employee transportation options.
Green Power will be led by the seasoned management team of Dan and Sue Lang. Dan received a degree in environmental studies, business, and a Masters in architecture. Dan has several years of work experience within the industry. The second part of the team is Sue Lang. Sue has an MBA and work experience with the Bonneville Power Administration in their renewable energy department. Through a combination of excellent education and good work experience, Green Power’s management team will be able to successfully execute on its business plan.
Green Power has conservatively forecasted sales of $202,343 for year two, rising to $238,402 for year three. Net profit will be reached in the second year. Through a combination of a proven business model, a strong management team, and this comprehensive energy business plan to guide the organization, Green Power will be long lasting, profitable business.

Mission
It is Green Power Consultancy’s mission to provide the finest green energy solutions for new constructions as well as existing building owners/lessors. Through careful analysis, attentive customer support, and cost effective solutions, Green Power will become a stable business serving the Burlington community.
Keys to Success
Green Power has identified several keys to success that will be instrumental in creating a sustainable business. If these keys are followed, the likelihood of success will significantly increase.
- Offer solutions that are demanded by customers.
- Ensure all of the solutions have economic considerations built into the respective models.
- Only provide 100% customer satisfaction. All customers must have their expectations exceeded.
Objectives
Green Power has identified three objectives that it will pursue for the long-term success of the business:
- Proven cost-benefit analysis environmental approaches to structure building, maintenance and energy consumption.
- Become the premier environmental energy consultancy in the state within five years.
- Reach profitability within three years.
Company Summary
Green Power is a Vermont-based L.L.C green energy consultancy. Green Power offers its services both to architects who are constructing new businesses as well as existing building owners/users who are looking to make their existing structure more environmentally sound.
Start-up Summary
Green Power will require the following equipment in order to begin operations:
- Computer system including three workstations, standard laser printer as well as a wide mouth printer, Internet access, and assorted software such as Microsoft Office, QuickBooks and CadArchitect (the premier architect industry software).
- Three work areas including two drawing tables and the assorted office supplies for the standard workdesks as well as the drawing tables.
- Various bookshelves, lights, and couches (for clients).
- Bike storage unit/locker.
- Refrigerator, microwave, and assorted utensils for the lunch room.
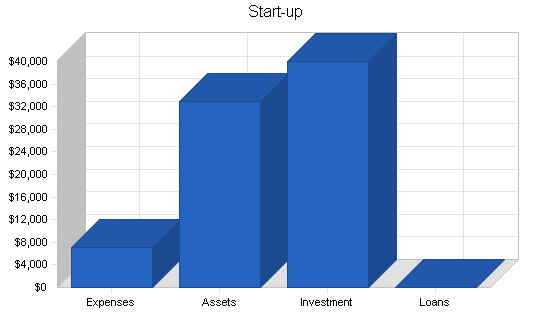
| Start-up Funding | |
| Start-up Expenses to Fund | $7,150 |
| Start-up Assets to Fund | $32,850 |
| Total Funding Required | $40,000 |
| Assets | |
| Non-cash Assets from Start-up | $9,000 |
| Cash Requirements from Start-up | $23,850 |
| Additional Cash Raised | $0 |
| Cash Balance on Starting Date | $23,850 |
| Total Assets | $32,850 |
| Liabilities and Capital | |
| Liabilities | |
| Current Borrowing | $0 |
| Long-term Liabilities | $0 |
| Accounts Payable (Outstanding Bills) | $0 |
| Other Current Liabilities (interest-free) | $0 |
| Total Liabilities | $0 |
| Capital | |
| Planned Investment | |
| Investor 1 | $20,000 |
| Investor 2 | $20,000 |
| Additional Investment Requirement | $0 |
| Total Planned Investment | $40,000 |
| Loss at Start-up (Start-up Expenses) | ($7,150) |
| Total Capital | $32,850 |
| Total Capital and Liabilities | $32,850 |
| Total Funding | $40,000 |
| Start-up | |
| Requirements | |
| Start-up Expenses | |
| Legal | $2,000 |
| Stationery etc. | $200 |
| Brochures | $200 |
| Rent | $500 |
| Research and Development | $3,500 |
| Expensed Equipment | $750 |
| Total Start-up Expenses | $7,150 |
| Start-up Assets | |
| Cash Required | $23,850 |
| Other Current Assets | $0 |
| Long-term Assets | $9,000 |
| Total Assets | $32,850 |
| Total Requirements | $40,000 |
Company Ownership
The two principal owners of Green Power is Dan and Sue Lang.
Services
Green Power offers a wide range of environmentally-conscious energy solutions related to new and existing structures. The main areas of consulting that Green Power will offer are:
- Passive heating: This applies to the construction of the new structures, designing the structure to capture and utilize heat that is either generated naturally or as a by-product of the building. Examples of passive heating include specific placement of the heating vents, the design and placement of the building and the windows.
- Grey water: This is the capture and utilization of grey water. Grey water is water that has been used for some other source such as in the faucets or rain water that can no longer be offered as potable, but still can be used for toilet flushing or land irrigation.
- Renewable energy: This service offers customers the information needed to make intelligent decisions regarding the use of renewable energy sources. Renewable energy sources can be defined as sources of energy where the rate of energy depletion is not faster than the production rate. Examples include: wind power, photovoltaics, hydro power, biomass, solar energy.
- Employee transportation: This service is to reduce the energy consumed by employees traveling to work. Typical aspects of the plan are outlining public transportation options, developing a company subsidized public/alternative transportation voucher, building covered bicycle lockers and shower facilities as well as other activities designed to increase the number of employees using bicycles as their main source of transportation to work.
- Efficient building construction: This focuses on the use of local building materials thereby decreasing energy needed for transportation as well as the utilization of recycled materials for construction decreasing energy demands for the manufacture of new building materials.
Market Analysis Summary
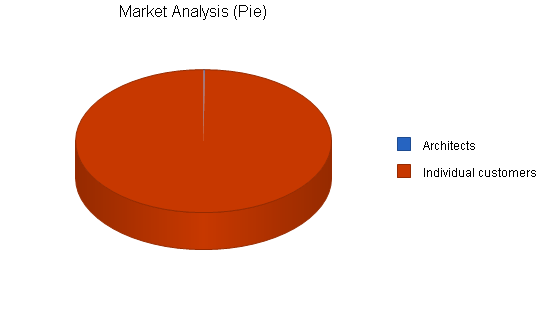
Green Power has segmented the market into two distinct target market groups. The first group is architects who are building a structure either speculatively (infrequently) or for a client (generally). The second customer group is individual customers who desire environmental elements designed into their building. The niche that Green Power has chosen to participate in is a fairly new field. Green Power faces competition from eco-architects as well as from the local utilities that may have a small department that offers green energy consultation advice. The industry often operates to satisfy clients; it is the end customer that typically requests green energy designs and they either seek out a specific architect or they request their architect to receive guidance from firms such as Green Power.
Market Segmentation
Green Power has segmented its target market into two different customer groups, both equally attractive.
Architects
This customer group is made up of professional architects that design buildings and additions for clients. Architects have developed a strategic relationship with Green Power to offer value-added-services for their clients.

- The architect firms typically have two – nine partners.
- Offer both residential and commercial design work, however 67% of their work is commercial.
- The firms typically have only a handful of service providers that they work with. This means that once they find someone they trust, they develop a long-term relationship with that service provider.
- Yearly revenue ranges from $200 thousand – $5 million.
Individual customers
This segment contains consumers who are either having a residential home, or a commercial structure, designed. Due to their personal environmental concerns and a recognition that it can be cost effective to have building decisions with environmental considerations, they have requested Green Power’s assistance. They are generally working directly with Green Power for their design needs and will likely then take this design criteria to their builder.
- The individual is an environmentalist and they take into account how their action will impact the environment.
- The age range of clients is 35-49.
- Average household income is $65,000. Please note that while the overriding concern in using Green Power’s services is the positive impact on the environment, a cost benefit analysis indicates that in the long term it is cost effective to adopt green energy considerations.
- 89% of the group have at least an undergraduate degree, 26% have a graduate degree.
| Market Analysis | |||||||
| Year 1 | Year 2 | Year 3 | Year 4 | Year 5 | |||
| Potential Customers | Growth | CAGR | |||||
| Architects | 7% | 23 | 25 | 27 | 29 | 31 | 7.75% |
| Individual customers | 9% | 16,009 | 17,450 | 19,021 | 20,733 | 22,599 | 9.00% |
| Total | 9.00% | 16,032 | 17,475 | 19,048 | 20,762 | 22,630 | 9.00% |
Target Market Segment Strategy
Green Power has chosen these two market segments for compelling reasons. The architects have been focused on because they are the service providers that do the bulk of the design work for residential and commercial structures. The architects are used as sales people for Green Power’s services, they are the ones that can then sell these services to their customers. It benefits the architects because they are able to offer a wider range of value-added-services to their customers without spending capital of learning the information themselves. By aligning itself with architects, Green Power is able to offer their services to a larger group of people.
Green Power will also serve individual customers. These are people who know that they want environmental considerations made in the design of their structure and will seek out a firm such as Green Power to have this work done. Burlington is a wonderful place to locate Green Power as there is a high population of environmentally-conscious people in this city. This provides Green Power with a large market of interested customers. Additionally, this market group is attractive because people that have environmental tendencies are often vocal about their commitments or causes. By offering green energy services, Green Power allows this group of people to act on what they believe in on a personal level, adhering to the wise saying think globally, act locally.
Service Business Analysis
The environmental power consultancy industry is fairly new. Only recently has there been an emergence of firms that offer these services. This can be explained by several factors. First, people are becoming more environmentally aware these days, a function of many things including the recent problems with the Middle East and Fundamental Islamists. These recent problems have forced people to reconsider America’s dependence on oil and the need to maintain good relationships with Saudi Arabia only because of their oil. Another factor that has contributed to the growth of green power is that it has become increasingly cost effective to make business decisions while taking into account the decisions impact on the environment. For years an environmental decision was based on personal consciousness and ethics, not overriding economic factors. Now money can be saved when environmental impacts are taken into account. Please read the following section which will indicate the different players within the industry.
Competition and Buying Patterns
The competition generally takes two different forms:
Eco-architects
These are architects that specialize in environmental design considerations. Typically their entire practice is based around structures that have environmental elements. Green Power could actually be within this industry niche, however they are able to serve a larger customer baser, therefore earn more revenue as well as make a positive impact in our world by offering its services to both end consumers as well as regular architects as opposed to the business model of only serving one set of customers.
Local utility
The local utilities often have a department that offers free consultation for environmental design considerations. There are incentives for the utilities to attempt to curb their customer’s use of their energy. These incentives take the form of not needing to make as many capital expenditures to develop the power delivery infrastructure to accommodate the increased load for energy demands. Therefore, the more the utility is able to get their customers to conserve, the less money they have to spend on infrastructure improvements, the more money they earn. That being said, the utility often has a small department that offers tips on energy conservation. While these tips can be quite helpful, since they are offered for free for the power customers, they are not nearly as comprehensive as they could be. So while they provide good initial tips, the local utility is not a strong competitor to serve a client who is committed to making as much of a positive environmental difference as can be achieved by using a specialized firm.
The buying pattern for consumers is currently being defined as we speak, a function of how new the industry is. Currently, purchasing decisions are based on customers typically making requests for these services from their architect or they do a bit of research to determine who offers these services. As the industry becomes more mature, firms will become more established and reputation and visibility/awareness will shape buying decisions. Since there is a wide range of options regarding implementation, price is less of a consideration for the decision since most of the service providers can offer a wide range of inexpensive to expensive options.
Strategy and Implementation Summary
Green Power’s business strategy recognizes and will leverage the fact that a lot of business will be transacted through networking and word-of-mouth referrals. With this in mind, Green Power will work diligently to build alliances with architects who can co-brand their services with Green Power thereby increasing Green Power’s potential qualified customers.
Green Power will rely on its competitive edge of adopting a cost effective environmental solution so in addition to meeting environmental concerns of the customer, Green Power’s services will save the customer money over time.The marketing strategy will highlight both environmental attributes as well as economic ones.The marketing campaign will recognize the existence of two distinct market customers. Lastly, the sales strategy will offer a compelling economic analysis of how the customer can save money by adopting Green Power’s designs.
Competitive Edge
Green Power will use its competitive edge of economic justification to turn potential customers into qualified sales customers. While some of the other similar companies often highlight the positive environmental impact that their designs offer, Green Power will also offer economic justifications for their designs. This is an important competitive edge as it provides evidence that the customer can save money in the long term and make a positive impact on the environment. Providing a cost benefit analysis for the green design is important because it makes the potential market larger, moving from people that want to do good for the environment to people that also want to save money. By offering an environmental solution that saves the person or business money creates a compelling reason to adopt the suggestions. There are too few people that will act only for environmental reasons, but when you save people money, there are far more people interested.
Marketing Strategy
The marketing strategy is based on developing an awareness regarding Green Power’s services to both architects and the end use consumers. Green Power will strongly use networking as a means to develop relationships with many of the city’s architects. Although Burlington is a reasonably-sized city, the architect community is fairly close knit. If one wanted, it is easy to develop active relationships with many of the different architects in Burlington. By developing these relationships, Green Power will allow the firms to become familiar with not only the services offered by Green Power, but also the personalities involved, recognizing that much of business is transacted by who you know. Advertisements will be placed in the local architect newsletter.
To reach the end user customers, Green Power will use Advertisements in the local paper as well as within the yellow pages. As a means of increasing visibility of Green Power, GP will participate in several community-based seminars that serve as a free source of information for the citizens of Burlington. Green Power believes that participating in the seminars will be an effective way of meeting many of the potential customers and allowing them to become familiar with Green Power expertise.
Sales Strategy
The sales strategy implicitly and explicitly takes into account the philosophy that the reason that many of the people are attracted to Green Power is because of its personal environmental ethics. The sales strategy will leverage this desire with the fact that environmental decisions can have positive economic impacts in the long term. Therefore the sales strategy will leverage the competitive edge of economic justification as the method for turning sales leads into customers. For this strategy to be effective, Green Power will present customers case studies and quantifiable data proving economic justification.
Sales Forecast
Green Power has adopted a conservative sales forecast for the business plan. By adopting a conservative prediction, it is easier to hit sales goals and increase the likelihood that the business plan is relevant to the business. If the sales forecasts was wildly off, it casts doubt on the application of the plan for the business.
Sales will be slow for the first several months, a function of Green Power being a start-up organization. As Green Power increases their customer pool and more architects become familiar with GP’s services, business will grow. Growth will be forecasted and preferenced as steady. The steadier it is, the easier it will be to deal with the incremental growth in work. Please view the following table and charts for a graphical representation on monthly and yearly sales.
Cost of sales for a consulting company are negligible, however, cost of architects sales will be 20%, since we will pay commissions to the architects for referrals.


| Sales Forecast | |||
| Year 1 | Year 2 | Year 3 | |
| Sales | |||
| Architects | $41,060 | $95,445 | $112,454 |
| Individuals | $45,987 | $106,898 | $125,948 |
| Total Sales | $87,047 | $202,343 | $238,402 |
| Direct Cost of Sales | Year 1 | Year 2 | Year 3 |
| Architects | $8,212 | $19,089 | $22,491 |
| Individuals | $0 | $10,690 | $12,595 |
| Subtotal Direct Cost of Sales | $8,212 | $29,779 | $35,086 |
Milestones
Green Power has identified several milestones as a way of setting achievable goals. Performance is likely to be improved through the quest of reaching the goals. This phenomenon is well documented and is used in large corporations such as GE’s Seven Sigma Program as well as many state’s benchmarked-based assessment testing systems. Green Power has identified the following milestones:
- Business plan completion;
- 10th customer;
- Revenues exceeding $50,000;
- Profitability.

| Milestones | |||||
| Milestone | Start Date | End Date | Budget | Manager | Department |
| Business plan completion | 1/1/2003 | 2/15/2003 | $0 | Dan & Sue | Business planning |
| 10th customer | 1/1/2003 | 3/30/2003 | $0 | Sue | Sales |
| Revenue exceeding $50,000 | 1/1/2003 | 8/30/2003 | $0 | Sue | Sales |
| Profitability | 1/1/2003 | 2/28/2004 | $0 | Dan | Accounting |
| Totals | $0 | ||||
Web Plan Summary
The website will be used as a marketing tool. It will offer a description of the services offered as well as a listing of different clients served.
Website Marketing Strategy
The plan for marketing the site is fairly simple: submission to search engines such as Google and listing the website on all of the company’s correspondence and printed marketing/sales media.
Development Requirements
Green Power will utilize a local programmer to build the site.
Management Summary
The company will be lead by the husband and wife team of Dan and Sue Lang. Dan grew up in Oregon and attended the University of Oregon for his undergraduate education. Dan’s major was environmental studies and business. After graduation Dan worked for a year at an environmental testing company. Through general networking, Dan was introduced to one of the three principals of a company called The Seal Company. The business model for this company was to make assessments for private and public companies as to their environmental impact. His position with The Seal Company provided him with wonderful insight into the industry of environmental assessment and helped provide him with a foundation of knowledge regarding green energy, just one of the areas of assessment. After a year of this Dan enrolled into the University of Oregon’s Master’s Architect program, taking course work in environmental design. This degree would provide Dan with the skills to make a larger impact in his community.
Sue went to the University of Burlington for undergrad and then moved out to Oregon to attend Willamette University’s MBA program. After her degree Sue moved up to Portland and worked for the Bonneville Power Administration where she worked in their renewable resource division. Much of her projects were marketing based, trying to gain public acceptance of renewable energy sources.
Personnel Plan
For the first three months of business the organization will be quite lean, consisting of just Dan and Sue. Dan will be responsible for most of the business-related issues as well as doing research and helping out with the work projects. Sue’s responsibilities will be marketing and sales based. She will work hard on developing visibility for the company as well as working with prospective customers. Green Power has forecasted that on month four it will need administrative assistance. The duties will be answering the phone, some input accounting, and other clerical functions. Initially this person will be part time but will move to full time at the beginning of year two.
| Personnel Plan | |||
| Year 1 | Year 2 | Year 3 | |
| Dan | $24,000 | $30,000 | $36,000 |
| Sue | $24,000 | $30,000 | $36,000 |
| Associate consultant | $0 | $15,000 | $30,000 |
| Administrative assistant | $4,600 | $18,000 | $20,000 |
| Total People | 3 | 3 | 4 |
| Total Payroll | $52,600 | $93,000 | $122,000 |
Financial Plan
The following sections will outline the important Financial Assumptions.
Important Assumptions
The following table details important Financial Assumptions.
| General Assumptions | |||
| Year 1 | Year 2 | Year 3 | |
| Plan Month | 1 | 2 | 3 |
| Current Interest Rate | 10.00% | 10.00% | 10.00% |
| Long-term Interest Rate | 10.00% | 10.00% | 10.00% |
| Tax Rate | 30.00% | 30.00% | 30.00% |
| Other | 0 | 0 | 0 |
Break-even Analysis
The Break-even Analysis is indicated below.

| Break-even Analysis | |
| Monthly Revenue Break-even | $7,333 |
| Assumptions: | |
| Average Percent Variable Cost | 9% |
| Estimated Monthly Fixed Cost | $6,641 |
Projected Profit and Loss
The following table and charts will indicate Projected Profit and Loss.


| Pro Forma Profit and Loss | |||
| Year 1 | Year 2 | Year 3 | |
| Sales | $87,047 | $202,343 | $238,402 |
| Direct Cost of Sales | $8,212 | $29,779 | $35,086 |
| Other Costs of Sales | $0 | $0 | $0 |
| Total Cost of Sales | $8,212 | $29,779 | $35,086 |
| Gross Margin | $78,835 | $172,565 | $203,317 |
| Gross Margin % | 90.57% | 85.28% | 85.28% |
| Expenses | |||
| Payroll | $52,600 | $93,000 | $122,000 |
| Sales and Marketing and Other Expenses | $4,800 | $4,800 | $4,800 |
| Depreciation | $1,800 | $1,800 | $1,800 |
| Rent | $6,000 | $6,000 | $6,000 |
| Utilities | $2,400 | $2,400 | $2,400 |
| Insurance | $2,400 | $2,400 | $2,400 |
| Payroll Taxes | $7,890 | $13,950 | $18,300 |
| Other | $1,800 | $1,800 | $1,800 |
| Total Operating Expenses | $79,690 | $126,150 | $159,500 |
| Profit Before Interest and Taxes | ($855) | $46,415 | $43,817 |
| EBITDA | $945 | $48,215 | $45,617 |
| Interest Expense | $0 | $0 | $0 |
| Taxes Incurred | $0 | $13,924 | $13,145 |
| Net Profit | ($855) | $32,490 | $30,672 |
| Net Profit/Sales | -0.98% | 16.06% | 12.87% |
Projected Cash Flow
The following table and chart indicate Projected Cash Flow.

| Pro Forma Cash Flow | |||
| Year 1 | Year 2 | Year 3 | |
| Cash Received | |||
| Cash from Operations | |||
| Cash Sales | $87,047 | $202,343 | $238,402 |
| Subtotal Cash from Operations | $87,047 | $202,343 | $238,402 |
| Additional Cash Received | |||
| Sales Tax, VAT, HST/GST Received | $0 | $0 | $0 |
| New Current Borrowing | $0 | $0 | $0 |
| New Other Liabilities (interest-free) | $0 | $0 | $0 |
| New Long-term Liabilities | $0 | $0 | $0 |
| Sales of Other Current Assets | $0 | $0 | $0 |
| Sales of Long-term Assets | $0 | $0 | $0 |
| New Investment Received | $0 | $0 | $0 |
| Subtotal Cash Received | $87,047 | $202,343 | $238,402 |
| Expenditures | Year 1 | Year 2 | Year 3 |
| Expenditures from Operations | |||
| Cash Spending | $52,600 | $93,000 | $122,000 |
| Bill Payments | $30,707 | $71,679 | $83,201 |
| Subtotal Spent on Operations | $83,307 | $164,679 | $205,201 |
| Additional Cash Spent | |||
| Sales Tax, VAT, HST/GST Paid Out | $0 | $0 | $0 |
| Principal Repayment of Current Borrowing | $0 | $0 | $0 |
| Other Liabilities Principal Repayment | $0 | $0 | $0 |
| Long-term Liabilities Principal Repayment | $0 | $0 | $0 |
| Purchase Other Current Assets | $0 | $0 | $0 |
| Purchase Long-term Assets | $0 | $0 | $0 |
| Dividends | $0 | $0 | $0 |
| Subtotal Cash Spent | $83,307 | $164,679 | $205,201 |
| Net Cash Flow | $3,740 | $37,664 | $33,201 |
| Cash Balance | $27,590 | $65,254 | $98,456 |
Projected Balance Sheet
The following table will indicate the Projected Balance Sheet.
| Pro Forma Balance Sheet | |||
| Year 1 | Year 2 | Year 3 | |
| Assets | |||
| Current Assets | |||
| Cash | $27,590 | $65,254 | $98,456 |
| Other Current Assets | $0 | $0 | $0 |
| Total Current Assets | $27,590 | $65,254 | $98,456 |
| Long-term Assets | |||
| Long-term Assets | $9,000 | $9,000 | $9,000 |
| Accumulated Depreciation | $1,800 | $3,600 | $5,400 |
| Total Long-term Assets | $7,200 | $5,400 | $3,600 |
| Total Assets | $34,790 | $70,654 | $102,056 |
| Liabilities and Capital | Year 1 | Year 2 | Year 3 |
| Current Liabilities | |||
| Accounts Payable | $2,795 | $6,169 | $6,898 |
| Current Borrowing | $0 | $0 | $0 |
| Other Current Liabilities | $0 | $0 | $0 |
| Subtotal Current Liabilities | $2,795 | $6,169 | $6,898 |
| Long-term Liabilities | $0 | $0 | $0 |
| Total Liabilities | $2,795 | $6,169 | $6,898 |
| Paid-in Capital | $40,000 | $40,000 | $40,000 |
| Retained Earnings | ($7,150) | ($8,005) | $24,485 |
| Earnings | ($855) | $32,490 | $30,672 |
| Total Capital | $31,995 | $64,485 | $95,157 |
| Total Liabilities and Capital | $34,790 | $70,654 | $102,056 |
| Net Worth | $31,995 | $64,485 | $95,157 |
Business Ratios
The following table contains typical Business Ratios of both Green Power as well as the industry as a whole.
| Ratio Analysis | ||||
| Year 1 | Year 2 | Year 3 | Industry Profile | |
| Sales Growth | n.a. | 132.45% | 17.82% | 8.18% |
| Percent of Total Assets | ||||
| Other Current Assets | 0.00% | 0.00% | 0.00% | 41.37% |
| Total Current Assets | 79.30% | 92.36% | 96.47% | 75.36% |
| Long-term Assets | 20.70% | 7.64% | 3.53% | 24.64% |
| Total Assets | 100.00% | 100.00% | 100.00% | 100.00% |
| Current Liabilities | 8.03% | 8.73% | 6.76% | 31.49% |
| Long-term Liabilities | 0.00% | 0.00% | 0.00% | 16.85% |
| Total Liabilities | 8.03% | 8.73% | 6.76% | 48.34% |
| Net Worth | 91.97% | 91.27% | 93.24% | 51.66% |
| Percent of Sales | ||||
| Sales | 100.00% | 100.00% | 100.00% | 100.00% |
| Gross Margin | 90.57% | 85.28% | 85.28% | 100.00% |
| Selling, General & Administrative Expenses | 91.55% | 69.23% | 72.42% | 82.59% |
| Advertising Expenses | 0.00% | 0.00% | 0.00% | 1.16% |
| Profit Before Interest and Taxes | -0.98% | 22.94% | 18.38% | 1.47% |
| Main Ratios | ||||
| Current | 9.87 | 10.58 | 14.27 | 1.93 |
| Quick | 9.87 | 10.58 | 14.27 | 1.50 |
| Total Debt to Total Assets | 8.03% | 8.73% | 6.76% | 3.09% |
| Pre-tax Return on Net Worth | -2.67% | 71.98% | 46.05% | 59.56% |
| Pre-tax Return on Assets | -2.46% | 65.69% | 42.93% | 7.63% |
| Additional Ratios | Year 1 | Year 2 | Year 3 | |
| Net Profit Margin | -0.98% | 16.06% | 12.87% | n.a |
| Return on Equity | -2.67% | 50.38% | 32.23% | n.a |
| Activity Ratios | ||||
| Accounts Payable Turnover | 11.99 | 12.17 | 12.17 | n.a |
| Payment Days | 27 | 22 | 28 | n.a |
| Total Asset Turnover | 2.50 | 2.86 | 2.34 | n.a |
| Debt Ratios | ||||
| Debt to Net Worth | 0.09 | 0.10 | 0.07 | n.a |
| Current Liab. to Liab. | 1.00 | 1.00 | 1.00 | n.a |
| Liquidity Ratios | ||||
| Net Working Capital | $24,795 | $59,085 | $91,557 | n.a |
| Interest Coverage | 0.00 | 0.00 | 0.00 | n.a |
| Additional Ratios | ||||
| Assets to Sales | 0.40 | 0.35 | 0.43 | n.a |
| Current Debt/Total Assets | 8% | 9% | 7% | n.a |
| Acid Test | 9.87 | 10.58 | 14.27 | n.a |
| Sales/Net Worth | 2.72 | 3.14 | 2.51 | n.a |
| Dividend Payout | 0.00 | 0.00 | 0.00 | n.a |
Appendix
| Sales Forecast | |||||||||||||
| Month 1 | Month 2 | Month 3 | Month 4 | Month 5 | Month 6 | Month 7 | Month 8 | Month 9 | Month 10 | Month 11 | Month 12 | ||
| Sales | |||||||||||||
| Architects | 0% | $2,500 | $2,654 | $2,747 | $3,212 | $3,455 | $3,525 | $3,656 | $3,787 | $3,987 | $3,902 | $3,878 | $3,757 |
| Individuals | 0% | $2,800 | $2,972 | $3,077 | $3,597 | $3,870 | $3,948 | $4,095 | $4,241 | $4,465 | $4,370 | $4,343 | $4,208 |
| Total Sales | $5,300 | $5,626 | $5,824 | $6,809 | $7,325 | $7,473 | $7,751 | $8,028 | $8,452 | $8,272 | $8,221 | $7,965 | |
| Direct Cost of Sales | Month 1 | Month 2 | Month 3 | Month 4 | Month 5 | Month 6 | Month 7 | Month 8 | Month 9 | Month 10 | Month 11 | Month 12 | |
| Architects | $500 | $531 | $549 | $642 | $691 | $705 | $731 | $757 | $797 | $780 | $776 | $751 | |
| Individuals | $0 | $0 | $0 | $0 | $0 | $0 | $0 | $0 | $0 | $0 | $0 | $0 | |
| Subtotal Direct Cost of Sales | $500 | $531 | $549 | $642 | $691 | $705 | $731 | $757 | $797 | $780 | $776 | $751 | |
| Personnel Plan | |||||||||||||
| Month 1 | Month 2 | Month 3 | Month 4 | Month 5 | Month 6 | Month 7 | Month 8 | Month 9 | Month 10 | Month 11 | Month 12 | ||
| Dan | 0% | $2,000 | $2,000 | $2,000 | $2,000 | $2,000 | $2,000 | $2,000 | $2,000 | $2,000 | $2,000 | $2,000 | $2,000 |
| Sue | 0% | $2,000 | $2,000 | $2,000 | $2,000 | $2,000 | $2,000 | $2,000 | $2,000 | $2,000 | $2,000 | $2,000 | $2,000 |
| Associate consultant | 0% | $0 | $0 | $0 | $0 | $0 | $0 | $0 | $0 | $0 | $0 | $0 | $0 |
| Administrative assistant | 0% | $0 | $0 | $0 | $400 | $400 | $400 | $500 | $500 | $600 | $600 | $600 | $600 |
| Total People | 2 | 2 | 2 | 3 | 3 | 3 | 3 | 3 | 3 | 3 | 3 | 3 | |
| Total Payroll | $4,000 | $4,000 | $4,000 | $4,400 | $4,400 | $4,400 | $4,500 | $4,500 | $4,600 | $4,600 | $4,600 | $4,600 | |
| General Assumptions | |||||||||||||
| Month 1 | Month 2 | Month 3 | Month 4 | Month 5 | Month 6 | Month 7 | Month 8 | Month 9 | Month 10 | Month 11 | Month 12 | ||
| Plan Month | 1 | 2 | 3 | 4 | 5 | 6 | 7 | 8 | 9 | 10 | 11 | 12 | |
| Current Interest Rate | 10.00% | 10.00% | 10.00% | 10.00% | 10.00% | 10.00% | 10.00% | 10.00% | 10.00% | 10.00% | 10.00% | 10.00% | |
| Long-term Interest Rate | 10.00% | 10.00% | 10.00% | 10.00% | 10.00% | 10.00% | 10.00% | 10.00% | 10.00% | 10.00% | 10.00% | 10.00% | |
| Tax Rate | 30.00% | 30.00% | 30.00% | 30.00% | 30.00% | 30.00% | 30.00% | 30.00% | 30.00% | 30.00% | 30.00% | 30.00% | |
| Other | 0 | 0 | 0 | 0 | 0 | 0 | 0 | 0 | 0 | 0 | 0 | 0 | |
| Pro Forma Profit and Loss | |||||||||||||
| Month 1 | Month 2 | Month 3 | Month 4 | Month 5 | Month 6 | Month 7 | Month 8 | Month 9 | Month 10 | Month 11 | Month 12 | ||
| Sales | $5,300 | $5,626 | $5,824 | $6,809 | $7,325 | $7,473 | $7,751 | $8,028 | $8,452 | $8,272 | $8,221 | $7,965 | |
| Direct Cost of Sales | $500 | $531 | $549 | $642 | $691 | $705 | $731 | $757 | $797 | $780 | $776 | $751 | |
| Other Costs of Sales | $0 | $0 | $0 | $0 | $0 | $0 | $0 | $0 | $0 | $0 | $0 | $0 | |
| Total Cost of Sales | $500 | $531 | $549 | $642 | $691 | $705 | $731 | $757 | $797 | $780 | $776 | $751 | |
| Gross Margin | $4,800 | $5,096 | $5,274 | $6,167 | $6,634 | $6,768 | $7,020 | $7,271 | $7,655 | $7,492 | $7,446 | $7,213 | |
| Gross Margin % | 90.57% | 90.57% | 90.57% | 90.57% | 90.57% | 90.57% | 90.57% | 90.57% | 90.57% | 90.57% | 90.57% | 90.57% | |
| Expenses | |||||||||||||
| Payroll | $4,000 | $4,000 | $4,000 | $4,400 | $4,400 | $4,400 | $4,500 | $4,500 | $4,600 | $4,600 | $4,600 | $4,600 | |
| Sales and Marketing and Other Expenses | $400 | $400 | $400 | $400 | $400 | $400 | $400 | $400 | $400 | $400 | $400 | $400 | |
| Depreciation | $150 | $150 | $150 | $150 | $150 | $150 | $150 | $150 | $150 | $150 | $150 | $150 | |
| Rent | $500 | $500 | $500 | $500 | $500 | $500 | $500 | $500 | $500 | $500 | $500 | $500 | |
| Utilities | $200 | $200 | $200 | $200 | $200 | $200 | $200 | $200 | $200 | $200 | $200 | $200 | |
| Insurance | $200 | $200 | $200 | $200 | $200 | $200 | $200 | $200 | $200 | $200 | $200 | $200 | |
| Payroll Taxes | 15% | $600 | $600 | $600 | $660 | $660 | $660 | $675 | $675 | $690 | $690 | $690 | $690 |
| Other | $150 | $150 | $150 | $150 | $150 | $150 | $150 | $150 | $150 | $150 | $150 | $150 | |
| Total Operating Expenses | $6,200 | $6,200 | $6,200 | $6,660 | $6,660 | $6,660 | $6,775 | $6,775 | $6,890 | $6,890 | $6,890 | $6,890 | |
| Profit Before Interest and Taxes | ($1,400) | ($1,104) | ($926) | ($493) | ($26) | $108 | $245 | $496 | $765 | $602 | $556 | $323 | |
| EBITDA | ($1,250) | ($954) | ($776) | ($343) | $124 | $258 | $395 | $646 | $915 | $752 | $706 | $473 | |
| Interest Expense | $0 | $0 | $0 | $0 | $0 | $0 | $0 | $0 | $0 | $0 | $0 | $0 | |
| Taxes Incurred | $0 | $0 | $0 | $0 | $0 | $0 | $0 | $0 | $0 | $0 | $0 | $0 | |
| Net Profit | ($1,400) | ($1,104) | ($926) | ($493) | ($26) | $108 | $245 | $496 | $765 | $602 | $556 | $323 | |
| Net Profit/Sales | -26.42% | -19.63% | -15.90% | -7.24% | -0.36% | 1.45% | 3.15% | 6.18% | 9.05% | 7.28% | 6.76% | 4.06% | |
| Pro Forma Cash Flow | |||||||||||||
| Month 1 | Month 2 | Month 3 | Month 4 | Month 5 | Month 6 | Month 7 | Month 8 | Month 9 | Month 10 | Month 11 | Month 12 | ||
| Cash Received | |||||||||||||
| Cash from Operations | |||||||||||||
| Cash Sales | $5,300 | $5,626 | $5,824 | $6,809 | $7,325 | $7,473 | $7,751 | $8,028 | $8,452 | $8,272 | $8,221 | $7,965 | |
| Subtotal Cash from Operations | $5,300 | $5,626 | $5,824 | $6,809 | $7,325 | $7,473 | $7,751 | $8,028 | $8,452 | $8,272 | $8,221 | $7,965 | |
| Additional Cash Received | |||||||||||||
| Sales Tax, VAT, HST/GST Received | 0.00% | $0 | $0 | $0 | $0 | $0 | $0 | $0 | $0 | $0 | $0 | $0 | $0 |
| New Current Borrowing | $0 | $0 | $0 | $0 | $0 | $0 | $0 | $0 | $0 | $0 | $0 | $0 | |
| New Other Liabilities (interest-free) | $0 | $0 | $0 | $0 | $0 | $0 | $0 | $0 | $0 | $0 | $0 | $0 | |
| New Long-term Liabilities | $0 | $0 | $0 | $0 | $0 | $0 | $0 | $0 | $0 | $0 | $0 | $0 | |
| Sales of Other Current Assets | $0 | $0 | $0 | $0 | $0 | $0 | $0 | $0 | $0 | $0 | $0 | $0 | |
| Sales of Long-term Assets | $0 | $0 | $0 | $0 | $0 | $0 | $0 | $0 | $0 | $0 | $0 | $0 | |
| New Investment Received | $0 | $0 | $0 | $0 | $0 | $0 | $0 | $0 | $0 | $0 | $0 | $0 | |
| Subtotal Cash Received | $5,300 | $5,626 | $5,824 | $6,809 | $7,325 | $7,473 | $7,751 | $8,028 | $8,452 | $8,272 | $8,221 | $7,965 | |
| Expenditures | Month 1 | Month 2 | Month 3 | Month 4 | Month 5 | Month 6 | Month 7 | Month 8 | Month 9 | Month 10 | Month 11 | Month 12 | |
| Expenditures from Operations | |||||||||||||
| Cash Spending | $4,000 | $4,000 | $4,000 | $4,400 | $4,400 | $4,400 | $4,500 | $4,500 | $4,600 | $4,600 | $4,600 | $4,600 | |
| Bill Payments | $85 | $2,551 | $2,581 | $2,604 | $2,754 | $2,801 | $2,816 | $2,857 | $2,884 | $2,937 | $2,920 | $2,915 | |
| Subtotal Spent on Operations | $4,085 | $6,551 | $6,581 | $7,005 | $7,154 | $7,201 | $7,316 | $7,357 | $7,484 | $7,537 | $7,520 | $7,515 | |
| Additional Cash Spent | |||||||||||||
| Sales Tax, VAT, HST/GST Paid Out | $0 | $0 | $0 | $0 | $0 | $0 | $0 | $0 | $0 | $0 | $0 | $0 | |
| Principal Repayment of Current Borrowing | $0 | $0 | $0 | $0 | $0 | $0 | $0 | $0 | $0 | $0 | $0 | $0 | |
| Other Liabilities Principal Repayment | $0 | $0 | $0 | $0 | $0 | $0 | $0 | $0 | $0 | $0 | $0 | $0 | |
| Long-term Liabilities Principal Repayment | $0 | $0 | $0 | $0 | $0 | $0 | $0 | $0 | $0 | $0 | $0 | $0 | |
| Purchase Other Current Assets | $0 | $0 | $0 | $0 | $0 | $0 | $0 | $0 | $0 | $0 | $0 | $0 | |
| Purchase Long-term Assets | $0 | $0 | $0 | $0 | $0 | $0 | $0 | $0 | $0 | $0 | $0 | $0 | |
| Dividends | $0 | $0 | $0 | $0 | $0 | $0 | $0 | $0 | $0 | $0 | $0 | $0 | |
| Subtotal Cash Spent | $4,085 | $6,551 | $6,581 | $7,005 | $7,154 | $7,201 | $7,316 | $7,357 | $7,484 | $7,537 | $7,520 | $7,515 | |
| Net Cash Flow | $1,215 | ($925) | ($758) | ($195) | $171 | $272 | $434 | $671 | $968 | $735 | $701 | $450 | |
| Cash Balance | $25,065 | $24,140 | $23,383 | $23,188 | $23,358 | $23,630 | $24,064 | $24,735 | $25,704 | $26,439 | $27,140 | $27,590 | |
| Pro Forma Balance Sheet | |||||||||||||
| Month 1 | Month 2 | Month 3 | Month 4 | Month 5 | Month 6 | Month 7 | Month 8 | Month 9 | Month 10 | Month 11 | Month 12 | ||
| Assets | Starting Balances | ||||||||||||
| Current Assets | |||||||||||||
| Cash | $23,850 | $25,065 | $24,140 | $23,383 | $23,188 | $23,358 | $23,630 | $24,064 | $24,735 | $25,704 | $26,439 | $27,140 | $27,590 |
| Other Current Assets | $0 | $0 | $0 | $0 | $0 | $0 | $0 | $0 | $0 | $0 | $0 | $0 | $0 |
| Total Current Assets | $23,850 | $25,065 | $24,140 | $23,383 | $23,188 | $23,358 | $23,630 | $24,064 | $24,735 | $25,704 | $26,439 | $27,140 | $27,590 |
| Long-term Assets | |||||||||||||
| Long-term Assets | $9,000 | $9,000 | $9,000 | $9,000 | $9,000 | $9,000 | $9,000 | $9,000 | $9,000 | $9,000 | $9,000 | $9,000 | $9,000 |
| Accumulated Depreciation | $0 | $150 | $300 | $450 | $600 | $750 | $900 | $1,050 | $1,200 | $1,350 | $1,500 | $1,650 | $1,800 |
| Total Long-term Assets | $9,000 | $8,850 | $8,700 | $8,550 | $8,400 | $8,250 | $8,100 | $7,950 | $7,800 | $7,650 | $7,500 | $7,350 | $7,200 |
| Total Assets | $32,850 | $33,915 | $32,840 | $31,933 | $31,588 | $31,608 | $31,730 | $32,014 | $32,535 | $33,354 | $33,939 | $34,490 | $34,790 |
| Liabilities and Capital | Month 1 | Month 2 | Month 3 | Month 4 | Month 5 | Month 6 | Month 7 | Month 8 | Month 9 | Month 10 | Month 11 | Month 12 | |
| Current Liabilities | |||||||||||||
| Accounts Payable | $0 | $2,465 | $2,495 | $2,513 | $2,661 | $2,708 | $2,721 | $2,761 | $2,786 | $2,839 | $2,823 | $2,818 | $2,795 |
| Current Borrowing | $0 | $0 | $0 | $0 | $0 | $0 | $0 | $0 | $0 | $0 | $0 | $0 | $0 |
| Other Current Liabilities | $0 | $0 | $0 | $0 | $0 | $0 | $0 | $0 | $0 | $0 | $0 | $0 | $0 |
| Subtotal Current Liabilities | $0 | $2,465 | $2,495 | $2,513 | $2,661 | $2,708 | $2,721 | $2,761 | $2,786 | $2,839 | $2,823 | $2,818 | $2,795 |
| Long-term Liabilities | $0 | $0 | $0 | $0 | $0 | $0 | $0 | $0 | $0 | $0 | $0 | $0 | $0 |
| Total Liabilities | $0 | $2,465 | $2,495 | $2,513 | $2,661 | $2,708 | $2,721 | $2,761 | $2,786 | $2,839 | $2,823 | $2,818 | $2,795 |
| Paid-in Capital | $40,000 | $40,000 | $40,000 | $40,000 | $40,000 | $40,000 | $40,000 | $40,000 | $40,000 | $40,000 | $40,000 | $40,000 | $40,000 |
| Retained Earnings | ($7,150) | ($7,150) | ($7,150) | ($7,150) | ($7,150) | ($7,150) | ($7,150) | ($7,150) | ($7,150) | ($7,150) | ($7,150) | ($7,150) | ($7,150) |
| Earnings | $0 | ($1,400) | ($2,504) | ($3,430) | ($3,923) | ($3,949) | ($3,841) | ($3,597) | ($3,101) | ($2,336) | ($1,734) | ($1,178) | ($855) |
| Total Capital | $32,850 | $31,450 | $30,346 | $29,420 | $28,927 | $28,901 | $29,009 | $29,253 | $29,749 | $30,514 | $31,116 | $31,672 | $31,995 |
| Total Liabilities and Capital | $32,850 | $33,915 | $32,840 | $31,933 | $31,588 | $31,608 | $31,730 | $32,014 | $32,535 | $33,354 | $33,939 | $34,490 | $34,790 |
| Net Worth | $32,850 | $31,450 | $30,346 | $29,420 | $28,927 | $28,901 | $29,009 | $29,253 | $29,749 | $30,514 | $31,116 | $31,672 | $31,995 |


