
All About People
Executive Summary
All About People (AAP) began out of the desire to contribute to this community, just as communities have fed All About People’s proprietor over the years. Although originally from a larger market, the proprietor realizes the need in the southern Willamette Valley for a personnel agency that fills a void left by other temporary and permanent placement agencies. AAP matches specifically skilled workers with clients, saving businesses time and money, while providing for its employees with honesty and honor. This requires a high level of communication. It means asking open-ended questions and listening, not talking. This means knowing the local market so AAP can really serve each client and employee, not just “sell” them our goods. AAP is quality service.
The long-term vision includes a number of offices throughout the southern Willamette Valley. The proprietor sees the challenge in this vision, not in the growth itself, but in training and encouraging all AAP personnel to treat each client and employee with the same care and with the same level of communication.
Managing our Growth
AAP is a sole proprietorship that will convert to an S Corporation. As a new corporate entity, AAP will be treated as a start-up in this business plan. During the past couple of years the proprietor provided all services. In Year 1, the company will add a part-time office staff person and an employment specialist. In response to this growth, AAP will have a procedures manual for in-house staff to assure that the information is clear. In addition, AAP will provide employees with regular training within the divisions to assure they understand the details of the work they are doing daily. Year 2 projections include a receptionist, another employment specialist, and a field representative. In Year 3, AAP will examine the feasibility of opening a branch office in the Salem, Bend, or Medford/Ashland areas.
The Market
AAP is structured like other temporary and permanent placement agencies. However, it will serve clients with needs for select, specialized professionals rather than clerical or light industrial workers. Several businesses in Portland, Oregon provide a similar service to specific groups of people, but there are none for the Willamette Valley. AAP has five divisions, targeting the following areas of expertise:
- Computers
- Editors/Writers
- Event Planners
- Graphic Artists
- Interpreters/Translators.
Services
AAP will handle recruiting, including reference checks, skills evaluation, preliminary interviewing, and screening of all employees for its clients. AAP acts as an extension of the client’s human resource department, assuring that there is open communication between supervisor and employee, and assisting with any troubleshooting or problem solving that may be needed.
Financials
The company’s start-up requirements are $55,464, of which $7,600 will be provided for by the owner’s personal investment. The rest will be obtained through loans.
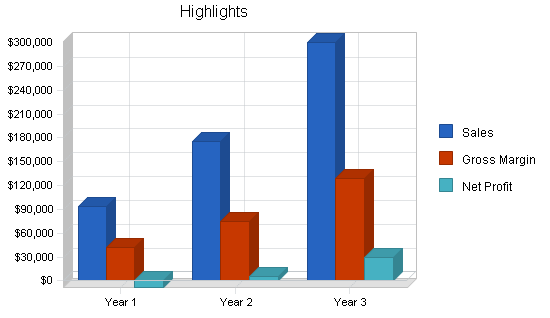
We expect to be able to charge a 50% markup to our business clients. Thus, if an employee is being paid $10 per hour, we are charging the client $15 per hour. The company predicts that it will be able to produce sales of approximately $300,000 by Year 3. The company does not have any direct cost of sales; we track payments to placed individuals as regular payroll.
1.1 Objectives
AAP is structured like other temporary and permanent placement agencies. However, we serve clients with needs for select specialized professionals, rather than clerical or light industrial workers. Several businesses in Portland, Oregon provide a similar service to specific groups of people. AAP followed the model of one placement firm described below.
A contract engineering firm places temporary workers who are hardware and software engineers. Employees earn between $80- $100 per hour and approximately seven employees are placed per month. The firm recruits through its website, advertises in newspapers, magazines, and trade publications. Incentives offered to contingent workers include medical, dental, and disability insurance, 401(K), and a reference finder’s fee for placement referrals. They find their employees are 60 percent male, 40 percent female, and ages spread evenly.
AAP serves the business client by locating a professional worker, interviewing and screening that worker, setting up interviews if necessary, and administering all hiring paperwork. The company runs payroll and bills the client bi-monthly. AAP will also manage the professional, staying in close contact with the client and communicating with the worker regarding any personnel issues that may arise.
The professional worker is served with employment opportunities at no cost; pay rates that are within industry standards; and health insurance may be purchased, if a worker becomes eligible, at a group rate starting at $124/mo. AAP will pay $65/mo for any coverage chosen from the group package.
1.2 Mission
All About People’s mission is to contribute to the community by filling a need for specialized, professional, contingent workers. The company will provide workers with a safe and independent environment. It will also provide businesses with a high-caliber of employee available for project or permanent work. All About People listens to individual needs and customizes personnel solutions for both businesses and workers.
Company Summary
AAP is a temporary and permanent placement personnel agency working solely with skilled, professional workers and Willamette Valley businesses. AAP differs from other temporary and permanent placement agencies because of our skilled workers. The company believes that the temporary industry pays only cursory attention to providing businesses highly qualified workers for permanent and non-permanent positions. AAP has five divisions, targeting the following areas of expertise:
- Computers
- Editors/Writers
- Event Planners
- Graphic Artists
- Interpreters/Translators.
AAP does not provide general clerical, light industrial, engineers, accountants, nurses, or other medical technicians.
AAP does the following for each client:
- Recruiting (reference checking)
- Skills evaluation (preliminary interviewing)
- Screening.
AAP conducts regular evaluations: AAP checks in with the supervisor and the worker during the first week on the assignment. AAP then checks in as agreed with the client. AAP acts as an extension of the client business’ human resource department assuring that there is open communication between supervisor and employee, and assisting with any troubleshooting or problem solving that may be needed.
Prior to opening our doors, research showed support for the development of a personnel agency working solely with professional contingent workers and Willamette Valley businesses (see topic 7.3 Supporting Research).
According to the Oregon Department of Employment, Lane County has 31 temporary agency firms with 3200 individuals employed. Total employment figures for Lane County are 250,000; therefore, we support between two and four percent of the population.
Through connections in a variety of areas, AAP is able to locate qualified workers not only through advertising, but through a channel of networking. This past year has shown that qualified, willing workers are certainly available as we currently have hundreds on staff willing and able to work.
2.1 Company Ownership
AAP is a sole proprietorship that will convert to an S Corporation. As a new corporate entity, AAP will be treated as a start-up in this business plan.
The sole proprietor, Sarah Wayland, can be reached at AAP’s office, [contact information omitted in this sample plan].
2.2 Start-up Summary
Projected start-up figures are shown in the chart and table below.

| Start-up | |
| Requirements | |
| Start-up Expenses | |
| Legal | $100 |
| Stationery etc. | $100 |
| Brochures | $164 |
| Insurance | $300 |
| Rent | $800 |
| computers, printers, software | $8,000 |
| Total Start-up Expenses | $9,464 |
| Start-up Assets | |
| Cash Required | $46,000 |
| Other Current Assets | $0 |
| Long-term Assets | $0 |
| Total Assets | $46,000 |
| Total Requirements | $55,464 |

| Start-up Funding | |
| Start-up Expenses to Fund | $9,464 |
| Start-up Assets to Fund | $46,000 |
| Total Funding Required | $55,464 |
| Assets | |
| Non-cash Assets from Start-up | $0 |
| Cash Requirements from Start-up | $46,000 |
| Additional Cash Raised | $0 |
| Cash Balance on Starting Date | $46,000 |
| Total Assets | $46,000 |
| Liabilities and Capital | |
| Liabilities | |
| Current Borrowing | $2,720 |
| Long-term Liabilities | $45,000 |
| Accounts Payable (Outstanding Bills) | $144 |
| Other Current Liabilities (interest-free) | $0 |
| Total Liabilities | $47,864 |
| Capital | |
| Planned Investment | |
| Owner | $7,600 |
| Other | $0 |
| Additional Investment Requirement | $0 |
| Total Planned Investment | $7,600 |
| Loss at Start-up (Start-up Expenses) | ($9,464) |
| Total Capital | ($1,864) |
| Total Capital and Liabilities | $46,000 |
| Total Funding | $55,464 |
Services
The company is uniquely positioned to take advantage of this market opportunity because of the management and field expertise of the proprietor. Sarah Wayland worked in the temporary employment industry for three years with ADIA Personnel Services (now ADECCO) as Area Account Manager (in training as a branch manager): building business relationships; hiring employees; handling employee issues; working with clients during the implementation of ADIA; and opening an additional office in Beaverton, Oregon.
For one year the proprietor was a District Sales Manager at Columbia Distributing, showing a 10% increase on $3.5 million in annual sales. Managing a staff of nine in sales and customer service, she had the opportunity to delve further into hiring/firing, reviewing, incentives outside of salary, and personnel issues.
Most recently, she has spent several years as Funds and Contracts Manager at the Oregon University System; managing four grants totaling $1.5 million annually and all personal service and interagency contracts as well.
The proprietor’s most notable success was bringing the second branch of Cellular West located in Portland, Oregon, from running in the red, to breaking even within four months of its opening. She accomplished this by using motivational tools and providing the sales force with extensive training.
3.1 Products and Services Plan
Changing labor market conditions threaten the concept of full-time permanent employment.
AAP provides a complex blend of services to distinct populations. The company serves businesses through connecting them with the professional contingent work force. It also serves the worker by connecting them with businesses, at no charge, and providing benefits not often provided by other employment agencies.
Market Analysis Summary
All About People (AAP) is a local firm that costs less than a consultant or agency, provides for both project and long-term needs, and has an easy, pay and billing rate system that covers employee payroll and worker’s compensation insurance.
There are a variety of reasons why businesses may need AAP’s services:
- Spikes in work load
- Business expands into an area that in-house expertise does not yet match
- Special events
- Pregnancy leave or sabbatical
- Business increases after layoffs
- Smaller business does not yet have staff on-hand to complete extra projects.
According to economic forecasters, employment agencies and financial services are expected to have the largest industry growth over the next 25 years. The trend toward businesses cutting back on employees and their benefits due to high costs creates the demand for AAP’s services.
Just consider the time, energy, and resources an employer may spend trying to employ a person for a 20-hour task.
In addition to the already lucrative temporary industry, several companies in the Portland Metro Area place professional contingent workers, but the southern Willamette Valley is not currently being served.
The company approaches businesses primarily through networking and cold calls. Our intention is to utilize a PR agency for more coverage as soon as possible. AAP is a member of the area Chamber of Commerce and actively participates in as many activities as possible, the proprietor is a member of the Women’s Business Network, the Professional Women’s Organization, and we are in the process of connecting with the Society for Human Resource Management. Prior to start-up, AAP also surveyed several area businesses about their use of contingent workers. The company will use its website and other marketing materials that describe what services we provide and explain how simple it is to work with us.
AAP advertises in local papers and trade magazines when absolutely necessary, but most often uses the Oregon Employment Department, both community college and university campuses, and the networking groups we are members of to search out the right employee. Prior to the sole proprietor start-up, the company started recruiting by administering twenty personnel surveys and advertising locally to create a staff of qualified contingent workers. This staff will be unaffected by AAP’s corporate restructuring.
4.1 Market Segmentation
The market can be broken down into two segments: the business market segment, and the employee market segment. Both of these segments are lucrative.
Business market targets:
The company targets the University of Oregon, Lane Community College, the nonprofit organizations, the publishing industry, the advertising industry, and other large businesses.
Employee market targets:
Editors/writers, graphic artists, computer specialists, event planners/fundraisers, and language translators/interpreters working in the business target markets listed above, as well as any applicants with unusual skills and talents.
4.2 Service Business Analysis
These charts demonstrate the types of workers employed, the type of qualified professionals on file to work for the company, and the types of businesses who have used AAP’s services. These statistics cover the 15-month sole proprietorship period from July 1, 1998 through September 30, 1999.
Types of workers employed by or signed up with AAP
| Types of workers using AAP: | % employed by AAP: |
% signed up with AAP: |
| Computer | 34 | 24 |
| Editor/Writer | 20 | 25 |
| Event Planner | 13 | 10 |
| Graphic Artist | 10 | 13 |
| Language Interp/Trans | 13 | 17 |
| Other | 10 | 11 |
Types of employers using AAP
| Types of employers using AAP: | Percent |
| High Tech | 14 |
| Nonprofit | 39 |
| Manufacturing | 18 |
| Publisher | 11 |
| Service | 18 |
Database
Each and every contact is entered into the database-either in the professionals file if they are a potential candidate, or in the contacts file if they are another type of contact. The client and jobs files utilize the contact and client numbers to automatically fill in the information from the contact or client files. This means no duplicate typing. In addition, the contacts, clients, and professional files all have follow-up sheets attached making daily follow-up easy. Simply pull the file up for that day and all calls that need to be made that day will be marked.
Searching is easy. The check boxes within each professionals file allows us to check for singular or multiple skills and experience with a click and a return.
4.2.1 Competition and Buying Patterns
First form filled out from the moment the candidate calls. Three screens constitute one file: Personal Information; Job Information; Skills. The professional and contact files have a conversation record that will allow easy follow-up with a list daily of those records needing a call.
Interview Form
Directly from the employee forms the Employment Specialist can select the appropriate interview form. This form consists of three sheets: Basic Questions; Other Information/Recommendations; and Reference Checks.
Employee Profile Sheet
From the above information, a profile sheet is generated in hard copy for the inside of each file. This is our second backup system (besides the tape drive) in case of a power outage, etc.
4.2.2 Contact Sheet
This form is used for all other contacts. From here, a contact can be turned into a client by merely typing the contact number in on the client sheet, automatically bringing in all of the information.
In addition, the contacts can be pulled up as a list and can be used to create the client information. The professional and contact files have a conversation record that will allow easy follow-up with a list daily of those records needing a call.
4.2.3 Client Sheet
The client sheet is easily created by filling in the contact number. All pertinent information is automatically entered. The client sheet has its own contact sheet attached generating a daily follow-up list. The client files can also be pulled into a handy contact list.
Strategy and Implementation Summary
AAP is completely service minded, customizing personnel packages and offering the most it can to both employers and employees. The company brokers professional workers to Willamette Valley businesses. Because we serve two distinct groups of people, both businesses and employees will be considered equally important to AAP.
The company consists of five divisions, targeting the following types of workers and needs in businesses:
Computer Division
- Computer Application Specialists
- Computer Hardware Specialists
- Computer Programmers
- Network Administrators
- Web Specialists
Editor/Writers
- Multi-lingual
- PR/Marketing
- Technical
Event Planners
- Fundraisers
- Large and Small
Graphic Artists
- Design
- Production
- Web
Language Interpreters and Translators
- Multiple Languages
- Person-to-Person
- Written
Within these categories, we originally set up a system of single sheets on card stock and filed them in binders. Since then, an electronic database has been created by one of our professionals. With the push of a button, AAP can search for a client or an employee needed.
Businesses and employees will be able to communicate with AAP via both new technological and traditional methods. Our Web page provides information about AAP including what professional fields we serve, what clients we are working with, and what services we offer. A second-generation Web page will provide information about employees for businesses through a password-protected area. AAP forwards candidates’ resumes and other information through a variety of methods: phone, fax, personal visit, mail, and the Web page.
In August 1999 we moved the offices to the center of town. Accounting is handled electronically by the proprietor through QuickBooks, with the complex needs handled by our CPA. All payroll is generated through the payroll service, Paychex. The office is furnished with all of the technology needed to operate on a daily basis, increase market share, and serve clients.
5.1 Competitive Edge
When a business is contacted and expresses interest in contingent employees that the company can provide, the following procedures will be followed:
- Consult with client and create a follow-up plan.
- Complete the contact, client, and job sheet in the database.
- Print one of each and forward a copy of the job sheet on yellow paper to the employment specialist.
- File original sheets in the appropriate binders.
- Search for matches in the database and pull each folder that looks like it will work.
- Review that folder to assure a match.
- Call each potential candidate and discuss the job and pay to its fullest.
- Fax, e-mail, or otherwise contact client with information and/or resumes for review.
- Schedule interviews or make a decision on appropriate candidates.
5.2 Sales Strategy
When an employee seeks to work with the company, the following procedures will be followed:
- Complete the professional’s form in the database.
- While completing this sheet, screen the employee for experience levels, requiring professional experience in each arena they wish to work.
- Set up an interview with the employment specialist if the professional is qualified.
- Create a file for each employee and place all paperwork, along with a copy of the professional’s form.
- Keep in touch with the professional quarterly if nothing comes up, more often if at all possible.
- When the professional agrees to a position, they will be supplied with an employee policy manual, pieces of letterhead for invoicing, and will complete the IRS I-9 and W-4 forms prior to beginning work.
5.2.1 Sales Forecast
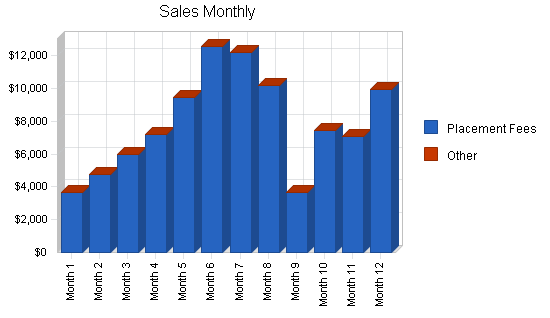
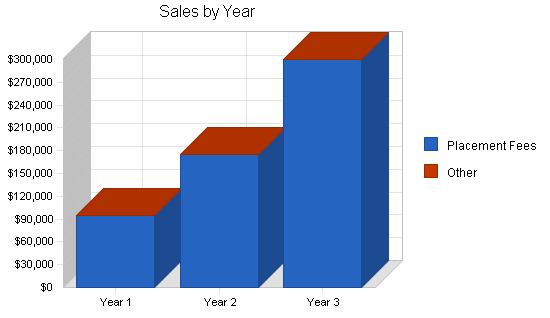
Our sales forecast projections are presented in the chart and table below. Three years annual projections are shown in the table. The chart shows first year monthly forecast. First year monthly table is included in the appendix.
| Sales Forecast | |||
| Year 1 | Year 2 | Year 3 | |
| Sales | |||
| Placement Fees | $94,248 | $175,000 | $300,000 |
| Other | $0 | $0 | $0 |
| Total Sales | $94,248 | $175,000 | $300,000 |
| Direct Cost of Sales | Year 1 | Year 2 | Year 3 |
| Placement Fees | $0 | $0 | $0 |
| Other | $0 | $0 | $0 |
| Subtotal Direct Cost of Sales | $0 | $0 | $0 |
5.2.2 Target Market Segment Strategy
The pay rate data will be determined by changing market factors including business demand.
Our experience shows that the following is true in regards to pay and bill rates. A “good deal” for most temporary agencies is a 50% of pay rate markup. Thus, if the pay is $10, the bill is $15. However, we have traditionally used a flat markup that seemed appropriate. Pay and bill rates generally are outlined as follows:
Editors
Most editors require between $25 and $35 per hour, and our history has shown a $10 per hour markup is acceptable. One exception is in the technical arena, garnering between $45 and $55 per hour pay; again a $10 per hour markup is typical.
Writers
The only writing we have done is creative for [client name omitted], and we paid $15 with a $10 markup.
Event Planners
Event planners often will work for between $12.50 and $25 per hour, depending on the length of the job, requirements, and experience needed. We find a $5 per hour markup on the $12.50-$17.50 is reasonable, and a $10 per hour markup on anything over $17.50 per hour.
Fundraisers
Fundraisers can start at $10 per hour (nonprofit) and go up to $20 per hour. This usually depends on client and length of assignment. Bill rate markup for nonprofits is $5 per hour, others between $7.50 and $10 per hour.
Graphic Artists
Entry level beginning at $12.50 per hour, intermediate at $15 per hour, and a top of the line professional at $25 per hour. The exception may run about $50 per hour. Bill rates are between $7.50 per hour markup ($12.50-$15), and $10 markup.
Language Interpreters
This is a tricky arena. Pricing depends on the language (typical/atypical) and the length of the assignment. Interpreters have been known to work for as little as $15 per hour and for as much as $35 per hour. A $10 per hour markup is acceptable.
Language Translators
This division is difficult as each language and situation varies slightly. Translators tend to work by page or by word. Technical translation can be as much as $.30 per word. Other translation can be $10 per hour (an hour a page). We are unsure of markup at this time, but would suggest 50% of pay rate.
Computer Specialists:
- Application-Starting at $12.50 an hour based on Xerox experience. Markup $5 per hour.
- Programmer-Starting at $20 an hour based on AlbertIQ experience. Markup $10 per hour at a minimum. Try for $15.
- Web Designer-Entry level positions can start at $10 per hour with a markup of $5. Project work typically starts at $15 an hour, markup at least $10 per hour.
- Administration-Pay rates range between $50 and $75 per hour, with a preferred markup of $25 per hour.
When determining the bill rate, additional expense factors to remember above the pay rate are 15% employer taxes, advertising, and staff time to fill the position.
5.3 Milestones
The company has an outstanding client list and an incredible number of qualified employees available. AAP has a good reputation for providing qualified people in a timely manner.
AAP just moved its offices and in 2000 will add employees. The company will soon have one front office person, one employment specialist, as well as the proprietor who will concentrate on sales and running the business. We own all necessary equipment and are in the process of acquiring more to make our jobs easier. Most notably, we are in the process of completing our customized data base.
Management Summary
In a variety of settings the proprietor of AAP has strong management experience. The proprietor has the skills to not only listen well, drawing out a person’s needs through open-ended questions, but also has the ability to recognize people’s strengths and weaknesses. She will draw upon this extensive successful experience in addition to the knowledge collected over a period of 18 years working professionally. Much of the “people” skills have been developed during the seven years spent in management roles. This experience, along with a varied background, supports AAP’s goals.
AAP’s objectives are threefold:
- To provide high quality, experienced, professional workers to businesses that are currently relying on the instability of word-of-mouth contacts, and are spending much of their time and resources (and, therefore, money) locating such workers;
- To provide these workers with a path by which to reach the employer without spending their own time, money, and energy finding the work; and
- To use this opportunity to make the contingent work force a better place for both the employer and the employee.
The long-term goal of the company is to franchise and/or to become multi-location, and eventually sell this business.
Management is a style, a belief, and a strategy.
In managing our clients, AAP will communicate regularly with them, setting up a schedule that meets their needs. The company will set goals for retention of clientele and strive to reach those goals by building relationships, listening to the client’s needs, and meeting those needs with a smile on our faces. We will take responsibility for our errors and the outcome.
In managing our workers, AAP will communicate regularly with them, providing them with an employee manual to minimize their confusion, and offer them the best pay and benefits possible. AAP will set goals for retention of employees and strive to reach those goals by treating each employee with respect, provide protection when appropriate, and do everything within our power to assure a healthy working environment.
This is a relationship business. AAP will manage all clients and employees through relationship building.
During 1998-99 the proprietor provided all services. In 2000 the company will add a part-time office staffer and an employment specialist. In response to this growth, we will have a procedures manual for in-house staff assuring that the information is clear. In addition, we will provide employees with regular training within the divisions to assure they understand the details of the work they are doing daily. 2001 projections include a receptionist, another employment specialist, and a field representative. In 2002 AAP will examine the feasibility of opening a branch office in the Salem, Bend, or Medford/Ashland areas.
| Personnel Plan | |||
| Year 1 | Year 2 | Year 3 | |
| Placed Employees Personnel | |||
| Placed Workers at 2/3 of Sales | $51,836 | $99,750 | $171,000 |
| Other | $0 | $0 | $0 |
| Subtotal | $51,836 | $99,750 | $171,000 |
| General and Administrative Personnel | |||
| Office Employees | $10,929 | $25,000 | $30,000 |
| Other | $0 | $0 | $0 |
| Subtotal | $10,929 | $25,000 | $30,000 |
| Total People | 0 | 0 | 0 |
| Total Payroll | $62,765 | $124,750 | $201,000 |
6.1 Payroll
All About People runs its payroll twice a month. Each professional will be given a check schedule when they work with AAP. Each check covers the previous two weeks.
In order to process payroll; AAP must receive a professional’s signed invoice the Wednesday prior to payday. The invoice, must be on AAP letterhead and include: name, social security number, mailing address, dates of work completed, location worked (at home, at the client’s office), one or two sentences describing what tasks were completed, and how much time was spent each day. At the bottom there must be a place for the client to sign and date in acceptance of the work to date. The original will be submitted to AAP, the client will receive one copy, and the professional will keep a copy.
AAP is unable to provide payroll advances. If a check is lost in the mail, we must wait seven days from the date of mailing, and then if the check has not arrived we will stop the check at the bank and have one reissued.
6.2 Benefits
Because we value our employees, we have employee group health insurance available, and contribute a major portion of the monthly premium. According to the Insurance Pool Governing Board (IPGB) employees must work at least 17.5 hours per week. Employees who work intermittently or who have worked fewer than 90 calendar days are not eligible. IPGB also states that all carriers may decline to offer coverage to the business or to any employee.
Technically, All About People is employer of the professionals we place. This means that we are responsible for covering the worker’s compensation insurance, running payroll, and that we are the ones to whom each employee is responsible. We understand that this can be tricky when employee professionals are working with a client, so we want to describe the expectations of this relationship:
- If the professional doesn’t understand the work or assignment that has been given by the client, then discuss the work with the client.
- If there are issues at work, the employee should inform AAP and then speak with the client.
- If these issues continue, the employee should talk with AAP immediately.
- If the professional feels they are being harassed at work they should let AAP know immediately.
- If the employee should be being asked to perform tasks other than the original assignment, the employee should talk with AAP before beginning any tasks other than the original assignment.
- If the professional is being asked to work overtime (more than 40 hours per week), they should let us know immediately.
AAP does not guarantee either work or wages when you join us to become an AAP employee. We will, of course, strive to keep you as busy as possible. AAP is also not able to guarantee an hourly wage prior to the assignment beginning. If you work on a job, and complete the work successfully, you will be paid at the agreed rate.
This employment relationship differs from others because you, AAP, or the client may end your employment with or without notice and with or without reasons. However, if you accept a job with AAP, we do expect you to finish the assignment.
Marketing Strategy
AAP’s target market is both businesses and professional workers. Phase one of the marketing plan will target the University of Oregon, the technology industry, and the top 500 businesses in Eugene through networking and cold calling. Phase two will target small businesses with less than five employees because smaller businesses may not have the in-house capability to locate, evaluate, and hire potential professional contingent workers through a small PR campaign.
7.1 Businesses
We began marketing the businesses through several personnel surveys. The University of Oregon Alumni Association, University of Oregon Foundation, and University of Oregon Human Resources Department, as well as Symantec’s Human Resources director were approached for information regarding their need for professional temporary and permanent workers. These initial interviewees have all (with the exception of U of O HR Dept) become clients within the first year of business. After these personnel surveys were complete, we adjusted our recruitment of professional workers to meet the demand.
Another tactic was joining multiple business groups. AAP became a member of the Eugene Chamber of Commerce and attends the weekly greeters meetings; the Women’s Business Network and attends the monthly meetings; the Professional Women’s Organization and attend the monthly meetings; as well as the City Club, keeping a pulse on what is happening in the community, attending as the proprietor sees fit.
The next approach is face-to-face cold calls. The tools for these calls are simple-a business card and a brochure. The information collected during the cold call is vital: how many employees does the business have; in what areas have they experienced a need for professional contingent employees; and who is the appropriate contact.
7.2 Professional Workers
Our beginning point in marketing to workers was approximately 30 personnel surveys to professional contingent workers, building the foundation of our database. AAP intends to recruit workers through advertising in the newspaper and appropriate trade magazines, trade shows, the University of Oregon career center, and by referral. We have found that each division within the company requires a different approach for recruitment. We try not to depend on newspaper advertising as we find the results are moderate. Results are far better with the employment department for some areas, with the U of O for others, and also through a series of developed contacts for the other divisions.
7.2.1 Trust
In order to build trust with both businesses and employees AAP will follow through as promised. We will treat each business, employee, and ourselves, with integrity. AAP will communicate clearly, asking businesses to specify the needs for follow-up service during the time that they employ our contingent worker. We will work with employees to assure that they have a clear understanding of what AAP offers and what we expect of them.
7.3 Supporting Research
“A fading model of employment in the United States envisions a business enterprise with full-time employees who can expect to keep their jobs and perhaps advance so long as they perform satisfactorily and the business continues. Changing labor market conditions threaten the concept of full-time permanent employment. As reported by the Conference Board in September 1995, contingent workers account for at least 10 percent of the workforce at 21 percent of the companies surveyed, or almost double the 12 percent of respondents with that number in 1990. Writing in the Monthly Labor Review in March 1989, Belous estimated that contingent workers constitutes 24 to 29 percent of the labor force in the United States. In August 1995, however, the U.S. Bureau of Labor Statistics (BLS) estimated the size of the contingent labor force at 2 to 5 percent of the total workforce. However, BLS did not count long-term part-time employees, who constitute 90 percent of part-time workers.”
— Society for Human Resource Management, The Contingent Worker: A Human Resource Perspective, by W. Gilmore McKie & Laurence Lipset taken from Chapter 1, What Is a Contingent Worker?
AAP is a service company providing businesses with customized personnel solutions by connecting them with the professional contingent work force. Research suggests that 2000 is an opportune time to be in the Eugene market with this service. Even with all of the evidence that contingent work is the wave of the present, and of the future, the niche of placing contingent workers who are paid $12.50 to $40 per hour is untapped in the Eugene area. However, a few companies place high-end contingent workers in the Portland area.
There are many reasons why businesses are turning to contingent workers. The Economic Policy Institute’s article “Contingent Work” by Polly Callaghan and Heidi Harmann explains that:
“Growth in involuntary part-time employment is causing total part-time employment to grow faster than total employment. Another indication of the shift toward part-time workers: hours for part-time workers are growing faster than hours for full-time workers. Temporary employment has grown three times faster than overall employment and temporary workers are being used for more hours. Contingent employment is growing faster than overall employment. Part-timers are disproportionately women, younger, or older workers. There has been a shift away from manufacturing toward trade and services. These structural changes help explain the growth in part-time employment.”
Because of the changing nature of jobs themselves, AAP’s services are desirable to employers of all sizes. Unlike five or ten years ago, many positions are so diversified, or specialized, that it is not financially feasible for an employer to hire a person to fill one position, requiring several areas of expertise. This is not financially wise for the business because of the pay range required to recruit and hire such a talented person (especially in areas such as graphics, design, etc.). The cost of payroll, taxes, benefits, and other miscellaneous staff required to run employees add to the burden of a downsized staff. Contacting AAP and using a professional contingent worker for each portion of a position as needed will solve this dilemma. Currently most businesses locate needed “qualified” workers by word of mouth. With one phone call, e-mail, or connection with our Web page, AAP makes the task easy.
In addition, Oregon’s economy is expected to continue growing, and employment, total personal and per capita income, and population growth rates are expected to exceed the national average (according to the 1997-98 Oregon Blue Book). Although Oregon’s economy is among the best there is an obvious group of contingent workers available to build an employee labor pool. The company draws from a labor pool of qualified contingent workers which consists of people who work at home, retirees, others who wish to work part-time. According to the Oregon University System, approximately 33% of bachelor’s degree graduates will be unable to find jobs in Oregon each year. So, recent college graduates are also a part of AAP’s labor pool.
Research shows that a large percentage of workers who tend to work more than one job are well-educated individuals who have a higher degree of education. According to Oregon Employment Department’s Occupational Outlook Quarterly, Spring 1997, 9.4% have Ph.D.’s; 6.5% a Professional degree; 9.1% a Master’s degree; 7.9% a Bachelor’s degree; 7.9% an Associate degree; and the remaining 15.8% lesser education. According to a Personnel Journal article “Contingent Staffing Requires Serious Strategy,” April 1995, there are also many retirees that enjoy doing contingent work.
Financial Plan
The following sections contain the financial information for All About People. Tables show annual projections for three years. Charts show first year monthly figures. First year monthly tables are included in the appendix.
8.1 Important Assumptions
The financials of this plan are predicated on the following table of assumptions.
| General Assumptions | |||
| Year 1 | Year 2 | Year 3 | |
| Plan Month | 1 | 2 | 3 |
| Current Interest Rate | 10.00% | 10.00% | 10.00% |
| Long-term Interest Rate | 7.00% | 7.00% | 7.00% |
| Tax Rate | 0.00% | 30.00% | 30.00% |
| Other | 0 | 0 | 0 |
8.2 Projected Profit and Loss
Profit and Loss figures are projected in this table.


| Pro Forma Profit and Loss | |||
| Year 1 | Year 2 | Year 3 | |
| Sales | $94,248 | $175,000 | $300,000 |
| Direct Cost of Sales | $0 | $0 | $0 |
| Placed Employees Payroll | $51,836 | $99,750 | $171,000 |
| Other | $0 | $0 | $0 |
| Total Cost of Sales | $51,836 | $99,750 | $171,000 |
| Gross Margin | $42,412 | $75,250 | $129,000 |
| Gross Margin % | 45.00% | 43.00% | 43.00% |
| Operating Expenses | |||
| Sales and Marketing Expenses | |||
| Sales and Marketing Payroll | $0 | $0 | $0 |
| Advertising/Promotion | $1,165 | $1,200 | $2,500 |
| Bank Service Charges | $1,019 | $1,000 | $1,500 |
| Contributions | $255 | $300 | $300 |
| Dues & Subscriptions | $887 | $250 | $500 |
| Total Sales and Marketing Expenses | $3,325 | $2,750 | $4,800 |
| Sales and Marketing % | 3.53% | 1.57% | 1.60% |
| General and Administrative Expenses | |||
| General and Administrative Payroll | $10,929 | $25,000 | $30,000 |
| Marketing/Promotion | $6,516 | $6,500 | $12,800 |
| Depreciation | $0 | $0 | $0 |
| Telephone & Pager | $4,168 | $4,800 | $5,000 |
| Recruitment | $1,573 | $1,575 | $2,000 |
| Referral Fees | $170 | $250 | $500 |
| Rent | $6,102 | $9,600 | $10,000 |
| Office Supplies | $2,114 | $2,000 | $3,000 |
| Postage | $1,062 | $1,250 | $1,500 |
| Printing | $3,362 | $4,000 | $5,000 |
| Professional Fees | $6,941 | $5,000 | $7,500 |
| Payroll Taxes | $0 | $0 | $0 |
| Maintenance and Repairs | $311 | $750 | $2,000 |
| Total General and Administrative Expenses | $43,248 | $60,725 | $79,300 |
| General and Administrative % | 45.89% | 34.70% | 26.43% |
| Other Expenses: | |||
| Other Payroll | $0 | $0 | $0 |
| Consultants | $0 | $0 | $0 |
| Misc. | $1,050 | $500 | $1,000 |
| Total Other Expenses | $1,050 | $500 | $1,000 |
| Other % | 1.11% | 0.29% | 0.33% |
| Total Operating Expenses | $47,623 | $63,975 | $85,100 |
| Profit Before Interest and Taxes | ($5,212) | $11,275 | $43,900 |
| EBITDA | ($5,212) | $11,275 | $43,900 |
| Interest Expense | $3,046 | $2,678 | $2,363 |
| Taxes Incurred | $0 | $2,579 | $12,461 |
| Net Profit | ($8,257) | $6,018 | $29,076 |
| Net Profit/Sales | -8.76% | 3.44% | 9.69% |
8.3 Projected Cash Flow
Our cash flow estimates are shown in the chart and table below. The owner expects to invest further amounts in the business over the next two years to finance continued growth.

| Pro Forma Cash Flow | |||
| Year 1 | Year 2 | Year 3 | |
| Cash Received | |||
| Cash from Operations | |||
| Cash Sales | $23,562 | $43,750 | $75,000 |
| Cash from Receivables | $58,112 | $120,477 | $208,324 |
| Subtotal Cash from Operations | $81,674 | $164,227 | $283,324 |
| Additional Cash Received | |||
| Sales Tax, VAT, HST/GST Received | $0 | $0 | $0 |
| New Current Borrowing | $0 | $0 | $0 |
| New Other Liabilities (interest-free) | $0 | $0 | $0 |
| New Long-term Liabilities | $0 | $0 | $0 |
| Sales of Other Current Assets | $0 | $0 | $0 |
| Sales of Long-term Assets | $0 | $0 | $0 |
| New Investment Received | $10,000 | $20,000 | $0 |
| Subtotal Cash Received | $91,674 | $184,227 | $283,324 |
| Expenditures | Year 1 | Year 2 | Year 3 |
| Expenditures from Operations | |||
| Cash Spending | $62,765 | $124,750 | $201,000 |
| Bill Payments | $37,123 | $43,357 | $67,812 |
| Subtotal Spent on Operations | $99,888 | $168,107 | $268,812 |
| Additional Cash Spent | |||
| Sales Tax, VAT, HST/GST Paid Out | $0 | $0 | $0 |
| Principal Repayment of Current Borrowing | $2,720 | $0 | $0 |
| Other Liabilities Principal Repayment | $0 | $0 | $0 |
| Long-term Liabilities Principal Repayment | $4,500 | $4,500 | $4,500 |
| Purchase Other Current Assets | $0 | $0 | $0 |
| Purchase Long-term Assets | $0 | $0 | $0 |
| Dividends | $0 | $0 | $0 |
| Subtotal Cash Spent | $107,108 | $172,607 | $273,312 |
| Net Cash Flow | ($15,434) | $11,620 | $10,012 |
| Cash Balance | $30,566 | $42,186 | $52,199 |
8.4 Projected Balance Sheet
Three year annual balance sheets estimates appear below.
| Pro Forma Balance Sheet | |||
| Year 1 | Year 2 | Year 3 | |
| Assets | |||
| Current Assets | |||
| Cash | $30,566 | $42,186 | $52,199 |
| Accounts Receivable | $12,573 | $23,346 | $40,022 |
| Other Current Assets | $0 | $0 | $0 |
| Total Current Assets | $43,139 | $65,533 | $92,221 |
| Long-term Assets | |||
| Long-term Assets | $0 | $0 | $0 |
| Accumulated Depreciation | $0 | $0 | $0 |
| Total Long-term Assets | $0 | $0 | $0 |
| Total Assets | $43,139 | $65,533 | $92,221 |
| Liabilities and Capital | Year 1 | Year 2 | Year 3 |
| Current Liabilities | |||
| Accounts Payable | $2,761 | $3,635 | $5,747 |
| Current Borrowing | $0 | $0 | $0 |
| Other Current Liabilities | $0 | $0 | $0 |
| Subtotal Current Liabilities | $2,761 | $3,635 | $5,747 |
| Long-term Liabilities | $40,500 | $36,000 | $31,500 |
| Total Liabilities | $43,261 | $39,635 | $37,247 |
| Paid-in Capital | $17,600 | $37,600 | $37,600 |
| Retained Earnings | ($9,464) | ($17,721) | ($11,703) |
| Earnings | ($8,257) | $6,018 | $29,076 |
| Total Capital | ($121) | $25,897 | $54,973 |
| Total Liabilities and Capital | $43,139 | $65,533 | $92,221 |
| Net Worth | ($121) | $25,897 | $54,973 |
8.5 Business Ratios
The table below presents important business ratios from the help supply services industry, as determined by the Standard Industry Classification (SIC) Index code 7363, Help Supply Services.
| Ratio Analysis | ||||
| Year 1 | Year 2 | Year 3 | Industry Profile | |
| Sales Growth | 0.00% | 85.68% | 71.43% | 9.00% |
| Percent of Total Assets | ||||
| Accounts Receivable | 29.15% | 35.63% | 43.40% | 28.80% |
| Other Current Assets | 0.00% | 0.00% | 0.00% | 44.00% |
| Total Current Assets | 100.00% | 100.00% | 100.00% | 76.30% |
| Long-term Assets | 0.00% | 0.00% | 0.00% | 23.70% |
| Total Assets | 100.00% | 100.00% | 100.00% | 100.00% |
| Current Liabilities | 6.40% | 5.55% | 6.23% | 44.00% |
| Long-term Liabilities | 93.88% | 54.93% | 34.16% | 17.50% |
| Total Liabilities | 100.28% | 60.48% | 40.39% | 61.50% |
| Net Worth | -0.28% | 39.52% | 59.61% | 38.50% |
| Percent of Sales | ||||
| Sales | 100.00% | 100.00% | 100.00% | 100.00% |
| Gross Margin | 45.00% | 43.00% | 43.00% | 0.00% |
| Selling, General & Administrative Expenses | #NAME? | 39.56% | 33.31% | 82.20% |
| Advertising Expenses | 1.24% | 0.69% | 0.83% | 1.50% |
| Profit Before Interest and Taxes | -5.53% | 6.44% | 14.63% | 2.40% |
| Main Ratios | ||||
| Current | 15.63 | 18.03 | 16.05 | 1.64 |
| Quick | 15.63 | 18.03 | 16.05 | 1.31 |
| Total Debt to Total Assets | 100.28% | 60.48% | 40.39% | 61.50% |
| Pre-tax Return on Net Worth | 6817.49% | 33.20% | 75.56% | 4.40% |
| Pre-tax Return on Assets | -19.14% | 13.12% | 45.04% | 11.50% |
| Additional Ratios | Year 1 | Year 2 | Year 3 | |
| Net Profit Margin | -8.76% | 3.44% | 9.69% | n.a |
| Return on Equity | 0.00% | 23.24% | 52.89% | n.a |
| Activity Ratios | ||||
| Accounts Receivable Turnover | 5.62 | 5.62 | 5.62 | n.a |
| Collection Days | 57 | 50 | 51 | n.a |
| Accounts Payable Turnover | 14.40 | 12.17 | 12.17 | n.a |
| Payment Days | 27 | 26 | 24 | n.a |
| Total Asset Turnover | 2.18 | 2.67 | 3.25 | n.a |
| Debt Ratios | ||||
| Debt to Net Worth | 0.00 | 1.53 | 0.68 | n.a |
| Current Liab. to Liab. | 0.06 | 0.09 | 0.15 | n.a |
| Liquidity Ratios | ||||
| Net Working Capital | $40,379 | $61,897 | $86,473 | n.a |
| Interest Coverage | -1.71 | 4.21 | 18.58 | n.a |
| Additional Ratios | ||||
| Assets to Sales | 0.46 | 0.37 | 0.31 | n.a |
| Current Debt/Total Assets | 6% | 6% | 6% | n.a |
| Acid Test | 11.07 | 11.60 | 9.08 | n.a |
| Sales/Net Worth | 0.00 | 6.76 | 5.46 | n.a |
| Dividend Payout | 0.00 | 0.00 | 0.00 | n.a |
Appendix
| Sales Forecast | |||||||||||||
| Month 1 | Month 2 | Month 3 | Month 4 | Month 5 | Month 6 | Month 7 | Month 8 | Month 9 | Month 10 | Month 11 | Month 12 | ||
| Sales | |||||||||||||
| Placement Fees | 0% | $3,660 | $4,769 | $5,965 | $7,226 | $9,471 | $12,554 | $12,237 | $10,216 | $3,692 | $7,458 | $7,059 | $9,941 |
| Other | 0% | $0 | $0 | $0 | $0 | $0 | $0 | $0 | $0 | $0 | $0 | $0 | $0 |
| Total Sales | $3,660 | $4,769 | $5,965 | $7,226 | $9,471 | $12,554 | $12,237 | $10,216 | $3,692 | $7,458 | $7,059 | $9,941 | |
| Direct Cost of Sales | Month 1 | Month 2 | Month 3 | Month 4 | Month 5 | Month 6 | Month 7 | Month 8 | Month 9 | Month 10 | Month 11 | Month 12 | |
| Placement Fees | $0 | $0 | $0 | $0 | $0 | $0 | $0 | $0 | $0 | $0 | $0 | $0 | |
| Other | $0 | $0 | $0 | $0 | $0 | $0 | $0 | $0 | $0 | $0 | $0 | $0 | |
| Subtotal Direct Cost of Sales | $0 | $0 | $0 | $0 | $0 | $0 | $0 | $0 | $0 | $0 | $0 | $0 | |
| Personnel Plan | |||||||||||||
| Month 1 | Month 2 | Month 3 | Month 4 | Month 5 | Month 6 | Month 7 | Month 8 | Month 9 | Month 10 | Month 11 | Month 12 | ||
| Placed Employees Personnel | |||||||||||||
| Placed Workers at 2/3 of Sales | $2,013 | $2,623 | $3,281 | $3,974 | $5,209 | $6,905 | $6,730 | $5,619 | $2,031 | $4,102 | $3,882 | $5,467 | |
| Other | $0 | $0 | $0 | $0 | $0 | $0 | $0 | $0 | $0 | $0 | $0 | $0 | |
| Subtotal | $2,013 | $2,623 | $3,281 | $3,974 | $5,209 | $6,905 | $6,730 | $5,619 | $2,031 | $4,102 | $3,882 | $5,467 | |
| General and Administrative Personnel | |||||||||||||
| Office Employees | $0 | $213 | $350 | $350 | $350 | $466 | $700 | $1,500 | $1,750 | $1,750 | $1,750 | $1,750 | |
| Other | $0 | $0 | $0 | $0 | $0 | $0 | $0 | $0 | $0 | $0 | $0 | $0 | |
| Subtotal | $0 | $213 | $350 | $350 | $350 | $466 | $700 | $1,500 | $1,750 | $1,750 | $1,750 | $1,750 | |
| Total People | 0 | 0 | 0 | 0 | 0 | 0 | 0 | 0 | 0 | 0 | 0 | 0 | |
| Total Payroll | $2,013 | $2,836 | $3,631 | $4,324 | $5,559 | $7,371 | $7,430 | $7,119 | $3,781 | $5,852 | $5,632 | $7,217 | |
| General Assumptions | ||||||||||||
| Month 1 | Month 2 | Month 3 | Month 4 | Month 5 | Month 6 | Month 7 | Month 8 | Month 9 | Month 10 | Month 11 | Month 12 | |
| Plan Month | 1 | 2 | 3 | 4 | 5 | 6 | 7 | 8 | 9 | 10 | 11 | 12 |
| Current Interest Rate | 10.00% | 10.00% | 10.00% | 10.00% | 10.00% | 10.00% | 10.00% | 10.00% | 10.00% | 10.00% | 10.00% | 10.00% |
| Long-term Interest Rate | 7.00% | 7.00% | 7.00% | 7.00% | 7.00% | 7.00% | 7.00% | 7.00% | 7.00% | 7.00% | 7.00% | 7.00% |
| Tax Rate | 30.00% | 30.00% | 30.00% | 30.00% | 30.00% | 30.00% | 30.00% | 30.00% | 30.00% | 30.00% | 30.00% | 30.00% |
| Other | 0 | 0 | 0 | 0 | 0 | 0 | 0 | 0 | 0 | 0 | 0 | 0 |
| Pro Forma Profit and Loss | |||||||||||||
| Month 1 | Month 2 | Month 3 | Month 4 | Month 5 | Month 6 | Month 7 | Month 8 | Month 9 | Month 10 | Month 11 | Month 12 | ||
| Sales | $3,660 | $4,769 | $5,965 | $7,226 | $9,471 | $12,554 | $12,237 | $10,216 | $3,692 | $7,458 | $7,059 | $9,941 | |
| Direct Cost of Sales | $0 | $0 | $0 | $0 | $0 | $0 | $0 | $0 | $0 | $0 | $0 | $0 | |
| Placed Employees Payroll | $2,013 | $2,623 | $3,281 | $3,974 | $5,209 | $6,905 | $6,730 | $5,619 | $2,031 | $4,102 | $3,882 | $5,467 | |
| Other | $0 | $0 | $0 | $0 | $0 | $0 | $0 | $0 | $0 | $0 | $0 | $0 | |
| Total Cost of Sales | $2,013 | $2,623 | $3,281 | $3,974 | $5,209 | $6,905 | $6,730 | $5,619 | $2,031 | $4,102 | $3,882 | $5,467 | |
| Gross Margin | $1,647 | $2,146 | $2,684 | $3,252 | $4,262 | $5,649 | $5,507 | $4,597 | $1,661 | $3,356 | $3,177 | $4,474 | |
| Gross Margin % | 45.00% | 45.00% | 45.00% | 45.00% | 45.00% | 45.00% | 45.00% | 45.00% | 44.99% | 45.00% | 45.01% | 45.00% | |
| Operating Expenses | |||||||||||||
| Sales and Marketing Expenses | |||||||||||||
| Sales and Marketing Payroll | $0 | $0 | $0 | $0 | $0 | $0 | $0 | $0 | $0 | $0 | $0 | $0 | |
| Advertising/Promotion | $12 | $0 | $0 | $23 | $10 | $111 | $27 | $72 | $30 | $599 | $102 | $179 | |
| Bank Service Charges | $0 | $57 | $3 | $73 | $539 | $106 | $38 | $3 | $8 | $48 | $129 | $15 | |
| Contributions | $0 | $0 | $0 | $100 | $5 | $0 | $0 | $100 | $0 | $0 | $0 | $50 | |
| Dues & Subscriptions | $43 | $30 | $54 | $0 | $0 | $21 | $275 | $94 | $0 | $250 | $60 | $60 | |
| Total Sales and Marketing Expenses | $55 | $87 | $57 | $196 | $554 | $239 | $340 | $268 | $38 | $897 | $291 | $304 | |
| Sales and Marketing % | 1.50% | 1.82% | 0.95% | 2.71% | 5.85% | 1.90% | 2.78% | 2.63% | 1.02% | 12.03% | 4.12% | 3.06% | |
| General and Administrative Expenses | |||||||||||||
| General and Administrative Payroll | $0 | $213 | $350 | $350 | $350 | $466 | $700 | $1,500 | $1,750 | $1,750 | $1,750 | $1,750 | |
| Marketing/Promotion | $213 | $236 | $331 | $691 | $756 | $656 | $592 | $441 | $154 | $1,149 | $784 | $514 | |
| Depreciation | $0 | $0 | $0 | $0 | $0 | $0 | $0 | $0 | $0 | $0 | $0 | $0 | |
| Telephone & Pager | $226 | $88 | $416 | $125 | $374 | $220 | $439 | $638 | $697 | $240 | $616 | $90 | |
| Recruitment | $115 | $77 | $189 | $220 | $71 | $147 | $106 | $251 | $45 | $192 | $65 | $95 | |
| Referral Fees | $0 | $20 | $0 | $50 | $0 | $100 | $0 | $0 | $0 | $0 | $0 | $0 | |
| Rent | $195 | $195 | $195 | $195 | $195 | $195 | $983 | $788 | $788 | $788 | $788 | $798 | |
| Office Supplies | $92 | $188 | $96 | $197 | $49 | $62 | $116 | $442 | $24 | $670 | $177 | $0 | |
| Postage | $9 | $49 | $55 | $107 | $133 | $94 | $36 | $99 | $8 | $175 | $89 | $209 | |
| Printing | $0 | $2 | $669 | $26 | $290 | $350 | $175 | $224 | $832 | $179 | $520 | $94 | |
| Professional Fees | $240 | $170 | $664 | $988 | $367 | $270 | $0 | $528 | $844 | $342 | $2,013 | $516 | |
| Payroll Taxes | 15% | $0 | $0 | $0 | $0 | $0 | $0 | $0 | $0 | $0 | $0 | $0 | $0 |
| Maintenance and Repairs | $0 | $0 | $103 | $100 | $0 | $25 | $0 | $39 | $0 | $0 | $44 | $0 | |
| Total General and Administrative Expenses | $1,090 | $1,239 | $3,068 | $3,049 | $2,585 | $2,585 | $3,146 | $4,949 | $5,142 | $5,485 | $6,845 | $4,065 | |
| General and Administrative % | 29.77% | 25.97% | 51.43% | 42.19% | 27.30% | 20.59% | 25.71% | 48.45% | 139.28% | 73.55% | 96.97% | 40.90% | |
| Other Expenses: | |||||||||||||
| Other Payroll | $0 | $0 | $0 | $0 | $0 | $0 | $0 | $0 | $0 | $0 | $0 | $0 | |
| Consultants | $0 | $0 | $0 | $0 | $0 | $0 | $0 | $0 | $0 | $0 | $0 | $0 | |
| Misc. | $40 | $0 | $44 | $244 | $90 | $240 | $159 | $0 | $40 | $20 | $173 | $0 | |
| Total Other Expenses | $40 | $0 | $44 | $244 | $90 | $240 | $159 | $0 | $40 | $20 | $173 | $0 | |
| Other % | 1.09% | 0.00% | 0.74% | 3.38% | 0.95% | 1.91% | 1.30% | 0.00% | 1.08% | 0.27% | 2.45% | 0.00% | |
| Total Operating Expenses | $1,185 | $1,325 | $3,168 | $3,488 | $3,229 | $3,064 | $3,645 | $5,218 | $5,220 | $6,403 | $7,309 | $4,369 | |
| Profit Before Interest and Taxes | $462 | $821 | ($484) | ($236) | $1,033 | $2,585 | $1,862 | ($621) | ($3,559) | ($3,047) | ($4,132) | $104 | |
| EBITDA | $462 | $821 | ($484) | ($236) | $1,033 | $2,585 | $1,862 | ($621) | ($3,559) | ($3,047) | ($4,132) | $104 | |
| Interest Expense | $283 | $281 | $260 | $258 | $256 | $254 | $251 | $245 | $243 | $241 | $238 | $236 | |
| Taxes Incurred | $0 | $0 | $0 | $0 | $0 | $0 | $0 | $0 | $0 | $0 | $0 | $0 | |
| Net Profit | $180 | $540 | ($744) | ($494) | $777 | $2,332 | $1,610 | ($866) | ($3,802) | ($3,287) | ($4,370) | ($132) | |
| Net Profit/Sales | 4.90% | 11.32% | -12.48% | -6.84% | 8.21% | 18.57% | 13.16% | -8.47% | -102.97% | -44.08% | -61.91% | -1.33% | |
| Pro Forma Cash Flow | |||||||||||||
| Month 1 | Month 2 | Month 3 | Month 4 | Month 5 | Month 6 | Month 7 | Month 8 | Month 9 | Month 10 | Month 11 | Month 12 | ||
| Cash Received | |||||||||||||
| Cash from Operations | |||||||||||||
| Cash Sales | $915 | $1,192 | $1,491 | $1,807 | $2,368 | $3,139 | $3,059 | $2,554 | $923 | $1,865 | $1,765 | $2,485 | |
| Cash from Receivables | $0 | $92 | $2,773 | $3,607 | $4,505 | $5,476 | $7,180 | $9,408 | $9,127 | $7,499 | $2,863 | $5,584 | |
| Subtotal Cash from Operations | $915 | $1,284 | $4,264 | $5,413 | $6,873 | $8,614 | $10,240 | $11,962 | $10,050 | $9,363 | $4,628 | $8,069 | |
| Additional Cash Received | |||||||||||||
| Sales Tax, VAT, HST/GST Received | 0.00% | $0 | $0 | $0 | $0 | $0 | $0 | $0 | $0 | $0 | $0 | $0 | $0 |
| New Current Borrowing | $0 | $0 | $0 | $0 | $0 | $0 | $0 | $0 | $0 | $0 | $0 | $0 | |
| New Other Liabilities (interest-free) | $0 | $0 | $0 | $0 | $0 | $0 | $0 | $0 | $0 | $0 | $0 | $0 | |
| New Long-term Liabilities | $0 | $0 | $0 | $0 | $0 | $0 | $0 | $0 | $0 | $0 | $0 | $0 | |
| Sales of Other Current Assets | $0 | $0 | $0 | $0 | $0 | $0 | $0 | $0 | $0 | $0 | $0 | $0 | |
| Sales of Long-term Assets | $0 | $0 | $0 | $0 | $0 | $0 | $0 | $0 | $0 | $0 | $0 | $0 | |
| New Investment Received | $0 | $0 | $0 | $0 | $0 | $0 | $0 | $0 | $0 | $0 | $0 | $10,000 | |
| Subtotal Cash Received | $915 | $1,284 | $4,264 | $5,413 | $6,873 | $8,614 | $10,240 | $11,962 | $10,050 | $9,363 | $4,628 | $18,069 | |
| Expenditures | Month 1 | Month 2 | Month 3 | Month 4 | Month 5 | Month 6 | Month 7 | Month 8 | Month 9 | Month 10 | Month 11 | Month 12 | |
| Expenditures from Operations | |||||||||||||
| Cash Spending | $2,013 | $2,836 | $3,631 | $4,324 | $5,559 | $7,371 | $7,430 | $7,119 | $3,781 | $5,852 | $5,632 | $7,217 | |
| Bill Payments | $193 | $1,465 | $1,449 | $3,089 | $3,388 | $3,125 | $2,863 | $3,222 | $3,954 | $3,752 | $4,923 | $5,699 | |
| Subtotal Spent on Operations | $2,206 | $4,301 | $5,080 | $7,413 | $8,947 | $10,496 | $10,293 | $10,341 | $7,735 | $9,604 | $10,555 | $12,916 | |
| Additional Cash Spent | |||||||||||||
| Sales Tax, VAT, HST/GST Paid Out | $0 | $0 | $0 | $0 | $0 | $0 | $0 | $0 | $0 | $0 | $0 | $0 | |
| Principal Repayment of Current Borrowing | $0 | $0 | $2,220 | $0 | $0 | $0 | $0 | $500 | $0 | $0 | $0 | $0 | |
| Other Liabilities Principal Repayment | $0 | $0 | $0 | $0 | $0 | $0 | $0 | $0 | $0 | $0 | $0 | $0 | |
| Long-term Liabilities Principal Repayment | $375 | $375 | $375 | $375 | $375 | $375 | $375 | $375 | $375 | $375 | $375 | $375 | |
| Purchase Other Current Assets | $0 | $0 | $0 | $0 | $0 | $0 | $0 | $0 | $0 | $0 | $0 | $0 | |
| Purchase Long-term Assets | $0 | $0 | $0 | $0 | $0 | $0 | $0 | $0 | $0 | $0 | $0 | $0 | |
| Dividends | $0 | $0 | $0 | $0 | $0 | $0 | $0 | $0 | $0 | $0 | $0 | $0 | |
| Subtotal Cash Spent | $2,581 | $4,676 | $7,675 | $7,788 | $9,322 | $10,871 | $10,668 | $11,216 | $8,110 | $9,979 | $10,930 | $13,291 | |
| Net Cash Flow | ($1,666) | ($3,392) | ($3,411) | ($2,375) | ($2,449) | ($2,257) | ($428) | $745 | $1,940 | ($616) | ($6,303) | $4,777 | |
| Cash Balance | $44,334 | $40,942 | $37,530 | $35,156 | $32,707 | $30,450 | $30,022 | $30,767 | $32,707 | $32,091 | $25,789 | $30,566 | |
| Pro Forma Balance Sheet | |||||||||||||
| Month 1 | Month 2 | Month 3 | Month 4 | Month 5 | Month 6 | Month 7 | Month 8 | Month 9 | Month 10 | Month 11 | Month 12 | ||
| Assets | Starting Balances | ||||||||||||
| Current Assets | |||||||||||||
| Cash | $46,000 | $44,334 | $40,942 | $37,530 | $35,156 | $32,707 | $30,450 | $30,022 | $30,767 | $32,707 | $32,091 | $25,789 | $30,566 |
| Accounts Receivable | $0 | $2,745 | $6,230 | $7,931 | $9,744 | $12,342 | $16,282 | $18,279 | $16,534 | $10,176 | $8,270 | $10,701 | $12,573 |
| Other Current Assets | $0 | $0 | $0 | $0 | $0 | $0 | $0 | $0 | $0 | $0 | $0 | $0 | $0 |
| Total Current Assets | $46,000 | $47,079 | $47,172 | $45,462 | $44,900 | $45,049 | $46,732 | $48,301 | $47,301 | $42,883 | $40,361 | $36,490 | $43,139 |
| Long-term Assets | |||||||||||||
| Long-term Assets | $0 | $0 | $0 | $0 | $0 | $0 | $0 | $0 | $0 | $0 | $0 | $0 | $0 |
| Accumulated Depreciation | $0 | $0 | $0 | $0 | $0 | $0 | $0 | $0 | $0 | $0 | $0 | $0 | $0 |
| Total Long-term Assets | $0 | $0 | $0 | $0 | $0 | $0 | $0 | $0 | $0 | $0 | $0 | $0 | $0 |
| Total Assets | $46,000 | $47,079 | $47,172 | $45,462 | $44,900 | $45,049 | $46,732 | $48,301 | $47,301 | $42,883 | $40,361 | $36,490 | $43,139 |
| Liabilities and Capital | Month 1 | Month 2 | Month 3 | Month 4 | Month 5 | Month 6 | Month 7 | Month 8 | Month 9 | Month 10 | Month 11 | Month 12 | |
| Current Liabilities | |||||||||||||
| Accounts Payable | $144 | $1,419 | $1,347 | $2,976 | $3,283 | $3,030 | $2,756 | $3,090 | $3,831 | $3,589 | $4,730 | $5,604 | $2,761 |
| Current Borrowing | $2,720 | $2,720 | $2,720 | $500 | $500 | $500 | $500 | $500 | $0 | $0 | $0 | $0 | $0 |
| Other Current Liabilities | $0 | $0 | $0 | $0 | $0 | $0 | $0 | $0 | $0 | $0 | $0 | $0 | $0 |
| Subtotal Current Liabilities | $2,864 | $4,139 | $4,067 | $3,476 | $3,783 | $3,530 | $3,256 | $3,590 | $3,831 | $3,589 | $4,730 | $5,604 | $2,761 |
| Long-term Liabilities | $45,000 | $44,625 | $44,250 | $43,875 | $43,500 | $43,125 | $42,750 | $42,375 | $42,000 | $41,625 | $41,250 | $40,875 | $40,500 |
| Total Liabilities | $47,864 | $48,764 | $48,317 | $47,351 | $47,283 | $46,655 | $46,006 | $45,965 | $45,831 | $45,214 | $45,980 | $46,479 | $43,261 |
| Paid-in Capital | $7,600 | $7,600 | $7,600 | $7,600 | $7,600 | $7,600 | $7,600 | $7,600 | $7,600 | $7,600 | $7,600 | $7,600 | $17,600 |
| Retained Earnings | ($9,464) | ($9,464) | ($9,464) | ($9,464) | ($9,464) | ($9,464) | ($9,464) | ($9,464) | ($9,464) | ($9,464) | ($9,464) | ($9,464) | ($9,464) |
| Earnings | $0 | $180 | $719 | ($25) | ($519) | $258 | $2,590 | $4,200 | $3,334 | ($467) | ($3,755) | ($8,125) | ($8,257) |
| Total Capital | ($1,864) | ($1,684) | ($1,145) | ($1,889) | ($2,383) | ($1,606) | $726 | $2,336 | $1,470 | ($2,331) | ($5,619) | ($9,989) | ($121) |
| Total Liabilities and Capital | $46,000 | $47,079 | $47,172 | $45,462 | $44,900 | $45,049 | $46,732 | $48,301 | $47,301 | $42,883 | $40,361 | $36,490 | $43,139 |
| Net Worth | ($1,864) | ($1,684) | ($1,145) | ($1,889) | ($2,383) | ($1,606) | $726 | $2,336 | $1,470 | ($2,331) | ($5,619) | ($9,989) | ($121) |


