
Transitional Housing of Pittsburgh
Executive Summary
Transitional Housing of Pittsburgh is a start-up not for profit social service agency serving the greater Pittsburgh area. The organization was founded by Amy Rand who has both the practical experience and the education to lead the organization. Amy is currently working on assembling a strong Board of Trustees which will be invaluable for the organization.
Services
Transitional Housing of Pittsburgh is an organization that provides transitional housing and life skill training for women. It offers assistance to women, frequently homeless, as they move from dependent, often abusive relationships into independent, self-sufficient lifestyles. Additionally, it assists clients in child reunification. This is particularly important as 80% of the clients have children but no custody.
This is the city’s only women-only facility and the only one with long-term transitional housing. All other shelters only offer 30 days or less of housing whereas Transitional Housing offers up to two years. On staff is a chemical dependency counselor, AIDS counselor, and a family reunification counselor to assist clients.
The facility provides clients within an eight-step program that teaches them necessary life skills. This collaborative approach to empowerment is the keystone to developing self-sufficiency in the clients. The steps include personal development, vocational training, substance abuse counseling, interpersonal skills building, community involvement, leisure activities, and independent living skills.
The Market
Transitional Housing has identified two distinct market segments of customers based on age; those who are under 30 and those who are 30 and over. The distinction is important because of the high percentage of clients with children, and those in the younger market segment having far younger children. The under 30 age group is growing annually at 9%, and the 30 and over age group growing at 8%. The two groups respectively have 165,454 and 158,745 potential clients. The overwhelming majority of clients come from lower socio-economic population groups. These segments can be difficult to communicate with, yet their use of Transitional Housing’s services would give them some profound benefits.
Management
Amy Rand is the driving force behind the organization and fills the Executive Director role. Amy earned a B.S. degree in Sociology from Case Western Reserve University and a Master’s in Non-for-Profit Management from the University of Pittsburgh. Additionally, she has several years of social service project management. While working as the program manager of Pennsylvania’s largest domestic abuse relief service provider, Amy developed a proactive empowerment program which has become the foundation for Transitional Housing’s collaborative approach to empowerment. During and since her tenure as program manager, Amy has developed a comprehensive network of personal and professional contacts with key community leaders. This will be instrumental in raising the profile of Transitional Housing within the community as well as having a significant impact on fundraising activities.
1.1 Mission
Transitional Housing’s mission is to provide women of Pittsburgh a safe transitional housing alternative, teach a multitude of skills to empower the women to self-sufficiency, and facilitate the possible reunification of clients with their children.
1.2 Keys to Success
- Build a strong, active Board of Trustees.
- Ensure that the offered services satisfy market needs.
- Design and implement strict financial controls and accountability.
1.3 Objectives
- Secure sufficient funding, both start up and operational.
- Create a women’s-only transitional housing facility that provides housing and a variety of empowering skills.
- Develop a strong Board of Trustees that can offer guidance, help with fundraising efforts, and oversee the smooth operation of the organization.

Organization Summary
Transitional Housing was founded as a Pittsburgh, PA based not for profit 501(c)(3) organization. Upon the Board of Trustees’ final approval, Amy Rand will be the Executive Director. The nonprofit will serve female clients in need of transitional housing and life skills training.
The goal of the organization is to provide interim housing and skill training so that clients become empowered, independent individuals. Transitional Housing’s services are unique in their female-only clientele, long-duration transitional housing, and comprehensive empowerment program. Transitional Housing will make a significant impact on the Pittsburgh community, in both short-term relief, and long-term skill development and empowerment.
Real property will take the form of the old Motel 6 building located in downtown Pittsburgh. This building has been identified as an ideal facility for Transitional Housing. The asking price for the building is $2 million with $100,000 down. The building will need some renovation, primarily fixing up the 65 different rooms. A donor has approached us willing to buy the building, with the intent of leasing it back to Transitional Housing long term, for the organization’s use.
2.1 Start-up Summary
Transitional Housing will require the following real property and equipment for the start-up phase.
- Assorted furniture, furnishings, and appliances for the different rooms.
- Seven desk/chairs, computers, and additional accessories.
- A computer server, two laser printers, broadband Internet connection.
- Fax machine and copier.
- Several file cabinets and shelving units.
- Paper shredder.

| Start-up | |
| Requirements | |
| Start-up Expenses | |
| Legal | $3,000 |
| Stationery etc. | $500 |
| Brochures | $500 |
| Other | $0 |
| Total Start-up Expenses | $4,000 |
| Start-up Assets | |
| Cash Required | $18,000 |
| Other Current Assets | $23,000 |
| Long-term Assets | $0 |
| Total Assets | $41,000 |
| Total Requirements | $45,000 |
| Start-up Funding | |
| Start-up Expenses to Fund | $4,000 |
| Start-up Assets to Fund | $41,000 |
| Total Funding Required | $45,000 |
| Assets | |
| Non-cash Assets from Start-up | $23,000 |
| Cash Requirements from Start-up | $18,000 |
| Additional Cash Raised | $0 |
| Cash Balance on Starting Date | $18,000 |
| Total Assets | $41,000 |
| Liabilities and Capital | |
| Liabilities | |
| Current Borrowing | $0 |
| Long-term Liabilities | $0 |
| Accounts Payable (Outstanding Bills) | $0 |
| Other Current Liabilities (interest-free) | $0 |
| Total Liabilities | $0 |
| Capital | |
| Planned Investment | |
| Private Donation | $45,000 |
| Investor 2 | $0 |
| Other | $0 |
| Additional Investment Requirement | $0 |
| Total Planned Investment | $45,000 |
| Loss at Start-up (Start-up Expenses) | ($4,000) |
| Total Capital | $41,000 |
| Total Capital and Liabilities | $41,000 |
| Total Funding | $45,000 |
2.2 Legal Entity
Transitional Housing has been formed as a 501(c)(3) not for profit entity. The purpose of this organization is to offer women transitional housing as well as teach skills that allow these women to become self-sufficient, independent, and drug and alcohol free. Additionally Transitional Housing will, when applicable, assist women who attempt to gain custody of their children.
Funds for the organization will come from many sources including: silent auctions and other in house fund raising efforts, local government funds, foundation grants, corporate and individual donations, and money from the federal government. Amy Rand has in-depth experience with fundraising as well as grant writing and this will be instrumental in Transitional Housing’s search for funding.
Services
Transitional Housing of Pittsburgh is an organization that provides transitional housing and life skill training for women. It offers assistance to women, frequently homeless, as they move from dependent, often abusive relationships into independent, self-sufficient lifestyles. Additionally, it assists clients in child reunification. This is particularly important as 80% of the clients have children but no custody.
This is the city’s only women-only facility and the only one with long-term transitional housing. All other shelters only offer 30 days or less of housing whereas Transitional Housing offers up to two years. On staff is a chemical dependency counselor, AIDS counselor, and a family reunification counselor to assist clients.
Transitional Housing offers 65 rooms, each with its own kitchen facility to homeless women. Each client is allowed to stay for up to one year as long as they are clean and sober (random drug and alcohol testing determines this), and have no other place to go. Additionally, each client must be an active participant of the program:

Collaborative Approach to Empowering Individual. This program is an eight-step program to develop self-sufficient clients. The different elements of the program are:
- Personal development planning.
- Vocational development.
- Substance abuse prevention.
- Interpersonal skill development.
- Personal and spiritual development.
- Community involvement.
- Creative leisure activities/celebration.
- Independent living preparation/follow up.
Transitional Housing is a women-only facility. This is of significant value to the clients as it eliminates the possibility of sexual abuse from the opposite sex within the facility. This is Transitional Housing’s competitive edge, for more detail please refer to section 5.1.
Market Analysis Summary
Transitional Housing has identified two distinct market segments of customers based on age; those who are under 30 and those who are 30 and over. The distinction is important because of the high percentage of clients with children, and those in the younger market segment having far younger children. The under 30 age group is growing annually at 9%, and the 30 and over age group growing at 8%. The two groups respectively have 165,454 and 158,745 potential clients. The overwhelming majority of clients come from lower socio-economic population groups. These segments can be difficult to communicate with, yet their use of Transitional Housing’s services would give them some profound benefits. The good news is if the people are willing to accept help from Transitional Housing they are far more likely to be able to get out of the dire circumstances that they currently face.
The other service providers are temporary shelters that only allow stays of less than 30 days. These service providers are only housing shelters, they do not offer the in-depth self empowerment programs. Some alternative service providers take the form of religious service organizations that assist clients, but on a much smaller scale. The lack of true competition makes Transitional Housing the premier source of interim housing and life skill training. Other agencies would like to offer the comprehensive services that Transitional Housing offers but are unable to because of organizational design constraints or economic restraints. The following sections provide demographic detail regarding the target market.
4.1 Market Segmentation
Transitional Housing has segmented the market into two distinct categories: women under 30 years old and those 30 and older. This is a significant distinction since the children of the younger group will be younger as well. Some demographic information that is relevant to both groups:
- 95% are or were chemically dependent.
- 17% have undergraduate coursework.
- 85% are African-American.
- 80% have children (but generally no custody).
- 6% are H.I.V. positive- generally a result of their drug addiction.
- 7% are Hepatitis C positive- generally a result of their drug addiction.
- 22% were at one time prostitutes.
- 20% have been in prison.

| Market Analysis | |||||||
| Year 1 | Year 2 | Year 3 | Year 4 | Year 5 | |||
| Potential Customers | Growth | CAGR | |||||
| Under 30 years old | 9% | 165,454 | 180,345 | 196,576 | 214,268 | 233,552 | 9.00% |
| 30 years or older | 8% | 158,745 | 171,445 | 185,161 | 199,974 | 215,972 | 8.00% |
| Total | 8.51% | 324,199 | 351,790 | 381,737 | 414,242 | 449,524 | 8.51% |
4.2 Target Market Segment Strategy
Transitional Housing has chosen to target their services to these two market segments because they are the segments that are in the most need of the services. Because of a variety of factors including: time in prison, abusive relationships, alcohol and drug dependencies, and exposure/participation to prostitution, these women have nowhere else to go, no one to turn to. They are in desperate need of transitional housing as well as life skills to empower them to self sufficiency.
Transitional Housing has chosen to serve only women because women who are homeless are far more vulnerable than homeless men. They need more protection because of the increased risk of sexual abuse.
4.3 Service Providers Analysis
The services provided within this industry are typically broken down into two segments: transitional housing and life skills.
- Housing- These services are provided by shelters that offer temporary shelters.
- Life skills- Skills to help empower the individual are offered through daytime programs, but are never (at least in Pittsburgh) part of a transitional housing program where the skills training is part of a comprehensive program.
The following section, 4.3 offers an analysis of the alternative service providers.
4.3.1 Alternatives and Usage Patterns
Housing
Please note that the shelters are only housing and do not offer any type of life skills.
- Womenspace: This is a temporary shelter with an emphasis on women. The maximum stay is 30 days. It is first-come first-served with the prerequisite that the client does not have any other alternatives. This shelter has space for 25 clients with a central cooking area that is staffed. Children are not allowed.
- The 42nd Street Shelter: This is also a temporary shelter with a maximum of 10 clients, also with a central kitchen area. This shelter allows at most two children under the age of 18 to stay with the parent. This facility is typically full, it is difficult to get a room in it.
- The Refuge Shelter: This is a Catholic Church operated temporary shelter that has two main rooms with bunk beds that supports 16 people per male and female room.
Life skills
There are several service providers that teach these skills. They are typically religious based organizations or community based organizations. The courses are generally one hour long and span a few weeks. They are far less comprehensive than Transitional Housing’s and many people miss several sessions because they are taught over a longer period of time.
Strategy and Implementation Summary
Transitional Housing is in an excellent market position to be able to attract good talent and funds due to their sustainable competitive edge. This edge is Transitional Housing’s ability to provide women-only housing that lasts longer and is more complete than traditional “transition housing.”
No one else is able to offer the benefits of a single gender, reasonably long term, housing with skills training. Transitional Housing will be active in their marketing campaign to increase awareness of the facility to the target clients, as well as visibility within the community to aid fundraising efforts, and acquire referrals from other community service agencies.
5.1 Competitive Edge
Transitional Housing has three distinct competitive edges that will be leveraged to help make it a successful service provider with sufficient financial resources:
- Same-gender services: This is quite valuable because homeless women are far more vulnerable than homeless men. The same-gender environment allows women to deal with self-esteem issues which are very typical in abusive and chemical dependent situations. Same-gender settings also allows a sisterhood to develop, allowing the women to bond and develop meaningful, supportive relationships together. Lastly, it minimizes the risk of sexual relations between residents.
- Length of stay: Transitional Housing has the ability to offer clients the option of staying up to two years at the facility. The ability to stay a longer time significantly increase the chance of rehabilitation/skill development/self-sufficiency.
- Empowerment Program: This eight-step program, when fully engaged by the residents (which generally occurs because of the program being on-site and the duration of the stay of the clients) is quite successful in building/empowering self-sufficient, confident women.
5.2 Marketing Strategy
Transitional Housing’s marketing strategy will be two pronged. One goal is to raise awareness about the services to the target customers. The second goal is to increase awareness of Transitional Housing within the community for fundraising efforts.
A main thrust of the effort of increasing visibility within the community of users will be through the development of relationships with other social service providers such as domestic abuse shelters, alcohol treatment centers, prisons, and half-way houses (the interim step after prison and before being totally free). These are the “front line workers” who are in the best position to make referrals to people who are truly in need of the services. By developing a relationship with these organizations, a constant flow of clients can be accomplished. These relationships can be developed through multiple means including frequent open houses for staff of the organizations to allow them to get a “feel” for things as well as maintaining relationships with the individuals that work there as well.
Transitional Housing will also campaign to develop visibility within the community for both client recruitment as well as corporate fundraising. Activities such as participation on radio shows, sponsorship of one day events/seminars, and other public events that are designed to give a presence to Transitional Housing within the community as a leader and an effective social service organization. Fundraising efforts are made more efficient when people know about Transitional Housing and the positive work they are doing.
5.3 Fundraising Strategy
Transitional Housing will rely on many different sources of funds, in part to increase the overall budget, in part to decrease the reliance on any one source. Some of the funds are available immediately, others such as the grants require six to eight month lead/applications periods.
- Silent Auction (and other organizational activities): An annual silent auction will be held to generate funds as well as to generate visibility within the community. The auction will solicit donations of services and goods and then auction them off to auction participants. This will raise money for the organization as well as increase the visibility of Transitional Housing since the auction participants are upper income socialites. There will be other organizational activities.
- United Way: This national not-for-profit organization is a powerful nation-wide fundraiser that collects money and then disperses funds to local groups.
- Pennsylvania Department of Development (local government): Funds are available from this government agency.
- Alcohol and Drug Addiction Services of Mahoney County (local government): This county organization has funds available to organizations that assist with alcohol and drug prevention services.
- Foundation grants (public and private money): This is a rich source of available monies.
- Corporate and individual donations: One program to solicit the corporate donations will be the sponsorship by a corporation of a specific room within the center. With enough corporate sponsorships of different rooms, the renovation/furniture costs for each living quarter can be reduced or eliminated.
- H.U.D (federal government): This source of funds is dedicated to housing organizations.
5.3.1 Funding Forecast
The funding forecast indicates that it is expected to take six months before there are sufficient funds to to get operations rolling. With the expected opening date of month seven, initial funding will trickle in from month two to four with larger quantities arriving around months five and six.
The initial funds will be spent in preparation for the start-up, however Transitional Housing will need a substantial amount for the down payment of the building. Please note that the fundraising effort is not a static one time or annual event. In order to gain true operating sufficiency, Transitional Housing will need to raise funds throughout the year. Consequently, one of the main tasks of the Executive Director will be fundraising.

| Funding Forecast | |||
| Year 1 | Year 2 | Year 3 | |
| Funding | |||
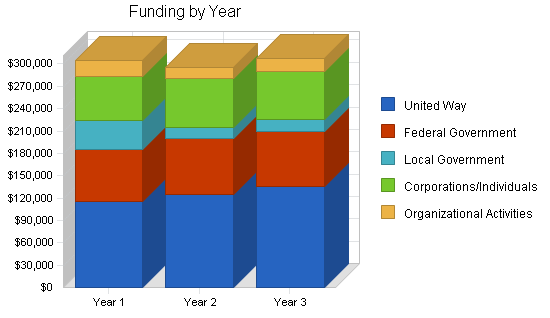
| United Way | $115,000 | $125,000 | $135,000 |
| Federal Government | $70,000 | $75,000 | $75,000 |
| Local Government | $38,500 | $15,000 | $15,000 |
| Corporations/Individuals | $60,000 | $65,000 | $65,000 |
| Organizational Activities | $20,500 | $15,000 | $17,000 |
| Total Funding | $304,000 | $295,000 | $307,000 |
| Direct Cost of Funding | Year 1 | Year 2 | Year 3 |
| Expenses for Organizational Activities | $2,460 | $1,800 | $2,040 |
| Administrative Expenses | $41,040 | $39,825 | $41,445 |
| Subtotal Cost of Funding | $43,500 | $41,625 | $43,485 |
5.4 Milestones
Transitional Housing has identified several important milestones for the organization. Each one must be achieved in a timely manner in order to stay on schedule. Please review the following table for a breakdown of the pertinent information regarding the milestones.

| Milestones | |||||
| Milestone | Start Date | End Date | Budget | Manager | Department |
| Business plan completion | 1/1/2004 | 2/1/2004 | $0 | Amy | Business development |
| Board of Trustees established | 1/1/2004 | 2/15/2004 | $0 | Amy | Business Development |
| First large funds secured | 1/1/2004 | 3/30/2004 | $0 | Amy | Fundraising |
| Operational sufficiency | 1/1/2004 | 4/30/2005 | $0 | Amy | Operations |
| Totals | $0 | ||||
Web Plan Summary
The website will be used as a resource to provide information to clients, referral social service agencies, and donors. The site will be a straightforward source of information including details regarding the empowerment program, information about the facilities, and biographical information about the staff.
6.1 Website Marketing Strategy
The website will be marketed to all referral social service agencies as well as to prospective corporate and individual donors.
6.2 Development Requirements
A programmer (friend of a staff member) has been identified as someone who is willing to develop the site. There will be no labor costs associated with the website as the developmental labor will be donated.
Management Summary
Amy Rand received her undergraduate degree in sociology from Case Western Reserve. While at Case Amy was the chairperson of the Volunteer Student Organization. Amy’s duties for this organization include leadership and member motivation, fundraising, and marketing within the school environment as well as the local community. Following Case, Amy applied and was accepted to The University or Pittsburgh’s Masters in Nonprofit Management. This two year Masters program had an emphasis on management skills, and also encouraged students to undertake practical, one-on-one clinical work, to gain experience managing and being managed in a work environment. Amy’s time in the practicum program was spent working with women victims of domestic abuse.
After graduation, Amy went to work for the largest service provider for survivors of domestic abuse in Pennsylvania. This was a relief agency that offered daytime training and counseling. When she entered the organization as a program manager, they offered some counseling which was geared toward making the person feel better, a reactive approach. Over the three years that Amy spent there she steered the program so that it became more proactive, empowering the women to effect positive change in their life. While this was rewarding, she longed to have more control and ability to effect change within the organization. Amy began discussions with local community leaders to determine the level of support for a new social service organization. She found that there was money/funds to be had for a well run, efficient social service organization that would offer transitional housing and a comprehensive empowerment program, services that were absent from the market. Before she even began the business plan she was informally assembling the Board of Trustees and arranging sources of funds.
7.1 Personnel Plan
- Executive Director- Nonprofit management, fundraising, marketing, and other activities.
- Associate DIrector- Supervise the clinical staff.
- Chemical Dependency Counselor- In-house dependency counselor to assist clients manage their chemical and alcohol dependencies.
- AIDS Counselor- Part-time counselor to assist clients manage their HIV positive status.
- Family Reunification Counselor- Responsible for the strategic, concerted efforts to assist clients to gain custody of their children
- Administration Staff (2)- Responsible for administrative duties.
Board of Trustees- This board will be composed of 15 different influential community leaders. The board will be used as a resource for business decisions and management as well as a source of fundraising. Transitional Housing recognizes the significant value that a board can offer.
| Personnel Plan | |||
| Year 1 | Year 2 | Year 3 | |
| Executive Director | $20,000 | $24,000 | $30,000 |
| Associate Director | $21,000 | $36,000 | $36,000 |
| Chemical Dependency Counselor | $12,000 | $24,000 | $24,000 |
| AIDS Counselor | $4,800 | $9,600 | $9,600 |
| Family Reunification Counselor | $12,000 | $24,000 | $24,000 |
| Admin Staff | $7,000 | $12,000 | $12,000 |
| Admin Staff | $6,000 | $12,000 | $12,000 |
| Total People | 7 | 7 | 7 |
| Total Payroll | $82,800 | $141,600 | $147,600 |
Financial Plan
The following sections outline important financial information.
8.1 Important Assumptions
The following table includes important financial assumptions.
| General Assumptions | |||
| Year 1 | Year 2 | Year 3 | |
| Plan Month | 1 | 2 | 3 |
| Current Interest Rate | 10.00% | 10.00% | 10.00% |
| Long-term Interest Rate | 10.00% | 10.00% | 10.00% |
| Tax Rate | 0.00% | 0.00% | 0.00% |
| Other | 0 | 0 | 0 |
8.2 Break-even Analysis
The Break-even Analysis is shown in the following table and chart.

| Break-even Analysis | |
| Monthly Revenue Break-even | $17,643 |
| Assumptions: | |
| Average Percent Variable Cost | 14% |
| Estimated Monthly Fixed Cost | $15,118 |
8.3 Projected Surplus or Deficit
The following table and charts show projected surplus and deficit.


| Surplus and Deficit | |||
| Year 1 | Year 2 | Year 3 | |
| Funding | $304,000 | $295,000 | $307,000 |
| Direct Cost | $43,500 | $41,625 | $43,485 |
| Other Costs of Funding | $0 | $0 | $0 |
| Total Direct Cost | $43,500 | $41,625 | $43,485 |
| Gross Surplus | $260,500 | $253,375 | $263,515 |
| Gross Surplus % | 85.69% | 85.89% | 85.84% |
| Expenses | |||
| Payroll | $82,800 | $141,600 | $147,600 |
| Account Name | $0 | $0 | $0 |
| Depreciation | $4,596 | $4,596 | $4,596 |
| Leased Building | $48,000 | $48,000 | $48,000 |
| Utilities | $24,000 | $24,000 | $24,000 |
| Insurance | $9,600 | $9,600 | $9,600 |
| Payroll Taxes | $12,420 | $21,240 | $22,140 |
| Other | $0 | $0 | $0 |
| Total Operating Expenses | $181,416 | $249,036 | $255,936 |
| Surplus Before Interest and Taxes | $79,084 | $4,339 | $7,579 |
| EBITDA | $83,680 | $8,935 | $12,175 |
| Interest Expense | $0 | $0 | $0 |
| Taxes Incurred | $0 | $0 | $0 |
| Net Surplus | $79,084 | $4,339 | $7,579 |
| Net Surplus/Funding | 26.01% | 1.47% | 2.47% |
8.4 Projected Cash Flow
The following table and chart illustrate projected cash flow.

| Pro Forma Cash Flow | |||
| Year 1 | Year 2 | Year 3 | |
| Cash Received | |||
| Cash from Operations | |||
| Cash Funding | $304,000 | $295,000 | $307,000 |
| Subtotal Cash from Operations | $304,000 | $295,000 | $307,000 |
| Additional Cash Received | |||
| Sales Tax, VAT, HST/GST Received | $0 | $0 | $0 |
| New Current Borrowing | $0 | $0 | $0 |
| New Other Liabilities (interest-free) | $0 | $0 | $0 |
| New Long-term Liabilities | $0 | $0 | $0 |
| Sales of Other Current Assets | $0 | $0 | $0 |
| Sales of Long-term Assets | $0 | $0 | $0 |
| New Investment Received | $0 | $0 | $0 |
| Subtotal Cash Received | $304,000 | $295,000 | $307,000 |
| Expenditures | Year 1 | Year 2 | Year 3 |
| Expenditures from Operations | |||
| Cash Spending | $82,800 | $141,600 | $147,600 |
| Bill Payments | $129,040 | $141,071 | $146,998 |
| Subtotal Spent on Operations | $211,840 | $282,671 | $294,598 |
| Additional Cash Spent | |||
| Sales Tax, VAT, HST/GST Paid Out | $0 | $0 | $0 |
| Principal Repayment of Current Borrowing | $0 | $0 | $0 |
| Other Liabilities Principal Repayment | $0 | $0 | $0 |
| Long-term Liabilities Principal Repayment | $0 | $0 | $0 |
| Purchase Other Current Assets | $0 | $0 | $0 |
| Purchase Long-term Assets | $0 | $0 | $0 |
| Dividends | $0 | $0 | $0 |
| Subtotal Cash Spent | $211,840 | $282,671 | $294,598 |
| Net Cash Flow | $92,160 | $12,329 | $12,402 |
| Cash Balance | $110,160 | $122,489 | $134,891 |
8.5 Projected Balance Sheet
The following table shows the projected balance sheet.
| Pro Forma Balance Sheet | |||
| Year 1 | Year 2 | Year 3 | |
| Assets | |||
| Current Assets | |||
| Cash | $110,160 | $122,489 | $134,891 |
| Other Current Assets | $23,000 | $23,000 | $23,000 |
| Total Current Assets | $133,160 | $145,489 | $157,891 |
| Long-term Assets | |||
| Long-term Assets | $0 | $0 | $0 |
| Accumulated Depreciation | $4,596 | $9,192 | $13,788 |
| Total Long-term Assets | ($4,596) | ($9,192) | ($13,788) |
| Total Assets | $128,564 | $136,297 | $144,103 |
| Liabilities and Capital | Year 1 | Year 2 | Year 3 |
| Current Liabilities | |||
| Accounts Payable | $8,480 | $11,874 | $12,101 |
| Current Borrowing | $0 | $0 | $0 |
| Other Current Liabilities | $0 | $0 | $0 |
| Subtotal Current Liabilities | $8,480 | $11,874 | $12,101 |
| Long-term Liabilities | $0 | $0 | $0 |
| Total Liabilities | $8,480 | $11,874 | $12,101 |
| Paid-in Capital | $45,000 | $45,000 | $45,000 |
| Accumulated Surplus/Deficit | ($4,000) | $75,084 | $79,423 |
| Surplus/Deficit | $79,084 | $4,339 | $7,579 |
| Total Capital | $120,084 | $124,423 | $132,002 |
| Total Liabilities and Capital | $128,564 | $136,297 | $144,103 |
| Net Worth | $120,084 | $124,423 | $132,002 |
8.6 Standard Ratios
The following table presents standard ratios. Transitional Housing has a Standard Industrial Classification (SIC) code: 8322.0304 – Emergency Shelters. Industry profile ratios are shown for comparison.
| Ratio Analysis | ||||
| Year 1 | Year 2 | Year 3 | Industry Profile | |
| Funding Growth | 0.00% | -2.96% | 4.07% | 7.72% |
| Percent of Total Assets | ||||
| Other Current Assets | 17.89% | 16.87% | 15.96% | 32.31% |
| Total Current Assets | 103.57% | 106.74% | 109.57% | 56.30% |
| Long-term Assets | -3.57% | -6.74% | -9.57% | 43.70% |
| Total Assets | 100.00% | 100.00% | 100.00% | 100.00% |
| Current Liabilities | 6.60% | 8.71% | 8.40% | 23.57% |
| Long-term Liabilities | 0.00% | 0.00% | 0.00% | 28.65% |
| Total Liabilities | 6.60% | 8.71% | 8.40% | 52.22% |
| Net Worth | 93.40% | 91.29% | 91.60% | 47.78% |
| Percent of Funding | ||||
| Funding | 100.00% | 100.00% | 100.00% | 100.00% |
| Gross Surplus | 85.69% | 85.89% | 85.84% | 100.00% |
| Selling, General & Administrative Expenses | #NAME? | 84.42% | 83.37% | 78.74% |
| Advertising Expenses | 0.00% | 0.00% | 0.00% | 0.97% |
| Surplus Before Interest and Taxes | 26.01% | 1.47% | 2.47% | 1.90% |
| Main Ratios | ||||
| Current | 15.70 | 12.25 | 13.05 | 2.18 |
| Quick | 15.70 | 12.25 | 13.05 | 1.77 |
| Total Debt to Total Assets | 6.60% | 8.71% | 8.40% | 3.01% |
| Pre-tax Return on Net Worth | 65.86% | 3.49% | 5.74% | 58.63% |
| Pre-tax Return on Assets | 61.51% | 3.18% | 5.26% | 7.27% |
| Additional Ratios | Year 1 | Year 2 | Year 3 | |
| Net Surplus Margin | 26.01% | 1.47% | 2.47% | n.a |
| Return on Equity | 65.86% | 3.49% | 5.74% | n.a |
| Activity Ratios | ||||
| Accounts Payable Turnover | 16.22 | 12.17 | 12.17 | n.a |
| Payment Days | 27 | 26 | 30 | n.a |
| Total Asset Turnover | 2.36 | 2.16 | 2.13 | n.a |
| Debt Ratios | ||||
| Debt to Net Worth | 0.07 | 0.10 | 0.09 | n.a |
| Current Liab. to Liab. | 1.00 | 1.00 | 1.00 | n.a |
| Liquidity Ratios | ||||
| Net Working Capital | $124,680 | $133,615 | $145,790 | n.a |
| Interest Coverage | 0.00 | 0.00 | 0.00 | n.a |
| Additional Ratios | ||||
| Assets to Funding | 0.42 | 0.46 | 0.47 | n.a |
| Current Debt/Total Assets | 7% | 9% | 8% | n.a |
| Acid Test | 15.70 | 12.25 | 13.05 | n.a |
| Funding/Net Worth | 2.53 | 2.37 | 2.33 | n.a |
| Dividend Payout | 0.00 | 0.00 | 0.00 | n.a |
Appendix
| Funding Forecast | |||||||||||||
| Month 1 | Month 2 | Month 3 | Month 4 | Month 5 | Month 6 | Month 7 | Month 8 | Month 9 | Month 10 | Month 11 | Month 12 | ||
| Funding | |||||||||||||
| United Way | 0% | $0 | $0 | $0 | $60,000 | $0 | $0 | $0 | $0 | $55,000 | $0 | $0 | $0 |
| Federal Government | 0% | $0 | $0 | $10,000 | $10,000 | $5,000 | $25,000 | $0 | $0 | $0 | $0 | $20,000 | $0 |
| Local Government | 0% | $0 | $0 | $12,000 | $0 | $20,000 | $0 | $1,500 | $5,000 | $0 | $0 | $0 | $0 |
| Corporations/Individuals | 0% | $0 | $0 | $5,000 | $2,500 | $7,000 | $6,000 | $15,000 | $9,000 | $12,000 | $0 | $2,000 | $1,500 |
| Organizational Activities | 0% | $0 | $0 | $0 | $0 | $8,000 | $0 | $0 | $500 | $0 | $12,000 | $0 | $0 |
| Total Funding | $0 | $0 | $27,000 | $72,500 | $40,000 | $31,000 | $16,500 | $14,500 | $67,000 | $12,000 | $22,000 | $1,500 | |
| Direct Cost of Funding | Month 1 | Month 2 | Month 3 | Month 4 | Month 5 | Month 6 | Month 7 | Month 8 | Month 9 | Month 10 | Month 11 | Month 12 | |
| Expenses for Organizational Activities | $0 | $0 | $0 | $0 | $960 | $0 | $0 | $60 | $0 | $1,440 | $0 | $0 | |
| Administrative Expenses | $0 | $0 | $3,645 | $9,788 | $5,400 | $4,185 | $2,228 | $1,958 | $9,045 | $1,620 | $2,970 | $203 | |
| Subtotal Cost of Funding | $0 | $0 | $3,645 | $9,788 | $6,360 | $4,185 | $2,228 | $2,018 | $9,045 | $3,060 | $2,970 | $203 | |
| Personnel Plan | |||||||||||||
| Month 1 | Month 2 | Month 3 | Month 4 | Month 5 | Month 6 | Month 7 | Month 8 | Month 9 | Month 10 | Month 11 | Month 12 | ||
| Executive Director | 0% | $0 | $0 | $2,000 | $2,000 | $2,000 | $2,000 | $2,000 | $2,000 | $2,000 | $2,000 | $2,000 | $2,000 |
| Associate Director | 0% | $0 | $0 | $0 | $0 | $0 | $3,000 | $3,000 | $3,000 | $3,000 | $3,000 | $3,000 | $3,000 |
| Chemical Dependency Counselor | 0% | $0 | $0 | $0 | $0 | $0 | $0 | $2,000 | $2,000 | $2,000 | $2,000 | $2,000 | $2,000 |
| AIDS Counselor | 0% | $0 | $0 | $0 | $0 | $0 | $0 | $800 | $800 | $800 | $800 | $800 | $800 |
| Family Reunification Counselor | 0% | $0 | $0 | $0 | $0 | $0 | $0 | $2,000 | $2,000 | $2,000 | $2,000 | $2,000 | $2,000 |
| Admin Staff | 0% | $0 | $0 | $0 | $0 | $0 | $1,000 | $1,000 | $1,000 | $1,000 | $1,000 | $1,000 | $1,000 |
| Admin Staff | 0% | $0 | $0 | $0 | $0 | $0 | $0 | $1,000 | $1,000 | $1,000 | $1,000 | $1,000 | $1,000 |
| Total People | 0 | 0 | 1 | 1 | 1 | 3 | 7 | 7 | 7 | 7 | 7 | 7 | |
| Total Payroll | $0 | $0 | $2,000 | $2,000 | $2,000 | $6,000 | $11,800 | $11,800 | $11,800 | $11,800 | $11,800 | $11,800 | |
| General Assumptions | |||||||||||||
| Month 1 | Month 2 | Month 3 | Month 4 | Month 5 | Month 6 | Month 7 | Month 8 | Month 9 | Month 10 | Month 11 | Month 12 | ||
| Plan Month | 1 | 2 | 3 | 4 | 5 | 6 | 7 | 8 | 9 | 10 | 11 | 12 | |
| Current Interest Rate | 10.00% | 10.00% | 10.00% | 10.00% | 10.00% | 10.00% | 10.00% | 10.00% | 10.00% | 10.00% | 10.00% | 10.00% | |
| Long-term Interest Rate | 10.00% | 10.00% | 10.00% | 10.00% | 10.00% | 10.00% | 10.00% | 10.00% | 10.00% | 10.00% | 10.00% | 10.00% | |
| Tax Rate | 0.00% | 0.00% | 0.00% | 0.00% | 0.00% | 0.00% | 0.00% | 0.00% | 0.00% | 0.00% | 0.00% | 0.00% | |
| Other | 0 | 0 | 0 | 0 | 0 | 0 | 0 | 0 | 0 | 0 | 0 | 0 | |
| Surplus and Deficit | |||||||||||||
| Month 1 | Month 2 | Month 3 | Month 4 | Month 5 | Month 6 | Month 7 | Month 8 | Month 9 | Month 10 | Month 11 | Month 12 | ||
| Funding | $0 | $0 | $27,000 | $72,500 | $40,000 | $31,000 | $16,500 | $14,500 | $67,000 | $12,000 | $22,000 | $1,500 | |
| Direct Cost | $0 | $0 | $3,645 | $9,788 | $6,360 | $4,185 | $2,228 | $2,018 | $9,045 | $3,060 | $2,970 | $203 | |
| Other Costs of Funding | $0 | $0 | $0 | $0 | $0 | $0 | $0 | $0 | $0 | $0 | $0 | $0 | |
| Total Direct Cost | $0 | $0 | $3,645 | $9,788 | $6,360 | $4,185 | $2,228 | $2,018 | $9,045 | $3,060 | $2,970 | $203 | |
| Gross Surplus | $0 | $0 | $23,355 | $62,713 | $33,640 | $26,815 | $14,273 | $12,483 | $57,955 | $8,940 | $19,030 | $1,298 | |
| Gross Surplus % | 0.00% | 0.00% | 86.50% | 86.50% | 84.10% | 86.50% | 86.50% | 86.09% | 86.50% | 74.50% | 86.50% | 86.50% | |
| Expenses | |||||||||||||
| Payroll | $0 | $0 | $2,000 | $2,000 | $2,000 | $6,000 | $11,800 | $11,800 | $11,800 | $11,800 | $11,800 | $11,800 | |
| Account Name | $0 | $0 | $0 | $0 | $0 | $0 | $0 | $0 | $0 | $0 | $0 | $0 | |
| Depreciation | $383 | $383 | $383 | $383 | $383 | $383 | $383 | $383 | $383 | $383 | $383 | $383 | |
| Leased Building | $4,000 | $4,000 | $4,000 | $4,000 | $4,000 | $4,000 | $4,000 | $4,000 | $4,000 | $4,000 | $4,000 | $4,000 | |
| Utilities | $2,000 | $2,000 | $2,000 | $2,000 | $2,000 | $2,000 | $2,000 | $2,000 | $2,000 | $2,000 | $2,000 | $2,000 | |
| Insurance | $800 | $800 | $800 | $800 | $800 | $800 | $800 | $800 | $800 | $800 | $800 | $800 | |
| Payroll Taxes | 15% | $0 | $0 | $300 | $300 | $300 | $900 | $1,770 | $1,770 | $1,770 | $1,770 | $1,770 | $1,770 |
| Other | $0 | $0 | $0 | $0 | $0 | $0 | $0 | $0 | $0 | $0 | $0 | $0 | |
| Total Operating Expenses | $7,183 | $7,183 | $9,483 | $9,483 | $9,483 | $14,083 | $20,753 | $20,753 | $20,753 | $20,753 | $20,753 | $20,753 | |
| Surplus Before Interest and Taxes | ($7,183) | ($7,183) | $13,872 | $53,230 | $24,157 | $12,732 | ($6,481) | ($8,271) | $37,202 | ($11,813) | ($1,723) | ($19,456) | |
| EBITDA | ($6,800) | ($6,800) | $14,255 | $53,613 | $24,540 | $13,115 | ($6,098) | ($7,888) | $37,585 | ($11,430) | ($1,340) | ($19,073) | |
| Interest Expense | $0 | $0 | $0 | $0 | $0 | $0 | $0 | $0 | $0 | $0 | $0 | $0 | |
| Taxes Incurred | $0 | $0 | $0 | $0 | $0 | $0 | $0 | $0 | $0 | $0 | $0 | $0 | |
| Net Surplus | ($7,183) | ($7,183) | $13,872 | $53,230 | $24,157 | $12,732 | ($6,481) | ($8,271) | $37,202 | ($11,813) | ($1,723) | ($19,456) | |
| Net Surplus/Funding | 0.00% | 0.00% | 51.38% | 73.42% | 60.39% | 41.07% | -39.28% | -57.04% | 55.53% | -98.44% | -7.83% | -1297.03% | |
| Pro Forma Cash Flow | |||||||||||||
| Month 1 | Month 2 | Month 3 | Month 4 | Month 5 | Month 6 | Month 7 | Month 8 | Month 9 | Month 10 | Month 11 | Month 12 | ||
| Cash Received | |||||||||||||
| Cash from Operations | |||||||||||||
| Cash Funding | $0 | $0 | $27,000 | $72,500 | $40,000 | $31,000 | $16,500 | $14,500 | $67,000 | $12,000 | $22,000 | $1,500 | |
| Subtotal Cash from Operations | $0 | $0 | $27,000 | $72,500 | $40,000 | $31,000 | $16,500 | $14,500 | $67,000 | $12,000 | $22,000 | $1,500 | |
| Additional Cash Received | |||||||||||||
| Sales Tax, VAT, HST/GST Received | 0.00% | $0 | $0 | $0 | $0 | $0 | $0 | $0 | $0 | $0 | $0 | $0 | $0 |
| New Current Borrowing | $0 | $0 | $0 | $0 | $0 | $0 | $0 | $0 | $0 | $0 | $0 | $0 | |
| New Other Liabilities (interest-free) | $0 | $0 | $0 | $0 | $0 | $0 | $0 | $0 | $0 | $0 | $0 | $0 | |
| New Long-term Liabilities | $0 | $0 | $0 | $0 | $0 | $0 | $0 | $0 | $0 | $0 | $0 | $0 | |
| Sales of Other Current Assets | $0 | $0 | $0 | $0 | $0 | $0 | $0 | $0 | $0 | $0 | $0 | $0 | |
| Sales of Long-term Assets | $0 | $0 | $0 | $0 | $0 | $0 | $0 | $0 | $0 | $0 | $0 | $0 | |
| New Investment Received | $0 | $0 | $0 | $0 | $0 | $0 | $0 | $0 | $0 | $0 | $0 | $0 | |
| Subtotal Cash Received | $0 | $0 | $27,000 | $72,500 | $40,000 | $31,000 | $16,500 | $14,500 | $67,000 | $12,000 | $22,000 | $1,500 | |
| Expenditures | Month 1 | Month 2 | Month 3 | Month 4 | Month 5 | Month 6 | Month 7 | Month 8 | Month 9 | Month 10 | Month 11 | Month 12 | |
| Expenditures from Operations | |||||||||||||
| Cash Spending | $0 | $0 | $2,000 | $2,000 | $2,000 | $6,000 | $11,800 | $11,800 | $11,800 | $11,800 | $11,800 | $11,800 | |
| Bill Payments | $227 | $6,800 | $6,932 | $10,950 | $16,773 | $13,408 | $11,849 | $10,791 | $10,822 | $17,416 | $11,627 | $11,448 | |
| Subtotal Spent on Operations | $227 | $6,800 | $8,932 | $12,950 | $18,773 | $19,408 | $23,649 | $22,591 | $22,622 | $29,216 | $23,427 | $23,248 | |
| Additional Cash Spent | |||||||||||||
| Sales Tax, VAT, HST/GST Paid Out | $0 | $0 | $0 | $0 | $0 | $0 | $0 | $0 | $0 | $0 | $0 | $0 | |
| Principal Repayment of Current Borrowing | $0 | $0 | $0 | $0 | $0 | $0 | $0 | $0 | $0 | $0 | $0 | $0 | |
| Other Liabilities Principal Repayment | $0 | $0 | $0 | $0 | $0 | $0 | $0 | $0 | $0 | $0 | $0 | $0 | |
| Long-term Liabilities Principal Repayment | $0 | $0 | $0 | $0 | $0 | $0 | $0 | $0 | $0 | $0 | $0 | $0 | |
| Purchase Other Current Assets | $0 | $0 | $0 | $0 | $0 | $0 | $0 | $0 | $0 | $0 | $0 | $0 | |
| Purchase Long-term Assets | $0 | $0 | $0 | $0 | $0 | $0 | $0 | $0 | $0 | $0 | $0 | $0 | |
| Dividends | $0 | $0 | $0 | $0 | $0 | $0 | $0 | $0 | $0 | $0 | $0 | $0 | |
| Subtotal Cash Spent | $227 | $6,800 | $8,932 | $12,950 | $18,773 | $19,408 | $23,649 | $22,591 | $22,622 | $29,216 | $23,427 | $23,248 | |
| Net Cash Flow | ($227) | ($6,800) | $18,069 | $59,550 | $21,227 | $11,593 | ($7,149) | ($8,091) | $44,378 | ($17,216) | ($1,427) | ($21,748) | |
| Cash Balance | $17,773 | $10,973 | $29,042 | $88,592 | $109,819 | $121,411 | $114,263 | $106,172 | $150,550 | $133,335 | $131,908 | $110,160 | |
| Pro Forma Balance Sheet | |||||||||||||
| Month 1 | Month 2 | Month 3 | Month 4 | Month 5 | Month 6 | Month 7 | Month 8 | Month 9 | Month 10 | Month 11 | Month 12 | ||
| Assets | Starting Balances | ||||||||||||
| Current Assets | |||||||||||||
| Cash | $18,000 | $17,773 | $10,973 | $29,042 | $88,592 | $109,819 | $121,411 | $114,263 | $106,172 | $150,550 | $133,335 | $131,908 | $110,160 |
| Other Current Assets | $23,000 | $23,000 | $23,000 | $23,000 | $23,000 | $23,000 | $23,000 | $23,000 | $23,000 | $23,000 | $23,000 | $23,000 | $23,000 |
| Total Current Assets | $41,000 | $40,773 | $33,973 | $52,042 | $111,592 | $132,819 | $144,411 | $137,263 | $129,172 | $173,550 | $156,335 | $154,908 | $133,160 |
| Long-term Assets | |||||||||||||
| Long-term Assets | $0 | $0 | $0 | $0 | $0 | $0 | $0 | $0 | $0 | $0 | $0 | $0 | $0 |
| Accumulated Depreciation | $0 | $383 | $766 | $1,149 | $1,532 | $1,915 | $2,298 | $2,681 | $3,064 | $3,447 | $3,830 | $4,213 | $4,596 |
| Total Long-term Assets | $0 | ($383) | ($766) | ($1,149) | ($1,532) | ($1,915) | ($2,298) | ($2,681) | ($3,064) | ($3,447) | ($3,830) | ($4,213) | ($4,596) |
| Total Assets | $41,000 | $40,390 | $33,207 | $50,893 | $110,060 | $130,904 | $142,113 | $134,582 | $126,108 | $170,103 | $152,505 | $150,695 | $128,564 |
| Liabilities and Capital | Month 1 | Month 2 | Month 3 | Month 4 | Month 5 | Month 6 | Month 7 | Month 8 | Month 9 | Month 10 | Month 11 | Month 12 | |
| Current Liabilities | |||||||||||||
| Accounts Payable | $0 | $6,573 | $6,573 | $10,387 | $16,325 | $13,011 | $11,489 | $10,438 | $10,235 | $17,028 | $11,242 | $11,155 | $8,480 |
| Current Borrowing | $0 | $0 | $0 | $0 | $0 | $0 | $0 | $0 | $0 | $0 | $0 | $0 | $0 |
| Other Current Liabilities | $0 | $0 | $0 | $0 | $0 | $0 | $0 | $0 | $0 | $0 | $0 | $0 | $0 |
| Subtotal Current Liabilities | $0 | $6,573 | $6,573 | $10,387 | $16,325 | $13,011 | $11,489 | $10,438 | $10,235 | $17,028 | $11,242 | $11,155 | $8,480 |
| Long-term Liabilities | $0 | $0 | $0 | $0 | $0 | $0 | $0 | $0 | $0 | $0 | $0 | $0 | $0 |
| Total Liabilities | $0 | $6,573 | $6,573 | $10,387 | $16,325 | $13,011 | $11,489 | $10,438 | $10,235 | $17,028 | $11,242 | $11,155 | $8,480 |
| Paid-in Capital | $45,000 | $45,000 | $45,000 | $45,000 | $45,000 | $45,000 | $45,000 | $45,000 | $45,000 | $45,000 | $45,000 | $45,000 | $45,000 |
| Accumulated Surplus/Deficit | ($4,000) | ($4,000) | ($4,000) | ($4,000) | ($4,000) | ($4,000) | ($4,000) | ($4,000) | ($4,000) | ($4,000) | ($4,000) | ($4,000) | ($4,000) |
| Surplus/Deficit | $0 | ($7,183) | ($14,366) | ($494) | $52,736 | $76,893 | $89,625 | $83,144 | $74,874 | $112,076 | $100,263 | $98,540 | $79,084 |
| Total Capital | $41,000 | $33,817 | $26,634 | $40,506 | $93,736 | $117,893 | $130,625 | $124,144 | $115,874 | $153,076 | $141,263 | $139,540 | $120,084 |
| Total Liabilities and Capital | $41,000 | $40,390 | $33,207 | $50,893 | $110,060 | $130,904 | $142,113 | $134,582 | $126,108 | $170,103 | $152,505 | $150,695 | $128,564 |
| Net Worth | $41,000 | $33,817 | $26,634 | $40,506 | $93,736 | $117,892 | $130,624 | $124,144 | $115,873 | $153,076 | $141,263 | $139,540 | $120,084 |


