
Safe Current
Executive Summary
Safe Current is small business unit of The Cleveland Illuminating Company (TCIC), and electric utility. Safe Current was formed and will be lead by Brian Henderson.
Safe Current has identified three key factors that will be instrumental to its sustainability:
- Ensure 100% customer satisfaction: Repeat customers and customer referrals are valuable.
- Design and sell meaningful and valuable power protection products.
- Design and implement strict financial controls. This is very important because although Safe Current is a small business unit of TCIC, they must be a stand alone entity financially and and yet they have financial and accounting responsibilities to the shareholders of TCIC.
Products
Safe Current will offer two main products, surge arrestors and surge protectors. These products are made by a contract manufacturer and sold under the Safe Current brand name:
- Surge Arrestors: This is a piece of equipment that is mounted on the outside of a house or business near the meter that offers protection from external electrical surges.
- Surge Protectors: This is a piece of equipment that protects individual or groups of appliances against internal electrical spikes. All of Safe Currents protectors are of industrial grade.
Management
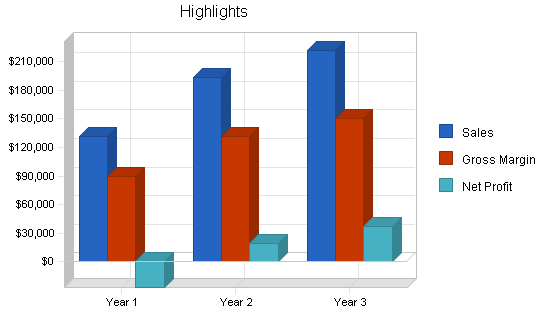
Brian has an MBA from Case Western Reserve University and has experience working for the large telecom ATT as an assistant project manager, and Allegheny Power working in the value added services department. Safe Current has been forecasted to achieve impressive sales for years two and three, with correspondingly respectable net profit.
1.1 Objectives
- To develop a profitable product for TCIC that is unregulated from the core power generation business services.
- To become profitable within one year.
- To use this business as a successful model for future ventures.
1.2 Mission
To develop a family of surge protectors and arrestors for consumers that offer safety and value. Safe Current will leverage the strength of The Cleveland Illuminating Company to help build brand recognition. All customer’s expectations will be exceeded with their innovative, useful products and complete customer satisfaction is guaranteed.
1.3 Keys to Success
- Offer every customer 100% satisfaction.
- Design and sell meaningful, valuable, power protection products.
- Design and employ strict financial controls.
Company Summary
Safe Current is an unregulated subsidiary of The Cleveland Illuminating Company that sells direct to businesses and consumers. It will be operated as a stand alone business leveraging the existing resources and goodwill of TCIC.
Safe Current will be located on site at TCIC, using an office within the complex and also sharing TCIC’s computer network connection and phone connections. Safe Current will operate their own customer service call department. Safe Current will use TCIC’s existing call center for sales calls and TCIC’s existing billing system as well as their order fulfillment and shipping departments. Safe Current will pay a flat rate (10%) for these services.
The Cleveland Illuminating Company has chosen to create Safe Current as a means of increasing the rate of return to shareholders outside the government regulated rates available to electric utilities.
2.1 Company Ownership
Safe Current is a wholly owned subsidiary of TCIC.
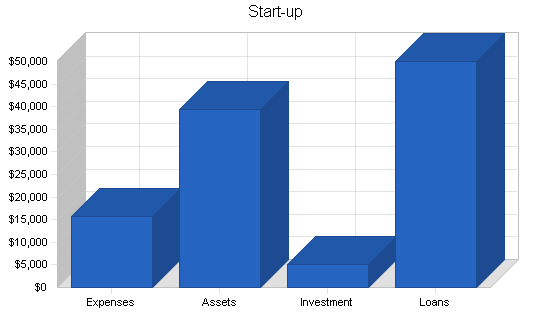
2.2 Start-up Summary
Safe Current will leverage the existing resources of TCIC and pay a set overhead fee for the resources used. Equipment that will be needed as follows:
- Five computer stations, one laser printer; Microsoft Office, Access, and proprietary software used by TCIC; network connection to TCIC.
- Five office furniture setups.
- A five extension phone system.
| Start-up Funding | |
| Start-up Expenses to Fund | $15,600 |
| Start-up Assets to Fund | $39,400 |
| Total Funding Required | $55,000 |
| Assets | |
| Non-cash Assets from Start-up | $17,500 |
| Cash Requirements from Start-up | $21,900 |
| Additional Cash Raised | $0 |
| Cash Balance on Starting Date | $21,900 |
| Total Assets | $39,400 |
| Liabilities and Capital | |
| Liabilities | |
| Current Borrowing | $0 |
| Long-term Liabilities | $50,000 |
| Accounts Payable (Outstanding Bills) | $0 |
| Other Current Liabilities (interest-free) | $0 |
| Total Liabilities | $50,000 |
| Capital | |
| Planned Investment | |
| TCIC | $5,000 |
| Other | $0 |
| Additional Investment Requirement | $0 |
| Total Planned Investment | $5,000 |
| Loss at Start-up (Start-up Expenses) | ($15,600) |
| Total Capital | ($10,600) |
| Total Capital and Liabilities | $39,400 |
| Total Funding | $55,000 |
| Start-up | |
| Requirements | |
| Start-up Expenses | |
| Stationery etc. | $100 |
| Brochures | $2,000 |
| Website development | $5,000 |
| Furniture | $1,500 |
| Expensed Equipment | $7,000 |
| Total Start-up Expenses | $15,600 |
| Start-up Assets | |
| Cash Required | $21,900 |
| Start-up Inventory | $0 |
| Other Current Assets | $3,000 |
| Long-term Assets | $14,500 |
| Total Assets | $39,400 |
| Total Requirements | $55,000 |
Market Analysis Summary
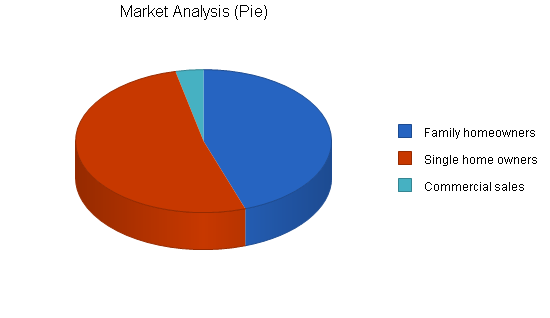
Safe Current has identified three distinct market segments that they will target. The first segment is family home owners, typically with children, and the second is single home owners.
These two segments have been chosen because families with children typically have a large number of electronic devices and the upper income single home owners often adopt technology using lots of gadgets in their home.
The third segment is commercial businesses that have equipment they want protected. Competition is very limited for surge arrestors as they require electric utility installation. There is some competition with the surge protectors, however the competitive products are of a consumer level of quality and protection, different from Safe Current’s products which offer industrial levels of protection.
3.1 Market Segmentation
Safe Current has segmented the market into three distinct groups.
Family home owners
This segment generally has electronic equipment and lives in middle- to high-end homes.
- 69% have at least one child.
- The median household income is $77,000.
- Eat out 2.3 times a week.
- 58% of the families have two incomes.
- 63% have cable TV.
- 49% have a broadband Internet connection.
Single home owners
This segment is a single person who owns their own home. They are generally professionals who often use a lot of electronic technology.
- Ages 25-40.
- 71% are professionals.
- The median household income is $62,000.
- Eat out 2.7 times a week.
- 72% have cable TV.
- 71% have a broadband Internet connection.
Commercial sales
This segment is small to mid-size businesses that have expensive electronic equipment that they need protected. Commercial sales are not industry specific. All businesses, regardless of type, have pieces of equipment that can be protected.
| Market Analysis | |||||||
| Year 1 | Year 2 | Year 3 | Year 4 | Year 5 | |||
| Potential Customers | Growth | CAGR | |||||
| Family homeowners | 8% | 143,545 | 154,311 | 165,884 | 178,325 | 191,699 | 7.50% |
| Single home owners | 8% | 165,987 | 179,266 | 193,607 | 209,096 | 225,824 | 8.00% |
| Commercial sales | 6% | 11,254 | 11,929 | 12,645 | 13,404 | 14,208 | 6.00% |
| Total | 7.71% | 320,786 | 345,506 | 372,136 | 400,825 | 431,731 | 7.71% |
3.2 Target Market Segment Strategy
Safe Current is targeting these groups since all tend to have many pieces of electronic equipment all of which are vulnerable to power surges.
While most home owners insurance offers some level of compensation for damage, deductibles are typically high enough that most people do not make claims. Both segments are already customers and aware of TCIC’s reputation for safety, reliability and operational excellence, making it easy to solicit their business.
3.3 Industry Analysis
Safe Current operates selling two similar service devices, surge arrestors and surge protectors. While these products are similar, they have serve different purposes.
The surge arrestors are a product that can only be offered by a utility so it is typically only sold and installed as a package by the utility.
The surge protectors operate within the more general consumer product segment as evidenced by the fact that surge protectors can be found by a wide range of retailers such as hardware stores, do-it-yourself type stores, and computer and electronic retailers.
It should be noted that Safe Current’s parent company, The Cleveland Illuminating Company is an electric utility and is therefore operating within a regulated industry. Current regulation by the public utility commission (PUC) dictates that the rate of return is capped at 10.5% for utility activities.
Safe Current however provides a product that operates within the unregulated area of the utility and therefore does not have rate of return caps. This is quite advantageous to Safe Current because it allows them to leverage the assets of the utility without being held to the same restrictions as the rest of the utility.

3.3.1 Competition and Buying Patterns
Surge arrestors
Safe Current does not face any real competition for the arrestors due to the installation requirement of the electric utility.
While there are four current vendors that sell the actual arrestor equipment, it is far more expensive to buy the equipment and then pay the utility for installation than buying the package (product and installation) directly from the utility.
Surge protectors
Safe Current faces general competition from several sources. This is qualified as general competition since the products typically sold (90% of the time) are of consumer quality versus the industrial quality that Safe Current offers.
Due to TCIC’s direct contacts with electrical component manufacturers and their sheer buying scale/power, Safe Current is able to offer high-quality industrial grade products for prices that are similar to the consumer units. Competitors in this segment include:
- Hardware stores
- Mass merchants
- Do-it-yourself stores
- Computer retailers
- Electronic retailers
3.4 Products
Safe Current will offer a family of surge arrestors and surge protectors for consumers. A surge protector protects appliances plugged into it against spikes in voltage.
A surge arrestor or “whole house surge protector” protects all circuits of a house from a surge in current emanating from outside the building. These products will protect consumers and their sensitive electric and electronic appliances from power surges or transient voltage.
A power surge is an increase in voltage significantly above the designated level of flow of electricity. If a surge or spike is high enough it will inflict serious damage, just like applying to much water pressure through a hose. Too much will case the hose to burst. The same thing happens when there is too much electrical pressure through a wire, the wire “bursts.”
Surge protectors work by diverting the extra electricity into the outlet’s grounding wire. A surge arrestor offers the same protection, however, the protection occurs before the current comes into the home. There are several sources of surges.
The most familiar source is lightning. When lightning strikes near a power line, the electrical energy creates a boost of electrical pressure. A surge arrestor is the best form of protection against lightning as a lightning surge will overpower most surge protectors.
A more common source is the operation of high power electrical devices such as refrigerators and air conditioning units. These appliances cause spikes when their compressors or motors are turned on and off, creating sudden, brief demands for power and upsetting the flow of the electrical voltage.
These types of surges can be protected only by surge protectors because the spike occurs within the home and not from the electrical grid.
The last main source of surges come from the utility company’s equipment. The complex system of equipment that brings electrical power from the grid into the home may have points of failure that can cause uneven power transmissions.
A combination of a surge arrestor and surge protectors on major or expensive electric/electronic components can significantly decrease the possibility of surge/spike damage.
Safe Current will offer two main products, surge arrestors and surge protectors. These products are made by a contract manufacturer and sold under the Safe Current brand name:
- Surge Arrestors (whole house surge arrestors): This is a piece of equipment that is mounted on the outside of a house or business near the meter that offers protection from surges eminating from outside of the house. This product costs $235 including installation.
Only the electrical utility can install a surge arrestor because the unit is connected directly to the outside meter and the electrical grid. A surge arrestor is the ONLY protection against spikes that come in through the outside electrical lines.
- Surge Protectors: This is a piece of equipment that protects individual or groups of appliances against internal sources of spikes. A protector offers a bit of protection against outside surges, however, most outside sources of spikes are of high enough voltage to overpower most protectors.
While most hardware stores, electronic stores, and mass merchants sell some sort of surge protector, the products offered by Safe Current are differentiated by their industrial grade offer and, a far higher level of protection than most other surge protectors. These units are $50 each and offer the best protection when used in conjunction with a surge arrestor. Any type of electric or electronic appliance of value should be protected such as furnaces, refrigerators, stoves, TVs, stereos, computers, modems, phones, etc.
Safe Current has chosen to outsource production because 1) it has numerous relationships with contract manufacturers that can make the products for far less than they can, 2) production would create significant capital costs which are truly unnecessary. The beauty of this business model is the usage of contract manufacturers and the leveraging of TCIC resources.
Strategy and Implementation Summary
Safe Current has developed a targeted strategy that allows them to leverage their competitive edge and quickly gain market penetration. Safe Current’s competitive edge is its ability to use The Cleveland Illuminating Company’s utility status for the sale of house surge arrestors and protectors.
The marketing strategy will concentrate on the ability to offer supreme, inexpensive protection for an entire family’s stable of electric and electronic appliances. This campaign will be communicated through various methods and will focus on the product offerings coming from the safe, established TCIC, an icon of Cleveland for over 50 years. Please review the following sections for a more detailed analysis.
4.1 Competitive Edge
Safe Current’s competitive edge is their ability to leverage the huge advantage of being aligned with The Cleveland Illuminating Company, an electric utility serving the Cleveland market for over 50 years. TCIC has spent a long time developing brand equity and Safe Current will be able to tap into this equity immediately.
Safe Current will also be able to use TCIC’s extensive vendor connections and buying power. The last component of their competitive edge is Safe Current’s exclusive ability to install house arrestors. This last edge is a sustainable edge since no other company will ever be able to make arrestor installations, a function of the regulated power industry.
4.2 Marketing Strategy
Safe Current’s marketing strategy will seek to communicate the idea that the products that they offer are in effect cheap insurance against large electric and electronic appliance damage or losses.
By proactively purchasing Safe Current’s products, customers are able to protect against loss and damage of all of their expensive appliances. While many homeowners probably have some sort of insurance, deductibles are often prohibitively high, making a claim for damage to one or a couple appliances not worth the money. Safe Current will use several forms of communication for this marketing campaign:
- Inserts in Bills: Colorful inserts will be added into the bills of TCIC customers. Currently, the customers are receiving a monthly bill from TCIC and inserts are an inexpensive, yet powerful way of reaching the customers.
- Website: Safe Current will have a website which will be comprehensive in describing the different product offerings as well as allowing the customer to order directly from the site.
- Direct Mail: Another advantage of the relationship Safe Current has with TCIC is the ability to use their customer database. This allows Safe Current to generate a targeted list of customers that they can send product information to.
4.3 Sales Strategy
Safe Current’s sales campaign will emphasize the fact that Safe Current is a subsidiary of TCIC. This will be effective because TCIC is a well known, stable electric utility known for its safe and reliable operation.
This idea is evidenced by the fact that almost every time that a consumer reaches for a light switch the light goes on. Sure there are interruptions, often weather related, that interrupt the electrical service, but those interruptions are reconnected quite fast.
The utility is stable and safe and is always working to serve the customer. These electricity related products will clearly leverage the brand equity developed by TCIC over the last five decades.
4.3.1 Sales Forecast
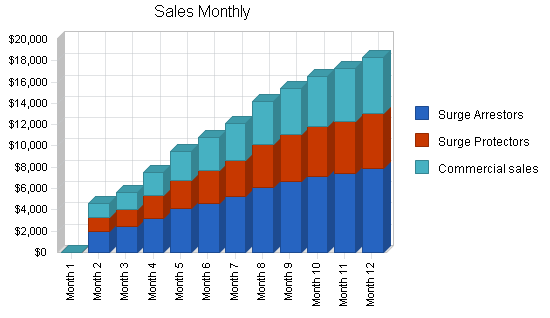
The sales forecast has been developed as a forecast and tracking tool to provide the company with realistic sales goals as well as a way to verify progress. The forecast has been developed as a conservative estimate, not an aggressive sales promise.
By adopting a conservative forecast, Safe Current increases the likelihood of reaching sustainable sales growth. The following table and charts provide more detailed information about the sales cycle, both from a temporal viewpoint and a product perspective.

| Sales Forecast | |||
| Year 1 | Year 2 | Year 3 | |
| Sales | |||
| Surge Arrestors | $56,841 | $83,434 | $95,454 |
| Surge Protectors | $37,515 | $55,066 | $63,000 |
| Commercial sales | $37,515 | $55,066 | $63,000 |
| Total Sales | $131,871 | $193,567 | $221,453 |
| Direct Cost of Sales | Year 1 | Year 2 | Year 3 |
| Surge Arrestors | $15,915 | $23,362 | $26,727 |
| Surge Protectors | $14,256 | $20,925 | $23,940 |
| Commercial sales | $12,380 | $18,172 | $20,790 |
| Subtotal Direct Cost of Sales | $42,551 | $62,459 | $71,457 |
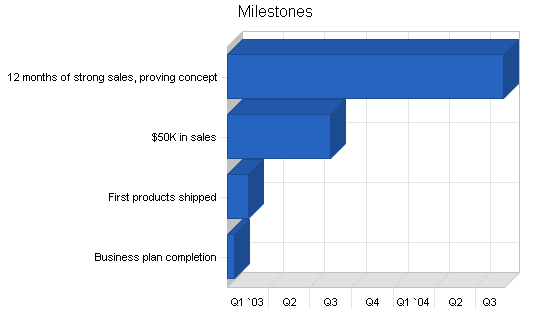
4.4 Milestones
Safe Current has identified several quantifiable, reachable milestones that will serve as goals that the entire organization will work toward in order to make Safe Current a sustainable business.
The following table details the specific milestones as well provides a temporal timetable for expected completion dates. Following the table is a chart for a graphical representation of the information.
| Milestones | |||||
| Milestone | Start Date | End Date | Budget | Manager | Department |
| Business plan completion | 1/1/2003 | 1/15/2003 | $0 | Brian | Startegic development |
| First products shipped | 1/1/2003 | 2/15/2003 | $0 | Brian | Operations |
| $50K in sales | 1/1/2003 | 8/15/2003 | $0 | Brian | Sales |
| 12 months of strong sales, proving concept | 1/1/2003 | 8/30/2004 | $0 | Brian | Operations |
| Totals | $0 | ||||
Web Plan Summary
Safe Current’s website will be used as both a marketing and sales tool. It will take on marketing responsibilities as one of the communication methods used to raise awareness regarding Safe Current’s product families. Extensive product information will be included on the site in an easy to use format.
The site will also be used as a sales tool, allowing customers to purchase the products as well as set up installation appointments for the surge arrestors. Allowing the website to offer sales support will provide consumers with a convenient way to purchase the products as well as provide Safe Current with a low-cost sales program that does not require a live sales support agent. The site will periodically be updated to encourage customers to make repeat visits.
5.1 Website Marketing Strategy
Safe Current will market their website in two primary ways:
- Search engine submission: As search engines become more and more powerful, a large number of Internet users use them to find relevant information on the Internet. Safe Current will submit their site to many popular engines ensuring that their site comes up high on the list of hits.
- URL reference in all printer material: The Web address, www.safecurrent.com, will be printed on all material that Safe Current uses encouraging consumers to check out the site.
5.2 Development Requirements
The website will be developed by TCIC’s internal Web development team for the price of $5,000.
Management Summary
Brian Henderson received a Bachelors of Science in business and marketing from the University of Pittsburgh and an MBA from Case Western Reserve University. Upon graduation from the MBA program, Brian went to work for ATT for three years. At ATT Brian was an assistant project manager, selling telephone accessories using direct marketing techniques. After his ATT experience, Brian worked for Allegheny Power, a Pennsylvania-based electric utility. At Allegheny Power Brian was again an assistant project manager in charge of selling commercial businesses value added services. Brian spent three years at Allegheny before joining The Cleveland Illuminating Company as a Project Manager.
6.1 Personnel Plan
As a side business unit of TCIC, Safe Current will have only a few employees. Billing, sales, and order fulfillment will be accomplished using TCIC’s existing organization, paying a 10% fee for these services. The employees/positions that Safe Current will use include:
- Project Manager: Brian will take on a wide range of functions including business development, product procurement, management, and sales.
- Customer Service Agents (4): These positions will assist customers calling about Safe Current’s products. Additionally, at times the employees may help Brian with other activities.
| Personnel Plan | |||
| Year 1 | Year 2 | Year 3 | |
| Project Manager | $50,400 | $51,000 | $53,000 |
| Customer service agent | $9,400 | $10,800 | $10,800 |
| Customer service agent | $9,400 | $10,800 | $900 |
| Customer service agent | $9,000 | $900 | $900 |
| Customer service agent | $7,200 | $900 | $900 |
| Total People | 5 | 5 | 5 |
| Total Payroll | $85,400 | $74,400 | $66,500 |
Financial Plan
The following sections outline important financial information.
7.1 Important Assumptions
The following table details important financial assumptions.
| General Assumptions | |||
| Year 1 | Year 2 | Year 3 | |
| Plan Month | 1 | 2 | 3 |
| Current Interest Rate | 10.00% | 10.00% | 10.00% |
| Long-term Interest Rate | 10.00% | 10.00% | 10.00% |
| Tax Rate | 30.00% | 30.00% | 30.00% |
| Other | 0 | 0 | 0 |
7.2 Break-even Analysis
The Break-even Analysis indicates what will be needed in monthly revenue to reach the break even point.

| Break-even Analysis | |
| Monthly Revenue Break-even | $13,732 |
| Assumptions: | |
| Average Percent Variable Cost | 32% |
| Estimated Monthly Fixed Cost | $9,301 |
7.3 Projected Cash Flow
The following chart and table displays projected cash flow.

| Pro Forma Cash Flow | |||
| Year 1 | Year 2 | Year 3 | |
| Cash Received | |||
| Cash from Operations | |||
| Cash Sales | $131,871 | $193,567 | $221,453 |
| Subtotal Cash from Operations | $131,871 | $193,567 | $221,453 |
| Additional Cash Received | |||
| Sales Tax, VAT, HST/GST Received | $0 | $0 | $0 |
| New Current Borrowing | $0 | $0 | $0 |
| New Other Liabilities (interest-free) | $0 | $0 | $0 |
| New Long-term Liabilities | $0 | $0 | $0 |
| Sales of Other Current Assets | $0 | $0 | $0 |
| Sales of Long-term Assets | $0 | $0 | $0 |
| New Investment Received | $15,000 | $0 | $0 |
| Subtotal Cash Received | $146,871 | $193,567 | $221,453 |
| Expenditures | Year 1 | Year 2 | Year 3 |
| Expenditures from Operations | |||
| Cash Spending | $85,400 | $74,400 | $66,500 |
| Bill Payments | $69,962 | $101,544 | $116,462 |
| Subtotal Spent on Operations | $155,362 | $175,944 | $182,962 |
| Additional Cash Spent | |||
| Sales Tax, VAT, HST/GST Paid Out | $0 | $0 | $0 |
| Principal Repayment of Current Borrowing | $0 | $0 | $0 |
| Other Liabilities Principal Repayment | $0 | $0 | $0 |
| Long-term Liabilities Principal Repayment | $7,200 | $7,813 | $7,878 |
| Purchase Other Current Assets | $0 | $0 | $0 |
| Purchase Long-term Assets | $0 | $0 | $0 |
| Dividends | $0 | $0 | $0 |
| Subtotal Cash Spent | $162,562 | $183,757 | $190,840 |
| Net Cash Flow | ($15,691) | $9,810 | $30,614 |
| Cash Balance | $6,209 | $16,019 | $46,633 |
7.4 Projected Profit and Loss
The following table presents projected profit and loss.


| Pro Forma Profit and Loss | |||
| Year 1 | Year 2 | Year 3 | |
| Sales | $131,871 | $193,567 | $221,453 |
| Direct Cost of Sales | $42,551 | $62,459 | $71,457 |
| Other Costs of Goods | $0 | $0 | $0 |
| Total Cost of Sales | $42,551 | $62,459 | $71,457 |
| Gross Margin | $89,320 | $131,108 | $149,996 |
| Gross Margin % | 67.73% | 67.73% | 67.73% |
| Expenses | |||
| Payroll | $85,400 | $74,400 | $66,500 |
| Sales and Marketing and Other Expenses | $6,000 | $8,000 | $10,000 |
| Depreciation | $1,404 | $1,404 | $1,404 |
| Rent | $6,000 | $6,000 | $6,000 |
| Utilities | $0 | $0 | $0 |
| Insurance | $0 | $0 | $0 |
| Payroll Taxes | $12,810 | $9,675 | $9,975 |
| Other | $0 | $0 | $0 |
| Total Operating Expenses | $111,614 | $99,479 | $93,879 |
| Profit Before Interest and Taxes | ($22,294) | $31,629 | $56,117 |
| EBITDA | ($20,890) | $33,033 | $57,521 |
| Interest Expense | $4,610 | $3,889 | $3,105 |
| Taxes Incurred | $0 | $8,322 | $15,904 |
| Net Profit | ($26,904) | $19,418 | $37,109 |
| Net Profit/Sales | -20.40% | 10.03% | 16.76% |
7.5 Business Ratios
The following business ratios detail both ratios specific to Safe Current as well as ratios specific to the general industry. Variances in Safe Current’s ratios relative to the industry’s can be explained by the fact that Safe Current is able to leverage the valuable assets of TCIC, an electric utility, to achieve above market margins. As a small business unit of an electrical utility it is normal for business ratios to be different from the competition.
| Ratio Analysis | ||||
| Year 1 | Year 2 | Year 3 | Industry Profile | |
| Sales Growth | 0.00% | 46.78% | 14.41% | 8.79% |
| Percent of Total Assets | ||||
| Inventory | 22.53% | 23.67% | 15.38% | 17.86% |
| Other Current Assets | 10.42% | 7.46% | 4.24% | 43.53% |
| Total Current Assets | 54.52% | 70.94% | 85.47% | 77.93% |
| Long-term Assets | 45.48% | 29.06% | 14.53% | 22.07% |
| Total Assets | 100.00% | 100.00% | 100.00% | 100.00% |
| Current Liabilities | 29.51% | 20.71% | 13.67% | 31.98% |
| Long-term Liabilities | 148.65% | 86.96% | 38.28% | 20.70% |
| Total Liabilities | 178.16% | 107.67% | 51.96% | 52.68% |
| Net Worth | -78.16% | -7.67% | 48.04% | 47.32% |
| Percent of Sales | ||||
| Sales | 100.00% | 100.00% | 100.00% | 100.00% |
| Gross Margin | 67.73% | 67.73% | 67.73% | 20.85% |
| Selling, General & Administrative Expenses | 88.10% | 54.09% | 50.95% | 6.60% |
| Advertising Expenses | 0.00% | 0.00% | 0.00% | 0.49% |
| Profit Before Interest and Taxes | -16.91% | 16.34% | 25.34% | 1.44% |
| Main Ratios | ||||
| Current | 1.85 | 3.43 | 6.25 | 1.96 |
| Quick | 1.08 | 2.28 | 5.13 | 1.15 |
| Total Debt to Total Assets | 178.16% | 107.67% | 51.96% | 57.62% |
| Pre-tax Return on Net Worth | 119.55% | -898.84% | 155.82% | 3.71% |
| Pre-tax Return on Assets | -93.44% | 68.95% | 74.86% | 8.76% |
| Additional Ratios | Year 1 | Year 2 | Year 3 | |
| Net Profit Margin | -20.40% | 10.03% | 16.76% | n.a |
| Return on Equity | 0.00% | 0.00% | 109.07% | n.a |
| Activity Ratios | ||||
| Inventory Turnover | 10.91 | 7.80 | 7.00 | n.a |
| Accounts Payable Turnover | 9.23 | 12.17 | 12.17 | n.a |
| Payment Days | 27 | 30 | 28 | n.a |
| Total Asset Turnover | 4.58 | 4.81 | 3.13 | n.a |
| Debt Ratios | ||||
| Debt to Net Worth | 0.00 | 0.00 | 1.08 | n.a |
| Current Liab. to Liab. | 0.17 | 0.19 | 0.26 | n.a |
| Liquidity Ratios | ||||
| Net Working Capital | $7,200 | $20,209 | $50,844 | n.a |
| Interest Coverage | -4.84 | 8.13 | 18.07 | n.a |
| Additional Ratios | ||||
| Assets to Sales | 0.22 | 0.21 | 0.32 | n.a |
| Current Debt/Total Assets | 30% | 21% | 14% | n.a |
| Acid Test | 1.08 | 2.28 | 5.13 | n.a |
| Sales/Net Worth | 0.00 | 0.00 | 6.51 | n.a |
| Dividend Payout | 0.00 | 0.00 | 0.00 | n.a |
7.6 Projected Balance Sheet
The following table details the projected balance sheet.
| Pro Forma Balance Sheet | |||
| Year 1 | Year 2 | Year 3 | |
| Assets | |||
| Current Assets | |||
| Cash | $6,209 | $16,019 | $46,633 |
| Inventory | $6,487 | $9,522 | $10,894 |
| Other Current Assets | $3,000 | $3,000 | $3,000 |
| Total Current Assets | $15,697 | $28,542 | $60,527 |
| Long-term Assets | |||
| Long-term Assets | $14,500 | $14,500 | $14,500 |
| Accumulated Depreciation | $1,404 | $2,808 | $4,212 |
| Total Long-term Assets | $13,096 | $11,692 | $10,288 |
| Total Assets | $28,793 | $40,234 | $70,815 |
| Liabilities and Capital | Year 1 | Year 2 | Year 3 |
| Current Liabilities | |||
| Accounts Payable | $8,497 | $8,333 | $9,683 |
| Current Borrowing | $0 | $0 | $0 |
| Other Current Liabilities | $0 | $0 | $0 |
| Subtotal Current Liabilities | $8,497 | $8,333 | $9,683 |
| Long-term Liabilities | $42,800 | $34,987 | $27,109 |
| Total Liabilities | $51,297 | $43,320 | $36,793 |
| Paid-in Capital | $20,000 | $20,000 | $20,000 |
| Retained Earnings | ($15,600) | ($42,504) | ($23,086) |
| Earnings | ($26,904) | $19,418 | $37,109 |
| Total Capital | ($22,504) | ($3,086) | $34,023 |
| Total Liabilities and Capital | $28,793 | $40,234 | $70,815 |
| Net Worth | ($22,504) | ($3,086) | $34,023 |
Appendix
| Sales Forecast | |||||||||||||
| Month 1 | Month 2 | Month 3 | Month 4 | Month 5 | Month 6 | Month 7 | Month 8 | Month 9 | Month 10 | Month 11 | Month 12 | ||
| Sales | |||||||||||||
| Surge Arrestors | 0% | $0 | $2,000 | $2,435 | $3,232 | $4,090 | $4,645 | $5,232 | $6,121 | $6,653 | $7,121 | $7,434 | $7,878 |
| Surge Protectors | 0% | $0 | $1,320 | $1,607 | $2,133 | $2,699 | $3,066 | $3,453 | $4,040 | $4,391 | $4,700 | $4,906 | $5,199 |
| Commercial sales | 0% | $0 | $1,320 | $1,607 | $2,133 | $2,699 | $3,066 | $3,453 | $4,040 | $4,391 | $4,700 | $4,906 | $5,199 |
| Total Sales | $0 | $4,640 | $5,649 | $7,498 | $9,489 | $10,776 | $12,138 | $14,201 | $15,435 | $16,521 | $17,247 | $18,277 | |
| Direct Cost of Sales | Month 1 | Month 2 | Month 3 | Month 4 | Month 5 | Month 6 | Month 7 | Month 8 | Month 9 | Month 10 | Month 11 | Month 12 | |
| Surge Arrestors | $0 | $560 | $682 | $905 | $1,145 | $1,301 | $1,465 | $1,714 | $1,863 | $1,994 | $2,082 | $2,206 | |
| Surge Protectors | $0 | $502 | $611 | $811 | $1,026 | $1,165 | $1,312 | $1,535 | $1,669 | $1,786 | $1,864 | $1,976 | |
| Commercial sales | $0 | $436 | $530 | $704 | $891 | $1,012 | $1,140 | $1,333 | $1,449 | $1,551 | $1,619 | $1,716 | |
| Subtotal Direct Cost of Sales | $0 | $1,497 | $1,823 | $2,419 | $3,062 | $3,477 | $3,917 | $4,582 | $4,980 | $5,331 | $5,565 | $5,897 | |
| Personnel Plan | |||||||||||||
| Month 1 | Month 2 | Month 3 | Month 4 | Month 5 | Month 6 | Month 7 | Month 8 | Month 9 | Month 10 | Month 11 | Month 12 | ||
| Project Manager | 0% | $4,200 | $4,200 | $4,200 | $4,200 | $4,200 | $4,200 | $4,200 | $4,200 | $4,200 | $4,200 | $4,200 | $4,200 |
| Customer service agent | 0% | $0 | $400 | $900 | $900 | $900 | $900 | $900 | $900 | $900 | $900 | $900 | $900 |
| Customer service agent | 0% | $0 | $400 | $900 | $900 | $900 | $900 | $900 | $900 | $900 | $900 | $900 | $900 |
| Customer service agent | 0% | $0 | $0 | $900 | $900 | $900 | $900 | $900 | $900 | $900 | $900 | $900 | $900 |
| Customer service agent | 0% | $0 | $0 | $0 | $0 | $900 | $900 | $900 | $900 | $900 | $900 | $900 | $900 |
| Total People | 1 | 3 | 4 | 4 | 5 | 5 | 5 | 5 | 5 | 5 | 5 | 5 | |
| Total Payroll | $4,200 | $5,000 | $6,900 | $6,900 | $7,800 | $7,800 | $7,800 | $7,800 | $7,800 | $7,800 | $7,800 | $7,800 | |
| General Assumptions | |||||||||||||
| Month 1 | Month 2 | Month 3 | Month 4 | Month 5 | Month 6 | Month 7 | Month 8 | Month 9 | Month 10 | Month 11 | Month 12 | ||
| Plan Month | 1 | 2 | 3 | 4 | 5 | 6 | 7 | 8 | 9 | 10 | 11 | 12 | |
| Current Interest Rate | 10.00% | 10.00% | 10.00% | 10.00% | 10.00% | 10.00% | 10.00% | 10.00% | 10.00% | 10.00% | 10.00% | 10.00% | |
| Long-term Interest Rate | 10.00% | 10.00% | 10.00% | 10.00% | 10.00% | 10.00% | 10.00% | 10.00% | 10.00% | 10.00% | 10.00% | 10.00% | |
| Tax Rate | 30.00% | 30.00% | 30.00% | 30.00% | 30.00% | 30.00% | 30.00% | 30.00% | 30.00% | 30.00% | 30.00% | 30.00% | |
| Other | 0 | 0 | 0 | 0 | 0 | 0 | 0 | 0 | 0 | 0 | 0 | 0 | |
| Pro Forma Profit and Loss | |||||||||||||
| Month 1 | Month 2 | Month 3 | Month 4 | Month 5 | Month 6 | Month 7 | Month 8 | Month 9 | Month 10 | Month 11 | Month 12 | ||
| Sales | $0 | $4,640 | $5,649 | $7,498 | $9,489 | $10,776 | $12,138 | $14,201 | $15,435 | $16,521 | $17,247 | $18,277 | |
| Direct Cost of Sales | $0 | $1,497 | $1,823 | $2,419 | $3,062 | $3,477 | $3,917 | $4,582 | $4,980 | $5,331 | $5,565 | $5,897 | |
| Other Costs of Goods | $0 | $0 | $0 | $0 | $0 | $0 | $0 | $0 | $0 | $0 | $0 | $0 | |
| Total Cost of Sales | $0 | $1,497 | $1,823 | $2,419 | $3,062 | $3,477 | $3,917 | $4,582 | $4,980 | $5,331 | $5,565 | $5,897 | |
| Gross Margin | $0 | $3,143 | $3,826 | $5,079 | $6,427 | $7,299 | $8,222 | $9,619 | $10,455 | $11,190 | $11,682 | $12,379 | |
| Gross Margin % | 0.00% | 67.73% | 67.73% | 67.73% | 67.73% | 67.73% | 67.73% | 67.73% | 67.73% | 67.73% | 67.73% | 67.73% | |
| Expenses | |||||||||||||
| Payroll | $4,200 | $5,000 | $6,900 | $6,900 | $7,800 | $7,800 | $7,800 | $7,800 | $7,800 | $7,800 | $7,800 | $7,800 | |
| Sales and Marketing and Other Expenses | $500 | $500 | $500 | $500 | $500 | $500 | $500 | $500 | $500 | $500 | $500 | $500 | |
| Depreciation | $117 | $117 | $117 | $117 | $117 | $117 | $117 | $117 | $117 | $117 | $117 | $117 | |
| Rent | $500 | $500 | $500 | $500 | $500 | $500 | $500 | $500 | $500 | $500 | $500 | $500 | |
| Utilities | $0 | $0 | $0 | $0 | $0 | $0 | $0 | $0 | $0 | $0 | $0 | $0 | |
| Insurance | $0 | $0 | $0 | $0 | $0 | $0 | $0 | $0 | $0 | $0 | $0 | $0 | |
| Payroll Taxes | 15% | $630 | $750 | $1,035 | $1,035 | $1,170 | $1,170 | $1,170 | $1,170 | $1,170 | $1,170 | $1,170 | $1,170 |
| Other | $0 | $0 | $0 | $0 | $0 | $0 | $0 | $0 | $0 | $0 | $0 | $0 | |
| Total Operating Expenses | $5,947 | $6,867 | $9,052 | $9,052 | $10,087 | $10,087 | $10,087 | $10,087 | $10,087 | $10,087 | $10,087 | $10,087 | |
| Profit Before Interest and Taxes | ($5,947) | ($3,724) | ($5,226) | ($3,973) | ($3,660) | ($2,788) | ($1,865) | ($468) | $368 | $1,103 | $1,595 | $2,292 | |
| EBITDA | ($5,830) | ($3,607) | ($5,109) | ($3,856) | ($3,543) | ($2,671) | ($1,748) | ($351) | $485 | $1,220 | $1,712 | $2,409 | |
| Interest Expense | $412 | $407 | $402 | $397 | $392 | $387 | $382 | $377 | $372 | $367 | $362 | $357 | |
| Taxes Incurred | $0 | $0 | $0 | $0 | $0 | $0 | $0 | $0 | $0 | $0 | $0 | $0 | |
| Net Profit | ($6,359) | ($4,131) | ($5,627) | ($4,370) | ($4,052) | ($3,175) | ($2,247) | ($845) | ($4) | $736 | $1,233 | $1,936 | |
| Net Profit/Sales | 0.00% | -89.03% | -99.61% | -58.28% | -42.70% | -29.46% | -18.51% | -5.95% | -0.03% | 4.46% | 7.15% | 10.59% | |
| Pro Forma Cash Flow | |||||||||||||
| Month 1 | Month 2 | Month 3 | Month 4 | Month 5 | Month 6 | Month 7 | Month 8 | Month 9 | Month 10 | Month 11 | Month 12 | ||
| Cash Received | |||||||||||||
| Cash from Operations | |||||||||||||
| Cash Sales | $0 | $4,640 | $5,649 | $7,498 | $9,489 | $10,776 | $12,138 | $14,201 | $15,435 | $16,521 | $17,247 | $18,277 | |
| Subtotal Cash from Operations | $0 | $4,640 | $5,649 | $7,498 | $9,489 | $10,776 | $12,138 | $14,201 | $15,435 | $16,521 | $17,247 | $18,277 | |
| Additional Cash Received | |||||||||||||
| Sales Tax, VAT, HST/GST Received | 0.00% | $0 | $0 | $0 | $0 | $0 | $0 | $0 | $0 | $0 | $0 | $0 | $0 |
| New Current Borrowing | $0 | $0 | $0 | $0 | $0 | $0 | $0 | $0 | $0 | $0 | $0 | $0 | |
| New Other Liabilities (interest-free) | $0 | $0 | $0 | $0 | $0 | $0 | $0 | $0 | $0 | $0 | $0 | $0 | |
| New Long-term Liabilities | $0 | $0 | $0 | $0 | $0 | $0 | $0 | $0 | $0 | $0 | $0 | $0 | |
| Sales of Other Current Assets | $0 | $0 | $0 | $0 | $0 | $0 | $0 | $0 | $0 | $0 | $0 | $0 | |
| Sales of Long-term Assets | $0 | $0 | $0 | $0 | $0 | $0 | $0 | $0 | $0 | $0 | $0 | $0 | |
| New Investment Received | $0 | $0 | $0 | $15,000 | $0 | $0 | $0 | $0 | $0 | $0 | $0 | $0 | |
| Subtotal Cash Received | $0 | $4,640 | $5,649 | $22,498 | $9,489 | $10,776 | $12,138 | $14,201 | $15,435 | $16,521 | $17,247 | $18,277 | |
| Expenditures | Month 1 | Month 2 | Month 3 | Month 4 | Month 5 | Month 6 | Month 7 | Month 8 | Month 9 | Month 10 | Month 11 | Month 12 | |
| Expenditures from Operations | |||||||||||||
| Cash Spending | $4,200 | $5,000 | $6,900 | $6,900 | $7,800 | $7,800 | $7,800 | $7,800 | $7,800 | $7,800 | $7,800 | $7,800 | |
| Bill Payments | $68 | $2,150 | $5,278 | $4,647 | $5,535 | $6,335 | $6,506 | $6,982 | $7,864 | $7,970 | $8,256 | $8,369 | |
| Subtotal Spent on Operations | $4,268 | $7,150 | $12,178 | $11,547 | $13,335 | $14,135 | $14,306 | $14,782 | $15,664 | $15,770 | $16,056 | $16,169 | |
| Additional Cash Spent | |||||||||||||
| Sales Tax, VAT, HST/GST Paid Out | $0 | $0 | $0 | $0 | $0 | $0 | $0 | $0 | $0 | $0 | $0 | $0 | |
| Principal Repayment of Current Borrowing | $0 | $0 | $0 | $0 | $0 | $0 | $0 | $0 | $0 | $0 | $0 | $0 | |
| Other Liabilities Principal Repayment | $0 | $0 | $0 | $0 | $0 | $0 | $0 | $0 | $0 | $0 | $0 | $0 | |
| Long-term Liabilities Principal Repayment | $600 | $600 | $600 | $600 | $600 | $600 | $600 | $600 | $600 | $600 | $600 | $600 | |
| Purchase Other Current Assets | $0 | $0 | $0 | $0 | $0 | $0 | $0 | $0 | $0 | $0 | $0 | $0 | |
| Purchase Long-term Assets | $0 | $0 | $0 | $0 | $0 | $0 | $0 | $0 | $0 | $0 | $0 | $0 | |
| Dividends | $0 | $0 | $0 | $0 | $0 | $0 | $0 | $0 | $0 | $0 | $0 | $0 | |
| Subtotal Cash Spent | $4,868 | $7,750 | $12,778 | $12,147 | $13,935 | $14,735 | $14,906 | $15,382 | $16,264 | $16,370 | $16,656 | $16,769 | |
| Net Cash Flow | ($4,868) | ($3,110) | ($7,129) | $10,351 | ($4,446) | ($3,959) | ($2,768) | ($1,181) | ($829) | $151 | $591 | $1,508 | |
| Cash Balance | $17,032 | $13,922 | $6,793 | $17,144 | $12,698 | $8,739 | $5,971 | $4,789 | $3,960 | $4,111 | $4,702 | $6,209 | |
| Pro Forma Balance Sheet | |||||||||||||
| Month 1 | Month 2 | Month 3 | Month 4 | Month 5 | Month 6 | Month 7 | Month 8 | Month 9 | Month 10 | Month 11 | Month 12 | ||
| Assets | Starting Balances | ||||||||||||
| Current Assets | |||||||||||||
| Cash | $21,900 | $17,032 | $13,922 | $6,793 | $17,144 | $12,698 | $8,739 | $5,971 | $4,789 | $3,960 | $4,111 | $4,702 | $6,209 |
| Inventory | $0 | $0 | $1,647 | $2,005 | $2,661 | $3,368 | $3,825 | $4,308 | $5,040 | $5,478 | $5,864 | $6,122 | $6,487 |
| Other Current Assets | $3,000 | $3,000 | $3,000 | $3,000 | $3,000 | $3,000 | $3,000 | $3,000 | $3,000 | $3,000 | $3,000 | $3,000 | $3,000 |
| Total Current Assets | $24,900 | $20,032 | $18,569 | $11,798 | $22,805 | $19,066 | $15,564 | $13,279 | $12,830 | $12,439 | $12,975 | $13,823 | $15,697 |
| Long-term Assets | |||||||||||||
| Long-term Assets | $14,500 | $14,500 | $14,500 | $14,500 | $14,500 | $14,500 | $14,500 | $14,500 | $14,500 | $14,500 | $14,500 | $14,500 | $14,500 |
| Accumulated Depreciation | $0 | $117 | $234 | $351 | $468 | $585 | $702 | $819 | $936 | $1,053 | $1,170 | $1,287 | $1,404 |
| Total Long-term Assets | $14,500 | $14,383 | $14,266 | $14,149 | $14,032 | $13,915 | $13,798 | $13,681 | $13,564 | $13,447 | $13,330 | $13,213 | $13,096 |
| Total Assets | $39,400 | $34,415 | $32,835 | $25,947 | $36,837 | $32,981 | $29,362 | $26,960 | $26,394 | $25,886 | $26,305 | $27,036 | $28,793 |
| Liabilities and Capital | Month 1 | Month 2 | Month 3 | Month 4 | Month 5 | Month 6 | Month 7 | Month 8 | Month 9 | Month 10 | Month 11 | Month 12 | |
| Current Liabilities | |||||||||||||
| Accounts Payable | $0 | $1,974 | $5,124 | $4,464 | $5,324 | $6,119 | $6,275 | $6,720 | $7,599 | $7,695 | $7,978 | $8,076 | $8,497 |
| Current Borrowing | $0 | $0 | $0 | $0 | $0 | $0 | $0 | $0 | $0 | $0 | $0 | $0 | $0 |
| Other Current Liabilities | $0 | $0 | $0 | $0 | $0 | $0 | $0 | $0 | $0 | $0 | $0 | $0 | $0 |
| Subtotal Current Liabilities | $0 | $1,974 | $5,124 | $4,464 | $5,324 | $6,119 | $6,275 | $6,720 | $7,599 | $7,695 | $7,978 | $8,076 | $8,497 |
| Long-term Liabilities | $50,000 | $49,400 | $48,800 | $48,200 | $47,600 | $47,000 | $46,400 | $45,800 | $45,200 | $44,600 | $44,000 | $43,400 | $42,800 |
| Total Liabilities | $50,000 | $51,374 | $53,924 | $52,664 | $52,924 | $53,119 | $52,675 | $52,520 | $52,799 | $52,295 | $51,978 | $51,476 | $51,297 |
| Paid-in Capital | $5,000 | $5,000 | $5,000 | $5,000 | $20,000 | $20,000 | $20,000 | $20,000 | $20,000 | $20,000 | $20,000 | $20,000 | $20,000 |
| Retained Earnings | ($15,600) | ($15,600) | ($15,600) | ($15,600) | ($15,600) | ($15,600) | ($15,600) | ($15,600) | ($15,600) | ($15,600) | ($15,600) | ($15,600) | ($15,600) |
| Earnings | $0 | ($6,359) | ($10,490) | ($16,117) | ($20,487) | ($24,538) | ($27,713) | ($29,960) | ($30,805) | ($30,809) | ($30,073) | ($28,840) | ($26,904) |
| Total Capital | ($10,600) | ($16,959) | ($21,090) | ($26,717) | ($16,087) | ($20,138) | ($23,313) | ($25,560) | ($26,405) | ($26,409) | ($25,673) | ($24,440) | ($22,504) |
| Total Liabilities and Capital | $39,400 | $34,415 | $32,835 | $25,947 | $36,837 | $32,981 | $29,362 | $26,960 | $26,394 | $25,886 | $26,305 | $27,036 | $28,793 |
| Net Worth | ($10,600) | ($16,959) | ($21,090) | ($26,717) | ($16,087) | ($20,138) | ($23,313) | ($25,560) | ($26,405) | ($26,409) | ($25,673) | ($24,440) | ($22,504) |


