
Third Degree I.D.
Executive Summary
Third Degree I.D. is a limited-liability company (LLC) with three founding partners, located in Savannah, Georgia. The company designs, develops, and markets instructional products and services for the corporate, education, government, and healthcare e-learning industries. It is committed to high quality instructional design and educational new media development, and provides a core deliverable of programs, courses, and learning objects for the distance education, distributed learning, and e-learning markets.
The company employs an object-oriented design methodology that yields flexible, scalable, and reusable content, supporting clients with rich, targeted solutions that are easily replicated and maintained. It seeks a balanced portfolio of clients from a variety of industry sectors, and plans to mitigate business fluctuations with an appropriate number of local, national, and international clients.
Third Degree I.D. develops strategic relationships and builds its business on a returning customer base and an accumulation of educational content that can be re-purposed and re-sold.
The three founding partners of Third Degree I.D. will each invest $35,000 into the company, and are seeking an additional two-year loan of $30,000 to complete the start-up funding. Roughly $19,000 of this initial funding is required for start-up expenses and assets; the remainder will provide a cash basis for the initial year of operations, during which Third Degree I.D. will provide some at-cost work to influential clients to create a solid reputation for our work and capabilities; this reputation forms the necessary basis for marketing and sales strategies after the first year.
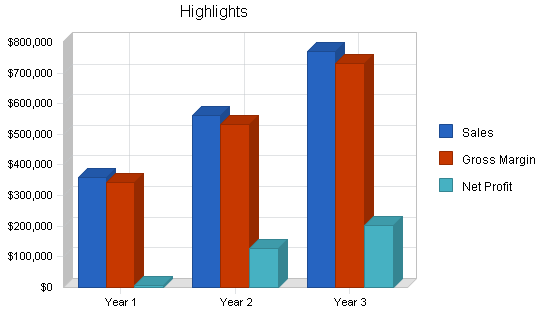
Our market research shows our sales goal of $360,000 in the first year is conservative, for a start-up educational software company with our combined expertise. Growth estimates in years 2 and 3 are based on data from comparable businesses in the same industry.
1.1 Objectives
Key objectives for Third Degree I.D. in the first year are as follows:
- Establish a legal business through appropriate licensing.
- Complete business planning and pursue funding–via venture capital, bank loans, grants, and contracts.
- Establish a web presence and list products and services in industry-relevant websites and publications.
- Contract with six to eight clients requiring consulting, training, design or development work of an appropriate scope ($50,000 or more).
1.2 Mission
Third Degree I.D. designs, develops, and markets instructional products and services for the corporate, education, government, and healthcare e-learning industries. It affords companies and institutions cost-effective, progressive, flexible and well supported solutions to their instructional design and e-learning operational needs. Its principal goal is client satisfaction, serving client interests as an ally and loyal business partner. The company operates on a for-profit basis and provides an engaging and equitable work environment for its owners, employees, and contractors.
1.3 Keys to Success
Success will be dependent upon:
- persistent and creative client development efforts
- exceptional product and service quality
- time-efficient and cost-effective development processes
- expert management and knowledgeable staff
- cash-savvy growth strategies
Company Summary
Third Degree I.D. is located in Savannah, Georgia. It sells instructional design products and services to the corporate, education, government and healthcare e-learning markets. The company is committed to high quality instructional design and educational new media development. It sells program/curriculum design and development, course design and development, program/curriculum and course evaluation, content analyses and revision, rich-media production, e-learning training, e-learning consulting, and additional services, such as market research, editing, document workflow, and translation. Third Degree I.D. employs an object-oriented design methodology that yields flexible, scalable, and reusable content. This approach provides clients with rich, targeted solutions that are easily replicated and maintained.
2.1 Start-up Summary
To begin the business, we require $5,924 in start-up expenses, and another $13,000 in non-cash assets. Details of these requirements can be found below.
Expenses
Legal Expenses
- Attorney Consultation — $300
- Initial Filing Fee for LLC — $400
- Name and Logo Trademark — $300
Website Expenses
- Website Domain (2 Years) — $14
- Website Hosting (1 Year) — $96
Communications
- Stationery/Letterhead + Envelopes (500 set) — $500
- Business Cards (500 x 3) — $300
Memberships and Subscriptions
- Coastal Beta — $75
- eLearning Guild — $95
- Faculty Finder.com — $745
Software
- Authoring and Multimedia Software for Sony Vaio — $1,000
- Authoring and Multimedia Software for Mac Powerbook — $1,000
- Authoring and Multimedia Software for SH Desktop — $300
Long-term Assets
Computer Hardware
-
DS Laptop (Sony Vaio) — $2,500
-
MH Laptop (Mac 15″ Powerbook — $2,500
-
SH Desktop + Laser Printer + Scanner — $2,000
-
Networked Content Server — $6,000
Start-up Investment
Each of the the founding partners will make an equal investment of $35,000 in starting the business. In addition, the partners intend to secure a 2-year commercial loan in the amount of $30,000 to cover the working capital requirements for the initial period of operations.
All startup expenses and funding requirements are summarized in the tables below.

| Start-up | |
| Requirements | |
| Start-up Expenses | |
| Legal | $1,000 |
| Annual State Fees | $300 |
| Insurance | $200 |
| Website domain and hosting | $109 |
| Stationary/ Business Cards | $800 |
| Office Supplies | $100 |
| Wireless Home Network (Airport) | $200 |
| Memberships/Subscriptions | $915 |
| Software | $2,300 |
| Total Start-up Expenses | $5,924 |
| Start-up Assets | |
| Cash Required | $116,076 |
| Other Current Assets | $0 |
| Long-term Assets | $13,000 |
| Total Assets | $129,076 |
| Total Requirements | $135,000 |
| Start-up Funding | |
| Start-up Expenses to Fund | $5,924 |
| Start-up Assets to Fund | $129,076 |
| Total Funding Required | $135,000 |
| Assets | |
| Non-cash Assets from Start-up | $13,000 |
| Cash Requirements from Start-up | $116,076 |
| Additional Cash Raised | $0 |
| Cash Balance on Starting Date | $116,076 |
| Total Assets | $129,076 |
| Liabilities and Capital | |
| Liabilities | |
| Current Borrowing | $30,000 |
| Long-term Liabilities | $0 |
| Accounts Payable (Outstanding Bills) | $0 |
| Other Current Liabilities (interest-free) | $0 |
| Total Liabilities | $30,000 |
| Capital | |
| Planned Investment | |
| S.Hines | $35,000 |
| M. Meyer | $35,000 |
| D. Stanford | $35,000 |
| Additional Investment Requirement | $0 |
| Total Planned Investment | $105,000 |
| Loss at Start-up (Start-up Expenses) | ($5,924) |
| Total Capital | $99,076 |
| Total Capital and Liabilities | $129,076 |
| Total Funding | $135,000 |
2.2 Company Ownership
Third Degree I.D. is structured as a limited-liability company (LLC), consisting of three executive partners: Susan Hines, Mona Meyer, and Daniel Stanford, who will function in the roles of chief executive officer (CEO), chief learning officer (CLO), and chief creative officer (CCO).
Services
Third Degree I.D. focuses on the following deliverables: program/curriculum design and development, course design and development, program/curriculum and course evaluation, content analyses and revision, rich-media production, e-learning training, e-learning consulting, and additional services, such as market research, editing, document workflow, and translation. For purposes of billing, project management, and client relations, these services are broken down as follows:
- Program/Curriculum Design & Development
- New Program Services
- Existing Program Services
- Course Design and Development
- Learning Object Development
- Training
- Consulting
- Other Services
3.1 Program Design & Development
Third Degree I.D. provides development services for clients in accordance with educational best practices and client specifications. It employs a systematic design and development process that produces instructionally sound, engaging programs/curricula that are aligned with institutional goals and exceed applicable accreditation and/or compliance standards.
3.1.1 New Program Services
New program services are available to clients who do not yet possess an e-learning infrastructure or who do not yet possess robust programming that would adequately leverage the infrastructure.
Needs Analysis Report
The needs analysis report is the end result of a client-partnered consulting and research effort. The report articulates technology, workforce, and policy/procedure needs for e-learning programs in the general context of any institutional and/or accreditation and/or compliance constraints. Clients are charged according to the scope of the project, which is generally tied to the length and/or number of programs/curricula to be developed. For example, a needs analysis report for an e-learning certificate or academic “minor” (or group of related courses of no more than six) would conclude with a base charge of $3600.
| Programs/Curricula Types |
Estimated Development Cost |
Base Charge |
| 3-to 6-Course Series (Training Program, Certificate or Undergraduate Minor) |
32 hours x $75/hour = $2400 |
$3600 |
|
7- to 12-Course Series (Professional Certificate, Masters Degree) 
|
40 hours x $75/hour = $3000 |
$4500 |
|
13- to 16-Course Series (PhD/Terminals, Other Professional Degrees) |
48 hours x $75/hour = $3600 |
$5400 |
|
17- to 20-Course Series (Corporate College, Undergraduate Major or Academic “Core”) |
56 hours x $75/hour = $4200 |
$6300 |
Clients developing multiple curricula receive a 50% discount on the base charge of the lesser fee. For example, an institution or company developing an MA and an undergraduate minor would be charged the full fee for the MA plus half of the fee charged for the undergraduate minor ($4500 + $1800 = $6300).
Funding Assistance
Funding assistance is a deliverable provided to institutions or companies that wish to raise funds externally in order to underwrite or mitigate their e-learning start-up and operation expenses. Assistance would include research, reporting, grant and business proposal efforts. The charge for initial consulting is $75 per hour, with subsequent research, reporting, grant and business proposal efforts charged at $50 per hour. Clients may indicate a “not to exceed” clause in all funding-assistance efforts.
Program/Curriculum Prospectus
The program/curriculum prospectus is the end result of a client-partnered consulting and research effort. The prospectus outlines the objectives and viability of a given program/curriculum and critiques any development dependencies or any potential implementation constraints; it also includes a market study and a program/curriculum evaluation plan.
| Programs/Curricula Types |
Estimated Development Cost |
Base Charge |
| 3-to 6-Course Series (Training Program, Certificate or Undergraduate Minor) | 24 hours x $50/hour = $1,200 |
$1,800 |
| 7- to 12-Course Series (Professional Certificate, Masters Degree) | 32 hours x $50/hour = $1,600 |
$2,400 |
| 13- to 16-Course Series (PhD/Terminals, Other Professional Degrees) | 40 hours x $50/hour = $2,000 |
$3,000 |
| 17- to 20-Course Series (Corporate College, Undergraduate Major or Academic “Core”) | 48 hours x $50/hour = $2,400 |
$3,600 |
Clients who purchase a needs analysis report are given a 20% discount on each program/curriculum prospectus.
Program/Curriculum Development Plan
The program/curriculum development plan is the end result of a client-partnered consulting and research effort. The development plan is a report that articulates the program/curriculum specifications according to institutional needs. The document includes a full articulation of curriculum design, including course-series or individual course “look and feel” and functionality requirements. It characterizes the significant development/delivery features of the courses and identifies any course developers, subject matter experts (SMEs), or consultants associated with the individual course projects. The development plan includes a time horizon for the overall program/curriculum with timelines for individual courses and delineated fees associated with project development and management.*
| Programs/Curricula Types |
Estimated Development Cost |
Base Charge |
| 3-to 6-Course Series (Training Program, Certificate or Undergraduate Minor) |
8 hours x $50/hour = $400 |
$600 |
| 7- to 12-Course Series (Professional Certificate, Masters Degree) |
12 hours x $50/hour = $600 |
$900 |
| 13- to 16-Course Series (PhD/Terminals, Other Professional Degrees) |
16 hours x $50/hour = $800 |
$1,200 |
| 17- to 20-Course Series (Corporate College, Undergraduate Major or Academic “Core”) |
20 hours x $50/hour = $1,000 |
$1,500 |
Clients who purchase a curriculum prospectus report are given a 20% discount on each corresponding program/curriculum plan.
*Clients are charged a monthly project management fee of 5% on the overall curriculum design and development charge for the duration of the project development period. A project development period runs from the date of the program/curriculum development plan implementation to the date of program/curriculum development plan completion.
Program/Curriculum Implementation Strategy
The program/curriculum implementation strategy is the end result of a client-partnered consulting and research effort. It is a report that recommends ways to optimize program/curriculum support and to leverage the program/curriculum in order to maximize learning and revenues. The report recommends enrollment goals, scheduling, instructor recruitment, content-reuse, and technical support strategies.
| Programs/Curricula Types |
Estimated Development Cost |
Base Charge |
| 3-to 6-Course Series (Training Program, Certificate or Undergraduate Minor) |
10 hours x $50/hour = $500 |
$750 |
| 7- to 12-Course Series (Professional Certificate, Masters Degree) |
15 hours x $50/hour = $750 |
$1,125 |
| 13- to 16-Course Series (PhD/Terminals, Other Professional Degrees) |
20 hours x $50/hour = $1,000 |
$1,500 |
| 17- to 20-Course Series (Corporate College, Undergraduate Major or Academic “Core”) |
25 hours x $50/hour = $1,250 |
$1,875 |
Clients who purchase a program/curriculum development plan are given a 20% discount on each corresponding program/curriculum implementation strategy report.
Program/Curriculum Evaluation Plan
The curriculum evaluation plan is the end result of a client-partnered consulting and research effort. It is a report that articulates qualitative and quantitative strategies which satisfy accreditation and/or compliance standards and assist institutions and companies in procuring feedback that informs and improves upon their curricula. The evaluation plan includes survey collection instruments for curriculum-level and course-level analysis.
| Programs/Curricula Types |
Estimated Development Cost |
Base Charge |
| 3-to 6-Course Series (Training Program, Certificate or Undergraduate Minor) |
16 hours x $50/hour = $800 |
$1,200 |
| 7- to 12-Course Series (Professional Certificate, Masters Degree) |
20 hours x $50/hour = $1,000 |
$1,500 |
| 13- to 16-Course Series (PhD/Terminals, Other Professional Degrees) |
24 hours x $50/hour = $1,200 |
$1,800 |
| 17- to 20-Course Series (Corporate College, Undergraduate Major or Academic “Core”) |
28 hours x $50/hour = $1,400 |
$2,100 |
Clients who purchase a curriculum prospectus report are given a 20% discount on each corresponding program/curriculum evaluation plan.
3.1.2 Existing Program Services
Existing program services are available to clients who possess an e-learning infrastructure and deliver programs/curricula, but who wish to enhance or improve upon their offerings. Clients with existing programs may select from the New Program Services, if they wish to add new programs to their offerings.
Program/Curriculum Evaluation Report
The program/curriculum evaluation report includes a top-level analysis of a given program/curriculum relevant to institutional or company goals and relative to comparable institutional and company programs/curricula. It includes a systematic analysis of each course within the program/curriculum and provides recommendations for revision of content, structure, and delivery. Recommendations are informed by educational best practices and any institutional, accreditation and/or compliance standards.
| Programs/Curricula Types |
Estimated Development Cost |
Base Charge |
| 1 Course (Stand-Alone) |
6 hours x $50/hour = $300 |
$450 |
|
3-to 6-Course Series (Training Program, Certificate or Undergraduate Minor) |
36 hours x $50 = $1,800 |
$2,700 |
|
7- to 12-Course Series (Professional Certificate, Masters Degree) |
72 hours x $50/hour = $3,600 |
$5,400 |
|
13- to 16-Course Series (PhD/Terminals, Other Professional Degrees) |
96 hours x $50/hour = $4,800 |
$7,200 |
| 17- to 20-Course Series (Corporate College, Undergraduate Major or Academic “Core”) |
120 hours x $50/hour = $6,000 |
$9,000 |
Program/Curriculum Strategy Report
The program/curriculum strategy report is the end result of a client-partnered consulting and research effort. It is a report that analyzes the institution or company’s current implementation and operations strategy and recommends ways to optimize program/curriculum support and to leverage the program/curriculum in order to maximize learning and revenues. The report recommends enrollment goals, scheduling, instructor recruitment, content-reuse, and technical support strategies.
| Programs/Curricula Types |
Estimated Development Cost |
Base Charge |
|
3-to 6-Course Series (Training Program, Certificate or Undergraduate Minor) |
10 hours x $50/hour = $500 |
$750 |
|
7- to 12-Course Series (Professional Certificate, Masters Degree) |
15 hours x $50/hour = $750 |
$1,125 |
|
13- to 16-Course Series (PhD/Terminals, Other Professional Degrees) |
20 hours x $50/hour = $1,000 |
$1,500 |
| 17- to 20-Course Series (Corporate College, Undergraduate Major or Academic “Core”) |
25 hours x $50/hour = $1,250 |
$1,875 |
Clients who purchase a curriculum evaluation report are given a 20% discount on each corresponding program/curriculum strategy report.
Program/Curriculum Maintenance (on Retainer)
Program/Curriculum Maintenance provides institutions or companies with “basic maintenance” of courses and learning objects in a given e-learning program or curriculum. “Basic maintenance” is a support package that serves clients who require minor course or course-shell changes on a regular basis. Clients who develop courses that feature time-sensitive information and are instructor-led may be better served by regular maintenance to course features that change, such as schedules, calendars, tests, and evaluations. Maintenance is charged on a monthly basis at 5 percent of the overall program/curricula charge.
3.2 Course Design and Development
Third Degree I.D. provides course- or project-development services for clients in accordance with established curriculum plans. The company employs a systematic instructional design process that produces instructionally sound, engaging course work, systematically aligned with program goals and learning outcomes and designed to exceed institutional accreditation standards.
Course-design cost estimates are based upon the following assumptions:
- A course or training project contains one or more units of instruction.
- A “unit” consists of approximately 8 pages of content and represents 3-5 hours of instruction.
- A “page” of content covers a single topic and represents information that would be presented to a learner “at once” (e.g. between clicks of a “Next” button).
- A “page” of content contains from 150-1500 words (as dictated by lesson flow and audience requirements).
- A typical unit contains approximately:
- 16 content-related photos or illustrations (an average of 2 per page)
- 1 collaborative discussion assignment
- 2 hands-on or research-focused “homework” assignments, and
- 1 standard assessment (e.g. 20-question multiple choice, true/false, or matching quiz).
Note: A unit may also contain one or more interactive learning objects, which are priced separately under topic 3.3, below.
Development Options
Type A: Courses are developed “from scratch.” Third Degree I.D. is responsible for providing subject-matter expertise, researching relevant content, and developing courses with limited support from the client partner. This is the most expensive development option.
Type B: Courses are developed with the aid of a dedicated subject-matter expert employed by the client for the scope of the project (e.g. a faculty member for higher-ed institutions, or a seasoned field professional for corporate clients).
Type C: The client partner provides raw content in an existing medium (e.g. textbooks, articles, PowerPoint slides, training manuals, etc.) Third Degree I.D. develops courses that re-purpose and/or supplement the existing content.
Type D: The client partner provides both existing content in an alternate medium and a dedicated subject-matter expert. Third Degree I.D. works with the dedicated subject-matter expert over the course of the project to produce courses that re-purpose or supplement the raw content.
Delivery Options
Type 1: Content is designed for delivery by nonprofit institutions under the rules of the TEACH Act. This is the least restrictive option in terms of copyright and, therefore, requires limited investment in new media development and permissions acquisition.
Type 2: Content is designed for delivery by nonprofit institutions and education clients under the “Fair Use” guidelines for copyrighted works. Fair Use strictly limits the amount of copyrighted content that can be used within the context of an online course. Therefore, courses developed for this standard require additional investment in new media development and permissions acquisition.
Type 3: Content is developed for commercial delivery. This is the most restrictive option and requires that all course content (including media) be developed from scratch or obtained via purchase or agreement with the copyright holder.
Cost Estimates
| Course/Program Type |
Estimated Development Cost per Unit |
Base Charge* |
| A1 |
8 pages x 2.5 hour/pg. x $50/hour = $1,000 |
$1,500 |
| A2 |
Cost (A1) + 20% (media/permissions) = $1,200 |
$1,800 |
| A3 |
Cost (A1) + 40% (media/permissions) = $1,400 |
$2,100 |
| B1 |
8 pages x 2 hour/pg. x $50/hour = $800 |
$1,200 |
| B2 |
Cost (B1) + 20% (media/permissions) = $960 |
$1,440 |
| B3 |
Cost (B1) + 40% (media/permissions) = $1,120 |
$1,680 |
| C1 |
8 pages x 1.5 hour/pg. x $50/hour = $600 |
$900 |
| C2 |
Cost (C1) + 20% (media/permissions) = $720 |
$1,080 |
| C3 |
Cost (C1) + 40% (media/permissions) = $840 |
$1,260 |
| D1 |
8 pages x 1 hour/pg. x $50/hour = $400 |
$600 |
| D2 |
Cost (D1) + 20% (media/permissions) = $480 |
$720 |
| D3 |
Cost (D1) + 40% (media/permissions) = $560 |
$840 |
*Note: A typical course for a higher-ed client is 10 to 12 units in length (representing 30-50 hours of instruction). Multiply the unit price by 10 or 12 to calculate average course cost.
Additional Development Services and Pricing
Third Degree I.D. also offers the following additional services related to course/program development:
| Service |
Estimated Development Cost |
Base Charge |
| Course Template Design |
20 hours x $50/hour = $1,000 |
$1,500 per program |
| Content (Peer) Review |
10 hours x $25/hour = $250 |
$375 per course |
| Instructional Design Review |
8 hours x $50/hour = $400 |
$600 per course |
| Retrofit for ADA Compliance |
20 hours x $50/hour = $1,000 |
$1,500 per course |
| Quality Assurance Testing |
8 hours x $40/hour = $400 |
$600 per course |
|
Assessment Development |
3 hours x $50/hour = $150 |
$225 per assessment |
| Image Editing (per 25) |
5 hours x $40/hour = $200 |
$300 per 25 images |
| Audio Editing (per 7 clips*) |
10 hours x $50/hour = $500 |
$750 per 7 clips |
| Video Editing (per 7 clips**) |
10 hours x $70/hour = $700 |
$1,050 per 7 clips |
*1 audio “clip” = 60 seconds of digital audio
**1 video “clip” = 30 seconds of digital video
3.3 Learning Object Development
Third Degree I.D. designs and develops rich-media learning objects, designed to motivate learners, to increase course interactivity, to provide novel and interesting views of course content, to simulate real-world scenarios, and to provide stimulating alternatives to drill-and-practice instruction. Learning objects are typically authored in Macromedia Flash and range in complexity from single-screen interactions with no evaluation to rich, simulated environments that respond to a variety of user inputs.
Object Types
Level 1: Level 1 objects are typically single-screen environments that respond to user actions but do not evaluate responses. Examples include:
- X-Ray Machine: A custom cursor reveals a hidden layer as the user rolls his mouse over an image. Imagine, in an anatomy course, being able to peer “inside” a simple, illustrated diagram of the human body, revealing the skeletal system, the circulatory system, etc.
- Overlay Engine: Users can toggle various image “layers” on and off, similar to the way transparency overlays can be used with an over head projector. Imagine a map with highways, lakes, and gas station markers that could be hidden and revealed as needed.
- Simple Image Gallery: Users cycle through images with corresponding text. Imagine a menu with five buttons, each displaying a single work of art, the title of the piece, the artist’s name, and the date it was created.
Level 2: These objects are typically 1-2 screen engines, with evaluation and feedback, and are typically used as assessment vehicles. Examples include:
- Media-Rich Quiz: For instance, a multiple-choice or fill-in-the-blank quiz with optional areas for displaying diagrams, photographs, or hints.
- Hint/Password Game: The user tries to guess the topic or item that is described by a growing list of clues.
Level 3: Level 3 objects are media-rich resources that are designed to display a variety of media in a unique format. They may combine text, illustrations, photographs, charts and graphs, audio/video clips, and web links to create rich, educational experiences. Examples include:
- Timelines: Imagine an interactive timeline designed to illustrate key points in the development of personal computing. For instance, one event on the timeline could provide photos of the early Apple II computers and later Macintosh models, text describing the growth of Apple as a major hardware manufacturer, sound-bytes from industry professionals, and a link to the Apple website.
- Image Magnifier: Imagine a display engine that allows users to interactively select and view magnified portions of a small image (e.g. a painting or other work of art). The engine could handle multiple images (with a page-turning metaphor), and a text area could provide a description of each work with links to museums featuring work by the same artist.
- Interactive Dictionary/Glossary: Imagine key words or terms hyperlinked from within a course. When a term is clicked, the glossary would open, displaying a basic text definition, supplemented by audio clips, animated diagrams, or illustrations.
Level 4: These are typically complex adaptive learning tools that modify content presentation, based upon user response. Examples include:
- Adaptive Assessments/Tutorials: Content presentation is adjusted based upon user responses. Imagine a quiz that supplies a more difficult question each time a user responds correctly or easier questions when the user responds incorrectly.
- Adaptive Simulations: These are typically games or simulations that replicate real-world problems. Imagine a game designed to test a learner’s understanding of the urban planning process. For example, users might control the rate and quality of road construction, public parks, and commercial/residential zoning. By choosing to spend a significant portion of her budget on parks and residential development, a user may receive feedback that traffic congestion and unemployment have driven potential buyers out of the city.
It is important to note that the descriptions above do not attempt to describe the entire universe of potential learning object development. The examples provided with the level descriptions are intended to help Third Degree I.D. and the client effectively gauge the complexity of proposed objects and price/budget accordingly.
Cost Estimates—Engine Development
| Object Type |
Est. I.D. Hours |
Est. Development Hours |
Estimated Development Cost |
Base Charge |
| Level 1 |
5 |
15 |
20 hours x $50/hour = $1,000 |
$1,500 |
| Level 2 |
5 |
35 |
40 hours x $50/hour = $2,000 |
$3,000 |
| Level 3 |
15 |
120 |
135 hours x $50/hour = $6,750 |
$10,125 |
| Level 4 |
25 |
160 |
185 hours x $50/hour = $9,250 |
$13,875 |
Cost Estimates—Engine “Population” and Media Editing
| Level |
Image Content |
Audio Content |
Video Content |
Base Charge |
| A |
< 25 images: |
< 7 clips: |
< 7 clips: |
Images: $300 Audio: $750 Video: $1050 |
| B |
25-49 images: |
7-14 clips: |
7-14 clips: |
Images: $600 Audio: $1125 Video: $1575 |
| C |
50-74 images: |
15-19 clips: |
15-19 clips: |
Images: $900 Audio: $1500 Video: $2100 |
| D |
75+ images: |
20+ clips: |
20+ clips: |
Images: $15/image Audio: $75/clip Video: $105/clip |
3.4 Training
Third Degree I.D. provides a number of training options for clients who wish to expand their e-learning skills and knowledge. Training sessions can benefit instructors, support staff and administrators.
| Training Title | Description |
Base Charge |
| Course Development Training | 16-hours of classroom training (maximum 10 participants) |
$3600 |
| ePedagogy Training | 4-hours of classroom training (maximum 10 participants) |
$900 |
| CMS/LMS Training | 8-hours of classroom training (maximum 10 participants) |
$1800 |
| Course Maintenance Training | 8-hours of classroom training (maximum 10 participants) |
$1800 |
| Compliance Training (for TEACH Act, Fair Use, and ADA) | 4-hours of classroom training (maximum 10 participants) |
$900 |
| Course Writing and Instructional Design Training | 8-hours of classroom training (maximum 10 participants) |
$1800 |
| Media Techniques Training | 4-hours of classroom training (maximum 10 participants) |
$900 |
| Learning Objects Maintenance Training | 4-hours of classroom training (maximum 10 participants) |
$900 |
3.5 Consulting and Other
Third Degree I.D. charges a flat fee of $75 per hour for consulting, and specializes in a variety of areas, including:
- e-learning strategic planning
- accreditation substantive change documentation
- learning-objects database planning
- content-reuse planning
- “best practices” consulting
- open-source e-learning assets consulting
Third Degree I.D. charges a flat fee of $60 per hour for work that may stem from consulting, such as:
- Research
- Editing
- Copy editing
- Translation
- Illustration
- Writing
Market Analysis Summary
Third Degree I.D. is competing for e-learning instructional design business in the corporate, educational, healthcare and government sectors. Its emphasis will be on corporate and educational markets, as these sectors are likely to experience the greatest growth.
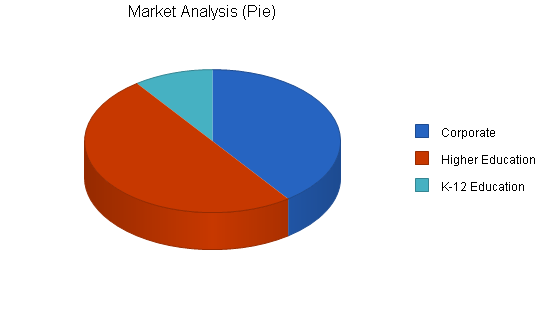
Third Degree I.D. projects it will do $360,000 worth of business in Year 1, which represents a development objective of at least three 7- to 12-course series (i.e. a professional certificate or masters degree). Of the $360,000, the partnership estimates that 50% will come from higher-ed clients, 40% from corporate clients, and 10% from K-12 clients.
According to the Booz Allen Hamilton white paper, Re-Learning E-Learning,[1] the compound annual growth rate for the three sectors is: higher ed = 25%, corporate=30%, and K-12=30%. These assumptions were used to estimate new-development revenue for each of the three sectors.
In addition, the partnership anticipates generating revenue through reuse and relicensure at a rate of 25% of cumulative revenue, from year to year.
——————————————————————————–
[1] Lee, Reggie with Sumita Bhattacharya, Tina Nelson, and Martin Kihn. “Re-Learning e-Learning” (Booz Allen Hamilton, 2002) <http://extfile.bah.com/livelink/livelink/108290/?func=doc.Fetch&nodeid=108290>.
4.1 Market Segmentation
The e-learning market continues to expand. According to ThinkEquity Partners and Eduventures, the global training and education market is a $2 trillion industry, with the United States accounting for 37.5% of the market.[1] The greatest demand for e-learning in the U.S. comes from the corporate sector, which according to Brandon-Hall realizes a “30 to 60 percent” savings over traditional classroom instruction.[2] Thus, businesses and corporations have invested—and continue to invest—in infrastructure that will require a steady supply of content.
Higher education and K-12 are substantial markets, as well—a combined industry representing over 100 billion dollars.[3] With the largest class of high school students in U.S. history graduating in 2009 and a brick-and-mortar system that cannot expand quickly enough to accommodate them, e-learning is becoming a necessity for institutions as much as it is becoming an expectation among students who are increasingly computer savvy.[4] Colleges and universities are also turning to e-learning as a way to increase their reach—to offer branded educational opportunities to students outside of their traditional geographical boundaries.
While the move to e-learning in the healthcare and government sectors remains slower than in the corporate and educational sectors, these industries are showing a strong interest nevertheless. According to Jones Knowledge, Inc. and CourseShare.com, the healthcare industry shows an 80% interest (with a 30% commitment) level while government shows 50% interest (with 39% commitment).[5]
——————————————————————————–
[1] ThinkEquity Partners, Eduventures (quoted in “The Learning Markets: E-Learning” by eMarketer, Inc., 2003) <http://www.emarketer.com>.
[2] Adkins, Sam. “2002-2010 U.S. e-Learning Industry” (Brandon-Hall Marketing Series, 2002) <http://www.brandonhall.com>.
[3] Brandon-Hall (quoted in “The Learning Markets: E-Learning” by eMarketer, Inc., 2003) <http://www.emarketer.com>.
[4] Howell, Scott, Peter Williams, and Nathan Lindsay. “Thirty-two Trends Affecting Distance Education: An Informed Foundation for Strategic Planning.” The Online Journal of Distance Learning Administration (6.3) 2003 <http://www.westga.edu/~distance/ojdla/fall63/howell63.html>.
[5] Jones Knowledge, Inc. and CourseShare.com (quoted in “The Learning Markets: E-Learning” by eMarketer, Inc., 2003) <http://www.emarketer.com>. The ratio of interest to commitment is 75% to 64% in education and 80% to 60% in among corporations.
| Market Analysis | |||||||
| Year 1 | Year 2 | Year 3 | Year 4 | Year 5 | |||
| Potential Customers | Growth | CAGR | |||||
| Corporate | 30% | 144,000 | 187,200 | 243,360 | 316,368 | 411,278 | 30.00% |
| Higher Education | 25% | 180,000 | 225,000 | 281,250 | 351,563 | 439,454 | 25.00% |
| K-12 Education | 30% | 36,000 | 46,800 | 60,840 | 79,092 | 102,820 | 30.00% |
| Total | 27.57% | 360,000 | 459,000 | 585,450 | 747,023 | 953,552 | 27.57% |
4.2 Target Market Segment Strategy
Third Degree I.D. is focusing on the corporate and educational markets because they represent the e-learning growth sectors. The partnership is well positioned to tap these markets locally and regionally. Savannah and the Lowcountry is experiencing genuine growth in high-tech businesses and is home to over 20 colleges, universities, technical institutes, and educational centers in higher education alone.
4.3 Service Business Analysis
The educational services industry is comprised of a large number of existing businesses competing in several segments. Historically, K-12, colleges/universities and corporate training providers utilized a traditional instructor-led approach for the delivery of short- and long-term courses. Over the last few years, e-learning has developed into a mature alternative to instructor-led course delivery, as it provides substantial cost savings in both development and delivery of the content and allows service providers to increase their geographical market.
4.3.1 Competition and Buying Patterns
Until recently, the competition in e-learning has been among large, proprietary course management or learning management system (CMS/LMS) vendors and IT-infrastructure companies. However, as less expensive systems and free, easy-to-install open-source systems emerge, the focus and interest is moving (appropriately) from delivery systems to the actual content delivered.
Third Degree I.D. is committed to leveraging the trend toward less expensive and open-source systems by emphasizing user-centered instructional design and by designing object-oriented content that facilitates easy installation and migration into almost any system. The company is dedicated to developing content that meets or exceeds interoperability (SCORM, OKI) and compliance standards (W3 Accessibility, ADA), so that clients can make better decisions about how to serve their content to virtually anyone.
However, the company has extensive experience with the most popular, proprietary CMS/LMS systems, and recognizes a continued investment by its clients in those systems. Thus, it also focuses on design and development for those systems (Blackboard, WebCT), while also maintaining interoperability and compliance standards that allow for easy migration of content (from system to system).
Strategy and Implementation Summary
Third Degree I.D. will focus on four e-learning markets– the corporate, educational, healthcare, and government sectors. While it seeks business from companies and institutions across the United States and abroad, it will make a concerted effort to develop long-term local and regional clients.
Third Degree I.D.’s target customers are the upper-level management of companies and institutions who are charged with the day-to-day operations of e-learning implementation and delivery.
5.1 Competitive Edge
Third Degree I.D. provides its clients the personal touch that large, proprietary systems vendors are ill-equipped to deliver. There is no universal recipe for a “good” instructional design. However, all effective instructional solutions share similar ingredients: a dash of market opportunity, a pinch of business goals, and a generous helping of user requirements. As its name implies, Third Degree I.D. is committed to “interrogating” the relevant stakeholders to determine the appropriate mix of ingredients.
Better questions yield better results. Third Degree I.D. will ask probing questions and deliver superior instructional solutions.
5.2 Marketing Strategy
Third Degree I.D.’s marketing strategy for the first year requires that the company:
- initiate as many personal contacts as possible
- demonstrate excellence with every personal contact
- identify six to eight key clients, and “win them over” through demonstration of expertise with limited initial client investment
- provide excellent custom development services with enthusiasm and a personal touch
- make a name for the company.
Identity Issues
The first year of operations will present a marketing challenge for Third Degree I.D. The partnership and identity are newly formed; therefore, the company is relatively unknown in the marketplace. Although the founders have significant experience and many contacts within the e-learning and new media industries, they have worked mainly for corporate or institutional employers during the course of their careers. Therefore, Third Degree I.D. won’t benefit from immediate name recognition.
The challenge is mitigated somewhat, for name recognition isn’t especially prevalent among custom content developers in the industry—even among those who have been successful in the marketplace for years. Brandon-Hall surveyed over 200 chief learning officers, e-learning managers, and training directors to discover that the majority couldn’t name more than five custom content companies.[1]
Selling Services
Another challenge stems from the nature of the business. In the first year, Third Degree I.D. will focus chiefly on marketing and selling instructional-design services, although the long-term plan is to obtain revenue from content re-packaging and re-licensure, at which time the focus will shift from selling services to selling products. Services are traditionally tough to market, as clients are wary of spending money for intangibles. They are more likely to buy from a well-known business that offers “good enough” service than to take a chance on an unknown organization that might provide exceptional service.
Photo processing is a suitable example. Many consumers routinely have their film developed at the local drugstore, despite the fact that they are often dissatisfied with the quality of the printing, the speed of the service, etc. In spite of their concerns, most consumers continue to use the drugstore’s service, rather than taking a chance on a non-chain photo lab, a mail-in service, or any of several less familiar options.
Selling Instructional Design (I.D.)
The nature of the service provided by Third Degree I.D. presents yet another challenge in that “instructional design” is not exactly a household term. Although many organizations have experimented with e-learning, the field is still very young. Best practices are in their infancy, and every organization does online education a bit differently.
The market is dominated by a variety of course management system (CMS) and learning management system (LMS) vendors, each claiming their products will revolutionize the industry. Despite their lofty claims, most of these systems service providers are ill-equipped to help clients with their most daunting task—that of organizing, restructuring, and enhancing their content to provide meaningful web-based instruction.
Clients are overwhelmed by the choices and confused by the options.
Part of Third Degree I.D.’s strategy is to capitalize on that frustration as well as on the growing awareness of companies and institutions that they actually need instructional design services, especially the services of those who design and develop for the e-learning niche.
In February 2004, Brandon-Hall published “Custom Content Developers: Comparative Analysis of 97 Outsource E-Learning Providers.” The study highlights and evaluates the best-known custom content development vendors in the e-learning marketplace. These are, arguably, Third Degree I.D.’s most traditional competitors. However, it also pays to consider a source that would normally be the last place one would look for competition—the clients themselves. When faced with unfamiliar tasks, clients often try to “do it themselves,” rather than take a chance on outsourcing services, which are traditionally difficult to quantify and measure.
To succeed in this environment, Third Degree I.D. will demonstrate, through cost analysis, that outsourcing content development to a well-equipped development house with streamlined processes is generally more cost-effective than in-house development.
The Personal Touch
During the first year of operation, Third Degree I.D. will focus on developing relationships as a conduit for sales. Rather than mounting an advertising campaign that promotes a faceless service, the founders will strive to make as many personal or “insider” contacts as possible. According to Brandon-Hall’s custom content report, the majority of the companies surveyed “chose their outsource partner through simple ‘word of mouth or they selected companies that were in close geographic proximity to themselves.”[2]
Fortunately, Third Degree I.D. operates in a city that is known for its relationship networking. The founders have established and continue to establish their credibility among potential clients, particularly in the higher education and high-tech corporate sectors.
Higher Education Clients
All of the company founders have worked for at least one institution of higher education in Savannah, and the company CEO, who has a 10-year employment history in Georgia at several colleges and universities, plans to extend that experience to another Savannah-based university in August. The potential clients for which personal contacts exist include:
Georgia:
- Armstrong Atlantic State University (Savannah)
- East Georgia College (Swainsboro)
- Middle Georgia College (Cochran)
- Georgia State University (Atlanta)
- Georgia Tech Regional Engineering Program (Savannah)
- Savannah College of Art and Design (Savannah)
- Savannah State University (Savannah)
- South University (Savannah)
- University of Georgia (Athens)
Other States:
- LaSalle University (PA)
- Matanuska-Susitna College (AK)
- Methodist College (NC)
- Tennessee Board of Regents Online Degree Program (TN)
- Thomas Edison University (NJ)
- Saint Thomas University (FL)
- San Diego State University (CA)
Another strategy of Third Degree I.D. is to read about and research the higher education e-learning market continuously. There will be no “cold calling.” Instead, institutions will be approached when there is a natural context for doing so. Institutions in likely need of instructional design products and services include those with high-volume e-learning programs, troubled or ineffective e-learning programs (that may be “on probation”), or ambitious curricula rollouts. Current candidates include:
- American InterContinental University
- Drexel eLearning
- eArmy U
- Penn State World Campus
- University of Maryland University College
- University of Phoenix
- University of Illinois at Springfield
Other potential higher education clients may be non-American institutions wanting to establish themselves in the U.S. e-learning market and wanting to utilize designers and developers more familiar with regional accreditation and compliance standards. Countries with high-volume e-learning establishments, such as Canada and the U.K., stand to save substantially on design and development costs, as well.
Corporate Clients
While Third Degree I.D. wants to build its reputation in education, it appreciates the need to keep a balanced client portfolio. Recognizing that industries fluctuate and that corporate e-learning is the sector predicted to show the largest growth, the company will work to establish a number of corporate relationships, as well, approaching potential clients through appropriate forums, and via a context that clarifies need (such as a news article or press release announcing a potential client’s new e-learning infrastructure). Third Degree I.D. has already begun to market its products and services to local companies—and particularly high-tech companies–through a number of forums, associations and businesses, including:
- Advanced Technology Development Center (ATDC)
- Coastal BETA
- Coastal Venture Investment Forum
- The Creative Coast
- OnPoint Digital
- Savannah Economic Development Authority
- Savannah Entrepreneurial Center
- Small Business Chamber of Savannah
It has begun to announce its products and services to the national and international communities through national and international e-learning forums and associations, including:
- eLearning Europa
- Eduventures
- The eLearning Guild
- World Wide Learn
Third Degree I.D. has already secured some limited “spec” work from the University of Ceramic Tile and Stone through The eLearning Guild.
Healthcare Clients
Healthcare represents a small, but growing market (relative to the corporate and educational e-learning markets). Clients that are likely to develop e-learning infrastructures are large, university-affiliated hospitals that do a good deal of teaching and research. Third Degree I.D. has already established contacts with the University of Chicago Hospitals Academy and is planning to contact several of the local Savannah hospitals, one of which is Memorial Health, a “medical university” that has been listed as one of the “100 most wired hospitals” three years in a row by hospitalconnect.com.[3]
Government Clients
Like healthcare, government e-learning is demonstrating some growth, especially in sectors where training is mandated by law. The recent Forecast of Contract Opportunities for FY 2004 issued by the Department of Homeland Security features a number of projects that will require training that is flexible, mobile and cost-effective. A number of the projects are also based in Georgia and South Carolina.
New and Key Clients
While Third Degree I.D. seeks clients who have established e-learning programs and wish to improve upon or extend them, many of its potential clients (particularly the local clients) will be forging ground in unfamiliar territory as they move from traditional educational and training environments to the e-learning arena. They will be uncertain about the benefits of e-learning and protective of their subject-matter expertise. They will be wary of third-party content developers claiming to have the “answer to their prayers.”
The founders of Third Degree I.D. recognize the cautious environment they are likely to face and have realistic expectations for the first year of operation. The general goal is to establish a limited number of key clients and provide high-quality services and exemplary products. Key clients are best characterized as clients with genuine e-learning ambitions who are considering a number of large-scale projects and will require some training and maintenance. Key clients would be returning customers.
To acquire key clients, Third Degree I.D. is prepared to take limited-scope development projects at a reduced rate to prove its capabilities. For instance, the company may offer to develop a single course in a certificate program “at cost,” with the goal of winning a more lucrative through the demonstration of superior service and an exemplary product.
Seeking Excellence
Third Degree I.D. will strive for excellence in all personal encounters and development transactions because it recognizes the validity of “the butterfly effect.” In much the same way chaos theorists posit that a butterfly flapping its wings in Brazil can affect global weather patterns, entrepreneurs know that a single client meeting handled with passion, enthusiasm, and excellence may be the catalyst for many future successful business dealings.
Looking Ahead
After the initial year of selling predominantly services, Third Degree I.D. will reposition itself to market the products it has developed both as a result of the service deliverables and some in-house research and development. The central product is the “learning object,” a Flash-based course enhancement that raises the level of course engagement and interaction levels and raises the bar in the e-learning industry. The learning objects bring together high-quality instructional design with compelling, state-of-the-art media design. The objects are also exceedingly flexible, eminently re-purposable, and remarkably scalable.
Because the learning objects are likely to be copied quickly after their release, Third Degree I.D. will need to prepare a special campaign to become “the name” in reusable custom content development. The company will:
- write press releases
- get featured in articles and on websites
- register keywords with major search engines
- approach CMS/LMS vendors and professional organization about linking to our website
- advertise in industry-specific publications
- register with RFP exchanges
- investigate/initiate strategic partnerships
- attend trade shows (as exhibitors)
- present our solutions at conferences and seminars.
As the market demonstrates its needs, Third Degree I.D. will begin to narrow its focus, optimizing those products and services that are most useful, beneficial, and cost-effective. The company will invest in a market research strategy utilizing a number of evaluation and survey techniques to assure its understanding of the market and its staying power within that market.
——————————————————————————–
[1] Chapman, Bryan. “Custom Content Developers: Comparative Analysis of 97 Outsource e-Learning Providers” (Brandon-Hall Marketing Series, 2004) <http://www.brandonhall.com>.
[2] Chapman, Bryan. “Custom Content Developers: Comparative Analysis of 97 Outsource e-Learning Providers” (Brandon-Hall Marketing Series, 2004) <http://www.brandonhall.com>.
[3] Hospitals Connect. “100 Most Wired.” <http://www.hospitalconnect.com/hhnmostwired/archives/100_most_wired.html>.
5.3 Sales Strategy
Third Degree I.D. promotes its products and services via its website and advertises strategically via portals and publications devoted to e-learning and distance education. Additionally, the company solicits likely customers through direct mailings targeted toward businesses or institutions that are planning large online program rollouts or that are experiencing accreditation problems related to e-learning.
5.3.1 Sales Forecast
While business began in May 2004 and will intensify through August 2004, September 2004 is the partnership’s first month of official operations. The sales forecast (from September 2004 to August 2005) represents a year of operations.
For the purpose of this plan, we treat our development costs as our staff costs. The only direct cost of sales listed here is software packaging, which we project at 5% of the sale price. Although this effectively brings our direct costs to zero, it reflects the fact that all three founding members will, in fact, be directly involved in the development of our products. Our staff costs are laid out in the Personnel Plan. On average, we’ll markup our development costs by 50% to set the final price.
During the first year of operations, all our sales will come from new content and curriculum development. We will strive to make this content re-usable and subsequently re-package it to meet the needs of additional clients. This should decrease our overall development costs in future periods. We plan that 25% of cumulative previous years’ sales will come from such re-used content.
The table below summarizes our sales forecasts.


| Sales Forecast | |||
| Year 1 | Year 2 | Year 3 | |
| Sales | |||
| New Curriculum & Content Development | $360,000 | $400,000 | $480,000 |
| Reuse, Re-licensure and Maintenance | $0 | $90,000 | $190,000 |
| Learning Object Development | $0 | $20,000 | $30,000 |
| Training | $0 | $20,000 | $30,000 |
| Consulting | $0 | $30,000 | $40,000 |
| Other Services | $0 | $0 | $0 |
| Total Sales | $360,000 | $560,000 | $770,000 |
| Direct Cost of Sales | Year 1 | Year 2 | Year 3 |
| Software packaging | $18,000 | $28,000 | $38,500 |
| Other Services | $0 | $0 | $0 |
| Subtotal Direct Cost of Sales | $18,000 | $28,000 | $38,500 |
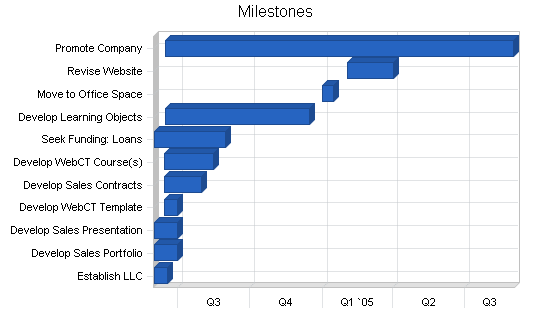
5.4 Milestones
Our milestones for the initial period are summarized in the table below.
| Milestones | |||||
| Milestone | Start Date | End Date | Budget | Manager | Department |
| Establish LLC | 6/1/2004 | 6/18/2004 | $400 | CEO | Business |
| Develop Sales Portfolio | 6/1/2004 | 6/30/2004 | $0 | CEO/CLO/CCO | Business/Design |
| Develop Sales Presentation | 6/1/2004 | 6/30/2004 | $0 | CEO/CLO/CCO | Business/Design |
| Develop WebCT Template | 6/14/2004 | 6/30/2004 | $0 | CEO/CLO/CCO | Design |
| Develop Sales Contracts | 6/14/2004 | 7/31/2004 | $0 | CEO/CLO/CCO | Business |
| Develop WebCT Course(s) | 6/14/2004 | 8/15/2004 | $0 | CEO | Design |
| Seek Funding: Loans | 6/1/2004 | 8/31/2004 | $0 | CEO/CLO/CCO | Business |
| Develop Learning Objects | 6/15/2004 | 12/15/2004 | $0 | CLO/CCO | Design |
| Move to Office Space | 1/1/2005 | 1/15/2005 | $1,000 | CEO/CLO/CCO | Business |
| Revise Website | 2/1/2005 | 4/1/2005 | $0 | CEO/CLO/CCO | Business |
| Promote Company | 6/15/2004 | 8/31/2005 | $6,000 | CEO/CLO/CCO | Business/Design |
| Totals | $7,400 | ||||
Web Plan Summary
The Third Degree I.D. website will help familiarize potential clients with the company’s unique approach to instructional design and e-learning content development. The website will establish Third Degree I.D. as a sophisticated yet approachable instructional design group with over 25 years of collective experience in educational new media development.
6.1 Website Marketing Strategy
Through sample learning objects and case studies, the website will showcase the type of detail-oriented instructional design that Third Degree I.D. provides. These examples will demonstrate how the company can leverage new media capabilities to create richer learning experiences. The work samples and promotional copy will help clients make the connection between engaging content and effective instruction, while emphasizing the company’s ability to identify and meet learning goals.
In addition to introducing prospective clients to the company, the website will provide supplementary information for those already familiar with Third Degree I.D., its products, and its services. Through a password-protected client extranet, the website will serve existing clients as a means to track project progress and to investigate new opportunities for curriculum development. Message boards in this portion of the site will offer a convenient location where clients can exchange ideas with project managers, subject matter experts, content developers, and instructional designers.
Internationally-known educational media organizations, such as the eLearning Guild, the Association for the Advancement of Computing in Education, and World Wide Learn, will provide cost-effective opportunities for exposure and drive traffic to the Third Degree I.D. website. Similarly, ads placed online in publications such as the Chronicle of Higher Education will allow the company to reach its target market and establish a network of links to the company website. These links will contribute to higher rankings in search engine result lists, which will lead to increased web traffic and name recognition for the company. Additional web-based advertising will be pursued as needed to improve company visibility and to generate interest in company services.
6.2 Development Requirements
The development of the Third Degree I.D. website will be the responsibility of the Chief Creative Officer. Tasks necessary for the completion of the site include:
- Domain name registration
- Purchase of Web hosting plan
- Development of site look and feel
- Backend programming and database integration for client extranet
The domain name ThirdDegreeID.com has already been registered and hosting has been established for the address. While the website look and feel will evolve over time, creating a web presence consistent with the company’s identity is an immediate priority. Equally vital to the success of the website as a promotional tool is the establishment of a collection of learning objects and other work samples. After meeting this need, the client extranet and other advanced features will be added to the site as resources become available.
Management Summary
Third Degree I.D. is owned and operated by its founders. It is a small company with a lateral, non-hierarchical structure that cultivates mutual input and collective solutions. The company will operate with three full-time employees (also the founders) in the first year, hiring contractor and consultants as needed. As our business grows, we plan to add additional staff, as discussed below.
7.1 Personnel Plan
Third Degree I.D. will be formed with three executive partners, a Chief Executive Officer (CEO), a Chief Learning Officer (CLO), and a Chief Creative Officer (CCO). While a number of their job duties overlap, the CEO is primarily responsible for front-end consulting, planning, and project management, while the CLO and CCO are responsible for back-end product development, refinement, and implementation. The partners work together at promoting the business and managing office operations.
Susan Hines, CEO
Susan has worked in the educational sector for twenty years. She has seventeen years of teaching experience across a broad range of institutions, including public and private universities, four-year colleges, community colleges, and college-preparatory facilities. She has taught at institutions both domestic and foreign, has been a traditional tenure-track faculty member, and has served—and continues to serve—as online adjunct faculty. Susan was Assistant Professor of English and Digital Art at LaSalle University from 1998 to 2000, before taking a job as an Instructional Analyst with the e-learning company Eduprise, Inc. (now SunGuard Collegis). She was hired by the Savannah College of Art and Design in 2002 to develop its distance education curricula and continues to serve as SCAD’s Director of Instructional Design. Susan holds several degrees in English Literature: a Ph.D. from Georgia State University, an M.A. from the University of British Columbia, and a B.A. from the University of Alaska.
Mona Meyer, CLO
Mona holds a B.S. in Information and Computer Science from the University of California, Irvine and an M.A. in Educational Technology from San Diego State University. She has over twelve years experience designing and developing new media learning solutions for a variety of educational institutions and publishers, including: McGraw-Hill, Jostens Learning Corporation (now CompassLearning), Leapfrog, and the Savannah College of Art and Design. Mona specializes in object-oriented instructional design solutions that promote active collaboration. As instructional design manager for McGraw-Hill New Media, Mona led the development of hundreds of titles for the K-12 market in a wide variety of subject areas and played a crucial role in the design and development of the Codie-Award-winning McGraw-Hill Learning Network (www.mhln.com), a large-scale Internet education portal that offers interactive textbooks, multi-player educational games, and a suite of web-based classroom management tools.
Daniel Stanford, CCO
Daniel holds a B.A. in Mass Communication and French from the University of Alabama and is currently completing his M.F.A. in Interactive Design at the Savannah College of Art and Design. An avid linguist and the recipient of a Capstone International Scholarship for study abroad, Daniel has spent semesters in France and Germany. He began his career in media design at the University of Alabama Center for Public Television, where he collaborated with producers to promote programs and distribute supplementary educational materials via the Web. He has since served as a media designer at the BLR Agency in Birmingham, Alabama, where he contributed significantly to the Birmingham Museum of Art’s Addy-award-winning website (www.artsbma.org). Five years of diverse media design experience led Daniel to SCAD, where he has put his combination of artistic and technical skills to use in learning object programming, graphic interface development, and project management.
Future Staffing
As the client-base grows, the partners plan to hire a Technology Director who will work closely with the CLO and CCO to develop database-driven learning objects, as well as with the CEO to develop broader e-learning solutions, such as installation packages for open-source course management and learning management systems (CMS/LMS). In the first year, the partners will rely on outside consultants to provide information technology, instructional design, and media development support, as dictated by project load. As the client base grows and revenue is increasingly generated through content and technology re-licensure, the partners may add additional development staff to support project needs.
| Personnel Plan | |||
| Year 1 | Year 2 | Year 3 | |
| Susan Hines (CEO) | $75,000 | $75,000 | $75,000 |
| Mona Meyer (CLO) | $75,000 | $75,000 | $75,000 |
| Danny Stanford (CCO) | $75,000 | $75,000 | $75,000 |
| Instructional Designer | $0 | $0 | $50,000 |
| Production Assistant | $0 | $0 | $30,000 |
| Director of Technology | $0 | $75,000 | $75,000 |
| Total People | 3 | 4 | 6 |
| Total Payroll | $225,000 | $300,000 | $380,000 |
Financial Plan
Our financial plan is based on our assumption of achieving desired levels of sales. Our first-year revenues (projected at $360,000) will probably be insufficient to turn a profit in the first year. However, we plan to generate net profit starting in year two. Our initial cash reserve should be sufficient to keep us afloat during the first year. Subsequent years’ cash flows generate a cushion that will allow us to further develop our business.
8.1 Important Assumptions
Our main financial assumptions are summarized in the table below.
| General Assumptions | |||
| Year 1 | Year 2 | Year 3 | |
| Plan Month | 1 | 2 | 3 |
| Current Interest Rate | 10.00% | 10.00% | 10.00% |
| Long-term Interest Rate | 10.00% | 10.00% | 10.00% |
| Tax Rate | 30.00% | 30.00% | 30.00% |
| Other | 0 | 0 | 0 |
8.2 Break-even Analysis
The main development costs of the product will be our staff costs. Our variable costs are solely those related to packaging (5% of sales), since our staff costs are monthly payroll numbers, reflected in the P&L forecasts later in this document. Our Break-even Analysis is summarized in the table below.

| Break-even Analysis | |
| Monthly Revenue Break-even | $29,193 |
| Assumptions: | |
| Average Percent Variable Cost | 5% |
| Estimated Monthly Fixed Cost | $27,733 |
8.3 Projected Profit and Loss
First-year revenue is generated primarily from curriculum and content development services. The first-year gross income goal is $360,000, which represents a development objective of at least three full MA programs or training programs (10 courses each) or a combination of comparable curricula. It is the intent of the partners that every development project will yield re-usable learning objects that can be subsequently re-packaged to meet the needs of additional clients. The partners also intend to solicit co-ownership agreements that allow Third Degree I.D. to re-license courses and curricula to institutions other than those for which they were first developed. The reusable learning objects and content re-licensure will provide a low-investment revenue stream that will contribute an increasingly large percentage of gross corporate revenue in subsequent years.
On the expense side, our staff costs are going to be our main cost. These are, technically, are our product development costs, as all three partners will be directly involved into the development of products for our clients. During the first year, we also plan to utilize services of outside consultants and contractors on the product development side. As stated earlier in this document, as our business grows, we plan to add additional staff. We also plan to utilize our CEO’s home office for the remaining part of 2004 and move into a new office space in January 2005.
Overall, we plan to end our first year of operations with a loss. Subsequent years wil show increasing profitability, as summarized in the table below.


| Pro Forma Profit and Loss | |||
| Year 1 | Year 2 | Year 3 | |
| Sales | $360,000 | $560,000 | $770,000 |
| Direct Cost of Sales | $18,000 | $28,000 | $38,500 |
| Other Costs of Sales | $0 | $0 | $0 |
| Total Cost of Sales | $18,000 | $28,000 | $38,500 |
| Gross Margin | $342,000 | $532,000 | $731,500 |
| Gross Margin % | 95.00% | 95.00% | 95.00% |
| Expenses | |||
| Payroll | $225,000 | $300,000 | $380,000 |
| Sales and Marketing and Other Expenses | $6,000 | $10,000 | $15,000 |
| Depreciation | $0 | $0 | $0 |
| Rent | $8,800 | $14,000 | $16,000 |
| Utilities | $1,000 | $1,500 | $2,000 |
| Insurance | $3,600 | $4,000 | $5,000 |
| Payroll Taxes | $0 | $0 | $0 |
| Consultants | $75,000 | $0 | $0 |
| Telecommunications | $2,600 | $4,000 | $5,000 |
| Business Travel | $5,000 | $8,000 | $10,000 |
| Moving Expenses/Redecorating | $1,000 | $0 | $0 |
| Other | $4,800 | $10,000 | $10,000 |
| Total Operating Expenses | $332,800 | $351,500 | $443,000 |
| Profit Before Interest and Taxes | $9,200 | $180,500 | $288,500 |
| EBITDA | $9,200 | $180,500 | $288,500 |
| Interest Expense | $2,188 | $750 | $0 |
| Taxes Incurred | $2,104 | $53,925 | $86,550 |
| Net Profit | $4,909 | $125,825 | $201,950 |
| Net Profit/Sales | 1.36% | 22.47% | 26.23% |
8.4 Projected Cash Flow
Our cash plan is based on the assumption that we meet our sales objectives and collect receivables within 60 days. This will be especially critical during our first year of operations, during which our cash balance will also depend on the initial cash contributions of the three founding partners and a two-year $30,000 loan. The combination of the two should be sufficient to keep our cash balance positive during the most critical first year of operations.
The table below summarizes our cash flow forecasts.

| Pro Forma Cash Flow | |||
| Year 1 | Year 2 | Year 3 | |
| Cash Received | |||
| Cash from Operations | |||
| Cash Sales | $0 | $0 | $0 |
| Cash from Receivables | $281,333 | $516,296 | $724,111 |
| Subtotal Cash from Operations | $281,333 | $516,296 | $724,111 |
| Additional Cash Received | |||
| Sales Tax, VAT, HST/GST Received | $0 | $0 | $0 |
| New Current Borrowing | $0 | $0 | $0 |
| New Other Liabilities (interest-free) | $0 | $0 | $0 |
| New Long-term Liabilities | $0 | $0 | $0 |
| Sales of Other Current Assets | $0 | $0 | $0 |
| Sales of Long-term Assets | $0 | $0 | $0 |
| New Investment Received | $0 | $0 | $0 |
| Subtotal Cash Received | $281,333 | $516,296 | $724,111 |
| Expenditures | Year 1 | Year 2 | Year 3 |
| Expenditures from Operations | |||
| Cash Spending | $225,000 | $300,000 | $380,000 |
| Bill Payments | $116,130 | $137,108 | $183,622 |
| Subtotal Spent on Operations | $341,130 | $437,108 | $563,622 |
| Additional Cash Spent | |||
| Sales Tax, VAT, HST/GST Paid Out | $0 | $0 | $0 |
| Principal Repayment of Current Borrowing | $15,000 | $15,000 | $0 |
| Other Liabilities Principal Repayment | $0 | $0 | $0 |
| Long-term Liabilities Principal Repayment | $0 | $0 | $0 |
| Purchase Other Current Assets | $0 | $0 | $0 |
| Purchase Long-term Assets | $0 | $0 | $0 |
| Dividends | $0 | $0 | $0 |
| Subtotal Cash Spent | $356,130 | $452,108 | $563,622 |
| Net Cash Flow | ($74,797) | $64,188 | $160,489 |
| Cash Balance | $41,279 | $105,467 | $265,957 |
8.5 Projected Balance Sheet
The table below summarizes our forecasted balance sheet. For the first two years of operations (i.e., until we generate a sufficient cash reserve), receivables represent our main current asset. Our fixed assets should be mostly limited to the computer equipment that we depreciate over 5 years. With manageable liabilities, our accounting net worth should steadily grow over the projected period.
| Pro Forma Balance Sheet | |||
| Year 1 | Year 2 | Year 3 | |
| Assets | |||
| Current Assets | |||
| Cash | $41,279 | $105,467 | $265,957 |
| Accounts Receivable | $78,667 | $122,370 | $168,259 |
| Other Current Assets | $0 | $0 | $0 |
| Total Current Assets | $119,946 | $227,838 | $434,216 |
| Long-term Assets | |||
| Long-term Assets | $13,000 | $13,000 | $13,000 |
| Accumulated Depreciation | $0 | $0 | $0 |
| Total Long-term Assets | $13,000 | $13,000 | $13,000 |
| Total Assets | $132,946 | $240,838 | $447,216 |
| Liabilities and Capital | Year 1 | Year 2 | Year 3 |
| Current Liabilities | |||
| Accounts Payable | $13,961 | $11,028 | $15,456 |
| Current Borrowing | $15,000 | $0 | $0 |
| Other Current Liabilities | $0 | $0 | $0 |
| Subtotal Current Liabilities | $28,961 | $11,028 | $15,456 |
| Long-term Liabilities | $0 | $0 | $0 |
| Total Liabilities | $28,961 | $11,028 | $15,456 |
| Paid-in Capital | $105,000 | $105,000 | $105,000 |
| Retained Earnings | ($5,924) | ($1,016) | $124,809 |
| Earnings | $4,909 | $125,825 | $201,950 |
| Total Capital | $103,985 | $229,810 | $431,760 |
| Total Liabilities and Capital | $132,946 | $240,838 | $447,216 |
| Net Worth | $103,985 | $229,810 | $431,760 |
8.6 Business Ratios
The table below summarizes our key business ratios, with comparisons to standard ratios for our industry, Educational Computer Software (SIC Code 7372.9903).
| Ratio Analysis | ||||
| Year 1 | Year 2 | Year 3 | Industry Profile | |
| Sales Growth | 0.00% | 55.56% | 37.50% | 5.21% |
| Percent of Total Assets | ||||
| Accounts Receivable | 59.17% | 50.81% | 37.62% | 19.34% |
| Other Current Assets | 0.00% | 0.00% | 0.00% | 46.42% |
| Total Current Assets | 90.22% | 94.60% | 97.09% | 68.91% |
| Long-term Assets | 9.78% | 5.40% | 2.91% | 31.09% |
| Total Assets | 100.00% | 100.00% | 100.00% | 100.00% |
| Current Liabilities | 21.78% | 4.58% | 3.46% | 32.29% |
| Long-term Liabilities | 0.00% | 0.00% | 0.00% | 20.16% |
| Total Liabilities | 21.78% | 4.58% | 3.46% | 52.45% |
| Net Worth | 78.22% | 95.42% | 96.54% | 47.55% |
| Percent of Sales | ||||
| Sales | 100.00% | 100.00% | 100.00% | 100.00% |
| Gross Margin | 95.00% | 95.00% | 95.00% | 100.00% |
| Selling, General & Administrative Expenses | 27.91% | 72.53% | 68.77% | 80.41% |
| Advertising Expenses | 0.00% | 0.00% | 0.00% | 1.08% |
| Profit Before Interest and Taxes | 2.56% | 32.23% | 37.47% | 1.17% |
| Main Ratios | ||||
| Current | 4.14 | 20.66 | 28.09 | 1.45 |
| Quick | 4.14 | 20.66 | 28.09 | 1.16 |
| Total Debt to Total Assets | 21.78% | 4.58% | 3.46% | 61.68% |
| Pre-tax Return on Net Worth | 6.74% | 78.22% | 66.82% | 1.52% |
| Pre-tax Return on Assets | 5.27% | 74.64% | 64.51% | 3.96% |
| Additional Ratios | Year 1 | Year 2 | Year 3 | |
| Net Profit Margin | 1.36% | 22.47% | 26.23% | n.a |
| Return on Equity | 4.72% | 54.75% | 46.77% | n.a |
| Activity Ratios | ||||
| Accounts Receivable Turnover | 4.58 | 4.58 | 4.58 | n.a |
| Collection Days | 57 | 66 | 69 | n.a |
| Accounts Payable Turnover | 9.32 | 12.17 | 12.17 | n.a |
| Payment Days | 27 | 34 | 26 | n.a |
| Total Asset Turnover | 2.71 | 2.33 | 1.72 | n.a |
| Debt Ratios | ||||
| Debt to Net Worth | 0.28 | 0.05 | 0.04 | n.a |
| Current Liab. to Liab. | 1.00 | 1.00 | 1.00 | n.a |
| Liquidity Ratios | ||||
| Net Working Capital | $90,985 | $216,810 | $418,760 | n.a |
| Interest Coverage | 4.21 | 240.67 | 0.00 | n.a |
| Additional Ratios | ||||
| Assets to Sales | 0.37 | 0.43 | 0.58 | n.a |
| Current Debt/Total Assets | 22% | 5% | 3% | n.a |
| Acid Test | 1.43 | 9.56 | 17.21 | n.a |
| Sales/Net Worth | 3.46 | 2.44 | 1.78 | n.a |
| Dividend Payout | 0.00 | 0.00 | 0.00 | n.a |
Appendix
| Sales Forecast | |||||||||||||
| Month 1 | Month 2 | Month 3 | Month 4 | Month 5 | Month 6 | Month 7 | Month 8 | Month 9 | Month 10 | Month 11 | Month 12 | ||
| Sales | |||||||||||||
| New Curriculum & Content Development | 0% | $10,000 | $20,000 | $30,000 | $30,000 | $30,000 | $30,000 | $30,000 | $30,000 | $30,000 | $40,000 | $40,000 | $40,000 |
| Reuse, Re-licensure and Maintenance | 0% | $0 | $0 | $0 | $0 | $0 | $0 | $0 | $0 | $0 | $0 | $0 | $0 |
| Learning Object Development | 0% | $0 | $0 | $0 | $0 | $0 | $0 | $0 | $0 | $0 | $0 | $0 | $0 |
| Training | 0% | $0 | $0 | $0 | $0 | $0 | $0 | $0 | $0 | $0 | $0 | $0 | $0 |
| Consulting | 0% | $0 | $0 | $0 | $0 | $0 | $0 | $0 | $0 | $0 | $0 | $0 | $0 |
| Other Services | 0% | $0 | $0 | $0 | $0 | $0 | $0 | $0 | $0 | $0 | $0 | $0 | $0 |
| Total Sales | $10,000 | $20,000 | $30,000 | $30,000 | $30,000 | $30,000 | $30,000 | $30,000 | $30,000 | $40,000 | $40,000 | $40,000 | |
| Direct Cost of Sales | Month 1 | Month 2 | Month 3 | Month 4 | Month 5 | Month 6 | Month 7 | Month 8 | Month 9 | Month 10 | Month 11 | Month 12 | |
| Software packaging | 5% | $500 | $1,000 | $1,500 | $1,500 | $1,500 | $1,500 | $1,500 | $1,500 | $1,500 | $2,000 | $2,000 | $2,000 |
| Other Services | $0 | $0 | $0 | $0 | $0 | $0 | $0 | $0 | $0 | $0 | $0 | $0 | |
| Subtotal Direct Cost of Sales | $500 | $1,000 | $1,500 | $1,500 | $1,500 | $1,500 | $1,500 | $1,500 | $1,500 | $2,000 | $2,000 | $2,000 | |
| Personnel Plan | |||||||||||||
| Month 1 | Month 2 | Month 3 | Month 4 | Month 5 | Month 6 | Month 7 | Month 8 | Month 9 | Month 10 | Month 11 | Month 12 | ||
| Susan Hines (CEO) | 0% | $6,250 | $6,250 | $6,250 | $6,250 | $6,250 | $6,250 | $6,250 | $6,250 | $6,250 | $6,250 | $6,250 | $6,250 |
| Mona Meyer (CLO) | 0% | $6,250 | $6,250 | $6,250 | $6,250 | $6,250 | $6,250 | $6,250 | $6,250 | $6,250 | $6,250 | $6,250 | $6,250 |
| Danny Stanford (CCO) | 0% | $6,250 | $6,250 | $6,250 | $6,250 | $6,250 | $6,250 | $6,250 | $6,250 | $6,250 | $6,250 | $6,250 | $6,250 |
| Instructional Designer | 0% | $0 | $0 | $0 | $0 | $0 | $0 | $0 | $0 | $0 | $0 | $0 | $0 |
| Production Assistant | 0% | $0 | $0 | $0 | $0 | $0 | $0 | $0 | $0 | $0 | $0 | $0 | $0 |
| Director of Technology | 0% | $0 | $0 | $0 | $0 | $0 | $0 | $0 | $0 | $0 | $0 | $0 | $0 |
| Total People | 3 | 3 | 3 | 3 | 3 | 3 | 3 | 3 | 3 | 3 | 3 | 3 | |
| Total Payroll | $18,750 | $18,750 | $18,750 | $18,750 | $18,750 | $18,750 | $18,750 | $18,750 | $18,750 | $18,750 | $18,750 | $18,750 | |
| General Assumptions | |||||||||||||
| Month 1 | Month 2 | Month 3 | Month 4 | Month 5 | Month 6 | Month 7 | Month 8 | Month 9 | Month 10 | Month 11 | Month 12 | ||
| Plan Month | 1 | 2 | 3 | 4 | 5 | 6 | 7 | 8 | 9 | 10 | 11 | 12 | |
| Current Interest Rate | 10.00% | 10.00% | 10.00% | 10.00% | 10.00% | 10.00% | 10.00% | 10.00% | 10.00% | 10.00% | 10.00% | 10.00% | |
| Long-term Interest Rate | 10.00% | 10.00% | 10.00% | 10.00% | 10.00% | 10.00% | 10.00% | 10.00% | 10.00% | 10.00% | 10.00% | 10.00% | |
| Tax Rate | 30.00% | 30.00% | 30.00% | 30.00% | 30.00% | 30.00% | 30.00% | 30.00% | 30.00% | 30.00% | 30.00% | 30.00% | |
| Other | 0 | 0 | 0 | 0 | 0 | 0 | 0 | 0 | 0 | 0 | 0 | 0 | |
| Pro Forma Profit and Loss | |||||||||||||
| Month 1 | Month 2 | Month 3 | Month 4 | Month 5 | Month 6 | Month 7 | Month 8 | Month 9 | Month 10 | Month 11 | Month 12 | ||
| Sales | $10,000 | $20,000 | $30,000 | $30,000 | $30,000 | $30,000 | $30,000 | $30,000 | $30,000 | $40,000 | $40,000 | $40,000 | |
| Direct Cost of Sales | $500 | $1,000 | $1,500 | $1,500 | $1,500 | $1,500 | $1,500 | $1,500 | $1,500 | $2,000 | $2,000 | $2,000 | |
| Other Costs of Sales | $0 | $0 | $0 | $0 | $0 | $0 | $0 | $0 | $0 | $0 | $0 | $0 | |
| Total Cost of Sales | $500 | $1,000 | $1,500 | $1,500 | $1,500 | $1,500 | $1,500 | $1,500 | $1,500 | $2,000 | $2,000 | $2,000 | |
| Gross Margin | $9,500 | $19,000 | $28,500 | $28,500 | $28,500 | $28,500 | $28,500 | $28,500 | $28,500 | $38,000 | $38,000 | $38,000 | |
| Gross Margin % | 95.00% | 95.00% | 95.00% | 95.00% | 95.00% | 95.00% | 95.00% | 95.00% | 95.00% | 95.00% | 95.00% | 95.00% | |
| Expenses | |||||||||||||
| Payroll | $18,750 | $18,750 | $18,750 | $18,750 | $18,750 | $18,750 | $18,750 | $18,750 | $18,750 | $18,750 | $18,750 | $18,750 | |
| Sales and Marketing and Other Expenses | $500 | $500 | $500 | $500 | $500 | $500 | $500 | $500 | $500 | $500 | $500 | $500 | |
| Depreciation | $0 | $0 | $0 | $0 | $0 | $0 | $0 | $0 | $0 | $0 | $0 | $0 | |
| Rent | $200 | $200 | $200 | $200 | $1,000 | $1,000 | $1,000 | $1,000 | $1,000 | $1,000 | $1,000 | $1,000 | |
| Utilities | $50 | $50 | $50 | $50 | $100 | $100 | $100 | $100 | $100 | $100 | $100 | $100 | |
| Insurance | $300 | $300 | $300 | $300 | $300 | $300 | $300 | $300 | $300 | $300 | $300 | $300 | |
| Payroll Taxes | 15% | $0 | $0 | $0 | $0 | $0 | $0 | $0 | $0 | $0 | $0 | $0 | $0 |
| Consultants | $6,250 | $6,250 | $6,250 | $6,250 | $6,250 | $6,250 | $6,250 | $6,250 | $6,250 | $6,250 | $6,250 | $6,250 | |
| Telecommunications | $150 | $150 | $150 | $150 | $250 | $250 | $250 | $250 | $250 | $250 | $250 | $250 | |
| Business Travel | $250 | $250 | $250 | $250 | $500 | $500 | $500 | $500 | $500 | $500 | $500 | $500 | |
| Moving Expenses/Redecorating | 15% | $0 | $0 | $0 | $1,000 | $0 | $0 | $0 | $0 | $0 | $0 | $0 | $0 |
| Other | $200 | $200 | $200 | $200 | $500 | $500 | $500 | $500 | $500 | $500 | $500 | $500 | |
| Total Operating Expenses | $26,650 | $26,650 | $26,650 | $27,650 | $28,150 | $28,150 | $28,150 | $28,150 | $28,150 | $28,150 | $28,150 | $28,150 | |
| Profit Before Interest and Taxes | ($17,150) | ($7,650) | $1,850 | $850 | $350 | $350 | $350 | $350 | $350 | $9,850 | $9,850 | $9,850 | |
| EBITDA | ($17,150) | ($7,650) | $1,850 | $850 | $350 | $350 | $350 | $350 | $350 | $9,850 | $9,850 | $9,850 | |
| Interest Expense | $240 | $229 | $219 | $208 | $198 | $188 | $177 | $167 | $156 | $146 | $135 | $125 | |
| Taxes Incurred | ($5,217) | ($2,364) | $489 | $192 | $46 | $49 | $52 | $55 | $58 | $2,911 | $2,914 | $2,918 | |
| Net Profit | ($12,173) | ($5,515) | $1,142 | $449 | $106 | $114 | $121 | $128 | $136 | $6,793 | $6,800 | $6,808 | |
| Net Profit/Sales | -121.73% | -27.58% | 3.81% | 1.50% | 0.35% | 0.38% | 0.40% | 0.43% | 0.45% | 16.98% | 17.00% | 17.02% | |
| Pro Forma Cash Flow | |||||||||||||
| Month 1 | Month 2 | Month 3 | Month 4 | Month 5 | Month 6 | Month 7 | Month 8 | Month 9 | Month 10 | Month 11 | Month 12 | ||
| Cash Received | |||||||||||||
| Cash from Operations | |||||||||||||
| Cash Sales | $0 | $0 | $0 | $0 | $0 | $0 | $0 | $0 | $0 | $0 | $0 | $0 | |
| Cash from Receivables | $0 | $333 | $10,333 | $20,333 | $30,000 | $30,000 | $30,000 | $30,000 | $30,000 | $30,000 | $30,333 | $40,000 | |
| Subtotal Cash from Operations | $0 | $333 | $10,333 | $20,333 | $30,000 | $30,000 | $30,000 | $30,000 | $30,000 | $30,000 | $30,333 | $40,000 | |
| Additional Cash Received | |||||||||||||
| Sales Tax, VAT, HST/GST Received | 0.00% | $0 | $0 | $0 | $0 | $0 | $0 | $0 | $0 | $0 | $0 | $0 | $0 |
| New Current Borrowing | $0 | $0 | $0 | $0 | $0 | $0 | $0 | $0 | $0 | $0 | $0 | $0 | |
| New Other Liabilities (interest-free) | $0 | $0 | $0 | $0 | $0 | $0 | $0 | $0 | $0 | $0 | $0 | $0 | |
| New Long-term Liabilities | $0 | $0 | $0 | $0 | $0 | $0 | $0 | $0 | $0 | $0 | $0 | $0 | |
| Sales of Other Current Assets | $0 | $0 | $0 | $0 | $0 | $0 | $0 | $0 | $0 | $0 | $0 | $0 | |
| Sales of Long-term Assets | $0 | $0 | $0 | $0 | $0 | $0 | $0 | $0 | $0 | $0 | $0 | $0 | |
| New Investment Received | $0 | $0 | $0 | $0 | $0 | $0 | $0 | $0 | $0 | $0 | $0 | $0 | |
| Subtotal Cash Received | $0 | $333 | $10,333 | $20,333 | $30,000 | $30,000 | $30,000 | $30,000 | $30,000 | $30,000 | $30,333 | $40,000 | |
| Expenditures | Month 1 | Month 2 | Month 3 | Month 4 | Month 5 | Month 6 | Month 7 | Month 8 | Month 9 | Month 10 | Month 11 | Month 12 | |
| Expenditures from Operations | |||||||||||||
| Cash Spending | $18,750 | $18,750 | $18,750 | $18,750 | $18,750 | $18,750 | $18,750 | $18,750 | $18,750 | $18,750 | $18,750 | $18,750 | |
| Bill Payments | $114 | $3,534 | $6,877 | $10,131 | $10,812 | $11,143 | $11,136 | $11,129 | $11,121 | $11,226 | $14,457 | $14,450 | |
| Subtotal Spent on Operations | $18,864 | $22,284 | $25,627 | $28,881 | $29,562 | $29,893 | $29,886 | $29,879 | $29,871 | $29,976 | $33,207 | $33,200 | |
| Additional Cash Spent | |||||||||||||
| Sales Tax, VAT, HST/GST Paid Out | $0 | $0 | $0 | $0 | $0 | $0 | $0 | $0 | $0 | $0 | $0 | $0 | |
| Principal Repayment of Current Borrowing | $1,250 | $1,250 | $1,250 | $1,250 | $1,250 | $1,250 | $1,250 | $1,250 | $1,250 | $1,250 | $1,250 | $1,250 | |
| Other Liabilities Principal Repayment | $0 | $0 | $0 | $0 | $0 | $0 | $0 | $0 | $0 | $0 | $0 | $0 | |
| Long-term Liabilities Principal Repayment | $0 | $0 | $0 | $0 | $0 | $0 | $0 | $0 | $0 | $0 | $0 | $0 | |
| Purchase Other Current Assets | $0 | $0 | $0 | $0 | $0 | $0 | $0 | $0 | $0 | $0 | $0 | $0 | |
| Purchase Long-term Assets | $0 | $0 | $0 | $0 | $0 | $0 | $0 | $0 | $0 | $0 | $0 | $0 | |
| Dividends | $0 | $0 | $0 | $0 | $0 | $0 | $0 | $0 | $0 | $0 | $0 | $0 | |
| Subtotal Cash Spent | $20,114 | $23,534 | $26,877 | $30,131 | $30,812 | $31,143 | $31,136 | $31,129 | $31,121 | $31,226 | $34,457 | $34,450 | |
| Net Cash Flow | ($20,114) | ($23,201) | ($16,544) | ($9,798) | ($812) | ($1,143) | ($1,136) | ($1,129) | ($1,121) | ($1,226) | ($4,124) | $5,550 | |
| Cash Balance | $95,962 | $72,761 | $56,218 | $46,420 | $45,607 | $44,464 | $43,328 | $42,199 | $41,078 | $39,852 | $35,729 | $41,279 | |
| Pro Forma Balance Sheet | |||||||||||||
| Month 1 | Month 2 | Month 3 | Month 4 | Month 5 | Month 6 | Month 7 | Month 8 | Month 9 | Month 10 | Month 11 | Month 12 | ||
| Assets | Starting Balances | ||||||||||||
| Current Assets | |||||||||||||
| Cash | $116,076 | $95,962 | $72,761 | $56,218 | $46,420 | $45,607 | $44,464 | $43,328 | $42,199 | $41,078 | $39,852 | $35,729 | $41,279 |
| Accounts Receivable | $0 | $10,000 | $29,667 | $49,333 | $59,000 | $59,000 | $59,000 | $59,000 | $59,000 | $59,000 | $69,000 | $78,667 | $78,667 |
| Other Current Assets | $0 | $0 | $0 | $0 | $0 | $0 | $0 | $0 | $0 | $0 | $0 | $0 | $0 |
| Total Current Assets | $116,076 | $105,962 | $102,428 | $105,551 | $105,420 | $104,607 | $103,464 | $102,328 | $101,199 | $100,078 | $108,852 | $114,395 | $119,946 |
| Long-term Assets | |||||||||||||
| Long-term Assets | $13,000 | $13,000 | $13,000 | $13,000 | $13,000 | $13,000 | $13,000 | $13,000 | $13,000 | $13,000 | $13,000 | $13,000 | $13,000 |
| Accumulated Depreciation | $0 | $0 | $0 | $0 | $0 | $0 | $0 | $0 | $0 | $0 | $0 | $0 | $0 |
| Total Long-term Assets | $13,000 | $13,000 | $13,000 | $13,000 | $13,000 | $13,000 | $13,000 | $13,000 | $13,000 | $13,000 | $13,000 | $13,000 | $13,000 |
| Total Assets | $129,076 | $118,962 | $115,428 | $118,551 | $118,420 | $117,607 | $116,464 | $115,328 | $114,199 | $113,078 | $121,852 | $127,395 | $132,946 |
| Liabilities and Capital | Month 1 | Month 2 | Month 3 | Month 4 | Month 5 | Month 6 | Month 7 | Month 8 | Month 9 | Month 10 | Month 11 | Month 12 | |
| Current Liabilities | |||||||||||||
| Accounts Payable | $0 | $3,309 | $6,540 | $9,771 | $10,441 | $10,772 | $10,765 | $10,758 | $10,751 | $10,744 | $13,975 | $13,968 | $13,961 |
| Current Borrowing | $30,000 | $28,750 | $27,500 | $26,250 | $25,000 | $23,750 | $22,500 | $21,250 | $20,000 | $18,750 | $17,500 | $16,250 | $15,000 |
| Other Current Liabilities | $0 | $0 | $0 | $0 | $0 | $0 | $0 | $0 | $0 | $0 | $0 | $0 | $0 |
| Subtotal Current Liabilities | $30,000 | $32,059 | $34,040 | $36,021 | $35,441 | $34,522 | $33,265 | $32,008 | $30,751 | $29,494 | $31,475 | $30,218 | $28,961 |
| Long-term Liabilities | $0 | $0 | $0 | $0 | $0 | $0 | $0 | $0 | $0 | $0 | $0 | $0 | $0 |
| Total Liabilities | $30,000 | $32,059 | $34,040 | $36,021 | $35,441 | $34,522 | $33,265 | $32,008 | $30,751 | $29,494 | $31,475 | $30,218 | $28,961 |
| Paid-in Capital | $105,000 | $105,000 | $105,000 | $105,000 | $105,000 | $105,000 | $105,000 | $105,000 | $105,000 | $105,000 | $105,000 | $105,000 | $105,000 |
| Retained Earnings | ($5,924) | ($5,924) | ($5,924) | ($5,924) | ($5,924) | ($5,924) | ($5,924) | ($5,924) | ($5,924) | ($5,924) | ($5,924) | ($5,924) | ($5,924) |
| Earnings | $0 | ($12,173) | ($17,688) | ($16,546) | ($16,097) | ($15,991) | ($15,877) | ($15,756) | ($15,628) | ($15,492) | ($8,699) | ($1,899) | $4,909 |
| Total Capital | $99,076 | $86,903 | $81,388 | $82,530 | $82,979 | $83,085 | $83,199 | $83,320 | $83,449 | $83,584 | $90,377 | $97,177 | $103,985 |
| Total Liabilities and Capital | $129,076 | $118,962 | $115,428 | $118,551 | $118,420 | $117,607 | $116,464 | $115,328 | $114,199 | $113,078 | $121,852 | $127,395 | $132,946 |
| Net Worth | $99,076 | $86,903 | $81,388 | $82,530 | $82,979 | $83,085 | $83,199 | $83,320 | $83,448 | $83,584 | $90,377 | $97,177 | $103,985 |


