
University Patents, Inc.
Executive Summary
University Patents seeks to transfer technology from research universities to preexisting companies via the licensing of patents.
Most universities have an office of technology transfer that is responsible for bringing the research/patents generated by the university to market. Some universities are very effective in this area (i.e., Stanford, U of Wisconsin, MIT), but most lack the work force and network to place most patents. Universities traditionally focus on the patents that will bring in substantial amounts of money, yet only 0.6% of licenses generate in excess of $1,000,000 in annual royalties. University Patents has the ability to not only assist the universities in placing technology but, due to the singular focus of the company, also increase the revenue to the university by increasing the number of licenses written. University Patents will generate income by taking a commission off each successful placement.
Most patents generated by university research are not, by themselves, able to sustain a business. They are most valuable to existing companies already in a market that can use new technology to increase a product line or slightly diversify their business into a market in which they have an expertise. The small size of these patents mean that most Venture Capital (VC) firms are not interested in these patents and the universities are reluctant to spend time trying to place them. University Patents will be able to focus on these smaller patents and the business will depend on bringing several of these patents to market per year.
University Patents’ business will be founded on working with several universities to place their technology patents with corporations. University Patents will research the market, develop a value model and identify potentials licensees for the patent. University Patents will bring these parties to negotiation and will receive a commission based on the licensing agreement and any future royalties generated by the patent.

1.1 Objectives
First year objectives:
- Create firm relationships with four university programs in the first year.
- Move four patents to commercialization in the first year.
- Develop a contact process for approaching public and private business in the first six months.
Company Summary
“University Patents matches intellectual property owners with those that can use the technology to create profits that both parties can enjoy.”
University Patents will serve as a technology transfer conduit between universities and the business sector specializing in licensing. University Patents will primarily act as an agent of the university and actively research the possible applications of a patented technology. Using this analysis, it will identify and approach companies in those sectors that may have a use for the technology.
University Patents’ advantage is in the focus of the company. First, by targeting patents that independently could not support a business, University Patents will not compete directly with the venture capital groups. Secondly, University Patent will look for universities where the office of technology has a small or non-existent staff dedicated to licensing. The expertise and network University Patents will develop through the research, promotion, and writing of many licenses a year, will be an asset to these universities who only write an average of six licenses per year.
University Patents will position itself as a partner of the university in the effort to move protected technologies to the private sector. As a partner and intermediary in the negotiation, University Patents will receive a percentage of the annual cash flows provided by the licensing agreement.
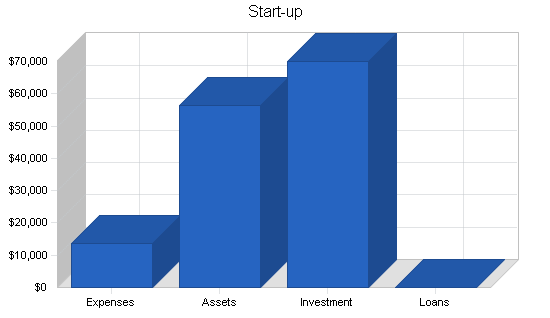
2.1 Start-up Summary
All of the start-up expenses will be financed by the founders either out-of-pocket or through personal debt.
| Start-up Funding | |
| Start-up Expenses to Fund | $13,750 |
| Start-up Assets to Fund | $56,250 |
| Total Funding Required | $70,000 |
| Assets | |
| Non-cash Assets from Start-up | $0 |
| Cash Requirements from Start-up | $56,250 |
| Additional Cash Raised | $0 |
| Cash Balance on Starting Date | $56,250 |
| Total Assets | $56,250 |
| Liabilities and Capital | |
| Liabilities | |
| Current Borrowing | $0 |
| Long-term Liabilities | $0 |
| Accounts Payable (Outstanding Bills) | $0 |
| Other Current Liabilities (interest-free) | $0 |
| Total Liabilities | $0 |
| Capital | |
| Planned Investment | |
| Founders | $70,000 |
| Other | $0 |
| Additional Investment Requirement | $0 |
| Total Planned Investment | $70,000 |
| Loss at Start-up (Start-up Expenses) | ($13,750) |
| Total Capital | $56,250 |
| Total Capital and Liabilities | $56,250 |
| Total Funding | $70,000 |
| Start-up | |
| Requirements | |
| Start-up Expenses | |
| Computers (3) | $3,600 |
| Office Furniture (Home Offices – 3) | $5,000 |
| Business Supplies | $1,200 |
| Legal | $2,500 |
| ISP Installation Fees | $450 |
| Information Sources (Access Fee) | $500 |
| Professional Logo Design | $500 |
| Total Start-up Expenses | $13,750 |
| Start-up Assets | |
| Cash Required | $56,250 |
| Other Current Assets | $0 |
| Long-term Assets | $0 |
| Total Assets | $56,250 |
| Total Requirements | $70,000 |
2.2 Company Ownership
University Patents will be started as a Limited Liability Corporation (LLC) that is fully owned by the three founders: Anderson, Bradbeer, and Sorge. Due to the different geographical locations of customers and to reduce overall costs, we feel that the optimal structure of the company would be an organization with the owners working part-time for University Patents during the first three years in separate locations until the revenue can sustain a full time staff. In this manner, University Patents will be a bootstrap operation funded completely by the founders.
The founders will consider moving to full-time employment earlier than the projected timetable states through venture capital or other means, but will be hesitant to give up much more than 20% of the company ownership.
Services
University Patents offers one main service: brokering patented technologies to the commercial sector. University Patents will focus on technologies that are licensable to multiple businesses but that cannot independently sustain a business. University Patents will use two different approaches to sell technology – brokering patents developed by our client universities and specific technology searches for our commercial customers.
The first approach is a licensee-search service that begins with an analysis of possible applications of the newly developed technology across various business sectors. From this analysis, University Patents develops a list of prospective companies and initiates contact with these companies. Once an interested company is found, University Patents works with the university technology office and the potential licensee to value the technology and price the final agreement. University Patents will receive a percentage of the revenue each new license generates.
The second approach is a specific technology search. This service is available to any business sector clients that are in search of a specific up and coming technology. University Patents will search through the known projects various universities are currently working on to find if a match exists. If an exact match can not be found, University Patents will attempt to match the business with a university having expertise in that specific field for possibly funding a research project. University Patents will be paid a flat finders fee for these services.
3.1 Competitive Comparison
Direct
University offices of technology – Most universities already have an office of technology who to perform this function. However, because most university offices do not have the time and/or resources, nor the contacts in the business sector to effectively move new technology out to commercialization, we believe that University Patents can perform the sales and marketing for them more effectively and cost efficiently than their current system. It appears that 90% of the market uses in-house methods of distribution for licensing.
Competitive Technologies, Inc. – Competitive Technologies (CT) is our direct competitor as a private company that provides this licensing service. CT appears to be sub-licensing the IP and patents from the owners and writing licensing agreements with the end-user. However, in recent years this business model’s weakness has shown itself as they have incurred high legal expenses due to patent protection. CT has a very small percentage of the market and, after one profitable year, had losses exceeding $1 million last year due to the litigation. University Patents will focus strictly on facilitating the creation of a licensing agreement between the university and the licensee and thereby have no responsibility in the enforcement of patent protections.

Indirect
Venture capital groups – Due to venture capitalists’ focused interest in only technologies that will lead to a start-up venture, they are an indirect competitor for University Patents. University Patents focuses on technologies that will not support a business, but rather those that are improvements or supplements to existing technologies, which are not of interest to the VCs. There is a creditable threat though, of a VC group using its well-established network to begin a similar service.
3.2 Emerging
All the emerging Web based sites are passive in nature without active sales, marketing and networking staffs. We believe this will give University Patents the advantage in competition for a client base.
Various Internet marketplaces and exchanges include:
2XFR – 2XFRTM (short for “to transfer”) is the technology transfer/licensing exchange Web property of the PatentCafe® Intellectual Property Network. 2XFR is the only supplements transfer website where licensable technology is listed by manufacturing process, engineering risk and targeted market segment. Unlike commissioned or transaction fee-based exchanges, 2XFR does not involve itself in the business affairs; there’s no broker’s commission, no intervention, no software license fees.
Pl-x.com – PLX Systems Incorporated is an enterprise-wide, intellectual property valuation and lifecycle management software. The company’s offerings include software for financial management of intellectual assets, IP valuation solutions, IP content management and market data services.
Yet2.com – Headquartered in Cambridge, Massachusetts, with offices in Nevada, The United Kingdom and Japan, yet2.com has created the first global marketplace for the exchange of intellectual assets. At yet2.com, inventions are listed, licensed, sold and ultimately applied. Clients include corporations like Boeing, DuPont, Procter & Gamble, and others, which collectively represent 10 percent of all commercial R&D spending.
TechEx.com – TechEx is a network of research and licensing professionals in the biomedical industry. TechEx offers an online technology Exchange® where members can identify and introduce technology and intellectual property that is available for partnering. TechEx is a members-only system and is restricted to approved users. There are three types of participants:
- Licensing professionals from research institutions.
- Corporate licensing professionals capable of bringing early stage inventions to market, or otherwise providing significant value-added development.
- Venture capitalists capable of providing financial assistance to commercialization efforts.
PatentAuction.com – PatentAuction.com is an intellectual properties auction on the Web. Auctions include licensing or selling of patents, trademarks, copyrights, businesses, means and methods of doing business, books, music, and games.
Market Analysis Summary
Market size
The Association of University Technology Managers (AUTM) surveys all universities yearly pertaining to IP related issues. One hundred and ninety (190) U.S. universities (the majority of which are in our target segment) responded to the 2000 survey revealing the following data:
Patents
- 13,032 invention disclosures
- 6,375 New U.S. patent applications (15% increase over 1999)
- 3,764 U.S. patents issued (3% increase over 1999)
- 2.4% of all new patents issued are to academic institutions
The above patents generated the following data on licenses:
- 4,362 new licenses in Year 2000 (11% increase over 1999)
- 50% of new licenses were exclusive, 50% were non-exclusive
License income for FY2000:
- 9,059 of the 20,968 active licenses yielded income (43%)
- These active licenses generated $1.26 billion of users in 2000
- 125 (.6%) licenses generated in excess of $1,000,000
- 57% of income is from running royalties
- 13% of income is from cashed in equity
- 30% of income is from other types of income (i.e., one time fees)
Data from the survey, indicates that the 190 reporting institutions spent $29.5 billion on research this year. Total research expenditures for each institution increased by approximately $474 million for the year. The total number of new patent applications submitted in 2000 increase 15% from the previous year with a 3% growth to 3,764 in total patents granted.
This continuing growth in funding and the trend of increased numbers of new patents and licenses each year, the need for a licensing service should only grow.
4.1 Market Segmentation
There are approximately 2,920 institutions of higher learning within the U.S. of that number, 1,106 are two-year city/community colleges, 1,590 are smaller four-year colleges and universities and 224 are major four-year universities. It is in the four-year universities that the majority of research is done.
52% of universities responding to the Association of University Technology Managers’ (AUTM) Licensing Survey: FY2000, report research expenses of less than $100 million. Additionally, 142 (mostly large universities) of the U.S. universities surveyed also reported only 479 full-time employees dedicated to licensing efforts.
Providing the respondents are a representative set of the university system as a whole, there are ~940 U.S. institutions spending less than $100 million on research, the majority of which have less than two individuals dedicated to creating licensing opportunities. These are also the most likely to have smaller staffs available to create licensing opportunities and therefore prime targets for University Patents.
The universities with research budgets under $100 million make up 61% of the institutions generating license revenues up to $5 million per year. Therefore, though these universities have less chance of generating a high value license, they are still generating a great deal of revenue.
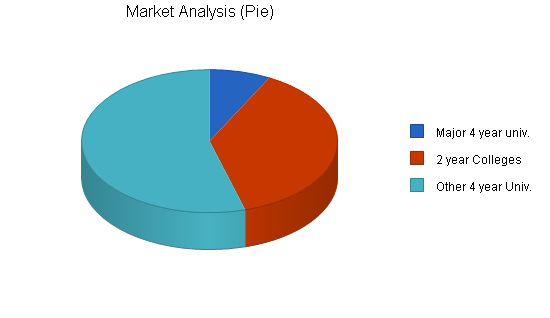
| Market Analysis | |||||||
| Year 1 | Year 2 | Year 3 | Year 4 | Year 5 | |||
| Potential Customers | Growth | CAGR | |||||
| Major 4 year univ. | 3% | 224 | 231 | 238 | 245 | 252 | 2.99% |
| 2 year Colleges | 3% | 1,106 | 1,139 | 1,173 | 1,208 | 1,244 | 2.98% |
| Other 4 year Univ. | 3% | 1,590 | 1,638 | 1,687 | 1,738 | 1,790 | 3.01% |
| Total | 3.00% | 2,920 | 3,008 | 3,098 | 3,191 | 3,286 | 3.00% |
4.2 Target Market Segment Strategy
With University Patents’ primary customers being universities, we will be encroaching on the responsibilities of their own offices of technology/research. However, through contacting the University of Notre Dame, Indiana University, Purdue University, the University of Idaho and researching the offices of technology at the University of Michigan and Michigan State University, we found that most university offices do not have the time and/or resources, nor the contacts in the business sector to effectively move new technology out to commercialization.
Strategy and Implementation Summary
University Patents has identified four-year universities with research budgets under $100 million and smaller office of technology staffs as the primary target market. They are located throughout the geographic U.S. and these universities are the major source of research and patents awarded to higher-learning institutions in the U.S. There are approximately 940 institutions in this classification. University Patents will position itself not as a competitor to these universities’ offices of technology, but rather as a service provider and partner. As their partner, University Patents will use its network of business contacts to search out various uses of the new technology and customers in these fields willing to become licensees. Once a potential licensee is found, University Patents will take a mediator position and using our license calculation methods, provide a base starting range for negotiations.
5.1 Competitive Edge
University Patents’ initial competitive advantage will be its reduced cost structure. University Patents will be able to service multiple colleges and universities at a cost comparable to what each school would have to pay to effectively provide these services to only themselves. By spreading operating expenses over multiple clients, University Patents will create a competitive advantage over university technology offices.
Once University Patents has established itself, an additional competitive advantage will be its reputation for service to both the research institutions and commercial businesses. Universities will be able to contact University Patents and know that within weeks they will have a list of prospective licensees and contacts at each business. Businesses will be able to contact University Patents and know that our database will contain information about our client universities’ research projects available for licensing. University Patents will be the company to call by parties on both sides of the transaction. This is extremely important because these will be the only barriers to entry into the market.
University Patents will not bring the actual license writing in-house, as that would both entail further hiring of legal resources, which is not a core competency of this company, and possibly require University Patents to litigate in cases of patent infringement and/or license enforcement. University Patents will remain a patent broker.
5.2 Marketing Strategy
University Patents will initially target colleges and universities that have a current supply of marketable patents but a small office of technology (~five staff members of less). During the first year, University Patents would like to have at least four institutions from which to license patents. The benefits that University Patents will focus on providing these institutions are: income from previously dormant patents, status and recognition for their research, and a cost effective way to transfer new technologies to the marketplace.
Initial contact to universities will be made through references from the University of Notre Dame Office of Research or other similar departments. This will provide the credibility that University Patents will need in the start-up phase of business. Contacts with commercial business will be made through any means necessary, as University Patents will begin compiling a database of contacts within multiple industries. It is at this point where we believe the technology and the developer will help with the eventual sale of the license. Assuming University Patents has a desirable technology to sell, the licensing income will soon follow.
Once University Patents has established itself as a legitimate player in the marketplace, University Patents expects to fund a full-time staff. University Patents will expand the number of universities that it will target and will be able to promote the network it has recently established. To these new customers, University Patents will provide value on two different levels. First, the network of private industry contacts will decrease the time-to-license and the number of licenses possible. Secondly, by using University Patents as an outsourcing resource, the universities can avoid the costs of a full-time staff.
The future vision for University Patents includes regional offices, each with their own expertise, such as pharmaceutical/chemistry, electronics, computer sciences, and etc. This allows each office to provide a local point of contact to University Patents but also to avoid the duplication of services that would arise if it tried to service all industries in each office.
5.3 Sales Strategy
University Patents will use the detailed information provided by the technology analysis to create a list of possible licensees. Using any personal contacts in the industry, we will make initial contact to set up a more formal meeting. Even for those contacts that do not become licensees, we will use the contact time for both contact mining for further possible license outlets and attempt to set up an informal relationship for future information gathering opportunities and licensee searches.
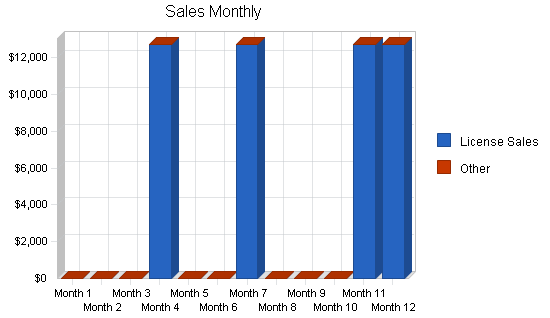
5.3.1 Sales Forecast
University Patents is planning on an initial sales of four licenses written during Year 1. During Year 2, eight new licenses will be written and in Year 3, 16 new licenses. Years 4 and 5 expect growth of 13 and 11 additional new licenses per year respectively. This is possible as management begins concentrating on this business in a full-time respect.
- Income per license = $12,750
- First year sales = 4 licenses

| Sales Forecast | |||||
| Year 1 | Year 2 | Year 3 | Year 4 | Year 5 | |
| Sales | |||||
| License Sales | $51,000 | $102,000 | $204,000 | $369,750 | $510,000 |
| Other | $0 | $0 | $0 | $0 | $0 |
| Total Sales | $51,000 | $102,000 | $204,000 | $369,750 | $510,000 |
| Direct Cost of Sales | Year 1 | Year 2 | Year 3 | Year 4 | Year 5 |
| Travel Cost Per License | $8,400 | $16,800 | $25,200 | $37,800 | $50,400 |
| Demo Model | $4,000 | $8,000 | $12,000 | $18,000 | $24,000 |
| Legal | $4,000 | $8,000 | $12,000 | $18,000 | $24,000 |
| Subtotal Direct Cost of Sales | $16,400 | $32,800 | $49,200 | $73,800 | $98,400 |
5.4 Milestones
- Four patents written in first year.
- Twelve active patents by end of Year 2 (this will provide University Patents with a positive cash flow for the fiscal year).
- Twenty nine active patents by end of Year 4 (provides enough future to sustain full-time employment for founders).
Management Summary
Advisory Board
Mr. Michael Edwards, ND Office of Technology. Mr. Edwards had experience with technology transfer between the university and the private sector. He also has experience with licensing patents and negotiations. There is a potential conflict of interest with being a future customer.
Mr. James O’Brien, lawyer and ND professor. Mr. O’Brien has expertise with intellectual property rights.
Mr. Jeffrey Bernel, ND Professor and Gigot Center Advisor. Mr. Bernel has experience as a start-up business advisor and general management expertise. He also brings a valuable perspective from the manufacturer sector, a group that we hope to include in future customers.
Advisory Board Gaps
Technology Application: An individual with commercial network contacts from prior work in this field.
Business-to-Business Marketing Advisor: Unidentified Sales/Marketing Representative.
6.1 Management Team
Tom Bradbeer, president, Southwest region director and founding partner. Tom brings nine years of high-tech experience with Intel Corp including time in project management, database management, Web application development and customer support roles in both the 3-Business Group and Logistics Division. Due to his high-tech background, he will also be performing IT functions as University Patents grows in the first years. Tom has also coached Junior Olympic Volleyball teams over the past eight years including two years as head coach and fulfilled the role of mentor to other coaches in the organization. Tom is completing his MBA at the University of Notre Dame and earned his BS in finance at Arizona State University.
Jason Sorge, VP of market/sales, Northwest/Midwest region director and founding partner. Jason brings two years experience in finance from Agilent Technologies where he was instrumental in creating financial models to forecast expenses, training of corporate personnel in asset accounting procedures and research and analysis of financial data supporting forecasting for both the site facility and the multi-national marketing groups. Jason was also influential in the development of a centralized customer service center at the University of Idaho. Beyond his VP responsibilities, Jason will also maintain University Patents’ relationship with the retained law firms. He is currently completing his MBA at the University of Notre Dame and holds a BS in finance from the University of Idaho.
Matt Anderson, VP of finance/accounting, Southeast region director and founding partner. Matt brings three years of management in financial services, during which he was responsible for maintaining the service relationships for 401(k) plans in excess of $2 billion at Merrill Lynch. Matt managed the Merrill Lynch stock options trading center for two years during which it received the FCall Center Magazine’s “2001 Call Center of the Year” award and was the winner of the Merrill Lynch Quality Cup. He holds both NASD Series 7 and 63 licenses and in his off time volunteers as a Certified Youth Minister for local parishes, which has included planning and facilitating retreats. Matt is currently completing his MBA at the University of Notre Dame and holds a BS in business administration from the University of Central Florida.
6.2 Management Team Gaps
The gaps in the management team are currently being addressed through the Advisory Board as shown below, and will continue to be until the cash flow allows the hiring of employees to fill those capacities. The identifiable gaps are in specialized technical knowledge, legal expertise, and B2B marketing.
Technical Knowledge: The current management team does not include an individual with a engineering/scientific background which would help with understanding the patented currently and effectively market it.
Legal Expertise: The current management team does not include an individual with a legal background. This could impact the companies ability to recognize possible forms of patent infringement.
Marketing Experience: The current management team does not include an individual with extensive B2B marketing experience.
6.3 Personnel Plan
It is expected that for the first four years, only the founding members will be employed by University Patents. Starting in Year 4, the number of patents to research will increase to the point that part-time or full-time help is needed to allow management face time with the universities and prospective licensees.
| Personnel Plan | |||||
| Year 1 | Year 2 | Year 3 | Year 4 | Year 5 | |
| Total Payroll | $60,000 | $63,000 | $66,150 | $210,000 | $255,500 |
| Other | $0 | $0 | $0 | $0 | $0 |
| Total People | 4 | 4 | 4 | 4 | 5 |
| Total Payroll | $60,000 | $63,000 | $66,150 | $210,000 | $255,500 |
Financial Plan
The following is the Financial Plan for University Patents.
7.1 Important Assumptions
- University Patents will operate with regional offices out of the founders’ homes, without a formal brick and mortar location, into Year 4.
- The founders will be the only employees and work on a part-time basis during Years 1-3.
- The average license value to University Patents will be $12,750 (15% of the predicted $85,000 average revenue to the university).
- There will be a 10% loss of revenue from year to year due to un-renewed licenses.
| General Assumptions | |||||
| Year 1 | Year 2 | Year 3 | Year 4 | Year 5 | |
| Plan Month | 1 | 2 | 3 | 4 | 5 |
| Current Interest Rate | 10.00% | 10.00% | 10.00% | 10.00% | 10.00% |
| Long-term Interest Rate | 10.00% | 10.00% | 10.00% | 10.00% | 10.00% |
| Tax Rate | 30.00% | 30.00% | 30.00% | 30.00% | 30.00% |
| Other | 0 | 0 | 0 | 0 | 0 |
7.2 Break-even Analysis
The break-even point for University Patents is shown below.

| Break-even Analysis | |
| Monthly Revenue Break-even | $9,232 |
| Assumptions: | |
| Average Percent Variable Cost | 32% |
| Estimated Monthly Fixed Cost | $6,263 |
7.3 Projected Profit and Loss
The following is the Projected Profit and Loss for University Patents.


| Pro Forma Profit and Loss | |||||
| Year 1 | Year 2 | Year 3 | Year 4 | Year 5 | |
| Sales | $51,000 | $102,000 | $204,000 | $369,750 | $510,000 |
| Direct Cost of Sales | $16,400 | $32,800 | $49,200 | $73,800 | $98,400 |
| Other | $0 | $0 | $0 | $0 | $0 |
| Total Cost of Sales | $16,400 | $32,800 | $49,200 | $73,800 | $98,400 |
| Gross Margin | $34,600 | $69,200 | $154,800 | $295,950 | $411,600 |
| Gross Margin % | 67.84% | 67.84% | 75.88% | 80.04% | 80.71% |
| Expenses | |||||
| Payroll | $60,000 | $63,000 | $66,150 | $210,000 | $255,500 |
| Sales and Marketing and Other Expenses | $1,500 | $1,500 | $1,500 | $1,500 | $1,500 |
| Depreciation | $0 | $0 | $0 | $0 | $0 |
| Computer Equipment | $0 | $0 | $0 | $0 | $600 |
| Utilities | $1,000 | $1,050 | $1,103 | $1,158 | $1,216 |
| Insurance | $1,000 | $1,050 | $1,103 | $1,158 | $1,216 |
| Payroll Taxes | $9,000 | $9,450 | $9,923 | $31,500 | $38,325 |
| ISP Access | $2,160 | $2,268 | $2,381 | $2,500 | $2,625 |
| Information Services | $500 | $525 | $551 | $579 | $608 |
| Total Operating Expenses | $75,160 | $78,843 | $82,711 | $248,395 | $301,590 |
| Profit Before Interest and Taxes | ($40,560) | ($9,643) | $72,089 | $47,555 | $110,010 |
| EBITDA | ($40,560) | ($9,643) | $72,089 | $47,555 | $110,010 |
| Interest Expense | $0 | $0 | $0 | $0 | $0 |
| Taxes Incurred | $0 | $0 | $21,627 | $14,267 | $33,003 |
| Net Profit | ($40,560) | ($9,643) | $50,462 | $33,289 | $77,007 |
| Net Profit/Sales | -79.53% | -9.45% | 24.74% | 9.00% | 15.10% |
7.4 Projected Cash Flow
The following is the Projected Cash Flow for University Patents.

| Pro Forma Cash Flow | |||||
| Year 1 | Year 2 | Year 3 | Year 4 | Year 5 | |
| Cash Received | |||||
| Cash from Operations | |||||
| Cash Sales | $12,750 | $25,500 | $51,000 | $92,438 | $127,500 |
| Cash from Receivables | $19,444 | $57,694 | $115,388 | $216,192 | $330,783 |
| Subtotal Cash from Operations | $32,194 | $83,194 | $166,388 | $308,630 | $458,283 |
| Additional Cash Received | |||||
| Sales Tax, VAT, HST/GST Received | $0 | $0 | $0 | $0 | $0 |
| New Current Borrowing | $0 | $0 | $0 | $0 | $0 |
| New Other Liabilities (interest-free) | $0 | $0 | $0 | $0 | $0 |
| New Long-term Liabilities | $0 | $0 | $0 | $0 | $0 |
| Sales of Other Current Assets | $0 | $0 | $0 | $0 | $0 |
| Sales of Long-term Assets | $0 | $0 | $0 | $0 | $0 |
| New Investment Received | $30,000 | $30,000 | $0 | $0 | $0 |
| Subtotal Cash Received | $62,194 | $113,194 | $166,388 | $308,630 | $458,283 |
| Expenditures | Year 1 | Year 2 | Year 3 | Year 4 | Year 5 |
| Expenditures from Operations | |||||
| Cash Spending | $60,000 | $63,000 | $66,150 | $210,000 | $255,500 |
| Bill Payments | $27,360 | $48,845 | $84,203 | $123,250 | $173,299 |
| Subtotal Spent on Operations | $87,360 | $111,845 | $150,353 | $333,250 | $428,799 |
| Additional Cash Spent | |||||
| Sales Tax, VAT, HST/GST Paid Out | $0 | $0 | $0 | $0 | $0 |
| Principal Repayment of Current Borrowing | $0 | $0 | $0 | $0 | $0 |
| Other Liabilities Principal Repayment | $0 | $0 | $0 | $0 | $0 |
| Long-term Liabilities Principal Repayment | $0 | $0 | $0 | $0 | $0 |
| Purchase Other Current Assets | $0 | $0 | $0 | $0 | $0 |
| Purchase Long-term Assets | $0 | $0 | $0 | $0 | $0 |
| Dividends | $0 | $0 | $0 | $0 | $0 |
| Subtotal Cash Spent | $87,360 | $111,845 | $150,353 | $333,250 | $428,799 |
| Net Cash Flow | ($25,166) | $1,349 | $16,034 | ($24,620) | $29,484 |
| Cash Balance | $31,084 | $32,433 | $48,467 | $23,847 | $53,331 |
7.5 Projected Balance Sheet
The following is the Projected Balance Sheet for University Patents.
| Pro Forma Balance Sheet | |||||
| Year 1 | Year 2 | Year 3 | Year 4 | Year 5 | |
| Assets | |||||
| Current Assets | |||||
| Cash | $31,084 | $32,433 | $48,467 | $23,847 | $53,331 |
| Accounts Receivable | $18,806 | $37,613 | $75,225 | $136,345 | $188,063 |
| Other Current Assets | $0 | $0 | $0 | $0 | $0 |
| Total Current Assets | $49,890 | $70,045 | $123,692 | $160,192 | $241,393 |
| Long-term Assets | |||||
| Long-term Assets | $0 | $0 | $0 | $0 | $0 |
| Accumulated Depreciation | $0 | $0 | $0 | $0 | $0 |
| Total Long-term Assets | $0 | $0 | $0 | $0 | $0 |
| Total Assets | $49,890 | $70,045 | $123,692 | $160,192 | $241,393 |
| Liabilities and Capital | Year 1 | Year 2 | Year 3 | Year 4 | Year 5 |
| Current Liabilities | |||||
| Accounts Payable | $4,200 | $3,998 | $7,183 | $10,394 | $14,588 |
| Current Borrowing | $0 | $0 | $0 | $0 | $0 |
| Other Current Liabilities | $0 | $0 | $0 | $0 | $0 |
| Subtotal Current Liabilities | $4,200 | $3,998 | $7,183 | $10,394 | $14,588 |
| Long-term Liabilities | $0 | $0 | $0 | $0 | $0 |
| Total Liabilities | $4,200 | $3,998 | $7,183 | $10,394 | $14,588 |
| Paid-in Capital | $100,000 | $130,000 | $130,000 | $130,000 | $130,000 |
| Retained Earnings | ($13,750) | ($54,310) | ($63,953) | ($13,491) | $19,798 |
| Earnings | ($40,560) | ($9,643) | $50,462 | $33,289 | $77,007 |
| Total Capital | $45,690 | $66,047 | $116,509 | $149,798 | $226,805 |
| Total Liabilities and Capital | $49,890 | $70,045 | $123,692 | $160,192 | $241,393 |
| Net Worth | $45,690 | $66,047 | $116,509 | $149,798 | $226,805 |
7.6 Business Ratios
Business ratios for the years of this plan are shown below. Industry profile ratios based on the Standard Industrial Classification (SIC) code 8748, [Business Consulting, nec], are shown for comparison.
| Ratio Analysis | ||||||
| Year 1 | Year 2 | Year 3 | Year 4 | Year 5 | Industry Profile | |
| Sales Growth | 0.00% | 100.00% | 100.00% | 81.25% | 37.93% | 8.18% |
| Percent of Total Assets | ||||||
| Accounts Receivable | 37.70% | 53.70% | 60.82% | 85.11% | 77.91% | 29.59% |
| Other Current Assets | 0.00% | 0.00% | 0.00% | 0.00% | 0.00% | 41.37% |
| Total Current Assets | 100.00% | 100.00% | 100.00% | 100.00% | 100.00% | 75.36% |
| Long-term Assets | 0.00% | 0.00% | 0.00% | 0.00% | 0.00% | 24.64% |
| Total Assets | 100.00% | 100.00% | 100.00% | 100.00% | 100.00% | 100.00% |
| Current Liabilities | 8.42% | 5.71% | 5.81% | 6.49% | 6.04% | 31.49% |
| Long-term Liabilities | 0.00% | 0.00% | 0.00% | 0.00% | 0.00% | 16.85% |
| Total Liabilities | 8.42% | 5.71% | 5.81% | 6.49% | 6.04% | 48.34% |
| Net Worth | 91.58% | 94.29% | 94.19% | 93.51% | 93.96% | 51.66% |
| Percent of Sales | ||||||
| Sales | 100.00% | 100.00% | 100.00% | 100.00% | 100.00% | 100.00% |
| Gross Margin | 67.84% | 67.84% | 75.88% | 80.04% | 80.71% | 100.00% |
| Selling, General & Administrative Expenses | 147.37% | 77.30% | 51.15% | 71.04% | 65.61% | 82.59% |
| Advertising Expenses | #VALUE! | #VALUE! | #VALUE! | #VALUE! | #VALUE! | 1.16% |
| Profit Before Interest and Taxes | -79.53% | -9.45% | 35.34% | 12.86% | 21.57% | 1.47% |
| Main Ratios | ||||||
| Current | 11.88 | 17.52 | 17.22 | 15.41 | 16.55 | 1.93 |
| Quick | 11.88 | 17.52 | 17.22 | 15.41 | 16.55 | 1.50 |
| Total Debt to Total Assets | 8.42% | 5.71% | 5.81% | 6.49% | 6.04% | 3.09% |
| Pre-tax Return on Net Worth | -88.77% | -14.60% | 61.87% | 31.75% | 48.50% | 59.56% |
| Pre-tax Return on Assets | -81.30% | -13.77% | 58.28% | 29.69% | 45.57% | 7.63% |
| Additional Ratios | Year 1 | Year 2 | Year 3 | Year 4 | Year 5 | |
| Net Profit Margin | -79.53% | -9.45% | 24.74% | 9.00% | 15.10% | n.a |
| Return on Equity | -88.77% | -14.60% | 43.31% | 22.22% | 33.95% | n.a |
| Activity Ratios | ||||||
| Accounts Receivable Turnover | 2.03 | 2.03 | 2.03 | 2.03 | 2.03 | n.a |
| Collection Days | 52 | 135 | 135 | 139 | 155 | n.a |
| Accounts Payable Turnover | 7.51 | 12.17 | 12.17 | 12.17 | 12.17 | n.a |
| Payment Days | 27 | 31 | 23 | 25 | 26 | n.a |
| Total Asset Turnover | 1.02 | 1.46 | 1.65 | 2.31 | 2.11 | n.a |
| Debt Ratios | ||||||
| Debt to Net Worth | 0.09 | 0.06 | 0.06 | 0.07 | 0.06 | n.a |
| Current Liab. to Liab. | 1.00 | 1.00 | 1.00 | 1.00 | 1.00 | n.a |
| Liquidity Ratios | ||||||
| Net Working Capital | $45,690 | $66,047 | $116,509 | $149,798 | $226,805 | n.a |
| Interest Coverage | 0.00 | 0.00 | 0.00 | 0.00 | 0.00 | n.a |
| Additional Ratios | ||||||
| Assets to Sales | 0.98 | 0.69 | 0.61 | 0.43 | 0.47 | n.a |
| Current Debt/Total Assets | 8% | 6% | 6% | 6% | 6% | n.a |
| Acid Test | 7.40 | 8.11 | 6.75 | 2.29 | 3.66 | n.a |
| Sales/Net Worth | 1.12 | 1.54 | 1.75 | 2.47 | 2.25 | n.a |
| Dividend Payout | 0.00 | 0.00 | 0.00 | 0.00 | 0.00 | n.a |
Appendix
| Sales Forecast | |||||||||||||
| Month 1 | Month 2 | Month 3 | Month 4 | Month 5 | Month 6 | Month 7 | Month 8 | Month 9 | Month 10 | Month 11 | Month 12 | ||
| Sales | |||||||||||||
| License Sales | 0% | $0 | $0 | $0 | $12,750 | $0 | $0 | $12,750 | $0 | $0 | $0 | $12,750 | $12,750 |
| Other | 0% | $0 | $0 | $0 | $0 | $0 | $0 | $0 | $0 | $0 | $0 | $0 | $0 |
| Total Sales | $0 | $0 | $0 | $12,750 | $0 | $0 | $12,750 | $0 | $0 | $0 | $12,750 | $12,750 | |
| Direct Cost of Sales | Month 1 | Month 2 | Month 3 | Month 4 | Month 5 | Month 6 | Month 7 | Month 8 | Month 9 | Month 10 | Month 11 | Month 12 | |
| Travel Cost Per License | $700 | $700 | $700 | $700 | $700 | $700 | $700 | $700 | $700 | $700 | $700 | $700 | |
| Demo Model | $0 | $0 | $0 | $1,000 | $0 | $0 | $1,000 | $0 | $0 | $0 | $1,000 | $1,000 | |
| Legal | $0 | $0 | $0 | $1,000 | $0 | $0 | $1,000 | $0 | $0 | $0 | $1,000 | $1,000 | |
| Subtotal Direct Cost of Sales | $700 | $700 | $700 | $2,700 | $700 | $700 | $2,700 | $700 | $700 | $700 | $2,700 | $2,700 | |
| Personnel Plan | |||||||||||||
| Month 1 | Month 2 | Month 3 | Month 4 | Month 5 | Month 6 | Month 7 | Month 8 | Month 9 | Month 10 | Month 11 | Month 12 | ||
| Total Payroll | 0% | $5,000 | $5,000 | $5,000 | $5,000 | $5,000 | $5,000 | $5,000 | $5,000 | $5,000 | $5,000 | $5,000 | $5,000 |
| Other | 0% | $0 | $0 | $0 | $0 | $0 | $0 | $0 | $0 | $0 | $0 | $0 | $0 |
| Total People | 4 | 4 | 4 | 4 | 4 | 4 | 4 | 4 | 4 | 4 | 4 | 4 | |
| Total Payroll | $5,000 | $5,000 | $5,000 | $5,000 | $5,000 | $5,000 | $5,000 | $5,000 | $5,000 | $5,000 | $5,000 | $5,000 | |
| Pro Forma Profit and Loss | |||||||||||||
| Month 1 | Month 2 | Month 3 | Month 4 | Month 5 | Month 6 | Month 7 | Month 8 | Month 9 | Month 10 | Month 11 | Month 12 | ||
| Sales | $0 | $0 | $0 | $12,750 | $0 | $0 | $12,750 | $0 | $0 | $0 | $12,750 | $12,750 | |
| Direct Cost of Sales | $700 | $700 | $700 | $2,700 | $700 | $700 | $2,700 | $700 | $700 | $700 | $2,700 | $2,700 | |
| Other | $0 | $0 | $0 | $0 | $0 | $0 | $0 | $0 | $0 | $0 | $0 | $0 | |
| Total Cost of Sales | $700 | $700 | $700 | $2,700 | $700 | $700 | $2,700 | $700 | $700 | $700 | $2,700 | $2,700 | |
| Gross Margin | ($700) | ($700) | ($700) | $10,050 | ($700) | ($700) | $10,050 | ($700) | ($700) | ($700) | $10,050 | $10,050 | |
| Gross Margin % | 0.00% | 0.00% | 0.00% | 78.82% | 0.00% | 0.00% | 78.82% | 0.00% | 0.00% | 0.00% | 78.82% | 78.82% | |
| Expenses | |||||||||||||
| Payroll | $5,000 | $5,000 | $5,000 | $5,000 | $5,000 | $5,000 | $5,000 | $5,000 | $5,000 | $5,000 | $5,000 | $5,000 | |
| Sales and Marketing and Other Expenses | $0 | $0 | $0 | $500 | $0 | $0 | $0 | $500 | $0 | $0 | $0 | $500 | |
| Depreciation | $0 | $0 | $0 | $0 | $0 | $0 | $0 | $0 | $0 | $0 | $0 | $0 | |
| Computer Equipment | $0 | $0 | $0 | $0 | $0 | $0 | $0 | $0 | $0 | $0 | $0 | $0 | |
| Utilities | $80 | $80 | $80 | $80 | $85 | $85 | $85 | $85 | $85 | $85 | $85 | $85 | |
| Insurance | $80 | $80 | $80 | $80 | $85 | $85 | $85 | $85 | $85 | $85 | $85 | $85 | |
| Payroll Taxes | 15% | $750 | $750 | $750 | $750 | $750 | $750 | $750 | $750 | $750 | $750 | $750 | $750 |
| ISP Access | 15% | $180 | $180 | $180 | $180 | $180 | $180 | $180 | $180 | $180 | $180 | $180 | $180 |
| Information Services | $40 | $40 | $40 | $40 | $40 | $40 | $40 | $40 | $45 | $45 | $45 | $45 | |
| Total Operating Expenses | $6,130 | $6,130 | $6,130 | $6,630 | $6,140 | $6,140 | $6,140 | $6,640 | $6,145 | $6,145 | $6,145 | $6,645 | |
| Profit Before Interest and Taxes | ($6,830) | ($6,830) | ($6,830) | $3,420 | ($6,840) | ($6,840) | $3,910 | ($7,340) | ($6,845) | ($6,845) | $3,905 | $3,405 | |
| EBITDA | ($6,830) | ($6,830) | ($6,830) | $3,420 | ($6,840) | ($6,840) | $3,910 | ($7,340) | ($6,845) | ($6,845) | $3,905 | $3,405 | |
| Interest Expense | $0 | $0 | $0 | $0 | $0 | $0 | $0 | $0 | $0 | $0 | $0 | $0 | |
| Taxes Incurred | $0 | $0 | $0 | $0 | $0 | $0 | $0 | $0 | $0 | $0 | $0 | $0 | |
| Net Profit | ($6,830) | ($6,830) | ($6,830) | $3,420 | ($6,840) | ($6,840) | $3,910 | ($7,340) | ($6,845) | ($6,845) | $3,905 | $3,405 | |
| Net Profit/Sales | 0.00% | 0.00% | 0.00% | 26.82% | 0.00% | 0.00% | 30.67% | 0.00% | 0.00% | 0.00% | 30.63% | 26.71% | |
| Pro Forma Cash Flow | |||||||||||||
| Month 1 | Month 2 | Month 3 | Month 4 | Month 5 | Month 6 | Month 7 | Month 8 | Month 9 | Month 10 | Month 11 | Month 12 | ||
| Cash Received | |||||||||||||
| Cash from Operations | |||||||||||||
| Cash Sales | $0 | $0 | $0 | $3,188 | $0 | $0 | $3,188 | $0 | $0 | $0 | $3,188 | $3,188 | |
| Cash from Receivables | $0 | $0 | $0 | $0 | $319 | $9,244 | $0 | $319 | $9,244 | $0 | $0 | $319 | |
| Subtotal Cash from Operations | $0 | $0 | $0 | $3,188 | $319 | $9,244 | $3,188 | $319 | $9,244 | $0 | $3,188 | $3,506 | |
| Additional Cash Received | |||||||||||||
| Sales Tax, VAT, HST/GST Received | 0.00% | $0 | $0 | $0 | $0 | $0 | $0 | $0 | $0 | $0 | $0 | $0 | $0 |
| New Current Borrowing | $0 | $0 | $0 | $0 | $0 | $0 | $0 | $0 | $0 | $0 | $0 | $0 | |
| New Other Liabilities (interest-free) | $0 | $0 | $0 | $0 | $0 | $0 | $0 | $0 | $0 | $0 | $0 | $0 | |
| New Long-term Liabilities | $0 | $0 | $0 | $0 | $0 | $0 | $0 | $0 | $0 | $0 | $0 | $0 | |
| Sales of Other Current Assets | $0 | $0 | $0 | $0 | $0 | $0 | $0 | $0 | $0 | $0 | $0 | $0 | |
| Sales of Long-term Assets | $0 | $0 | $0 | $0 | $0 | $0 | $0 | $0 | $0 | $0 | $0 | $0 | |
| New Investment Received | $0 | $0 | $0 | $0 | $0 | $0 | $0 | $0 | $0 | $30,000 | $0 | $0 | |
| Subtotal Cash Received | $0 | $0 | $0 | $3,188 | $319 | $9,244 | $3,188 | $319 | $9,244 | $30,000 | $3,188 | $3,506 | |
| Expenditures | Month 1 | Month 2 | Month 3 | Month 4 | Month 5 | Month 6 | Month 7 | Month 8 | Month 9 | Month 10 | Month 11 | Month 12 | |
| Expenditures from Operations | |||||||||||||
| Cash Spending | $5,000 | $5,000 | $5,000 | $5,000 | $5,000 | $5,000 | $5,000 | $5,000 | $5,000 | $5,000 | $5,000 | $5,000 | |
| Bill Payments | $61 | $1,830 | $1,830 | $1,913 | $4,247 | $1,840 | $1,907 | $3,790 | $2,324 | $1,845 | $1,912 | $3,862 | |
| Subtotal Spent on Operations | $5,061 | $6,830 | $6,830 | $6,913 | $9,247 | $6,840 | $6,907 | $8,790 | $7,324 | $6,845 | $6,912 | $8,862 | |
| Additional Cash Spent | |||||||||||||
| Sales Tax, VAT, HST/GST Paid Out | $0 | $0 | $0 | $0 | $0 | $0 | $0 | $0 | $0 | $0 | $0 | $0 | |
| Principal Repayment of Current Borrowing | $0 | $0 | $0 | $0 | $0 | $0 | $0 | $0 | $0 | $0 | $0 | $0 | |
| Other Liabilities Principal Repayment | $0 | $0 | $0 | $0 | $0 | $0 | $0 | $0 | $0 | $0 | $0 | $0 | |
| Long-term Liabilities Principal Repayment | $0 | $0 | $0 | $0 | $0 | $0 | $0 | $0 | $0 | $0 | $0 | $0 | |
| Purchase Other Current Assets | $0 | $0 | $0 | $0 | $0 | $0 | $0 | $0 | $0 | $0 | $0 | $0 | |
| Purchase Long-term Assets | $0 | $0 | $0 | $0 | $0 | $0 | $0 | $0 | $0 | $0 | $0 | $0 | |
| Dividends | $0 | $0 | $0 | $0 | $0 | $0 | $0 | $0 | $0 | $0 | $0 | $0 | |
| Subtotal Cash Spent | $5,061 | $6,830 | $6,830 | $6,913 | $9,247 | $6,840 | $6,907 | $8,790 | $7,324 | $6,845 | $6,912 | $8,862 | |
| Net Cash Flow | ($5,061) | ($6,830) | ($6,830) | ($3,726) | ($8,928) | $2,404 | ($3,719) | ($8,471) | $1,920 | $23,155 | ($3,724) | ($5,355) | |
| Cash Balance | $51,189 | $44,359 | $37,529 | $33,803 | $24,875 | $27,279 | $23,559 | $15,088 | $17,008 | $40,164 | $36,439 | $31,084 | |
| Pro Forma Balance Sheet | |||||||||||||
| Month 1 | Month 2 | Month 3 | Month 4 | Month 5 | Month 6 | Month 7 | Month 8 | Month 9 | Month 10 | Month 11 | Month 12 | ||
| Assets | Starting Balances | ||||||||||||
| Current Assets | |||||||||||||
| Cash | $56,250 | $51,189 | $44,359 | $37,529 | $33,803 | $24,875 | $27,279 | $23,559 | $15,088 | $17,008 | $40,164 | $36,439 | $31,084 |
| Accounts Receivable | $0 | $0 | $0 | $0 | $9,563 | $9,244 | $0 | $9,563 | $9,244 | $0 | $0 | $9,563 | $18,806 |
| Other Current Assets | $0 | $0 | $0 | $0 | $0 | $0 | $0 | $0 | $0 | $0 | $0 | $0 | $0 |
| Total Current Assets | $56,250 | $51,189 | $44,359 | $37,529 | $43,366 | $34,119 | $27,279 | $33,122 | $24,332 | $17,008 | $40,164 | $46,002 | $49,890 |
| Long-term Assets | |||||||||||||
| Long-term Assets | $0 | $0 | $0 | $0 | $0 | $0 | $0 | $0 | $0 | $0 | $0 | $0 | $0 |
| Accumulated Depreciation | $0 | $0 | $0 | $0 | $0 | $0 | $0 | $0 | $0 | $0 | $0 | $0 | $0 |
| Total Long-term Assets | $0 | $0 | $0 | $0 | $0 | $0 | $0 | $0 | $0 | $0 | $0 | $0 | $0 |
| Total Assets | $56,250 | $51,189 | $44,359 | $37,529 | $43,366 | $34,119 | $27,279 | $33,122 | $24,332 | $17,008 | $40,164 | $46,002 | $49,890 |
| Liabilities and Capital | Month 1 | Month 2 | Month 3 | Month 4 | Month 5 | Month 6 | Month 7 | Month 8 | Month 9 | Month 10 | Month 11 | Month 12 | |
| Current Liabilities | |||||||||||||
| Accounts Payable | $0 | $1,769 | $1,769 | $1,769 | $4,186 | $1,779 | $1,779 | $3,712 | $2,262 | $1,784 | $1,784 | $3,717 | $4,200 |
| Current Borrowing | $0 | $0 | $0 | $0 | $0 | $0 | $0 | $0 | $0 | $0 | $0 | $0 | $0 |
| Other Current Liabilities | $0 | $0 | $0 | $0 | $0 | $0 | $0 | $0 | $0 | $0 | $0 | $0 | $0 |
| Subtotal Current Liabilities | $0 | $1,769 | $1,769 | $1,769 | $4,186 | $1,779 | $1,779 | $3,712 | $2,262 | $1,784 | $1,784 | $3,717 | $4,200 |
| Long-term Liabilities | $0 | $0 | $0 | $0 | $0 | $0 | $0 | $0 | $0 | $0 | $0 | $0 | $0 |
| Total Liabilities | $0 | $1,769 | $1,769 | $1,769 | $4,186 | $1,779 | $1,779 | $3,712 | $2,262 | $1,784 | $1,784 | $3,717 | $4,200 |
| Paid-in Capital | $70,000 | $70,000 | $70,000 | $70,000 | $70,000 | $70,000 | $70,000 | $70,000 | $70,000 | $70,000 | $100,000 | $100,000 | $100,000 |
| Retained Earnings | ($13,750) | ($13,750) | ($13,750) | ($13,750) | ($13,750) | ($13,750) | ($13,750) | ($13,750) | ($13,750) | ($13,750) | ($13,750) | ($13,750) | ($13,750) |
| Earnings | $0 | ($6,830) | ($13,660) | ($20,490) | ($17,070) | ($23,910) | ($30,750) | ($26,840) | ($34,180) | ($41,025) | ($47,870) | ($43,965) | ($40,560) |
| Total Capital | $56,250 | $49,420 | $42,590 | $35,760 | $39,180 | $32,340 | $25,500 | $29,410 | $22,070 | $15,225 | $38,380 | $42,285 | $45,690 |
| Total Liabilities and Capital | $56,250 | $51,189 | $44,359 | $37,529 | $43,366 | $34,119 | $27,279 | $33,122 | $24,332 | $17,009 | $40,164 | $46,002 | $49,890 |
| Net Worth | $56,250 | $49,420 | $42,590 | $35,760 | $39,180 | $32,340 | $25,500 | $29,410 | $22,070 | $15,225 | $38,380 | $42,285 | $45,690 |


