
Columbia Cleaners
Executive Summary
Columbia Cleaners is a start-up enterprise to be established in Hillsboro, Oregon as a limited liability company owned by J.C. Copperbeech. The company will provide dry cleaning, laundry, and garment alterations, offered with regular home pick-up and delivery services. The company will have a production facility, but will not need a retail shop because of our pick-up and delivery service. However, we will need delivery vans, and customer service trained drivers.
Customers can choose payment either at the time of each delivery, or by monthly credit card billing. At the end of each month we will send statements to each contract customer, itemizing service fees and the charge for the service to their credit cards for payment.
The business provides a new door-to-door dry cleaning, laundry, and alteration service in Hillsboro, OR and surrounding neighborhoods that will surely attract customer attention. Working customers may find this service is convenient for them and want to try it. If they are satisfied with the service quality they will likely become repeat customers. When the patronage happens continuously, they become loyal customers of the service. These customers will recommend Columbia Cleaners to their friends and coworkers. As more and more customers use this service, Columbia Cleaners’ image is enhanced and we will gain more and more market share.
Sales forecast gradually increase over the first year and comprise total sales of $324,700. We project modest net profits the first year. Our second and third year net profits are expected to grow substantially.

1.1 Objectives
In providing laundry and garment alteration services for customers in the Hillsboro area, Columbia Cleaners aims to:
- Establish sustainable business by the end of the first year
- Have first year total sales in excess of $324,000
- Producing net profits
1.2 Mission
We will offer dry cleaning, laundry, and clothing alteration services with free home pickup and delivery. Our high quality and convenience will save time for working customers.
1.3 Keys to Success
- The business is entering the first year of operation, therefore, a comprehensive marketing strategy will be the key to success of the business.
- It is important to remember that the target customers have money and want to be provided high quality service, therefore, they will only use this service if they are entirely satisfied.
- Furthermore, the hours of operation must be convenient and service completion must be timely in order that customers are not harried after a long day working.
Company Summary
Columbia Cleaners is a start-up enterprise to be established as a limited liability company in Hillsboro, OR. The company will provide dry cleaning, laundry, and garment alterations, offered with regular home pick-up and delivery services. The company will have a production facility, but will not need a retail store front because of our pick-up and delivery service. However, we will need delivery vans and customer service trained drivers. Initially, the production facility will be rented. Cleaning equipment will be leased with accompanying maintenance contracts.
Start-up financing will be through owner investment and bank loans, with a line of credit established for operations eventualities.
2.1 Company Ownership
The proposed legal form of business is a limited liability company, wholly owned by its founder J.C. Copperbeech. This is a small business and need not publicly disclose its finances. The registration procedures are quite simple and the business can start operations as soon as possible. The owner/founder will be the director and will initially handle the bookkeeping responsibilities.
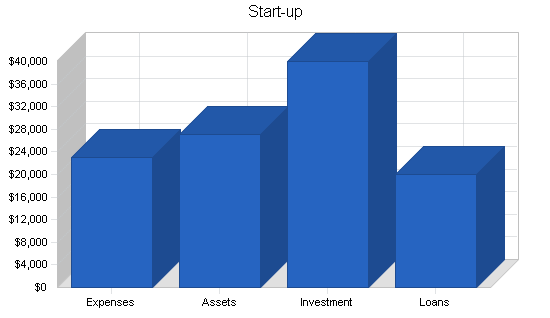
2.2 Start-up Summary
Startup expenses, funded through a combination of owner’s equity capital and a commercial loan, are summarized in the table below.
Leasing equipment: Buying new machines costs approximately $50,000 as opposed to leasing which costs $20,000 per year including maintenance. Evaluating the leasing solution shows NPV higher than that of buying machines. Moreover, the business is new and has less experience in maintenance and repair of machine breakdown, therefore the optimal solution is leasing machines. The following machines will be leased:
- 1 Washer – 38 lb capacity, high spin, microprocessor control, electric heat
- 1 Tumble dryer – 40 lb capacity, stainless steel drum and gas heated
- 1 Dry cleaning machine – 25 lb
- 1 Roller Iron 40 x 12 inch, variable speed and vacuum exhauster
- 1 Ironing table with steaming vacuum board, integral 2 gallon boiler, iron, water pump and light
Capital plan: The owner will invest $40,000 in the business. Additional capital for the business in the amount of $20,000 will be borrowed from a bank.
- Buying a van, and office/facilities equipment (computer, printer, fax, telephone instrument, tables, chairs, shelving, work tables, racks, etc.) and initial leasing of laundry machines: approx. $27,000
- Buying another van in April: $10,000 (see the Cash Flow Table later in the document)
Loan: Lending plan has to be completed and submitted to the bank 6 months before starting the business. Loan will be needed two months in advance. Annual interest of 10% has to be paid on the long-term loans secured with fixed assets.
| Start-up | |
| Requirements | |
| Start-up Expenses | |
| Legal | $1,000 |
| Stationery etc. | $1,200 |
| Brochures | $3,000 |
| Recruitment & training | $1,000 |
| Insurance | $700 |
| Rent | $1,200 |
| Utilities | $700 |
| Leased equipment | $1,667 |
| Expensed equipment | $10,000 |
| Other | $2,533 |
| Total Start-up Expenses | $23,000 |
| Start-up Assets | |
| Cash Required | $10,000 |
| Start-up Inventory | $2,000 |
| Other Current Assets | $0 |
| Long-term Assets | $15,000 |
| Total Assets | $27,000 |
| Total Requirements | $50,000 |
Services
Columbia Cleaners is going to provide the following services for customers with free home pick-up and delivery in the Hillsboro area:
- Dry cleaning
- Laundry for personal clothes and large items such as blankets, duvets, curtains, etc.
- Alteration service
Operations plan
There are two ways for customers to take part in the service. Customers can sign contracts with Columbia Cleaners to get regularly scheduled service, or, if it is more convenient, they can order over the telephone or via e-mail.
Customers can choose payment either at the time of each delivery, or by monthly credit card billing. We will send statements to each contract customer, itemizing service fees and the charge for the service to their credit cards for payment, at the end of each month.
No retail shop will be rented in order to reduce the operation cost. An operations facility for installing machines and equipment, washing and cleaning activities, and storing not yet cleaned and cleaned garments and items is needed. The operations facility will require about 2,000 square feet divided into four main sections as following:
- Machine installation and cleaning activities
- Sorting and storage of dirty garments received
- Storing cleaned garments after finishing prior to delivery
- Garment alteration workroom
The whole operation process will be controlled and monitored by a laundry expert employee, and generally managed by the business owner.
Market Analysis Summary
It is necessary to establish the reasons for choosing the dry cleaning, laundry, and alteration service before doing the market research and marketing plan. “Laundries and Dry Cleaners rated in the top ten enterprises with the lowest failure rate.” http://www.mindspring.com/~jimgirone/cleanpage/desire.html
- Payment for the service is by cash, check, or credit card.
- No capital stagnancy, receive payment every month, easy to get instant profit.
- Capital requirement for purchasing commercial laundry equipment is minimal, therefore the risk of this business is low.
- This service only requires a few staff.
- Supplies a needed service for customers’ frequent demand (laundry – clean clothes).
- Customers use this service as there are few or no alternatives (dry cleaning, carpet cleaning…).
- The demand for using service is increasing due to changing life styles, incomes, and the increase in clothing expenditure.
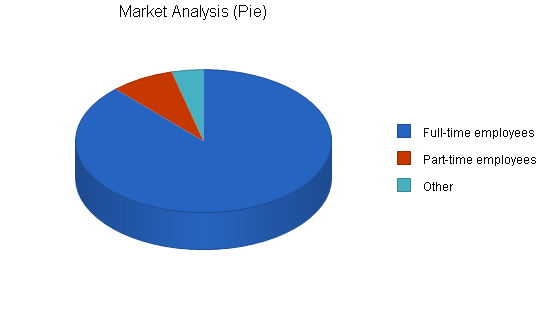
4.1 Market Segmentation
Columbia Cleaners will be primarily targeting customers in the Hillsboro-Beaverton area. We will start off by offering services to the Hillsboro residents but will also aim at extending our service offering to the residents of nearby towns west of Portland, OR, including Beaverton, Cedar Hills, Tigard, and Lake Oswego.

We will be targeting both full-time and part-time employed customers who would value the convenience of our service. Demographic research shows that the total population of the Hillsboro-Beaverton area is about 350,000, of which about 250,000 are in the labor force. Of the later, approx. 220,000 are employed full time, 20,000 are employed part time and the rest are unemployed, as summarized in the table below.
| Market Analysis | |||||||
| Year 1 | Year 2 | Year 3 | Year 4 | Year 5 | |||
| Potential Customers | Growth | CAGR | |||||
| Full-time employees | 2% | 220,000 | 224,400 | 228,888 | 233,466 | 238,135 | 2.00% |
| Part-time employees | 2% | 20,000 | 20,400 | 20,808 | 21,224 | 21,649 | 2.00% |
| Other | 0% | 10,000 | 10,000 | 10,000 | 10,000 | 10,000 | 0.00% |
| Total | 1.92% | 250,000 | 254,800 | 259,696 | 264,690 | 269,784 | 1.92% |
4.2 Target Market Segment Strategy
The table in the previous topic shows estimated percentages of Hillsboro-Beaverton residents working full time in 2004, which is a lot higher than that of those working part-time. Employment, income, and GDP trends show an increase over the past several years as well. This results in increasing standard of living, which in turn leaves people having less time to do their housework (including laundry) in Hillsboro. They are often tired after the whole day of working and tend to spend money to hire someone else to do the housework for them. Moreover, the demand on clothes of these working people (particularly professionals) usually increases proportionately with their income. Buying more clothes, especially expensive clothes, makes them pay more attention to the care and cleaning of those garments. With careful research, this business focuses on working and professional class customers as a target segment market.
4.2.1 Market Needs
Research shows that one of the key factors in choosing a personal service, such as laundry and dry cleaning, is not price but the convenience of the service. As stated above, with the growth of discretionary income people tend to choose services based on how much time and effort the service will save them. Although there are several conventional drop-off dry cleaning/laundry service providers in the area, Columbia Cleaners will primarily market its convenient pickup/delivery service to those busy individuals who are willing to appreciate such service, as it saves them time for other endeavors.
4.3 Service Business Analysis
The personal service industry is very fragmented overall. The Metropolitan Portland area is no exception to that, with numerous small providers servicing the community’s needs for laundry and dry cleaning. In the city of Hillsboro there are about half-dozen dry cleaners, some of which also provide laundry and garment alteration services. However, almost none of them, except Convenient Door-to-Door Dry Cleaning, provide the convenience of the door-to-door service.
4.3.1 Competition and Buying Patterns
Competition in the dry cleaning/laundry business in the Hillsboro area is not fierce. Research shows that there are seven dry cleaners in the city of Hillsboro, almost all of them offering the traditional drop-off service. The only competitor offering the convenience of the door-to-door service is Convenient Door-to-Door Dry Cleaning that provides dry cleaning and shoe repair services. We believe that initially this will be our major local competitor. We also believe that we will be able to win customers from our regular, drop-off competitors by enhancing the clients’ peace of mind though a new level of convenience and saving their time.
Strategy and Implementation Summary
Evaluation
The following areas will be monitored to evaluate the business performance:
- Monthly and annual sales
- Monthly and annual profit
- Repeat business
- Customer satisfaction
The business success will depend on quality and convenience of the service, customer opinions, and competitor response.
Optimism
The business provides a new door-to-door dry cleaning, laundry, and alteration service in Hillsboro that will surely attract customer attention. Working customers may find this service is convenient for them and want to try it. If they are satisfied with the service quality they will likely become repeat customers. When the patronage happens continuously, they become loyal customers of the service. These customers will recommend Columbia Cleaners to their friends and coworkers. As more and more customers use this service, Columbia Cleaners’ image is enhanced and we will gain more and more market share.
If we attain monthly and annual sales at least as forecasted, total costs and expenses, including any unanticipated charges, will not exceed our estimates and therefore the monthly and annual profit will be satisfactorily achieved.
Difficulties and Risks
Columbia Cleaners is a start-up and as such has less experience and begins with no market share at all. Assertive, effective initial marketing efforts will be necessary to gain a customer base. If existing competitors see us as a major threat and they resort to overtly aggressive and debilitating actions it will be very difficult for us to become an established player in the marketplace. Risks caused by competitors are possible, therefore the business has to monitor and evaluate its performance frequently, and collect customer evaluations and suggestions in order to continually improve.
Worst Case Risks
The worst case scenario would be that the business cannot support itself on an ongoing basis. The costs of doing business may be under-estimated, or sales and profit may be less than expected, making the business difficult in finance. Moreover, in case of social economic recession, political changes, or inflation, the business may perform even worse than has been forecasted.
5.1 Competitive Edge
As the U.S. economy recovers and quality of life is increases, people tend to spend more time and money in leisure activities rather than doing their house work. They prefer that someone else does the cleaning work for them. Hillsboro has a population of 70,000 served by seven dry cleaning and laundry shops. These existing shops wait for customers to bring their garments in and pick them up later. Customers have to drive cars to town, find parking places, carry their clothes or large items, such as curtains, blankets, etc. to the shop, and wait to be served. Then they must repeat this boring process when they come to collect their items. Moreover, these shops are only open from 9am – 6pm, and close on Sunday, which are almost the same working hours of offices; most inconvenient for customers especially those with full-time jobs.
By understanding and addressing this need, our new dry cleaning, laundry and alteration service will be established, providing door to door service free of delivery charge. We make our customers’ lives simpler by saving them time, and eliminating waiting in queues, parking problems, forgetting to collect clothes, missing meals, and going home late.
The following is the SWOT analysis for Columbia Cleaners:
Strengths:
- We offer a relatively new, door-to-door service for dry cleaning, and laundry, providing another choice for customers.
- We provide quick and convenient service in order to save customer’s time.
Weaknesses:
- Competition from already established competitors in Hillsboro.
- Starting at no market share at all.
- Less experience than competitors.
Opportunities:
- Expenditures on clothing is increasing, including expensive clothes; therefore the demand for taking care of clothes also increases.
- There are more and more women – who traditionally have done the laundry and cleaning work in the family – going to work outside the home. The target market of this business is working class and professional class customers, both men and women.
- Average income of Hillsboro citizens is increasing.
- People tend to spend more time on leisure activities rather than doing the house work.
- Participation within a steadily growing service. The forecast of the dry cleaning and laundry service goes steadily up through 2010.
- There is a high likelihood of repeat business.
- The ability to decrease the fixed costs as the sales volume increases.
Threats:
- If the business is successful, there will be new competitors who supply the same kind of service.
- New technology changes may bring out new family washing machines for dry cleaning.
5.2 Marketing Strategy
Place: Dealing directly with customers, conveniently in the customers’ houses in Hillsboro. We are choosing to not rent a shop in the town center, thereby reducing costs. Columbia Cleaners will receive clothes from and return them to customers’ houses. Requests for urgent situation pickups and deliveries will be accommodated, and a nominal fee charged.
Product: Free home pickup and delivery service, coming to customers’ houses between 6 pm – 9 pm three times per week. We provide convenience and high quality dry cleaning, laundry, and alteration services.
Price: Normally, new businesses set their initial prices lower than their competitors. In our situation however, the business has higher costs for our delivery service and promotions to increase customers’ awareness and establish our brand name. We will set our prices to match those of our competitors. The pricing scheme is based on a per service price. Moreover, the business targets working and professional customers who often pay less attention to price than the quality and convenience of service. Kelvin Clancy (in Kotler, 2003) shows that only between 15 and 35 percent of buyers are price sensitive. People with higher incomes are willing to pay more for features, customer service, quality, and convenience.
Promotion:
- Advertise our new service in the local press, the Internet, public areas such as buses and train stations, shopping centers and supermarkets etc., and drop advertising material into families’ mailboxes.
- Offer 10% discount as an incentive for customers who sign one-year contracts.
- Issue coupons with lower price for loyal customers.
5.3 Sales Strategy
We will start off my matching our main competitor’s prices and we will be closely monitoring our financials to make sure that we develop a sustainable business without heavily discounting our services to win customers. All sales inquiries will be initially handled by the business owner. We will also train all our employees, especially those facing the customers, in customer service to make sure that our customers are fully satisfied, as such customers will not only stay longer with us but will also refer other customers to us. We will offer limited discounts to our customers with large recurring orders and also provide incentives for new customer referrals.
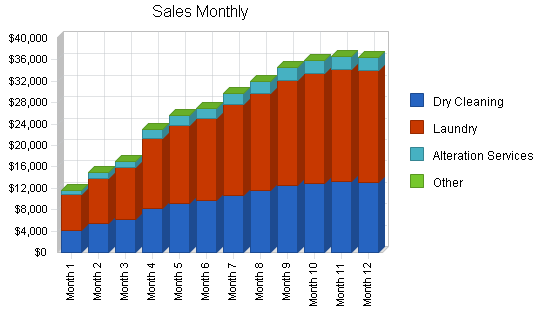
5.3.1 Sales Forecast
The sales forecast gradually increases over the year 2005 and comprises total sales of $324,700. However, in the last three months, October, November and December the sales remain almost level due to possible seasonal factors. Yearly forecasts are summarized in the table below.
| Sales Forecast | |||
| Year 1 | Year 2 | Year 3 | |
| Sales | |||
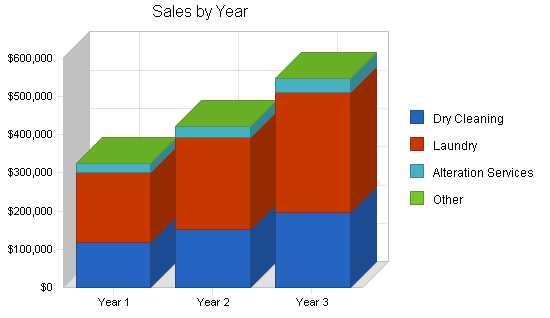
| Dry Cleaning | $116,892 | $151,960 | $197,548 |
| Laundry | $185,079 | $240,603 | $312,784 |
| Alteration Services | $22,729 | $29,547 | $38,412 |
| Other | $0 | $0 | $0 |
| Total Sales | $324,700 | $422,110 | $548,744 |
| Direct Cost of Sales | Year 1 | Year 2 | Year 3 |
| Dry Cleaning | $14,027 | $18,235 | $23,706 |
| Laundry | $14,806 | $19,248 | $25,023 |
| Alteration Services | $6,819 | $8,864 | $11,524 |
| Other | $0 | $0 | $0 |
| Subtotal Direct Cost of Sales | $35,652 | $46,348 | $60,252 |
Management Summary
The owner of the business will be director and accountant, working full time. A laundry expert will be employed and will be in charge of the operation and the quality of garment cleaning. Workers will report the laundry expert who reports to the owner.
6.1 Personnel Plan
Through consultations with a dry cleaning consultant, the term of reference of a laundry expert and workers are prepared. Employment information will be advertised in local newspapers. The laundry expert and two part-time workers who have experience in laundry work will be employed.
The laundry expert will be in charge of the operation and the quality of garment cleaning. Workers will be responsible for cleaning and classifying work and have duty to report daily work to the laundry expert. The expert has to report their working results and problems to the director.
Two part-time drivers for picking up and delivering clothes work from 5:30 pm – 9:30 pm three times a week.
The staff should be able to carry out working conditions and requirements:
- Understand and apply dry cleaning and washing processes
- Meet set standards by following instructions
- Work in hot, humid surroundings
- Perform the same work continuously
- Overtime may be required during peak seasons such as spring and autumn.
Number of staff and salary in the period of January to March 2005:
| Description | – | No of people | Salary per hour ($) | Working hours/week |
| Owner | Full-time | 1 | 23 | 40 |
| Laundry expert | Full-time | 1 | 12 | 40 |
| Workers | Part-time | 2 | 9 | 48 |
| Drivers | Part-time | 2 | 7 | 24 |
| Total | – | 6 | 51 | 152 |
From April 2005, the business has more customers and becomes busier, thus new staff (a worker and a driver) are employed. The business prefers to hire extra part-time workers and drivers sharing the total needed working hours. In case one of them becomes sick or busy, other staff can replace him therefore the working process will not be effected.
An average 5% increase in all salaries is planned for the following two years of operations.
| Personnel Plan | |||
| Year 1 | Year 2 | Year 3 | |
| Director/Accountant | $48,000 | $50,400 | $52,920 |
| Laundry expert | $24,960 | $26,208 | $27,518 |
| Worker-1 | $11,232 | $11,794 | $12,383 |
| Worker-2 | $11,232 | $11,794 | $12,383 |
| Worker-3 | $8,424 | $8,845 | $9,287 |
| Driver-1 | $4,368 | $4,586 | $4,816 |
| Driver-2 | $4,368 | $4,586 | $4,816 |
| Driver-3 | $3,276 | $3,440 | $3,612 |
| Other | $0 | $0 | $0 |
| Total People | 8 | 8 | 8 |
| Total Payroll | $115,860 | $121,653 | $127,736 |
Financial Plan
The following topics, the cash flow statement, profit and loss account, and balance sheet have been built using forecasted information which is as accurate and realistic as possible. Sales increase gradually over the 12 months showing the positive trend of sales. Columbia Cleaners is steadily gaining market share. Gross profit and net profit rise proportionately to sales revenue. The financial statements show that the business runs quite well and achieves expected results.
7.1 Start-up Funding
Startup expenses will be funded through a combination of owner’s equity capital and a commercial loan, as summarized in the table below.
The owner will invest $40,000 in the business. Additional capital for the business in the amount of $20,000 will be borrowed from a bank.
The lending plan has to be completed and submitted to the bank 6 months before starting the business. The loan will be needed two months in advance. Annual interest of 10% has to be paid on the long-term loans secured with fixed assets.
| Start-up Funding | |
| Start-up Expenses to Fund | $23,000 |
| Start-up Assets to Fund | $27,000 |
| Total Funding Required | $50,000 |
| Assets | |
| Non-cash Assets from Start-up | $17,000 |
| Cash Requirements from Start-up | $10,000 |
| Additional Cash Raised | $10,000 |
| Cash Balance on Starting Date | $20,000 |
| Total Assets | $37,000 |
| Liabilities and Capital | |
| Liabilities | |
| Current Borrowing | $0 |
| Long-term Liabilities | $20,000 |
| Accounts Payable (Outstanding Bills) | $0 |
| Other Current Liabilities (interest-free) | $0 |
| Total Liabilities | $20,000 |
| Capital | |
| Planned Investment | |
| J.C. Copperbeech | $40,000 |
| Other investors | $0 |
| Additional Investment Requirement | $0 |
| Total Planned Investment | $40,000 |
| Loss at Start-up (Start-up Expenses) | ($23,000) |
| Total Capital | $17,000 |
| Total Capital and Liabilities | $37,000 |
| Total Funding | $60,000 |
7.2 Break-even Analysis
The monthly break-even point of the business is calculated below. As revenue becomes higher than break-even point, the business starts to harvest the profit. As forecasted, the total demand on dry cleaning and laundry service continues to rise in the following years; therefore, if the service satisfies its customers, increases new customers and retains customer loyalty, the profit will continue to go up.

| Break-even Analysis | |
| Monthly Revenue Break-even | $19,205 |
| Assumptions: | |
| Average Percent Variable Cost | 11% |
| Estimated Monthly Fixed Cost | $17,097 |
7.3 Projected Cash Flow
Cash flow increases gradually over the year creating the positive net worth. The first several months of operation will be of critical importance to the survival of the business, and we will be paying special attention to our cash flows. We plan to purchase one more van in April 2005 to accommodate for the growing business volumes. Initially, we do not plan to sell on credit, with all of our transactions being cash- or credit card based. We anticipate generating a sufficient customer base that will allow us to maintain healthy cash balances starting from the middle of the first year of operations, as summarized in the table below.

| Pro Forma Cash Flow | |||
| Year 1 | Year 2 | Year 3 | |
| Cash Received | |||
| Cash from Operations | |||
| Cash Sales | $324,700 | $422,110 | $548,744 |
| Subtotal Cash from Operations | $324,700 | $422,110 | $548,744 |
| Additional Cash Received | |||
| Sales Tax, VAT, HST/GST Received | $0 | $0 | $0 |
| New Current Borrowing | $0 | $0 | $0 |
| New Other Liabilities (interest-free) | $0 | $0 | $0 |
| New Long-term Liabilities | $0 | $0 | $0 |
| Sales of Other Current Assets | $0 | $0 | $0 |
| Sales of Long-term Assets | $0 | $0 | $0 |
| New Investment Received | $0 | $0 | $0 |
| Subtotal Cash Received | $324,700 | $422,110 | $548,744 |
| Expenditures | Year 1 | Year 2 | Year 3 |
| Expenditures from Operations | |||
| Cash Spending | $115,860 | $121,653 | $127,736 |
| Bill Payments | $133,714 | $191,828 | $245,003 |
| Subtotal Spent on Operations | $249,574 | $313,481 | $372,739 |
| Additional Cash Spent | |||
| Sales Tax, VAT, HST/GST Paid Out | $0 | $0 | $0 |
| Principal Repayment of Current Borrowing | $0 | $0 | $0 |
| Other Liabilities Principal Repayment | $0 | $0 | $0 |
| Long-term Liabilities Principal Repayment | $334 | $0 | $0 |
| Purchase Other Current Assets | $0 | $0 | $0 |
| Purchase Long-term Assets | $10,000 | $0 | $0 |
| Dividends | $0 | $0 | $0 |
| Subtotal Cash Spent | $259,908 | $313,481 | $372,739 |
| Net Cash Flow | $64,792 | $108,629 | $176,005 |
| Cash Balance | $84,792 | $193,421 | $369,426 |
7.4 Projected Profit and Loss
The table below outlines our projected profit and loss statements for the first three years of operation. In general, the business might meet some difficulties in the beginning months but after that the business grows as expected and produces a small profit at the end of the year. It is not necessary for the business to gain high profit in the first year. Nevertheless, we are expecting to make a small profit the first year. Our second and third year net profits are expected to grow quite a bit, as shown below.


| Pro Forma Profit and Loss | |||
| Year 1 | Year 2 | Year 3 | |
| Sales | $324,700 | $422,110 | $548,744 |
| Direct Cost of Sales | $35,652 | $46,348 | $60,252 |
| Other Costs of Sales | $0 | $0 | $0 |
| Total Cost of Sales | $35,652 | $46,348 | $60,252 |
| Gross Margin | $289,048 | $375,762 | $488,492 |
| Gross Margin % | 89.02% | 89.02% | 89.02% |
| Expenses | |||
| Payroll | $115,860 | $121,653 | $127,736 |
| Marketing/Promotion | $2,250 | $2,700 | $3,000 |
| Depreciation | $4,500 | $4,000 | $5,000 |
| Rent | $14,400 | $15,000 | $16,000 |
| Utilities | $11,100 | $12,000 | $13,000 |
| Telecommunications | $4,800 | $5,000 | $5,500 |
| Insurance | $10,200 | $11,000 | $12,000 |
| Payroll Taxes | $0 | $0 | $0 |
| Maintenance | $1,200 | $1,500 | $2,000 |
| Gas | $5,250 | $6,500 | $7,500 |
| Equipment lease | $20,000 | $20,000 | $20,000 |
| Office cleaning | $3,600 | $4,000 | $5,000 |
| Other | $12,000 | $20,000 | $30,000 |
| Total Operating Expenses | $205,160 | $223,353 | $246,736 |
| Profit Before Interest and Taxes | $83,888 | $152,409 | $241,756 |
| EBITDA | $88,388 | $156,409 | $246,756 |
| Interest Expense | $1,967 | $1,967 | $1,967 |
| Taxes Incurred | $24,576 | $45,133 | $71,937 |
| Net Profit | $57,345 | $105,310 | $167,853 |
| Net Profit/Sales | 17.66% | 24.95% | 30.59% |
7.5 Projected Balance Sheet
The table below shows the balance sheet annual figures for the first three years of operation. First year monthly figures are presented in the appendix.
| Pro Forma Balance Sheet | |||
| Year 1 | Year 2 | Year 3 | |
| Assets | |||
| Current Assets | |||
| Cash | $84,792 | $193,421 | $369,426 |
| Inventory | $4,008 | $5,210 | $6,773 |
| Other Current Assets | $0 | $0 | $0 |
| Total Current Assets | $88,800 | $198,631 | $376,199 |
| Long-term Assets | |||
| Long-term Assets | $25,000 | $25,000 | $25,000 |
| Accumulated Depreciation | $4,500 | $8,500 | $13,500 |
| Total Long-term Assets | $20,500 | $16,500 | $11,500 |
| Total Assets | $109,300 | $215,131 | $387,699 |
| Liabilities and Capital | Year 1 | Year 2 | Year 3 |
| Current Liabilities | |||
| Accounts Payable | $15,289 | $15,810 | $20,525 |
| Current Borrowing | $0 | $0 | $0 |
| Other Current Liabilities | $0 | $0 | $0 |
| Subtotal Current Liabilities | $15,289 | $15,810 | $20,525 |
| Long-term Liabilities | $19,666 | $19,666 | $19,666 |
| Total Liabilities | $34,955 | $35,476 | $40,191 |
| Paid-in Capital | $40,000 | $40,000 | $40,000 |
| Retained Earnings | ($23,000) | $34,345 | $139,655 |
| Earnings | $57,345 | $105,310 | $167,853 |
| Total Capital | $74,345 | $179,655 | $347,508 |
| Total Liabilities and Capital | $109,300 | $215,131 | $387,699 |
| Net Worth | $74,345 | $179,655 | $347,508 |
7.6 Business Ratios
Business ratios for the years of this plan are shown below. Industry profile ratios for Commercial Drycleaning and Laundry Collection and Distribution Establishments, based on the Standard Industrial Classification code 7216.9903, are shown for comparison.
| Ratio Analysis | ||||
| Year 1 | Year 2 | Year 3 | Industry Profile | |
| Sales Growth | 0.00% | 30.00% | 30.00% | 4.37% |
| Percent of Total Assets | ||||
| Inventory | 3.67% | 2.42% | 1.75% | 4.37% |
| Other Current Assets | 0.00% | 0.00% | 0.00% | 38.35% |
| Total Current Assets | 81.24% | 92.33% | 97.03% | 55.47% |
| Long-term Assets | 18.76% | 7.67% | 2.97% | 44.53% |
| Total Assets | 100.00% | 100.00% | 100.00% | 100.00% |
| Current Liabilities | 13.99% | 7.35% | 5.29% | 22.38% |
| Long-term Liabilities | 17.99% | 9.14% | 5.07% | 24.56% |
| Total Liabilities | 31.98% | 16.49% | 10.37% | 46.94% |
| Net Worth | 68.02% | 83.51% | 89.63% | 53.06% |
| Percent of Sales | ||||
| Sales | 100.00% | 100.00% | 100.00% | 100.00% |
| Gross Margin | 89.02% | 89.02% | 89.02% | 100.00% |
| Selling, General & Administrative Expenses | 71.36% | 64.07% | 58.43% | 77.90% |
| Advertising Expenses | 0.00% | 0.00% | 0.00% | 2.06% |
| Profit Before Interest and Taxes | 25.84% | 36.11% | 44.06% | 2.41% |
| Main Ratios | ||||
| Current | 5.81 | 12.56 | 18.33 | 1.70 |
| Quick | 5.55 | 12.23 | 18.00 | 1.28 |
| Total Debt to Total Assets | 31.98% | 16.49% | 10.37% | 61.40% |
| Pre-tax Return on Net Worth | 110.19% | 83.74% | 69.00% | 4.39% |
| Pre-tax Return on Assets | 74.95% | 69.93% | 61.85% | 11.38% |
| Additional Ratios | Year 1 | Year 2 | Year 3 | |
| Net Profit Margin | 17.66% | 24.95% | 30.59% | n.a |
| Return on Equity | 77.13% | 58.62% | 48.30% | n.a |
| Activity Ratios | ||||
| Inventory Turnover | 11.85 | 10.06 | 10.06 | n.a |
| Accounts Payable Turnover | 9.75 | 12.17 | 12.17 | n.a |
| Payment Days | 27 | 30 | 27 | n.a |
| Total Asset Turnover | 2.97 | 1.96 | 1.42 | n.a |
| Debt Ratios | ||||
| Debt to Net Worth | 0.47 | 0.20 | 0.12 | n.a |
| Current Liab. to Liab. | 0.44 | 0.45 | 0.51 | n.a |
| Liquidity Ratios | ||||
| Net Working Capital | $73,511 | $182,821 | $355,674 | n.a |
| Interest Coverage | 42.66 | 77.50 | 122.93 | n.a |
| Additional Ratios | ||||
| Assets to Sales | 0.34 | 0.51 | 0.71 | n.a |
| Current Debt/Total Assets | 14% | 7% | 5% | n.a |
| Acid Test | 5.55 | 12.23 | 18.00 | n.a |
| Sales/Net Worth | 4.37 | 2.35 | 1.58 | n.a |
| Dividend Payout | 0.00 | 0.00 | 0.00 | n.a |
Appendix
| Sales Forecast | |||||||||||||
| Month 1 | Month 2 | Month 3 | Month 4 | Month 5 | Month 6 | Month 7 | Month 8 | Month 9 | Month 10 | Month 11 | Month 12 | ||
| Sales | |||||||||||||
| Dry Cleaning | 0% | $4,176 | $5,364 | $6,156 | $8,280 | $9,216 | $9,720 | $10,728 | $11,520 | $12,456 | $12,924 | $13,212 | $13,140 |
| Laundry | 0% | $6,612 | $8,493 | $9,747 | $13,110 | $14,592 | $15,390 | $16,986 | $18,240 | $19,722 | $20,463 | $20,919 | $20,805 |
| Alteration Services | 0% | $812 | $1,043 | $1,197 | $1,610 | $1,792 | $1,890 | $2,086 | $2,240 | $2,422 | $2,513 | $2,569 | $2,555 |
| Other | 0% | $0 | $0 | $0 | $0 | $0 | $0 | $0 | $0 | $0 | $0 | $0 | $0 |
| Total Sales | $11,600 | $14,900 | $17,100 | $23,000 | $25,600 | $27,000 | $29,800 | $32,000 | $34,600 | $35,900 | $36,700 | $36,500 | |
| Direct Cost of Sales | Month 1 | Month 2 | Month 3 | Month 4 | Month 5 | Month 6 | Month 7 | Month 8 | Month 9 | Month 10 | Month 11 | Month 12 | |
| Dry Cleaning | 12% | $501 | $644 | $739 | $994 | $1,106 | $1,166 | $1,287 | $1,382 | $1,495 | $1,551 | $1,585 | $1,577 |
| Laundry | 8% | $529 | $679 | $780 | $1,049 | $1,167 | $1,231 | $1,359 | $1,459 | $1,578 | $1,637 | $1,674 | $1,664 |
| Alteration Services | 30% | $244 | $313 | $359 | $483 | $538 | $567 | $626 | $672 | $727 | $754 | $771 | $767 |
| Other | $0 | $0 | $0 | $0 | $0 | $0 | $0 | $0 | $0 | $0 | $0 | $0 | |
| Subtotal Direct Cost of Sales | $1,274 | $1,636 | $1,878 | $2,525 | $2,811 | $2,965 | $3,272 | $3,514 | $3,799 | $3,942 | $4,030 | $4,008 | |
| Personnel Plan | |||||||||||||
| Month 1 | Month 2 | Month 3 | Month 4 | Month 5 | Month 6 | Month 7 | Month 8 | Month 9 | Month 10 | Month 11 | Month 12 | ||
| Director/Accountant | 0% | $4,000 | $4,000 | $4,000 | $4,000 | $4,000 | $4,000 | $4,000 | $4,000 | $4,000 | $4,000 | $4,000 | $4,000 |
| Laundry expert | 0% | $2,080 | $2,080 | $2,080 | $2,080 | $2,080 | $2,080 | $2,080 | $2,080 | $2,080 | $2,080 | $2,080 | $2,080 |
| Worker-1 | 0% | $936 | $936 | $936 | $936 | $936 | $936 | $936 | $936 | $936 | $936 | $936 | $936 |
| Worker-2 | 0% | $936 | $936 | $936 | $936 | $936 | $936 | $936 | $936 | $936 | $936 | $936 | $936 |
| Worker-3 | 0% | $0 | $0 | $0 | $936 | $936 | $936 | $936 | $936 | $936 | $936 | $936 | $936 |
| Driver-1 | 0% | $364 | $364 | $364 | $364 | $364 | $364 | $364 | $364 | $364 | $364 | $364 | $364 |
| Driver-2 | 0% | $364 | $364 | $364 | $364 | $364 | $364 | $364 | $364 | $364 | $364 | $364 | $364 |
| Driver-3 | 0% | $0 | $0 | $0 | $364 | $364 | $364 | $364 | $364 | $364 | $364 | $364 | $364 |
| Other | 0% | $0 | $0 | $0 | $0 | $0 | $0 | $0 | $0 | $0 | $0 | $0 | $0 |
| Total People | 6 | 6 | 6 | 8 | 8 | 8 | 8 | 8 | 8 | 8 | 8 | 8 | |
| Total Payroll | $8,680 | $8,680 | $8,680 | $9,980 | $9,980 | $9,980 | $9,980 | $9,980 | $9,980 | $9,980 | $9,980 | $9,980 | |
| Pro Forma Profit and Loss | |||||||||||||
| Month 1 | Month 2 | Month 3 | Month 4 | Month 5 | Month 6 | Month 7 | Month 8 | Month 9 | Month 10 | Month 11 | Month 12 | ||
| Sales | $11,600 | $14,900 | $17,100 | $23,000 | $25,600 | $27,000 | $29,800 | $32,000 | $34,600 | $35,900 | $36,700 | $36,500 | |
| Direct Cost of Sales | $1,274 | $1,636 | $1,878 | $2,525 | $2,811 | $2,965 | $3,272 | $3,514 | $3,799 | $3,942 | $4,030 | $4,008 | |
| Other Costs of Sales | $0 | $0 | $0 | $0 | $0 | $0 | $0 | $0 | $0 | $0 | $0 | $0 | |
| Total Cost of Sales | $1,274 | $1,636 | $1,878 | $2,525 | $2,811 | $2,965 | $3,272 | $3,514 | $3,799 | $3,942 | $4,030 | $4,008 | |
| Gross Margin | $10,326 | $13,264 | $15,222 | $20,475 | $22,789 | $24,035 | $26,528 | $28,486 | $30,801 | $31,958 | $32,670 | $32,492 | |
| Gross Margin % | 89.02% | 89.02% | 89.02% | 89.02% | 89.02% | 89.02% | 89.02% | 89.02% | 89.02% | 89.02% | 89.02% | 89.02% | |
| Expenses | |||||||||||||
| Payroll | $8,680 | $8,680 | $8,680 | $9,980 | $9,980 | $9,980 | $9,980 | $9,980 | $9,980 | $9,980 | $9,980 | $9,980 | |
| Marketing/Promotion | $150 | $150 | $150 | $200 | $200 | $200 | $200 | $200 | $200 | $200 | $200 | $200 | |
| Depreciation | $250 | $250 | $250 | $417 | $417 | $417 | $417 | $417 | $417 | $417 | $417 | $417 | |
| Rent | $1,200 | $1,200 | $1,200 | $1,200 | $1,200 | $1,200 | $1,200 | $1,200 | $1,200 | $1,200 | $1,200 | $1,200 | |
| Utilities | $700 | $700 | $700 | $1,000 | $1,000 | $1,000 | $1,000 | $1,000 | $1,000 | $1,000 | $1,000 | $1,000 | |
| Telecommunications | $400 | $400 | $400 | $400 | $400 | $400 | $400 | $400 | $400 | $400 | $400 | $400 | |
| Insurance | $700 | $700 | $700 | $900 | $900 | $900 | $900 | $900 | $900 | $900 | $900 | $900 | |
| Payroll Taxes | 15% | $0 | $0 | $0 | $0 | $0 | $0 | $0 | $0 | $0 | $0 | $0 | $0 |
| Maintenance | $100 | $100 | $100 | $100 | $100 | $100 | $100 | $100 | $100 | $100 | $100 | $100 | |
| Gas | $250 | $250 | $250 | $500 | $500 | $500 | $500 | $500 | $500 | $500 | $500 | $500 | |
| Equipment lease | $1,667 | $1,667 | $1,667 | $1,667 | $1,667 | $1,667 | $1,667 | $1,667 | $1,667 | $1,667 | $1,667 | $1,667 | |
| Office cleaning | 15% | $300 | $300 | $300 | $300 | $300 | $300 | $300 | $300 | $300 | $300 | $300 | $300 |
| Other | $1,000 | $1,000 | $1,000 | $1,000 | $1,000 | $1,000 | $1,000 | $1,000 | $1,000 | $1,000 | $1,000 | $1,000 | |
| Total Operating Expenses | $15,397 | $15,397 | $15,397 | $17,663 | $17,663 | $17,663 | $17,663 | $17,663 | $17,663 | $17,663 | $17,663 | $17,663 | |
| Profit Before Interest and Taxes | ($5,070) | ($2,133) | ($174) | $2,811 | $5,126 | $6,372 | $8,865 | $10,823 | $13,138 | $14,295 | $15,007 | $14,829 | |
| EBITDA | ($4,820) | ($1,883) | $76 | $3,228 | $5,542 | $6,789 | $9,281 | $11,240 | $13,554 | $14,712 | $15,424 | $15,246 | |
| Interest Expense | $164 | $164 | $164 | $164 | $164 | $164 | $164 | $164 | $164 | $164 | $164 | $164 | |
| Taxes Incurred | ($1,570) | ($689) | ($101) | $794 | $1,489 | $1,862 | $2,610 | $3,198 | $3,892 | $4,239 | $4,453 | $4,400 | |
| Net Profit | ($3,664) | ($1,608) | ($237) | $1,853 | $3,473 | $4,346 | $6,091 | $7,461 | $9,082 | $9,892 | $10,390 | $10,266 | |
| Net Profit/Sales | -31.59% | -10.79% | -1.38% | 8.06% | 13.57% | 16.10% | 20.44% | 23.32% | 26.25% | 27.55% | 28.31% | 28.12% | |
| Pro Forma Cash Flow | |||||||||||||
| Month 1 | Month 2 | Month 3 | Month 4 | Month 5 | Month 6 | Month 7 | Month 8 | Month 9 | Month 10 | Month 11 | Month 12 | ||
| Cash Received | |||||||||||||
| Cash from Operations | |||||||||||||
| Cash Sales | $11,600 | $14,900 | $17,100 | $23,000 | $25,600 | $27,000 | $29,800 | $32,000 | $34,600 | $35,900 | $36,700 | $36,500 | |
| Subtotal Cash from Operations | $11,600 | $14,900 | $17,100 | $23,000 | $25,600 | $27,000 | $29,800 | $32,000 | $34,600 | $35,900 | $36,700 | $36,500 | |
| Additional Cash Received | |||||||||||||
| Sales Tax, VAT, HST/GST Received | 0.00% | $0 | $0 | $0 | $0 | $0 | $0 | $0 | $0 | $0 | $0 | $0 | $0 |
| New Current Borrowing | $0 | $0 | $0 | $0 | $0 | $0 | $0 | $0 | $0 | $0 | $0 | $0 | |
| New Other Liabilities (interest-free) | $0 | $0 | $0 | $0 | $0 | $0 | $0 | $0 | $0 | $0 | $0 | $0 | |
| New Long-term Liabilities | $0 | $0 | $0 | $0 | $0 | $0 | $0 | $0 | $0 | $0 | $0 | $0 | |
| Sales of Other Current Assets | $0 | $0 | $0 | $0 | $0 | $0 | $0 | $0 | $0 | $0 | $0 | $0 | |
| Sales of Long-term Assets | $0 | $0 | $0 | $0 | $0 | $0 | $0 | $0 | $0 | $0 | $0 | $0 | |
| New Investment Received | $0 | $0 | $0 | $0 | $0 | $0 | $0 | $0 | $0 | $0 | $0 | $0 | |
| Subtotal Cash Received | $11,600 | $14,900 | $17,100 | $23,000 | $25,600 | $27,000 | $29,800 | $32,000 | $34,600 | $35,900 | $36,700 | $36,500 | |
| Expenditures | Month 1 | Month 2 | Month 3 | Month 4 | Month 5 | Month 6 | Month 7 | Month 8 | Month 9 | Month 10 | Month 11 | Month 12 | |
| Expenditures from Operations | |||||||||||||
| Cash Spending | $8,680 | $8,680 | $8,680 | $9,980 | $9,980 | $9,980 | $9,980 | $9,980 | $9,980 | $9,980 | $9,980 | $9,980 | |
| Bill Payments | $202 | $6,108 | $7,526 | $8,740 | $11,419 | $12,029 | $12,452 | $13,646 | $14,418 | $15,419 | $15,763 | $15,995 | |
| Subtotal Spent on Operations | $8,882 | $14,788 | $16,206 | $18,720 | $21,399 | $22,009 | $22,432 | $23,626 | $24,398 | $25,399 | $25,743 | $25,975 | |
| Additional Cash Spent | |||||||||||||
| Sales Tax, VAT, HST/GST Paid Out | $0 | $0 | $0 | $0 | $0 | $0 | $0 | $0 | $0 | $0 | $0 | $0 | |
| Principal Repayment of Current Borrowing | $0 | $0 | $0 | $0 | $0 | $0 | $0 | $0 | $0 | $0 | $0 | $0 | |
| Other Liabilities Principal Repayment | $0 | $0 | $0 | $0 | $0 | $0 | $0 | $0 | $0 | $0 | $0 | $0 | |
| Long-term Liabilities Principal Repayment | $334 | $0 | $0 | $0 | $0 | $0 | $0 | $0 | $0 | $0 | $0 | $0 | |
| Purchase Other Current Assets | $0 | $0 | $0 | $0 | $0 | $0 | $0 | $0 | $0 | $0 | $0 | $0 | |
| Purchase Long-term Assets | $0 | $0 | $0 | $10,000 | $0 | $0 | $0 | $0 | $0 | $0 | $0 | $0 | |
| Dividends | $0 | $0 | $0 | $0 | $0 | $0 | $0 | $0 | $0 | $0 | $0 | $0 | |
| Subtotal Cash Spent | $9,216 | $14,788 | $16,206 | $28,720 | $21,399 | $22,009 | $22,432 | $23,626 | $24,398 | $25,399 | $25,743 | $25,975 | |
| Net Cash Flow | $2,384 | $112 | $894 | ($5,720) | $4,201 | $4,991 | $7,368 | $8,374 | $10,202 | $10,501 | $10,957 | $10,525 | |
| Cash Balance | $22,384 | $22,496 | $23,390 | $17,671 | $21,872 | $26,863 | $34,232 | $42,606 | $52,808 | $63,310 | $74,267 | $84,792 | |
| Pro Forma Balance Sheet | |||||||||||||
| Month 1 | Month 2 | Month 3 | Month 4 | Month 5 | Month 6 | Month 7 | Month 8 | Month 9 | Month 10 | Month 11 | Month 12 | ||
| Assets | Starting Balances | ||||||||||||
| Current Assets | |||||||||||||
| Cash | $20,000 | $22,384 | $22,496 | $23,390 | $17,671 | $21,872 | $26,863 | $34,232 | $42,606 | $52,808 | $63,310 | $74,267 | $84,792 |
| Inventory | $2,000 | $1,726 | $1,636 | $1,878 | $2,525 | $2,811 | $2,965 | $3,272 | $3,514 | $3,799 | $3,942 | $4,030 | $4,008 |
| Other Current Assets | $0 | $0 | $0 | $0 | $0 | $0 | $0 | $0 | $0 | $0 | $0 | $0 | $0 |
| Total Current Assets | $22,000 | $24,111 | $24,132 | $25,268 | $20,196 | $24,683 | $29,828 | $37,504 | $46,120 | $56,607 | $67,251 | $78,297 | $88,800 |
| Long-term Assets | |||||||||||||
| Long-term Assets | $15,000 | $15,000 | $15,000 | $15,000 | $25,000 | $25,000 | $25,000 | $25,000 | $25,000 | $25,000 | $25,000 | $25,000 | $25,000 |
| Accumulated Depreciation | $0 | $250 | $500 | $750 | $1,167 | $1,583 | $2,000 | $2,417 | $2,833 | $3,250 | $3,667 | $4,083 | $4,500 |
| Total Long-term Assets | $15,000 | $14,750 | $14,500 | $14,250 | $23,833 | $23,417 | $23,000 | $22,583 | $22,167 | $21,750 | $21,333 | $20,917 | $20,500 |
| Total Assets | $37,000 | $38,861 | $38,632 | $39,518 | $44,029 | $48,100 | $52,828 | $60,087 | $68,286 | $78,357 | $88,585 | $99,213 | $109,300 |
| Liabilities and Capital | Month 1 | Month 2 | Month 3 | Month 4 | Month 5 | Month 6 | Month 7 | Month 8 | Month 9 | Month 10 | Month 11 | Month 12 | |
| Current Liabilities | |||||||||||||
| Accounts Payable | $0 | $5,858 | $7,238 | $8,360 | $11,018 | $11,615 | $11,998 | $13,166 | $13,904 | $14,894 | $15,229 | $15,468 | $15,289 |
| Current Borrowing | $0 | $0 | $0 | $0 | $0 | $0 | $0 | $0 | $0 | $0 | $0 | $0 | $0 |
| Other Current Liabilities | $0 | $0 | $0 | $0 | $0 | $0 | $0 | $0 | $0 | $0 | $0 | $0 | $0 |
| Subtotal Current Liabilities | $0 | $5,858 | $7,238 | $8,360 | $11,018 | $11,615 | $11,998 | $13,166 | $13,904 | $14,894 | $15,229 | $15,468 | $15,289 |
| Long-term Liabilities | $20,000 | $19,666 | $19,666 | $19,666 | $19,666 | $19,666 | $19,666 | $19,666 | $19,666 | $19,666 | $19,666 | $19,666 | $19,666 |
| Total Liabilities | $20,000 | $25,524 | $26,904 | $28,026 | $30,684 | $31,281 | $31,664 | $32,832 | $33,570 | $34,560 | $34,895 | $35,134 | $34,955 |
| Paid-in Capital | $40,000 | $40,000 | $40,000 | $40,000 | $40,000 | $40,000 | $40,000 | $40,000 | $40,000 | $40,000 | $40,000 | $40,000 | $40,000 |
| Retained Earnings | ($23,000) | ($23,000) | ($23,000) | ($23,000) | ($23,000) | ($23,000) | ($23,000) | ($23,000) | ($23,000) | ($23,000) | ($23,000) | ($23,000) | ($23,000) |
| Earnings | $0 | ($3,664) | ($5,272) | ($5,508) | ($3,655) | ($182) | $4,164 | $10,254 | $17,716 | $26,798 | $36,689 | $47,079 | $57,345 |
| Total Capital | $17,000 | $13,336 | $11,729 | $11,492 | $13,345 | $16,819 | $21,164 | $27,255 | $34,716 | $43,798 | $53,690 | $64,080 | $74,345 |
| Total Liabilities and Capital | $37,000 | $38,861 | $38,632 | $39,518 | $44,029 | $48,100 | $52,828 | $60,087 | $68,286 | $78,357 | $88,585 | $99,213 | $109,300 |
| Net Worth | $17,000 | $13,336 | $11,729 | $11,492 | $13,345 | $16,819 | $21,164 | $27,255 | $34,716 | $43,798 | $53,690 | $64,080 | $74,345 |


