
Markam Driving School
Executive Summary
Markam Driving School (MDS) offers a wide range of driver services. It is ultimately the goal of the company to be a one-stop facility for all driver needs, including registration, licensing, etc., but at this time Markam mainly offers private and commercial driver education in the Seattle, WA area. MDS is positioned as a low-cost facility with excellent service.
1.1 Objectives
The objectives over the next three years for Markam Driving School (MDS) are the following:
- Achieve sales revenues of approximately $2.1 million by year three.
- Expand by starting up two more facilities (one in Portland, OR and the other in Tacoma)
- Become the low cost provider of comprehensive driving education services in the Pacific Northwest.
1.2 Mission
The mission of Markam Driving School is to provide high quality, convenient and comprehensive driver education courses at the lowest cost. The most important aspect of driver education is SAFETY. It is the goal of Markam Driving School to have graduates of our programs with the safest driving records of any other competitor in the Pacific Northwest and to exploit that reputation to create greater market share.
1.3 Keys to Success
Markam Driving School stands at a great moment in its history. Having achieved an enviable record of providing the lowest cost drivers education services with comparable quality for the greater Seattle area, the company is ready to expand into the Pacific Northwest region. The firm plans to open two more facilities, one in Portland, OR and the other in Tacoma, WA.
Six years ago, when the company was founded, the owners realized that there was a great untapped opportunity in this industry. No company was providing what the customers truly demanded, high quality driver education at the lowest possible cost. Large companies were charging too much for their services and the local companies were not providing enough programs and services or they were poor quality. The opportunity rested in creating synergy with other organizations that were either buyers or suppliers. by doing so a company could reduce costs, shut out competition, and gain market share. This has been MDS’s driving strategy and winning business model since the company began. It’s steady growth in a mature market has proven the company’s management policy over time. Now the company is ready to expand and the keys to success over the next three years for such an endeavor are as follows:
- Lower costs so that the company’s gross margin increases to 66%.
- Appoint a cost control officer for each of the new facilities who is responsible to the president and general manager.
- Institute a comprehensive cost reduction program throughout the company.
- Strengthen and pursue partnerships and strategic alliances with suppliers so as to further reduce costs.
- Aggressively pursue contracts with organizations who need our services such as police departments, high schools and trucking agencies.
Company Summary
Markam Driving School was started by four individuals who saw an untapped potential in the driver education industry. This potential was in creating a new low cost position while still being able to compete with the larger companies on quality. This strategy would be created through strategic alliances and partnerships of local suppliers and buyers. The company has seen steady growth in a mature market which is a sign of the firm’s viable business strategy. The company has eight investors, the majority of whom are employees of the firm. Markam Driving School is incorporated in the state of Delaware but is domiciled in Washington state. The company has achieved revenues of approximately $185,000 and a gross margin of 37%. In addition, the company has achieved a customer satisfaction rate of 92%.
2.1 Company History
The company was founded when Greg Markam, a longtime manager of driving schools and William S. Harper, a cost control manager, sought to go into business themselves. At the time, there was no low-cost leader in the industry that was providing comprehensive high-quality education with the most modern teaching techniques (including classroom computer simulations and testing equipment). The national chains were ignoring the fact that the customers could not recognize the difference in value that the various competitors provided, and therefore sought only the cheapest provider. On the other hand the vast number of smaller companies were not keeping up with the newest teaching techniques such as computer simulators. Finally, the Washington department of Transportation had recently begun to outsource many of its services such as vehicle registration to private firms. This presented a great opportunity to a company willing to take a few risks. Soon after starting Mr.’s Markam and Harper brought in Jane Wilkes, a traffic safety analyst, and Ken Thomas, an expert in the writing of training manuals and procedures.
During the past six years, MDS has shown steady growth, and built a number of crucial partnerships. The industry usually has very high capital costs due to gas, training equipment, and vehicle acquisition/repair. The key to low-cost leadership in this field is through special relationships with suppliers and buyers. In the past, the company has been able to acquire discounts with such firms as Tesoro Gasoline stations, F & F auto repair, Pullman Printers, etc. The company has achieved revenues of approximately $746,000 and a gross margin of 67%. In addition, the company has achieved a customer satisfaction rate of 92%.

| Past Performance | |||
| 1999 | 2000 | 2001 | |
| Sales | $410,000 | $567,000 | $746,000 |
| Gross Margin | $246,000 | $340,200 | $499,820 |
| Gross Margin % | 60.00% | 60.00% | 67.00% |
| Operating Expenses | $24,000 | $24,000 | $65,000 |
| Balance Sheet | |||
| 1999 | 2000 | 2001 | |
| Current Assets | |||
| Cash | $7,512 | $5,714 | $12,938 |
| Other Current Assets | $5,000 | $5,000 | $2,000 |
| Total Current Assets | $12,512 | $10,714 | $14,938 |
| Long-term Assets | |||
| Long-term Assets | $74,000 | $70,000 | $74,000 |
| Accumulated Depreciation | $8,000 | $10,000 | $12,000 |
| Total Long-term Assets | $66,000 | $60,000 | $62,000 |
| Total Assets | $78,512 | $70,714 | $76,938 |
| Current Liabilities | |||
| Accounts Payable | $4,002 | $3,974 | $3,716 |
| Current Borrowing | $5,000 | $0 | $0 |
| Other Current Liabilities (interest free) | $0 | $0 | $0 |
| Total Current Liabilities | $9,002 | $3,974 | $3,716 |
| Long-term Liabilities | $35,000 | $29,000 | $23,000 |
| Total Liabilities | $44,002 | $32,974 | $26,716 |
| Paid-in Capital | $30,000 | $30,000 | $30,000 |
| Retained Earnings | $4,510 | $7,740 | $20,222 |
| Earnings | $0 | $0 | $0 |
| Total Capital | $34,510 | $37,740 | $50,222 |
| Total Capital and Liabilities | $78,512 | $70,714 | $76,938 |
| Other Inputs | |||
| Payment Days | 30 | 30 | 30 |
2.2 Company Locations and Facilities
The company has its original facility in Seattle at 1312 1st Ave NW. This is in the Greenlake Industrial Park and consists of office space, 3 fifteen person and 4 ten person classrooms and numerous simulators, storage space, garage, and an outdoor driving course. The facilities are very modern and comfortable, making it a relaxing atmosphere for students.
The future facilities in Tacoma are at 3671 Dearborn St. a marine supply store prior to being rented. It will also contain the same equipment and layout once the renovations are complete. The third facility, in Portland, OR have not been decided yet and the company is presently assessing the merits of several different facilities.
2.3 Company Ownership
The company has eight investors, the majority of whom are employees of the the firm. Together they own 100% or 3,000 privately owned shares of the company. Markam Driving School is incorporated in the state of Delaware and obliged to perform under that state’s rules. By the rules of the company’s charter, no investor can trade, sell or dispose of any shares without first informing the board of directors.
Markam Driving School is presently seeking to find new investors to help offset the expenses of its planned expansion. The strategy entails a further issuance of 4,000 shares to these new shareholders.
Services
Markam Driving School offers a wide range of services as outlined in the detailed sections below. It is ultimately the goal of the company to offer a one-stop facility for all driver needs, including registration, licensing, etc. In this way the company could offer greater perceived value for the customer that he or she could use for their entire driving career.

The industry is highly competitive with suppliers having a great deal of power in setting and negotiating the prices of their products and services to driving schools. In addition, because the customers see the service as undifferentiated and a “commodity” with little value separation between competitors, buyer power is also very high, Finally, the barriers to entry are moderately low, and the large number of competitors in this field, including substitutes (such as in house training at institutions like high schools), mean that the pricing for such services are very competitive. The only way to have an advantage in this industry is a low-cost leadership principal applied aggressively to all aspects of the business.
Markam Driving School hires trained and certified instructors who provide all the teaching services. In addition, the company has a fleet of ten cars (both manual and automatic transmission) and five computer simulators that are used to train clients. Each of these pieces of equipment are maintained regularly and are replaced every few years to keep up with technology and to provide a high quality look to the company.
The company is preparing plans to launch a new commercial drivers training program that will provide greater margins that the ordinary operators or driver improvement programs. In addition, the company is negotiating with the Washington state DOT to have an outreach office placed within our facilities to provide the one-stop driver “superstore” that management envisions.
3.1 Service Description
Markam Drivers School provides a wide range of state-certified courses and services. These include:
- Adult evening and noon classes for the busy working individual.
- High school programs for school districts that do not have their own in-house services.
- Street safe courses.
- Court approved defensive driving courses for those people looking to reduce traffic fines.
- Brush up courses.
Each course requires that the student purchase their own reading and studying material and can last up to five weeks for the beginner student. Other courses range from two to four weeks. Instructors are required to have certain hours of the week made available for student questions and issues.
3.2 Competitive Comparison
The driver education industry is highly competitive. Each company within this field has high capital costs, low margins, and a high intensity of competition.
Suppliers have a great deal of power in setting and negotiating the prices of their products and services to driving schools. This is due to the fact that the suppliers who absorb the greatest amounts of cash from driving schools are large petroleum and auto manufacturer companies. These companies are more consolidated that the driving school industry, have deeper pockets, an almost limitless number of substitute customers, and finally they are the single most important supplier to MDS’s industry. Therefore, these companies can set whatever price they wish to. It has been MDS’s strategy to ease this issue by forming special partnerships with potential suppliers through symbiotic relationships and to seek new and unorthodox ways to acquire such supplies. For instance, the company now has an excellent relationship with Tesoro gasoline stations that provide us with a discount on all fuel purchased. In turn, we provide the company with an expanded avenue of marketing.
In addition, because the customers see the service as undifferentiated and a “commodity” with little value separation between competitors, buyer power is also very high. Market research conducted between January and August 1996 has shown that although the quality and services of driver education companies can vary quite a bit, the customer does not perceive this as a serious issue when seeking driver education services. In fact there is still a significant portion of the population that learn from informal sources such as relatives. Additionally, the costs of our services are not cheap, and buyers are willing to search for the most favorable combination of price and acceptable service.
The barriers to entry and exit are moderately low in this industry. Switching costs are virtually non-existent and the costs to entry and exist the market are low. However, the advantages of producing at high volume and reaping the benefits of economies of scale are quite attractive. Once MDS becomes a regional player, these economies of scale will work toward the company’s advantage.
The large number of competitors in this field, including substitutes such as in house training at institutions like high schools, mean that the pricing for such services are very competitive. The only way to have an advantage in this industry is a low-cost leadership principal applied aggressively to all aspects of the business.
3.3 Fulfillment
Markam Driving School hires trained and certified instructors who provide all the teaching services. In addition, the company has a fleet of ten cars (both manual and automatic transmission) and five computer simulators that are used to train clients. It is planned that each facility will have the same number and type of equipment. Each of these pieces of equipment are maintained regularly and are replaced every few years to keep up with technology and to provide a high-quality look to the company.
3.4 Technology
The technological revolution in computers has enhanced our abilities to teach. MDS has remained on the cutting edge by instituting the use of computer simulators and remote Web-accessed study material. The company will continue to seek new ways to provide a better and more convenient teaching environment through technology. The virtual class room is a thing of the near future, and we are positioning ourselves to be among the first who will provide such services.
3.5 Future Services
The company is in the process of launching a new division for the Seattle office that will encompass training classes for commercial drivers licenses and motorcycle licenses. These services will include comprehensive indoor training classes, job placement assistance for truck and bus drivers, and rented vehicles to practice with, and use for license testing. This program will be launched in 3rd quarter 2004. Depending on its success, management plans to incorporate this program into all the field offices by 3rd quarter 2005.
In addition, Markam Driving School is exploring the possibility of integrating a Washington state DMV outreach office within our facilities. Placed directly within our offices, this would offer a complete one-stop package for the customers who would be able to get licenses, registration, records and all other services a normal DMV could provide.
Market Analysis Summary
Just about every individual in this country needs driving education at one point or another in their lives. Therefore the potential market for MDS consists of every person age 15 and above in our geographical area of Seattle, WA. We segment this market into a series of groups based on their individual needs and different demographics. These segments are:
- Beginner drivers.
- Adult drivers.
- Drivers under court order.
- High schools.
- Commercial drivers.
Each of these groups are mentioned in more detail in the market segmentation section. Although MDS does not offer services for commercial drivers just yet, since this will be part of our business in the future, it is included here.
Each group has different needs based on lifestyle and past driving experience. Many of our adult drivers are people with tight work schedules who can only devote time for driver education at lunch hours and in the evenings. They often need brush up courses or defensive driver courses. For these individuals MDS has compressed courses designed to get the driver back onto the street quickly but safely.
For our beginner drivers, the majority of whom are teenagers, we offer courses both in the summertime, after school and AT their school. These course are usually longer, and devote more time to the mechanics of driving than the adult classes.
Finally, our future commercial drivers segment will require courses that are more technical in nature, most detailed and last the longest. Furthermore, many of the students will be able to take the classes during normal working hours. For these students, a more detailed syllabus with the best instructors is necessary.
4.1 Market Segmentation
Each group has different needs based on lifestyle and past driving experience. Many of our adult drivers are people with tight work schedules who can only devote time for driver education at lunch hours and in the evenings. We have designed classes that meet such needs. In addition, unlike our young students, many of the adults are pre-existing drivers who either need brush up courses, defensive driver courses or are required to take a course due to traffic violations. For these individuals MDS has compressed courses designed to get the driver back onto the street quickly but safely. These courses concentrate more on the rules of the road than on driving skills.
For our beginner drivers, the majority of whom are teenagers, we offer courses both in the summertime, after school and AT their school. These course are usually longer, and devote more time to the mechanics of driving than the adult classes. The high school segment falls under this larger category. It is separated out from the others since they are “corporate” customers who often bid for and negotiate contracts. Please note that in the Market Segmentation table, the numbers for the category “High School” denotes the estimated number of students, not schools.
Finally, our future commercial drivers segment will require courses that are more technical in nature, most detailed and last the longest. Furthermore, many of the students will be able to take the classes during normal working hours. For these students, a more detailed syllabus with the best instructors is necessary.

| Market Analysis | |||||||
| 2002 | 2003 | 2004 | 2005 | 2006 | |||
| Potential Customers | Growth | CAGR | |||||
| Beginner drivers (non teenagers) | 1% | 80,000 | 80,640 | 81,285 | 81,935 | 82,590 | 0.80% |
| Adult drivers | 1% | 68,000 | 68,510 | 69,024 | 69,542 | 70,064 | 0.75% |
| Drivers under court order | 2% | 300,000 | 305,400 | 310,897 | 316,493 | 322,190 | 1.80% |
| High schools | 3% | 625,000 | 642,500 | 660,490 | 678,984 | 697,996 | 2.80% |
| Commercial drivers | 3% | 40,000 | 41,280 | 42,601 | 43,964 | 45,371 | 3.20% |
| Total | 2.28% | 1,113,000 | 1,138,330 | 1,164,297 | 1,190,918 | 1,218,211 | 2.28% |
4.2 Service Business Analysis
This section is covered in the Competitive Comparison section of the Plan.
4.2.1 Competition and Buying Patterns
This industry is highly seasonal. Most of our students attend classes during the fall or spring, with winter being the slowest months. The summer sees a good number of students seeking our services, but not as many as in spring or fall.
Most customers of driver education services discover their provider through some form of referral, such as another education institution, the state DOT, or something else. For this reason, MDS and other providers seek to make as many contacts in the community as possible.
4.2.2 Main Competitors
As stated elsewhere, MDS’s major national competitors are Sears Driver Education Schools and Defensive Driving, Inc. These companies together hold about 45% market share, while the rest is taken up by the “mom and pop” outfits.
4.2.3 Business Participants
As stated earlier, the driver education industry is fragmented into two different types of businesses. The largest group consist of the “mom and pop” type of company that is very local, with low capitalization, and ranges in quality of education from poor to excellent.
The other group consists of a very few regional or national companies such as Sears driver Education School and Defensive Driving. These competitors are well funded, have excellent facilities and services and high quality. The two companies listed above are MDS’s major competitors in the Seattle area. These companies often try to buy out smaller competitors and therefore consolidate the market.
Strategy and Implementation Summary
The following subsections outline the marketing, pricing and promotion strategies, and competitive edges for Markam Driving School.
5.1 Marketing Strategy
At the moment, the company is focusing on its core market segment, the beginner students. This means creating closer ties with school districts and pursuing those contracts. In addition, the company is focusing on Web, magazine, newspaper and TV advertisements, all with a teen focus. Starting next year, MDS hopes to have some form of advertisements or booths within shopping malls frequented by our target market.
With the company’s expansion, we have focused on creating a detailed report on the lifestyles of our target market to further hone our marketing efforts. With this report we will be able to go forward with the best possible client organizations and partnerships to promote sales and to fill our classes to capacity.
5.1.1 Pricing Strategy
MDS prices its services based on the accumulated total cost to provide such services and then adds on a flat profit margin to arrive at a final net profit/sales ratio of 7%. In Washington state, the government regulates how much a company can charge for classes where the student must attend to remove, or reduce, some form of traffic violation. This margin is 4%. Therefore we usually see much lower sales figures for this category.
5.1.2 Promotion Strategy
Currently about half of MDS’s sales promotions are through information-related media such as the Web, Yellow Pages, teen magazines, TV, etc. The other half is done through creating a network of referrals and other relations to provide information to prospective students. It is with this latter method that the company uses it own printed literature. Often our strategic partners are passing out our literature or providing discounts on our services. Reciprocity is key here and MDS also provides literature/discounts on its partners to every incoming student. The company collects testimonials from as many students as possible to use in its campaign. Every three to six months, depending on the type of media used, or relationship sought, the company reviews the effectiveness of the promotion tool and determines its viability.
5.2 Competitive Edge
MDS possesses two competitive edges in relation to its rivals. The first one is its excellent ability to create strategic alliances that reduce costs and allow it to become the low-cost provider and create its vision of the one-stop driver support center. In addition the company has a very aggressive marketing executive in the person of Ellen James, who’s goal is to proactively discover how best to provide our services, when to provide them, and where to provide them. Ms. James work has spawned new service ideas such as Driver’s Ed Housecalls, a program that is now being evaluated where a driver educator could provide hands on teaching at a person’s home. Other ideas such as this are also in the works to improve service as much as possible.
Strategic Alliances
The following table and chart illustrate the projected sales forecast for Markam Driving School.


| Sales Forecast | |||
| 2002 | 2003 | 2004 | |
| Sales | |||
| Adult drivers | $223,000 | $253,164 | $281,012 |
| Beginner drivers | $285,000 | $312,075 | $346,403 |
| Drivers under court order | $171,388 | $187,670 | $208,314 |
| High schools | $324,650 | $355,492 | $394,596 |
| Commercial drivers | $0 | $0 | $12,000 |
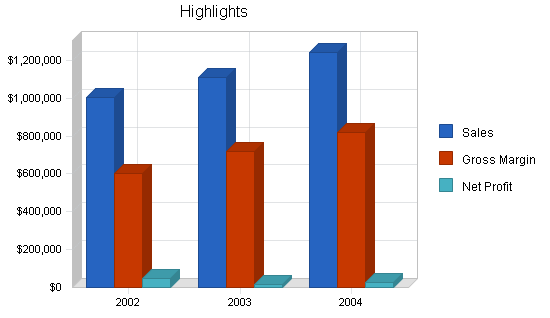
| Total Sales | $1,004,038 | $1,108,401 | $1,242,325 |
| Direct Cost of Sales | 2002 | 2003 | 2004 |
| Adult drivers | $89,200 | $88,607 | $95,544 |
| Beginner drivers | $114,000 | $109,226 | $117,777 |
| Drivers under court order | $68,555 | $65,684 | $70,827 |
| High schools | $129,860 | $124,422 | $134,163 |
| Commercial drivers | $0 | $0 | $4,080 |
| Subtotal Direct Cost of Sales | $401,615 | $387,940 | $422,390 |
Management Summary
MDS has a great management staff that provides comprehensive direction for the company’s day-to-day operations and for its future planning. This included Mr. Markam, the president and general manager, the marketing executive, Ellen James, William Harper, the company’s controller, and the two individuals responsible for education planning and coordination, Jane Wilkes and Ken Tomas. Each of these individuals, with the exception of Ms. James, has been with the company from the beginning and are principal shareholders. The company functions with a hierarchical structure with each manager heading up a department or section and answerable to Mr. Markam. Mr. Tomas is responsible for managing each of the individual educators.
7.1 Personnel Plan
The company’s expansion to include two additional offices will put a great deal of strain on the company’s existing management. Each of the company’s four principal officers, with the exception of the marketing coordinator and the controller, are expected to become the facilities manager for each of the existing or proposed sites, along with their current duties. At this time management does not feel comfortable with hiring new managers for these positions. Once the profitability of each site becomes apparent, the general manager will determine the need to add on additional personnel.
| Personnel Plan | |||
| 2002 | 2003 | 2004 | |
| President and General Manager | $48,000 | $48,000 | $48,000 |
| Controller | $48,000 | $48,000 | $48,000 |
| Education Planner | $36,000 | $48,000 | $48,000 |
| Education Coordinator | $36,000 | $48,000 | $48,000 |
| Facilities Mangers | $0 | $35,000 | $35,000 |
| Office Manager | $24,000 | $36,000 | $36,000 |
| Marketing Executive (Contract work) | $15,000 | $15,000 | $15,000 |
| Educators | $128,500 | $180,000 | $250,000 |
| Total People | 15 | 20 | 26 |
| Total Payroll | $335,500 | $458,000 | $528,000 |
Financial Plan
The following subsections outline the financial plan for Markam Driving School.
8.1 Break-even Analysis
The company’s Break-even Analysis is based on the company’s running costs, including payroll, and its present fixed costs, not including the expenses associated with the firm’s planned expansion.

| Break-even Analysis | |
| Monthly Revenue Break-even | $74,087 |
| Assumptions: | |
| Average Percent Variable Cost | 40% |
| Estimated Monthly Fixed Cost | $44,452 |
8.2 Projected Profit and Loss
The following table is the projected Profit and Loss statement for Markam.
| Pro Forma Profit and Loss | |||
| 2002 | 2003 | 2004 | |
| Sales | $1,004,038 | $1,108,401 | $1,242,325 |
| Direct Cost of Sales | $401,615 | $387,940 | $422,390 |
| Other Production Expenses | $0 | $0 | $0 |
| Total Cost of Sales | $401,615 | $387,940 | $422,390 |
| Gross Margin | $602,423 | $720,460 | $819,934 |
| Gross Margin % | 60.00% | 65.00% | 66.00% |
| Expenses | |||
| Payroll | $335,500 | $458,000 | $528,000 |
| Sales and Marketing and Other Expenses | $52,000 | $58,000 | $66,000 |
| Depreciation | $3,200 | $5,000 | $5,000 |
| Leased Equipment | $22,000 | $16,000 | $10,000 |
| Utilities | $4,600 | $8,000 | $8,000 |
| Insurance | $13,800 | $14,400 | $14,400 |
| Rent | $52,000 | $72,000 | $72,000 |
| Payroll Taxes | $50,325 | $68,700 | $79,200 |
| Other | $0 | $0 | $0 |
| Total Operating Expenses | $533,425 | $700,100 | $782,600 |
| Profit Before Interest and Taxes | $68,998 | $20,360 | $37,334 |
| EBITDA | $72,198 | $25,360 | $42,334 |
| Interest Expense | $1,975 | $1,400 | $800 |
| Taxes Incurred | $20,107 | $5,688 | $10,960 |
| Net Profit | $46,916 | $13,272 | $25,574 |
| Net Profit/Sales | 4.67% | 1.20% | 2.06% |
8.3 Projected Cash Flow
The following table and chart show the projected cash flow and cash balance figures for Markam Driving School.

| Pro Forma Cash Flow | |||
| 2002 | 2003 | 2004 | |
| Cash Received | |||
| Cash from Operations | |||
| Cash Sales | $1,004,038 | $1,108,401 | $1,242,325 |
| Subtotal Cash from Operations | $1,004,038 | $1,108,401 | $1,242,325 |
| Additional Cash Received | |||
| Sales Tax, VAT, HST/GST Received | $0 | $0 | $0 |
| New Current Borrowing | $0 | $0 | $0 |
| New Other Liabilities (interest-free) | $0 | $0 | $0 |
| New Long-term Liabilities | $0 | $0 | $0 |
| Sales of Other Current Assets | $0 | $0 | $0 |
| Sales of Long-term Assets | $0 | $0 | $0 |
| New Investment Received | $0 | $0 | $0 |
| Subtotal Cash Received | $1,004,038 | $1,108,401 | $1,242,325 |
| Expenditures | 2002 | 2003 | 2004 |
| Expenditures from Operations | |||
| Cash Spending | $335,500 | $458,000 | $528,000 |
| Bill Payments | $554,858 | $647,453 | $679,508 |
| Subtotal Spent on Operations | $890,358 | $1,105,453 | $1,207,508 |
| Additional Cash Spent | |||
| Sales Tax, VAT, HST/GST Paid Out | $0 | $0 | $0 |
| Principal Repayment of Current Borrowing | $0 | $0 | $0 |
| Other Liabilities Principal Repayment | $0 | $0 | $0 |
| Long-term Liabilities Principal Repayment | $6,000 | $6,000 | $6,000 |
| Purchase Other Current Assets | $0 | $0 | $0 |
| Purchase Long-term Assets | $0 | $0 | $0 |
| Dividends | $0 | $40,000 | $40,000 |
| Subtotal Cash Spent | $896,358 | $1,151,453 | $1,253,508 |
| Net Cash Flow | $107,680 | ($43,052) | ($11,183) |
| Cash Balance | $120,618 | $77,566 | $66,383 |
8.4 Projected Balance Sheet
The following table contains the projected balance sheet.
| Pro Forma Balance Sheet | |||
| 2002 | 2003 | 2004 | |
| Assets | |||
| Current Assets | |||
| Cash | $120,618 | $77,566 | $66,383 |
| Other Current Assets | $2,000 | $2,000 | $2,000 |
| Total Current Assets | $122,618 | $79,566 | $68,383 |
| Long-term Assets | |||
| Long-term Assets | $74,000 | $74,000 | $74,000 |
| Accumulated Depreciation | $15,200 | $20,200 | $25,200 |
| Total Long-term Assets | $58,800 | $53,800 | $48,800 |
| Total Assets | $181,418 | $133,366 | $117,183 |
| Liabilities and Capital | 2002 | 2003 | 2004 |
| Current Liabilities | |||
| Accounts Payable | $67,280 | $51,956 | $56,199 |
| Current Borrowing | $0 | $0 | $0 |
| Other Current Liabilities | $0 | $0 | $0 |
| Subtotal Current Liabilities | $67,280 | $51,956 | $56,199 |
| Long-term Liabilities | $17,000 | $11,000 | $5,000 |
| Total Liabilities | $84,280 | $62,956 | $61,199 |
| Paid-in Capital | $30,000 | $30,000 | $30,000 |
| Retained Earnings | $20,222 | $27,138 | $410 |
| Earnings | $46,916 | $13,272 | $25,574 |
| Total Capital | $97,138 | $70,410 | $55,984 |
| Total Liabilities and Capital | $181,418 | $133,366 | $117,183 |
| Net Worth | $97,138 | $70,410 | $55,984 |
8.5 Business Ratios
The industry business ratios given in the table are those for vocational schools based on the Standard Industrial Classification (SIC) code 8299. Most of the ratios are similar to our own. The only major difference between our company and others is our reliance on long-term assets. This is due to having the majority of our investment in a fleet of cars. Overall the ratios reflect a healthy and growing company with few danger signs.
| Ratio Analysis | ||||
| 2002 | 2003 | 2004 | Industry Profile | |
| Sales Growth | 34.59% | 10.39% | 12.08% | 9.50% |
| Percent of Total Assets | ||||
| Other Current Assets | 1.10% | 1.50% | 1.71% | 44.20% |
| Total Current Assets | 67.59% | 59.66% | 58.36% | 70.80% |
| Long-term Assets | 32.41% | 40.34% | 41.64% | 29.20% |
| Total Assets | 100.00% | 100.00% | 100.00% | 100.00% |
| Current Liabilities | 37.09% | 38.96% | 47.96% | 52.10% |
| Long-term Liabilities | 9.37% | 8.25% | 4.27% | 12.40% |
| Total Liabilities | 46.46% | 47.21% | 52.22% | 64.50% |
| Net Worth | 53.54% | 52.79% | 47.78% | 35.50% |
| Percent of Sales | ||||
| Sales | 100.00% | 100.00% | 100.00% | 100.00% |
| Gross Margin | 60.00% | 65.00% | 66.00% | n.a |
| Selling, General & Administrative Expenses | 55.33% | 63.80% | 63.94% | 74.00% |
| Advertising Expenses | 1.54% | 2.26% | 2.82% | 4.60% |
| Profit Before Interest and Taxes | 6.87% | 1.84% | 3.01% | 2.40% |
| Main Ratios | ||||
| Current | 1.82 | 1.53 | 1.22 | 1.30 |
| Quick | 1.82 | 1.53 | 1.22 | 1.08 |
| Total Debt to Total Assets | 46.46% | 47.21% | 52.22% | 64.50% |
| Pre-tax Return on Net Worth | 69.00% | 26.93% | 65.26% | 4.60% |
| Pre-tax Return on Assets | 36.94% | 14.22% | 31.18% | 13.00% |
| Additional Ratios | 2002 | 2003 | 2004 | |
| Net Profit Margin | 4.67% | 1.20% | 2.06% | n.a |
| Return on Equity | 48.30% | 18.85% | 45.68% | n.a |
| Activity Ratios | ||||
| Accounts Payable Turnover | 9.19 | 12.17 | 12.17 | n.a |
| Payment Days | 27 | 34 | 29 | n.a |
| Total Asset Turnover | 5.53 | 8.31 | 10.60 | n.a |
| Debt Ratios | ||||
| Debt to Net Worth | 0.87 | 0.89 | 1.09 | n.a |
| Current Liab. to Liab. | 0.80 | 0.83 | 0.92 | n.a |
| Liquidity Ratios | ||||
| Net Working Capital | $55,338 | $27,610 | $12,184 | n.a |
| Interest Coverage | 34.94 | 14.54 | 46.67 | n.a |
| Additional Ratios | ||||
| Assets to Sales | 0.18 | 0.12 | 0.09 | n.a |
| Current Debt/Total Assets | 37% | 39% | 48% | n.a |
| Acid Test | 1.82 | 1.53 | 1.22 | n.a |
| Sales/Net Worth | 10.34 | 15.74 | 22.19 | n.a |
| Dividend Payout | 0.00 | 3.01 | 1.56 | n.a |
Appendix
| Sales Forecast | |||||||||||||
| Jan | Feb | Mar | Apr | May | Jun | Jul | Aug | Sep | Oct | Nov | Dec | ||
| Sales | |||||||||||||
| Adult drivers | 0% | $14,000 | $14,000 | $14,000 | $14,000 | $14,000 | $20,000 | $20,000 | $20,000 | $24,000 | $25,000 | $21,000 | $23,000 |
| Beginner drivers | 0% | $18,000 | $18,000 | $18,000 | $18,000 | $18,000 | $24,000 | $24,000 | $24,000 | $28,000 | $26,000 | $33,000 | $36,000 |
| Drivers under court order | 0% | $11,500 | $11,500 | $11,500 | $11,500 | $11,500 | $14,000 | $14,000 | $14,000 | $17,000 | $18,000 | $18,888 | $18,000 |
| High schools | 0% | $20,850 | $20,850 | $20,850 | $20,850 | $20,850 | $25,000 | $25,000 | $25,000 | $41,700 | $41,700 | $31,000 | $31,000 |
| Commercial drivers | 0% | $0 | $0 | $0 | $0 | $0 | $0 | $0 | $0 | $0 | $0 | $0 | $0 |
| Total Sales | $64,350 | $64,350 | $64,350 | $64,350 | $64,350 | $83,000 | $83,000 | $83,000 | $110,700 | $110,700 | $103,888 | $108,000 | |
| Direct Cost of Sales | Jan | Feb | Mar | Apr | May | Jun | Jul | Aug | Sep | Oct | Nov | Dec | |
| Adult drivers | $5,600 | $5,600 | $5,600 | $5,600 | $5,600 | $8,000 | $8,000 | $8,000 | $9,600 | $10,000 | $8,400 | $9,200 | |
| Beginner drivers | $7,200 | $7,200 | $7,200 | $7,200 | $7,200 | $9,600 | $9,600 | $9,600 | $11,200 | $10,400 | $13,200 | $14,400 | |
| Drivers under court order | $4,600 | $4,600 | $4,600 | $4,600 | $4,600 | $5,600 | $5,600 | $5,600 | $6,800 | $7,200 | $7,555 | $7,200 | |
| High schools | $8,340 | $8,340 | $8,340 | $8,340 | $8,340 | $10,000 | $10,000 | $10,000 | $16,680 | $16,680 | $12,400 | $12,400 | |
| Commercial drivers | $0 | $0 | $0 | $0 | $0 | $0 | $0 | $0 | $0 | $0 | $0 | $0 | |
| Subtotal Direct Cost of Sales | $25,740 | $25,740 | $25,740 | $25,740 | $25,740 | $33,200 | $33,200 | $33,200 | $44,280 | $44,280 | $41,555 | $43,200 | |
| Personnel Plan | |||||||||||||
| Jan | Feb | Mar | Apr | May | Jun | Jul | Aug | Sep | Oct | Nov | Dec | ||
| President and General Manager | 0% | $4,000 | $4,000 | $4,000 | $4,000 | $4,000 | $4,000 | $4,000 | $4,000 | $4,000 | $4,000 | $4,000 | $4,000 |
| Controller | 0% | $4,000 | $4,000 | $4,000 | $4,000 | $4,000 | $4,000 | $4,000 | $4,000 | $4,000 | $4,000 | $4,000 | $4,000 |
| Education Planner | 0% | $3,000 | $3,000 | $3,000 | $3,000 | $3,000 | $3,000 | $3,000 | $3,000 | $3,000 | $3,000 | $3,000 | $3,000 |
| Education Coordinator | 0% | $3,000 | $3,000 | $3,000 | $3,000 | $3,000 | $3,000 | $3,000 | $3,000 | $3,000 | $3,000 | $3,000 | $3,000 |
| Facilities Mangers | 0% | $0 | $0 | $0 | $0 | $0 | $0 | $0 | $0 | $0 | $0 | $0 | $0 |
| Office Manager | 0% | $2,000 | $2,000 | $2,000 | $2,000 | $2,000 | $2,000 | $2,000 | $2,000 | $2,000 | $2,000 | $2,000 | $2,000 |
| Marketing Executive (Contract work) | 0% | $1,250 | $1,250 | $1,250 | $1,250 | $1,250 | $1,250 | $1,250 | $1,250 | $1,250 | $1,250 | $1,250 | $1,250 |
| Educators | 0% | $7,500 | $7,500 | $7,500 | $7,500 | $7,500 | $13,000 | $13,000 | $13,000 | $13,000 | $13,000 | $13,000 | $13,000 |
| Total People | 11 | 11 | 11 | 11 | 11 | 15 | 15 | 15 | 15 | 15 | 15 | 15 | |
| Total Payroll | $24,750 | $24,750 | $24,750 | $24,750 | $24,750 | $30,250 | $30,250 | $30,250 | $30,250 | $30,250 | $30,250 | $30,250 | |
| General Assumptions | |||||||||||||
| Jan | Feb | Mar | Apr | May | Jun | Jul | Aug | Sep | Oct | Nov | Dec | ||
| Plan Month | 1 | 2 | 3 | 4 | 5 | 6 | 7 | 8 | 9 | 10 | 11 | 12 | |
| Current Interest Rate | 10.00% | 10.00% | 10.00% | 10.00% | 10.00% | 10.00% | 10.00% | 10.00% | 10.00% | 10.00% | 10.00% | 10.00% | |
| Long-term Interest Rate | 10.00% | 10.00% | 10.00% | 10.00% | 10.00% | 10.00% | 10.00% | 10.00% | 10.00% | 10.00% | 10.00% | 10.00% | |
| Tax Rate | 30.00% | 30.00% | 30.00% | 30.00% | 30.00% | 30.00% | 30.00% | 30.00% | 30.00% | 30.00% | 30.00% | 30.00% | |
| Other | 0 | 0 | 0 | 0 | 0 | 0 | 0 | 0 | 0 | 0 | 0 | 0 | |
| Pro Forma Profit and Loss | |||||||||||||
| Jan | Feb | Mar | Apr | May | Jun | Jul | Aug | Sep | Oct | Nov | Dec | ||
| Sales | $64,350 | $64,350 | $64,350 | $64,350 | $64,350 | $83,000 | $83,000 | $83,000 | $110,700 | $110,700 | $103,888 | $108,000 | |
| Direct Cost of Sales | $25,740 | $25,740 | $25,740 | $25,740 | $25,740 | $33,200 | $33,200 | $33,200 | $44,280 | $44,280 | $41,555 | $43,200 | |
| Other Production Expenses | $0 | $0 | $0 | $0 | $0 | $0 | $0 | $0 | $0 | $0 | $0 | $0 | |
| Total Cost of Sales | $25,740 | $25,740 | $25,740 | $25,740 | $25,740 | $33,200 | $33,200 | $33,200 | $44,280 | $44,280 | $41,555 | $43,200 | |
| Gross Margin | $38,610 | $38,610 | $38,610 | $38,610 | $38,610 | $49,800 | $49,800 | $49,800 | $66,420 | $66,420 | $62,333 | $64,800 | |
| Gross Margin % | 60.00% | 60.00% | 60.00% | 60.00% | 60.00% | 60.00% | 60.00% | 60.00% | 60.00% | 60.00% | 60.00% | 60.00% | |
| Expenses | |||||||||||||
| Payroll | $24,750 | $24,750 | $24,750 | $24,750 | $24,750 | $30,250 | $30,250 | $30,250 | $30,250 | $30,250 | $30,250 | $30,250 | |
| Sales and Marketing and Other Expenses | $2,900 | $2,900 | $2,900 | $2,900 | $2,900 | $4,500 | $4,500 | $4,500 | $6,000 | $6,000 | $6,000 | $6,000 | |
| Depreciation | $200 | $200 | $200 | $200 | $200 | $200 | $200 | $200 | $400 | $400 | $400 | $400 | |
| Leased Equipment | $0 | $0 | $0 | $0 | $0 | $2,000 | $2,000 | $2,000 | $4,000 | $4,000 | $4,000 | $4,000 | |
| Utilities | $200 | $200 | $200 | $200 | $200 | $400 | $400 | $400 | $600 | $600 | $600 | $600 | |
| Insurance | $600 | $600 | $600 | $600 | $600 | $1,200 | $1,200 | $1,200 | $1,800 | $1,800 | $1,800 | $1,800 | |
| Rent | $2,000 | $2,000 | $4,000 | $4,000 | $4,000 | $4,000 | $4,000 | $4,000 | $6,000 | $6,000 | $6,000 | $6,000 | |
| Payroll Taxes | 15% | $3,713 | $3,713 | $3,713 | $3,713 | $3,713 | $4,538 | $4,538 | $4,538 | $4,538 | $4,538 | $4,538 | $4,538 |
| Other | $0 | $0 | $0 | $0 | $0 | $0 | $0 | $0 | $0 | $0 | $0 | $0 | |
| Total Operating Expenses | $34,363 | $34,363 | $36,363 | $36,363 | $36,363 | $47,088 | $47,088 | $47,088 | $53,588 | $53,588 | $53,588 | $53,588 | |
| Profit Before Interest and Taxes | $4,248 | $4,248 | $2,248 | $2,248 | $2,248 | $2,713 | $2,713 | $2,713 | $12,833 | $12,833 | $8,745 | $11,213 | |
| EBITDA | $4,448 | $4,448 | $2,448 | $2,448 | $2,448 | $2,913 | $2,913 | $2,913 | $13,233 | $13,233 | $9,145 | $11,613 | |
| Interest Expense | $188 | $183 | $179 | $175 | $171 | $167 | $163 | $158 | $154 | $150 | $146 | $142 | |
| Taxes Incurred | $1,218 | $1,219 | $621 | $622 | $623 | $764 | $765 | $766 | $3,804 | $3,805 | $2,580 | $3,321 | |
| Net Profit | $2,842 | $2,845 | $1,448 | $1,451 | $1,454 | $1,782 | $1,785 | $1,788 | $8,875 | $8,878 | $6,020 | $7,750 | |
| Net Profit/Sales | 4.42% | 4.42% | 2.25% | 2.25% | 2.26% | 2.15% | 2.15% | 2.15% | 8.02% | 8.02% | 5.79% | 7.18% | |
| Pro Forma Cash Flow | |||||||||||||
| Jan | Feb | Mar | Apr | May | Jun | Jul | Aug | Sep | Oct | Nov | Dec | ||
| Cash Received | |||||||||||||
| Cash from Operations | |||||||||||||
| Cash Sales | $64,350 | $64,350 | $64,350 | $64,350 | $64,350 | $83,000 | $83,000 | $83,000 | $110,700 | $110,700 | $103,888 | $108,000 | |
| Subtotal Cash from Operations | $64,350 | $64,350 | $64,350 | $64,350 | $64,350 | $83,000 | $83,000 | $83,000 | $110,700 | $110,700 | $103,888 | $108,000 | |
| Additional Cash Received | |||||||||||||
| Sales Tax, VAT, HST/GST Received | 0.00% | $0 | $0 | $0 | $0 | $0 | $0 | $0 | $0 | $0 | $0 | $0 | $0 |
| New Current Borrowing | $0 | $0 | $0 | $0 | $0 | $0 | $0 | $0 | $0 | $0 | $0 | $0 | |
| New Other Liabilities (interest-free) | $0 | $0 | $0 | $0 | $0 | $0 | $0 | $0 | $0 | $0 | $0 | $0 | |
| New Long-term Liabilities | $0 | $0 | $0 | $0 | $0 | $0 | $0 | $0 | $0 | $0 | $0 | $0 | |
| Sales of Other Current Assets | $0 | $0 | $0 | $0 | $0 | $0 | $0 | $0 | $0 | $0 | $0 | $0 | |
| Sales of Long-term Assets | $0 | $0 | $0 | $0 | $0 | $0 | $0 | $0 | $0 | $0 | $0 | $0 | |
| New Investment Received | $0 | $0 | $0 | $0 | $0 | $0 | $0 | $0 | $0 | $0 | $0 | $0 | |
| Subtotal Cash Received | $64,350 | $64,350 | $64,350 | $64,350 | $64,350 | $83,000 | $83,000 | $83,000 | $110,700 | $110,700 | $103,888 | $108,000 | |
| Expenditures | Jan | Feb | Mar | Apr | May | Jun | Jul | Aug | Sep | Oct | Nov | Dec | |
| Expenditures from Operations | |||||||||||||
| Cash Spending | $24,750 | $24,750 | $24,750 | $24,750 | $24,750 | $30,250 | $30,250 | $30,250 | $30,250 | $30,250 | $30,250 | $30,250 | |
| Bill Payments | $4,935 | $36,558 | $36,602 | $37,952 | $37,949 | $38,374 | $50,768 | $50,765 | $51,443 | $71,175 | $71,040 | $67,298 | |
| Subtotal Spent on Operations | $29,685 | $61,308 | $61,352 | $62,702 | $62,699 | $68,624 | $81,018 | $81,015 | $81,693 | $101,425 | $101,290 | $97,548 | |
| Additional Cash Spent | |||||||||||||
| Sales Tax, VAT, HST/GST Paid Out | $0 | $0 | $0 | $0 | $0 | $0 | $0 | $0 | $0 | $0 | $0 | $0 | |
| Principal Repayment of Current Borrowing | $0 | $0 | $0 | $0 | $0 | $0 | $0 | $0 | $0 | $0 | $0 | $0 | |
| Other Liabilities Principal Repayment | $0 | $0 | $0 | $0 | $0 | $0 | $0 | $0 | $0 | $0 | $0 | $0 | |
| Long-term Liabilities Principal Repayment | $500 | $500 | $500 | $500 | $500 | $500 | $500 | $500 | $500 | $500 | $500 | $500 | |
| Purchase Other Current Assets | $0 | $0 | $0 | $0 | $0 | $0 | $0 | $0 | $0 | $0 | $0 | $0 | |
| Purchase Long-term Assets | $0 | $0 | $0 | $0 | $0 | $0 | $0 | $0 | $0 | $0 | $0 | $0 | |
| Dividends | $0 | $0 | $0 | $0 | $0 | $0 | $0 | $0 | $0 | $0 | $0 | $0 | |
| Subtotal Cash Spent | $30,185 | $61,808 | $61,852 | $63,202 | $63,199 | $69,124 | $81,518 | $81,515 | $82,193 | $101,925 | $101,790 | $98,048 | |
| Net Cash Flow | $34,165 | $2,542 | $2,498 | $1,148 | $1,151 | $13,876 | $1,482 | $1,485 | $28,507 | $8,775 | $2,098 | $9,952 | |
| Cash Balance | $47,103 | $49,645 | $52,144 | $53,292 | $54,443 | $68,319 | $69,801 | $71,286 | $99,794 | $108,569 | $110,666 | $120,618 | |
| Pro Forma Balance Sheet | |||||||||||||
| Jan | Feb | Mar | Apr | May | Jun | Jul | Aug | Sep | Oct | Nov | Dec | ||
| Assets | Starting Balances | ||||||||||||
| Current Assets | |||||||||||||
| Cash | $12,938 | $47,103 | $49,645 | $52,144 | $53,292 | $54,443 | $68,319 | $69,801 | $71,286 | $99,794 | $108,569 | $110,666 | $120,618 |
| Other Current Assets | $2,000 | $2,000 | $2,000 | $2,000 | $2,000 | $2,000 | $2,000 | $2,000 | $2,000 | $2,000 | $2,000 | $2,000 | $2,000 |
| Total Current Assets | $14,938 | $49,103 | $51,645 | $54,144 | $55,292 | $56,443 | $70,319 | $71,801 | $73,286 | $101,794 | $110,569 | $112,666 | $122,618 |
| Long-term Assets | |||||||||||||
| Long-term Assets | $74,000 | $74,000 | $74,000 | $74,000 | $74,000 | $74,000 | $74,000 | $74,000 | $74,000 | $74,000 | $74,000 | $74,000 | $74,000 |
| Accumulated Depreciation | $12,000 | $12,200 | $12,400 | $12,600 | $12,800 | $13,000 | $13,200 | $13,400 | $13,600 | $14,000 | $14,400 | $14,800 | $15,200 |
| Total Long-term Assets | $62,000 | $61,800 | $61,600 | $61,400 | $61,200 | $61,000 | $60,800 | $60,600 | $60,400 | $60,000 | $59,600 | $59,200 | $58,800 |
| Total Assets | $76,938 | $110,903 | $113,245 | $115,544 | $116,492 | $117,443 | $131,119 | $132,401 | $133,686 | $161,794 | $170,169 | $171,866 | $181,418 |
| Liabilities and Capital | Jan | Feb | Mar | Apr | May | Jun | Jul | Aug | Sep | Oct | Nov | Dec | |
| Current Liabilities | |||||||||||||
| Accounts Payable | $3,716 | $35,339 | $35,337 | $36,687 | $36,684 | $36,681 | $49,076 | $49,073 | $49,070 | $68,803 | $68,800 | $64,978 | $67,280 |
| Current Borrowing | $0 | $0 | $0 | $0 | $0 | $0 | $0 | $0 | $0 | $0 | $0 | $0 | $0 |
| Other Current Liabilities | $0 | $0 | $0 | $0 | $0 | $0 | $0 | $0 | $0 | $0 | $0 | $0 | $0 |
| Subtotal Current Liabilities | $3,716 | $35,339 | $35,337 | $36,687 | $36,684 | $36,681 | $49,076 | $49,073 | $49,070 | $68,803 | $68,800 | $64,978 | $67,280 |
| Long-term Liabilities | $23,000 | $22,500 | $22,000 | $21,500 | $21,000 | $20,500 | $20,000 | $19,500 | $19,000 | $18,500 | $18,000 | $17,500 | $17,000 |
| Total Liabilities | $26,716 | $57,839 | $57,337 | $58,187 | $57,684 | $57,181 | $69,076 | $68,573 | $68,070 | $87,303 | $86,800 | $82,478 | $84,280 |
| Paid-in Capital | $30,000 | $30,000 | $30,000 | $30,000 | $30,000 | $30,000 | $30,000 | $30,000 | $30,000 | $30,000 | $30,000 | $30,000 | $30,000 |
| Retained Earnings | $20,222 | $20,222 | $20,222 | $20,222 | $20,222 | $20,222 | $20,222 | $20,222 | $20,222 | $20,222 | $20,222 | $20,222 | $20,222 |
| Earnings | $0 | $2,842 | $5,687 | $7,135 | $8,586 | $10,039 | $11,821 | $13,606 | $15,394 | $24,269 | $33,147 | $39,166 | $46,916 |
| Total Capital | $50,222 | $53,064 | $55,909 | $57,357 | $58,808 | $60,261 | $62,043 | $63,828 | $65,616 | $74,491 | $83,369 | $89,388 | $97,138 |
| Total Liabilities and Capital | $76,938 | $110,903 | $113,245 | $115,544 | $116,492 | $117,443 | $131,119 | $132,401 | $133,686 | $161,794 | $170,169 | $171,866 | $181,418 |
| Net Worth | $50,222 | $53,064 | $55,909 | $57,357 | $58,808 | $60,261 | $62,043 | $63,828 | $65,616 | $74,491 | $83,369 | $89,388 | $97,138 |

