
Noah's Arf
Executive Summary
Noah’s Arf is a full-service animal care facility dedicated to consistently providing high customer satisfaction by rendering excellent service, quality pet care, and furnishing a fun, clean, enjoyable atmosphere at an acceptable price. We will maintain a friendly creative work environment which respects diversity, ideas, and hard work.
The timing is right for starting this new venture. Animals are playing a larger role in our lives, and working people are choosing to provide them with a good life. Loving families with active pets and an active conscience are in search of better lives for their pets and peace of mind for themselves, causing busy animal lovers to flock to an ever-growing number of animal day care facilities across the nation. For customer convenience, in addition to day care, Noah’s Arf will include overnight care, in-home care, wash your own, pet grooming, animal behavior, pet portraits, gift and pet specialty products, 24 hour service, and special requests, all at one facility.
Kris Price, owner, has worked at a high paced, customer service oriented profession at a growing company for twenty-three years. She has earned the respect of her colleagues through hard work and dedication. Her daughter is a graduate from veterinarian technical college and will join the staff in the fall of Year 1. Kris cares for pets of friends often, and at any given time there have been one or more animals living in her home. From business colleagues to friends surveyed, Kris has what it takes to make this venture extremely successful. She will count on her reputation to exceed expectations while continuously establishing an active client base.
To achieve our objectives, Noah’s Arf is seeking a long-term commercial loan. This loan will be paid back from the cash flow of the business within seven years, collateralized by the assets of the company, backed by personal integrity, experience and a contractual guarantee from the owner. Start-up costs will be used to purchase fixed assets, supplies, advertising, and opening cash on hand.
1.1 Objectives
- Monthly sales increasing steadily throughout FY 1.
- Gross margin higher than 50% on pet products.
- Full capacity by year end FY 2.
- Expansion of services by FY 3.
1.2 Mission
To provide excellent animal care in a pet friendly atmosphere while ensuring our customers, both pet and owner, receive excellent service in a playful safe environment.
1.3 Keys to Success
The keys to success in our business are:
- Superior Customer Service: 24 hour high-quality care and service.
- Environment: provide a clean, upscale, odor free, enjoyable environment conducive to giving professional trusting service.
- Convenience: offering clients a wide range of services in one environment.
- Location: provide an easily accessible location for customer convenience.
- Reputation: credibility, integrity, and 100% dedication from 23+ years employment at current workplace.
Company Summary
Noah’s Arf is a new company that will provide high-level animal care and customer service in the following categories:
- Overnight care.
- Day care.
- In-home care.
- Wash your own pet.
- Pet grooming.
- Animal behavior classes.
- Pet portraits.
- Gift shop.
- Special events.
- Special requests.
- 24 hour service.
What will set Noah’s Arf apart from the competition is our commitment to provide these services in one convenient location that is not limited to dogs and cats.
2.1 Company Ownership
Noah’s Arf will be created as a Oregon Limited Liability Company (LLC) based in Multnomah County, privately owned by its principal operator.
2.2 Start-up Summary
Total start-up requirements include legal costs, logo design, stationery and related expenses. The start-up costs are to be financed partially by the direct owner investment and long-term loan financing. The details are included in the following table and chart.

| Start-up | |
| Requirements | |
| Start-up Expenses | |
| Legal and Accounting | $2,000 |
| Office Supplies (stationery, etc) | $500 |
| Collateral Materials (brochures, cards, etc.) | $4,000 |
| Consultants/Permits | $5,000 |
| Insurance | $3,000 |
| Rent/Lease | $7,500 |
| Space design/contractor | $2,000 |
| Sales and Marketing (advertising, direct mail, etc) | $2,500 |
| Expensed equipment | $0 |
| Other | $500 |
| Total Start-up Expenses | $27,000 |
| Start-up Assets | |
| Cash Required | $39,000 |
| Start-up Inventory | $4,000 |
| Other Current Assets | $0 |
| Long-term Assets | $100,000 |
| Total Assets | $143,000 |
| Total Requirements | $170,000 |
| Start-up Funding | |
| Start-up Expenses to Fund | $27,000 |
| Start-up Assets to Fund | $143,000 |
| Total Funding Required | $170,000 |
| Assets | |
| Non-cash Assets from Start-up | $104,000 |
| Cash Requirements from Start-up | $39,000 |
| Additional Cash Raised | $0 |
| Cash Balance on Starting Date | $39,000 |
| Total Assets | $143,000 |
| Liabilities and Capital | |
| Liabilities | |
| Current Borrowing | $0 |
| Long-term Liabilities | $100,000 |
| Accounts Payable (Outstanding Bills) | $0 |
| Other Current Liabilities (interest-free) | $0 |
| Total Liabilities | $100,000 |
| Capital | |
| Planned Investment | |
| Investor 1 | $70,000 |
| Investor 2 | $0 |
| Other | $0 |
| Additional Investment Requirement | $0 |
| Total Planned Investment | $70,000 |
| Loss at Start-up (Start-up Expenses) | ($27,000) |
| Total Capital | $43,000 |
| Total Capital and Liabilities | $143,000 |
| Total Funding | $170,000 |
2.3 Company Locations and Facilities
This facility will be established in an upscale, growing area in Northwest Portland described as the Pearl District. We will service the growing condominium area, the West Hills area, while capturing the Beaverton area for those customers coming into the Downtown Portland and airport areas. The facility is zoned EXD, which will allow day and overnight care.
Products and Services
Noah’s Arf wants to set itself apart from other animal service facilities that may offer only one or two types of services. While talking to several pet owners, I have come to realize they desire the services I am proposing, but are frustrated because they must go to several different businesses. The focus of Noah’s Arf is day care and overnight care. However, the services we provide will be above and beyond what our competition can offer.
Our business atmosphere will be clean, friendly and upscale where customers will be comfortable leaving their pets. We will offer a personal touch, such as birthday cards and a daily report card for each pet that is registered with Noah’s Arf.
Our business will offer 24 hour service, a unique concept in this type of industry.
3.1 Product and Service Description
Noah’s Arf will be considered an upscale, full-service animal care facility. We will offer a wide range of services, not limited to dogs or cats. Services are as follows:
- Overnight Care: Leave your pet for as long as necessary for 24 hour care and attention. 26 large dog runs and eight kitty condos.
- Day Care: Provide 3,000 sq. ft. for a fun, safe atmosphere for pets to spend the day exercising and enjoying the company of other pets.
- In-home Animal Care: Staff will go to homes to feed, walk, play, and check on pets as often as requested. Mail will be picked up and plants watered if requested.
- Wash Your Own Pet: Provide four tubs, brushes, environmentally safe shampoo, dryers and aprons for clients who bring their pets in to wash.
- Pet Grooming: Provide on-site professional pet grooming services.
- Animal Behavior Courses: Provide certified animal training courses for the beginner, intermediate, and advanced.
- Pet Portraits: On-site portrait opportunities.
- Gift Shop: Provide specialty pet-related gifts and products.
- Special Events: Coordinate pet birthday parties or any other special occasions on-site or at a location of choice.
- Special Requests: Provide service for pets with special needs including administering medication, assisting with recovery from surgery, handicaps, etc.
- Pet taxi.
3.2 Competitive Comparison
The competition comes in several forms. There are several organizations that offer one or two services at their location.
Day care is a new business, offered currently only to dogs. There are eight dog day care facilities in the Portland area:
- Urban Fauna in Northwest.
- Lucky Dog Day Care in Tigard.
- Happy Go Lucky Dog Training and Playcare in N. E. Portland.
- Day Care for Doggy in N. E. Portland.
- Doggone Fun! in Tualatin/Sherwood.
- Kountry Kanine in Gresham.
- No Bonz About It N. E. in Portland.
- See Spot Play in S. E. Portland.
None of these facilities offer 24 hour care making it inconvenient for clients to pick up their pet by a specified time.

Noah’s Arf will service all domestic animals within reason. We will not be limited to dogs only.
There are seven wash your own dog facilities in the Portland area:
- Beauty For the Beast in N. E. Portland.
- Rub-A-Dub Dog Wash in S. E. Portland.
- The Dog Wash in Beaverton.
- Bowsers Bath in Tigard.
- Connie’s U Wash Dog Wash.
- Aqua Dog in Beaverton.
- Pups & Cups in N. E. Portland.
There are 73 grooming and boarding combined facilities and 18 dog training and obedience combined facilities in the Portland area. Noah’s Arf offers complete and total services at one location. One-stop high-quality pet care for customer convenience.
3.3 Sales Literature
This business will begin with a general corporate brochure establishing offered services. This brochure will be developed as part of the start-up expenses and distributed to large businesses, restaurants, local veterinarians, pet stores, real estate agencies, fire departments, The Humane Society, and the Washington Park Zoo. There will be a direct mailing to registered pet owners and a website created.
Literature and mailing for the initial market forums will be very important, with the need to establish a high-quality look and feel in order to create a trusting sense of professionalism.
3.4 Technology
Noah’s Arf will maintain the latest Windows and Internet capabilities including complete email capabilities on the Internet to work directly with clients for reservations, purchasing products online, asking questions, providing information, etc., as well as a Web page will provide information and maximum exposure of available services.
3.5 Future Products and Services
ONE YEAR GROWTH PLAN
- Veterinarian technician on staff to administer vaccinations on specified days and tend to any unforeseen emergencies.
- Internet access to watch your pet online.
- Monthly newsletter.
- Weekly play hour.
- Espresso and juice bar.
THREE YEAR
- Expand the number of overnight kennels by 10.
- Mobil pet wash–will go to pet owners home to wash their pets.
- Sell and distribute gifts and products online.
- Add an exercise pool.
- Combine facility with a local veterinarian.
FIVE YEAR
- Expand the number of overnight kennels by 10.
- Franchise.
Market Analysis Summary
Noah’s Arf will focus on dual-income, traveling professional families with hectic schedules. Those trying to strike a balance between the demands of their careers, personal lives and their pets. Our most important group of customers are those who do not have as much time as they desire to invest in their pets and are willing to seek additional help regardless of costs.
Two years ago, doggie day care did not exist in Portland. Today, there are eight such centers complete with entrance requirements and waiting lists.
4.1 Target Market Segment Strategy
We will not be successful waiting for the customer to come to us. Instead, we must focus on the specific market segments whose needs match our offerings. Focusing on targeted segments is the key to our future.
Therefore, our focus and marketing message will be the services offered. We will develop our message, communicate it, and fulfill our commitment to excellence.
4.2 Market Needs
Our target customers are pet owners, not restricted to only one pet per household. They are working professionals that need reliable, trusting and convenient pet care available to them to keep up with the demands of their hectic schedules. There is a need for one-stop convenience.
4.2.1 Market Trends
Today’s trend consists of professionals having their families later in life or deciding not to have children at all. Pet owners are increasingly treating their pets as they would their children. Pets aren’t just part of the family anymore. In some cases they are the family. They are willing to invest dollars to have them cared for in an environment that would mirror their home surroundings.
Another important workplace trend is working longer hours and more days. There is also the traveling professional. Professionals are looking for help to care for their pets in a loving playful daycare. There is a need to have pets cared for over long periods of time while their owners are away on business trips. Downtown and condominium living has also become very popular for professionals. This creates the need to provide a daily exercise and a playful environment for their pets.
In 1998, the amount of money Americans spend on dog food totaled $5.9 billion. America’s hottest new publication is The Bark, a monthly publication for dog owners. Portland has their own publication, Dog Nose News. Hotel chains are encouraging pet owners to bring their pets to stay in their hotels.
4.2.2 Market Growth
The benefits of sharing our lives with our pets offers owners affection, companionship and security. For busy families, professionals and single pet owners, Noah’s Arf offers a peace of mind alternative to leaving their pets home alone. Over 350,000 Portland Metro households have dogs, according to the Dog Nose News. The nation’s 58 million pet owners spent an estimated 22.7 billion on their pets in 1999 according to the Pet Industry Joint Advisory Council.
A 1998 American Animal Hospital Association survey of pet owners who took their animals to a vet, found that nearly one-third said they spend more time with their pets than with their friends. Animals are playing a larger role in our lives and working people are choosing to provide them with a good life, according to the director of community programs at the San Francisco Society for the Prevention of Cruelty to Animals.
Pet owners can be confident that their pets are in the best of hands at Noah’s Arf. Pets can socialize with buddies, revel in attention from expert care givers, and enjoy play activities.
4.3 Service Business Analysis
The animal care service industry consists of many small individual facilities. Noah’s Arf direction is to establish itself as a full-service, 24-hour facility, creating customer convenience.
4.3.1 Business Participants
The animal care industry is made up of many small participants that are function-specific. These businesses offer one or two services. There are no businesses that offer full care, including day care, overnight care and in-home care for 24 hours a day. Current facilities have limited hours, causing a great inconvenience for the customer. Noah’s Arf will change these trends and offer “one stop convenience” for all their pet needs.
Strategy and Implementation Summary
Emphasize Customer Service
Noah’s Arf will differentiate themselves from other animal care facilities. We will establish our business offering as a clear and viable alternative for our target market.
Build a Relationship-Oriented Business
Build long-term relationships with clients, not just an occasional visit. Let them become dependent on Noah’s Arf to help out in many situations. Make them understand the value of the relationship.
Focus on Target Markets
We need to focus our offerings on the busy professionals, who want to save time to enjoy convenience, multiple services, and total satisfaction of services.
Differentiate and Fulfill the Promise
We can’t just market and sell service and products, we must actually deliver as well. We need to make sure we have the knowledge-intensive business and service-intensive business we claim to have.
5.1 Competitive Edge
Noah’s Arf starts with a critical competitive edge: There is no competitor that can claim several multiple services, 24 hour care, and customer convenience at one location.
5.1.1 Pricing Strategy
Noah’s Arf will be priced at the upper edge of what the market will bear, competing with similar types of services in the area.
5.1.2 Promotion Strategy
We will host an open house with a business card drawing for one free service. We will offer discounts after a specified number of visits for the first six months to establish a client base.
Example:
- 10 wash your own = one free day visit gift certificate.
- 10 day care visits = one free overnight visit gift certificate.
- 10 overnight visits = one free wash your own gift certificate.
- 20 visits = $10.00 discount.
- Three referrals = one free day care visit gift certificate.
- Monthly business card drawing = one free visit.
- Create specified packages = one day, one night, one wash for a special discount price.
- Multiple pets from the same family = family discount rate.
- Use promotional items such as frisbees, collars, coffee mugs, etc. with Noah’s Arf logo imprinted.
5.1.3 Marketing Strategy
Our marketing strategy is a simple one: satisfied customers are our best marketing tool. When a customer leaves our business with a happy pet knowing that it has had a fulfilled day, our name and service will stand on its own. We have talked with many friends, and associates who are excited about our plans and are anxious to use our services.
In addition, we will distribute advertising brochures to large businesses for bulletin boards, (Nike, Adidas, Columbia Sportswear, Fred Meyer, Epson, Intel, Planar, etc.) offering a 10% discount for a limited time to build a client base.
Local TV news shows (AM Northwest, Good Day Oregon) will be contacted to feature our business as a new service to the community. Direct mail will be sent to registered pet owners in the Portland Metro area. Brochures will be distributed to hotels, restaurants, condominiums, pet stores, coffee shops, Washington Park Zoo, local veterinarians, etc. Create a Noah’s Arf Web Page. Advertise in the Oregonian, Willamette Weekly, Portland Tribune, and Dog Nose News newspapers.
5.2 Sales Forecast
The following table and charts present the sales forecast for Noah’s Arf.


Management Summary
Noah’s Arf will be organized and managed in a creative, innovative fashion to generate very high levels of customer satisfaction. We will create a working climate conducive to a high degree of personal development and satisfaction for employees.
A policy manual will be developed and implemented. Job descriptions will be developed to identify necessary competencies and skill sets. Team oriented professionals with common goals will be hired.
We will conduct weekly staff meetings to discuss ideas, suggestions, and operations. An annual motivational seminar will be held and we will develop an employee recognition program. As the business grows, the company will offer an employee benefit package to include health and vacation benefits for everyone.
6.1 Personnel Plan
The personnel plan will be as follows:
- One manager to oversee and fill-in for all areas.
- Two front desk reception to greet customers, receive payments for services/products, set appointments, answer phones, check-in pets, distribute wash your own supplies and maintain files of clients with data entry.
- Four playground supervisors will feed and water pets, keep area clean, walk and exercise, collect pets at check-out time. Two will be on staff full time and two will work part time.
Contract Employees:
- One pet groomer.
- One behavioral trainer.
In the first year, assumptions are that there will be only one receptionist, four playground supervisors, and the manager will serve as part time receptionist and night personal until the business can build. The groomer and trainer will work on contract. In the second year, a second receptionist, two playground supervisors and a groomer will be added to the payroll.
| Personnel Plan | |||
| Year 1 | Year 2 | Year 3 | |
| Production Personnel | |||
| Playground supervisor | $14,720 | $15,840 | $16,320 |
| Playground supervisor | $11,200 | $11,880 | $12,240 |
| Playground supervisor part time | $5,520 | $5,952 | $6,144 |
| Playground supervisor part time | $2,760 | $2,976 | $3,072 |
| Playground supervisor | $0 | $15,840 | $16,320 |
| Playground Supervisor | $0 | $11,880 | $12,240 |
| Groomer | $0 | $23,040 | $24,000 |
| Pet taxi/in-home care/dog walker | $0 | $15,360 | $15,840 |
| Subtotal | $34,200 | $102,768 | $106,176 |
| Sales and Marketing Personnel | |||
| Other | $0 | $0 | $0 |
| Other | $0 | $0 | $0 |
| Subtotal | $0 | $0 | $0 |
| General and Administrative Personnel | |||
| Manager | $36,000 | $36,000 | $36,000 |
| Reception 1 | $16,560 | $17,760 | $18,240 |
| Reception 2 | $0 | $6,912 | $7,104 |
| Subtotal | $52,560 | $60,672 | $61,344 |
| Other Personnel | |||
| Other | $0 | $0 | $0 |
| Other | $0 | $0 | $0 |
| Subtotal | $0 | $0 | $0 |
| Total People | 6 | 11 | 11 |
| Total Payroll | $86,760 | $163,440 | $167,520 |
6.2 Management Team
Kris Price: Owner and Operations Manager
Nike, Inc. – 1979 to present:
***Owner resume has been omitted for confidentiality.***
Classes and Seminars:
***Owner resume has been omitted for confidentiality.***
Financial Plan
The following is Noah’s Arf’s financial plan.
7.1 Important Assumptions
The following table summarizes key financial assumptions, including payment for services in cash or credit card. We assume fast-growth and large demands in this new specialized service.
| General Assumptions | |||
| Year 1 | Year 2 | Year 3 | |
| Plan Month | 1 | 2 | 3 |
| Current Interest Rate | 0.00% | 0.00% | 0.00% |
| Long-term Interest Rate | 9.00% | 9.00% | 9.00% |
| Tax Rate | 25.42% | 25.00% | 25.42% |
| Other | 0 | 0 | 0 |
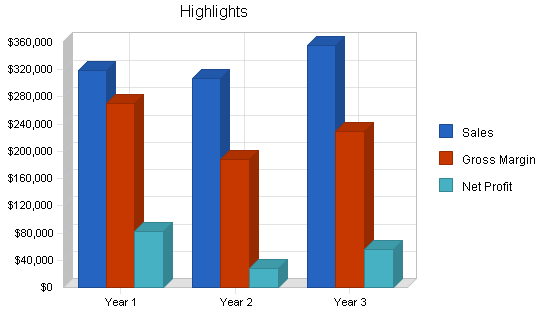
7.2 Key Financial Indicators
The benchmark comparison chart highlights our ambitious plan. We feel this is a new fast growing service offered to the community. The opportunity to expand services is endless.

7.3 Break-even Analysis
For our break-even analysis, we assume monthly costs which include our full payroll, rent, and utilities, and an estimation of other running expenses.

| Break-even Analysis | |
| Monthly Revenue Break-even | $13,340 |
| Assumptions: | |
| Average Percent Variable Cost | 4% |
| Estimated Monthly Fixed Cost | $12,781 |
7.4 Projected Profit and Loss
Month-by-month forecasts for profit and loss are included in the appendix.


| Pro Forma Profit and Loss | |||
| Year 1 | Year 2 | Year 3 | |
| Sales | $318,410 | $307,376 | $355,338 |
| Direct Cost of Sales | $13,335 | $17,005 | $19,670 |
| Production Payroll | $34,200 | $102,768 | $106,176 |
| Other | $0 | $0 | $0 |
| Total Cost of Sales | $47,535 | $119,773 | $125,846 |
| Gross Margin | $270,875 | $187,603 | $229,492 |
| Gross Margin % | 85.07% | 61.03% | 64.58% |
| Operating Expenses | |||
| Sales and Marketing Expenses | |||
| Sales and Marketing Payroll | $0 | $0 | $0 |
| Advertising/Promotion | $2,700 | $5,500 | $7,000 |
| Travel | $0 | $0 | $0 |
| Miscellaneous | $600 | $1,000 | $1,000 |
| Total Sales and Marketing Expenses | $3,300 | $6,500 | $8,000 |
| Sales and Marketing % | 1.04% | 2.11% | 2.25% |
| General and Administrative Expenses | |||
| General and Administrative Payroll | $52,560 | $60,672 | $61,344 |
| Sales and Marketing and Other Expenses | $0 | $0 | $0 |
| Depreciation | $12,000 | $12,000 | $12,000 |
| vehicle maintence | $1,200 | $1,500 | $1,700 |
| Utilities | $14,400 | $15,000 | $15,500 |
| Insurance | $12,000 | $13,000 | $14,000 |
| Taxes | $6,000 | $7,000 | $8,000 |
| Rent | $38,500 | $3,600 | $3,800 |
| Payroll Taxes | $10,411 | $19,613 | $20,102 |
| Other General and Administrative Expenses | $0 | $0 | $0 |
| Total General and Administrative Expenses | $147,071 | $132,385 | $136,446 |
| General and Administrative % | 46.19% | 43.07% | 38.40% |
| Other Expenses: | |||
| Other Payroll | $0 | $0 | $0 |
| Consultants | $0 | $0 | $0 |
| Contract/Consultants | $3,000 | $4,000 | $5,000 |
| Total Other Expenses | $3,000 | $4,000 | $5,000 |
| Other % | 0.94% | 1.30% | 1.41% |
| Total Operating Expenses | $153,371 | $142,885 | $149,446 |
| Profit Before Interest and Taxes | $117,504 | $44,718 | $80,046 |
| EBITDA | $129,504 | $56,718 | $92,046 |
| Interest Expense | $8,210 | $6,630 | $5,050 |
| Taxes Incurred | $26,884 | $9,522 | $19,061 |
| Net Profit | $82,410 | $28,566 | $55,934 |
| Net Profit/Sales | 25.88% | 9.29% | 15.74% |
7.5 Projected Cash Flow
The following chart and table show the project cash flow for Noah’s Arf.

| Pro Forma Cash Flow | |||
| Year 1 | Year 2 | Year 3 | |
| Cash Received | |||
| Cash from Operations | |||
| Cash Sales | $318,410 | $307,376 | $355,338 |
| Subtotal Cash from Operations | $318,410 | $307,376 | $355,338 |
| Additional Cash Received | |||
| Sales Tax, VAT, HST/GST Received | $0 | $0 | $0 |
| New Current Borrowing | $0 | $0 | $0 |
| New Other Liabilities (interest-free) | $0 | $0 | $0 |
| New Long-term Liabilities | $0 | $0 | $0 |
| Sales of Other Current Assets | $0 | $0 | $0 |
| Sales of Long-term Assets | $0 | $0 | $0 |
| New Investment Received | $0 | $0 | $0 |
| Subtotal Cash Received | $318,410 | $307,376 | $355,338 |
| Expenditures | Year 1 | Year 2 | Year 3 |
| Expenditures from Operations | |||
| Cash Spending | $86,760 | $163,440 | $167,520 |
| Bill Payments | $121,390 | $109,197 | $118,933 |
| Subtotal Spent on Operations | $208,150 | $272,637 | $286,453 |
| Additional Cash Spent | |||
| Sales Tax, VAT, HST/GST Paid Out | $0 | $0 | $0 |
| Principal Repayment of Current Borrowing | $0 | $0 | $0 |
| Other Liabilities Principal Repayment | $0 | $0 | $0 |
| Long-term Liabilities Principal Repayment | $17,556 | $17,556 | $17,556 |
| Purchase Other Current Assets | $0 | $0 | $0 |
| Purchase Long-term Assets | $0 | $0 | $0 |
| Dividends | $0 | $0 | $0 |
| Subtotal Cash Spent | $225,706 | $290,193 | $304,009 |
| Net Cash Flow | $92,704 | $17,183 | $51,329 |
| Cash Balance | $131,704 | $148,887 | $200,216 |
7.6 Projected Balance Sheet
The Projected Balance Sheet is quite solid. We do not project any real trouble meeting our debt obligations–as long as we can achieve our specific objectives.
| Pro Forma Balance Sheet | |||
| Year 1 | Year 2 | Year 3 | |
| Assets | |||
| Current Assets | |||
| Cash | $131,704 | $148,887 | $200,216 |
| Inventory | $1,974 | $2,517 | $2,912 |
| Other Current Assets | $0 | $0 | $0 |
| Total Current Assets | $133,678 | $151,405 | $203,128 |
| Long-term Assets | |||
| Long-term Assets | $100,000 | $100,000 | $100,000 |
| Accumulated Depreciation | $12,000 | $24,000 | $36,000 |
| Total Long-term Assets | $88,000 | $76,000 | $64,000 |
| Total Assets | $221,678 | $227,405 | $267,128 |
| Liabilities and Capital | Year 1 | Year 2 | Year 3 |
| Current Liabilities | |||
| Accounts Payable | $13,824 | $8,541 | $9,886 |
| Current Borrowing | $0 | $0 | $0 |
| Other Current Liabilities | $0 | $0 | $0 |
| Subtotal Current Liabilities | $13,824 | $8,541 | $9,886 |
| Long-term Liabilities | $82,444 | $64,888 | $47,332 |
| Total Liabilities | $96,268 | $73,429 | $57,218 |
| Paid-in Capital | $70,000 | $70,000 | $70,000 |
| Retained Earnings | ($27,000) | $55,410 | $83,976 |
| Earnings | $82,410 | $28,566 | $55,934 |
| Total Capital | $125,410 | $153,976 | $209,910 |
| Total Liabilities and Capital | $221,678 | $227,405 | $267,128 |
| Net Worth | $125,410 | $153,976 | $209,910 |
7.7 Business Ratios
The table follows with our main business ratios. We intend to improve gross margins and inventory turnover. Industry profile ratios based on the Standard Industrial Classification (SIC) code 0752, Animal Specialty Services, nec., are shown for comparison.
| Ratio Analysis | ||||
| Year 1 | Year 2 | Year 3 | Industry Profile | |
| Sales Growth | 0.00% | -3.47% | 15.60% | -2.90% |
| Percent of Total Assets | ||||
| Inventory | 0.89% | 1.11% | 1.09% | 8.20% |
| Other Current Assets | 0.00% | 0.00% | 0.00% | 31.90% |
| Total Current Assets | 60.30% | 66.58% | 76.04% | 55.90% |
| Long-term Assets | 39.70% | 33.42% | 23.96% | 44.10% |
| Total Assets | 100.00% | 100.00% | 100.00% | 100.00% |
| Current Liabilities | 6.24% | 3.76% | 3.70% | 32.70% |
| Long-term Liabilities | 37.19% | 28.53% | 17.72% | 19.90% |
| Total Liabilities | 43.43% | 32.29% | 21.42% | 52.60% |
| Net Worth | 56.57% | 67.71% | 78.58% | 47.40% |
| Percent of Sales | ||||
| Sales | 100.00% | 100.00% | 100.00% | 100.00% |
| Gross Margin | 85.07% | 61.03% | 64.58% | 42.50% |
| Selling, General & Administrative Expenses | 59.33% | 51.74% | 48.76% | 26.40% |
| Advertising Expenses | 0.85% | 1.79% | 1.97% | 0.50% |
| Profit Before Interest and Taxes | 36.90% | 14.55% | 22.53% | 2.40% |
| Main Ratios | ||||
| Current | 9.67 | 17.73 | 20.55 | 2.19 |
| Quick | 9.53 | 17.43 | 20.25 | 1.48 |
| Total Debt to Total Assets | 43.43% | 32.29% | 21.42% | 52.60% |
| Pre-tax Return on Net Worth | 87.15% | 24.74% | 35.73% | 4.50% |
| Pre-tax Return on Assets | 49.30% | 16.75% | 28.07% | 9.40% |
| Additional Ratios | Year 1 | Year 2 | Year 3 | |
| Net Profit Margin | 25.88% | 9.29% | 15.74% | n.a |
| Return on Equity | 65.71% | 18.55% | 26.65% | n.a |
| Activity Ratios | ||||
| Inventory Turnover | 6.20 | 7.57 | 7.25 | n.a |
| Accounts Payable Turnover | 9.78 | 12.17 | 12.17 | n.a |
| Payment Days | 27 | 39 | 28 | n.a |
| Total Asset Turnover | 1.44 | 1.35 | 1.33 | n.a |
| Debt Ratios | ||||
| Debt to Net Worth | 0.77 | 0.48 | 0.27 | n.a |
| Current Liab. to Liab. | 0.14 | 0.12 | 0.17 | n.a |
| Liquidity Ratios | ||||
| Net Working Capital | $119,854 | $142,864 | $193,242 | n.a |
| Interest Coverage | 14.31 | 6.74 | 15.85 | n.a |
| Additional Ratios | ||||
| Assets to Sales | 0.70 | 0.74 | 0.75 | n.a |
| Current Debt/Total Assets | 6% | 4% | 4% | n.a |
| Acid Test | 9.53 | 17.43 | 20.25 | n.a |
| Sales/Net Worth | 2.54 | 2.00 | 1.69 | n.a |
| Dividend Payout | 0.00 | 0.00 | 0.00 | n.a |
Appendix
| Personnel Plan | |||||||||||||
| Month 1 | Month 2 | Month 3 | Month 4 | Month 5 | Month 6 | Month 7 | Month 8 | Month 9 | Month 10 | Month 11 | Month 12 | ||
| Production Personnel | |||||||||||||
| Playground supervisor | $640 | $1,280 | $1,280 | $1,280 | $1,280 | $1,280 | $1,280 | $1,280 | $1,280 | $1,280 | $1,280 | $1,280 | |
| Playground supervisor | $640 | $960 | $960 | $960 | $960 | $960 | $960 | $960 | $960 | $960 | $960 | $960 | |
| Playground supervisor part time | $240 | $480 | $480 | $480 | $480 | $480 | $480 | $480 | $480 | $480 | $480 | $480 | |
| Playground supervisor part time | $120 | $240 | $240 | $240 | $240 | $240 | $240 | $240 | $240 | $240 | $240 | $240 | |
| Playground supervisor | $0 | $0 | $0 | $0 | $0 | $0 | $0 | $0 | $0 | $0 | $0 | $0 | |
| Playground Supervisor | $0 | $0 | $0 | $0 | $0 | $0 | $0 | $0 | $0 | $0 | $0 | $0 | |
| Groomer | $0 | $0 | $0 | $0 | $0 | $0 | $0 | $0 | $0 | $0 | $0 | $0 | |
| Pet taxi/in-home care/dog walker | $0 | $0 | $0 | $0 | $0 | $0 | $0 | $0 | $0 | $0 | $0 | $0 | |
| Subtotal | $1,640 | $2,960 | $2,960 | $2,960 | $2,960 | $2,960 | $2,960 | $2,960 | $2,960 | $2,960 | $2,960 | $2,960 | |
| Sales and Marketing Personnel | |||||||||||||
| Other | $0 | $0 | $0 | $0 | $0 | $0 | $0 | $0 | $0 | $0 | $0 | $0 | |
| Other | $0 | $0 | $0 | $0 | $0 | $0 | $0 | $0 | $0 | $0 | $0 | $0 | |
| Subtotal | $0 | $0 | $0 | $0 | $0 | $0 | $0 | $0 | $0 | $0 | $0 | $0 | |
| General and Administrative Personnel | |||||||||||||
| Manager | $3,000 | $3,000 | $3,000 | $3,000 | $3,000 | $3,000 | $3,000 | $3,000 | $3,000 | $3,000 | $3,000 | $3,000 | |
| Reception 1 | $720 | $1,440 | $1,440 | $1,440 | $1,440 | $1,440 | $1,440 | $1,440 | $1,440 | $1,440 | $1,440 | $1,440 | |
| Reception 2 | $0 | $0 | $0 | $0 | $0 | $0 | $0 | $0 | $0 | $0 | $0 | $0 | |
| Subtotal | $3,720 | $4,440 | $4,440 | $4,440 | $4,440 | $4,440 | $4,440 | $4,440 | $4,440 | $4,440 | $4,440 | $4,440 | |
| Other Personnel | |||||||||||||
| Other | $0 | $0 | $0 | $0 | $0 | $0 | $0 | $0 | $0 | $0 | $0 | $0 | |
| Other | $0 | $0 | $0 | $0 | $0 | $0 | $0 | $0 | $0 | $0 | $0 | $0 | |
| Subtotal | $0 | $0 | $0 | $0 | $0 | $0 | $0 | $0 | $0 | $0 | $0 | $0 | |
| Total People | 6 | 6 | 6 | 6 | 6 | 6 | 6 | 6 | 6 | 6 | 6 | 6 | |
| Total Payroll | $5,360 | $7,400 | $7,400 | $7,400 | $7,400 | $7,400 | $7,400 | $7,400 | $7,400 | $7,400 | $7,400 | $7,400 | |
| General Assumptions | |||||||||||||
| Month 1 | Month 2 | Month 3 | Month 4 | Month 5 | Month 6 | Month 7 | Month 8 | Month 9 | Month 10 | Month 11 | Month 12 | ||
| Plan Month | 1 | 2 | 3 | 4 | 5 | 6 | 7 | 8 | 9 | 10 | 11 | 12 | |
| Current Interest Rate | 0.00% | 0.00% | 0.00% | 0.00% | 0.00% | 0.00% | 0.00% | 0.00% | 0.00% | 0.00% | 0.00% | 0.00% | |
| Long-term Interest Rate | 9.00% | 9.00% | 9.00% | 9.00% | 9.00% | 9.00% | 9.00% | 9.00% | 9.00% | 9.00% | 9.00% | 9.00% | |
| Tax Rate | 30.00% | 25.00% | 25.00% | 25.00% | 25.00% | 25.00% | 25.00% | 25.00% | 25.00% | 25.00% | 25.00% | 25.00% | |
| Other | 0 | 0 | 0 | 0 | 0 | 0 | 0 | 0 | 0 | 0 | 0 | 0 | |
| Pro Forma Profit and Loss | |||||||||||||
| Month 1 | Month 2 | Month 3 | Month 4 | Month 5 | Month 6 | Month 7 | Month 8 | Month 9 | Month 10 | Month 11 | Month 12 | ||
| Sales | $2,800 | $13,420 | $15,760 | $18,750 | $21,845 | $24,495 | $32,415 | $35,415 | $37,115 | $38,165 | $40,165 | $38,065 | |
| Direct Cost of Sales | $235 | $510 | $640 | $855 | $910 | $1,015 | $1,265 | $1,375 | $1,375 | $1,635 | $2,140 | $1,380 | |
| Production Payroll | $1,640 | $2,960 | $2,960 | $2,960 | $2,960 | $2,960 | $2,960 | $2,960 | $2,960 | $2,960 | $2,960 | $2,960 | |
| Other | $0 | $0 | $0 | $0 | $0 | $0 | $0 | $0 | $0 | $0 | $0 | $0 | |
| Total Cost of Sales | $1,875 | $3,470 | $3,600 | $3,815 | $3,870 | $3,975 | $4,225 | $4,335 | $4,335 | $4,595 | $5,100 | $4,340 | |
| Gross Margin | $925 | $9,950 | $12,160 | $14,935 | $17,975 | $20,520 | $28,190 | $31,080 | $32,780 | $33,570 | $35,065 | $33,725 | |
| Gross Margin % | 33.04% | 74.14% | 77.16% | 79.65% | 82.28% | 83.77% | 86.97% | 87.76% | 88.32% | 87.96% | 87.30% | 88.60% | |
| Operating Expenses | |||||||||||||
| Sales and Marketing Expenses | |||||||||||||
| Sales and Marketing Payroll | $0 | $0 | $0 | $0 | $0 | $0 | $0 | $0 | $0 | $0 | $0 | $0 | |
| Advertising/Promotion | $500 | $200 | $200 | $200 | $200 | $200 | $200 | $200 | $200 | $200 | $200 | $200 | |
| Travel | $0 | $0 | $0 | $0 | $0 | $0 | $0 | $0 | $0 | $0 | $0 | $0 | |
| Miscellaneous | $50 | $50 | $50 | $50 | $50 | $50 | $50 | $50 | $50 | $50 | $50 | $50 | |
| Total Sales and Marketing Expenses | $550 | $250 | $250 | $250 | $250 | $250 | $250 | $250 | $250 | $250 | $250 | $250 | |
| Sales and Marketing % | 19.64% | 1.86% | 1.59% | 1.33% | 1.14% | 1.02% | 0.77% | 0.71% | 0.67% | 0.66% | 0.62% | 0.66% | |
| General and Administrative Expenses | |||||||||||||
| General and Administrative Payroll | $3,720 | $4,440 | $4,440 | $4,440 | $4,440 | $4,440 | $4,440 | $4,440 | $4,440 | $4,440 | $4,440 | $4,440 | |
| Sales and Marketing and Other Expenses | $0 | $0 | $0 | $0 | $0 | $0 | $0 | $0 | $0 | $0 | $0 | $0 | |
| Depreciation | $1,000 | $1,000 | $1,000 | $1,000 | $1,000 | $1,000 | $1,000 | $1,000 | $1,000 | $1,000 | $1,000 | $1,000 | |
| vehicle maintence | $100 | $100 | $100 | $100 | $100 | $100 | $100 | $100 | $100 | $100 | $100 | $100 | |
| Utilities | $1,200 | $1,200 | $1,200 | $1,200 | $1,200 | $1,200 | $1,200 | $1,200 | $1,200 | $1,200 | $1,200 | $1,200 | |
| Insurance | $1,000 | $1,000 | $1,000 | $1,000 | $1,000 | $1,000 | $1,000 | $1,000 | $1,000 | $1,000 | $1,000 | $1,000 | |
| Taxes | $500 | $500 | $500 | $500 | $500 | $500 | $500 | $500 | $500 | $500 | $500 | $500 | |
| Rent | $0 | $3,500 | $3,500 | $3,500 | $3,500 | $3,500 | $3,500 | $3,500 | $3,500 | $3,500 | $3,500 | $3,500 | |
| Payroll Taxes | 12% | $643 | $888 | $888 | $888 | $888 | $888 | $888 | $888 | $888 | $888 | $888 | $888 |
| Other General and Administrative Expenses | $0 | $0 | $0 | $0 | $0 | $0 | $0 | $0 | $0 | $0 | $0 | $0 | |
| Total General and Administrative Expenses | $8,163 | $12,628 | $12,628 | $12,628 | $12,628 | $12,628 | $12,628 | $12,628 | $12,628 | $12,628 | $12,628 | $12,628 | |
| General and Administrative % | 291.54% | 94.10% | 80.13% | 67.35% | 57.81% | 51.55% | 38.96% | 35.66% | 34.02% | 33.09% | 31.44% | 33.17% | |
| Other Expenses: | |||||||||||||
| Other Payroll | $0 | $0 | $0 | $0 | $0 | $0 | $0 | $0 | $0 | $0 | $0 | $0 | |
| Consultants | $0 | $0 | $0 | $0 | $0 | $0 | $0 | $0 | $0 | $0 | $0 | $0 | |
| Contract/Consultants | $250 | $250 | $250 | $250 | $250 | $250 | $250 | $250 | $250 | $250 | $250 | $250 | |
| Total Other Expenses | $250 | $250 | $250 | $250 | $250 | $250 | $250 | $250 | $250 | $250 | $250 | $250 | |
| Other % | 8.93% | 1.86% | 1.59% | 1.33% | 1.14% | 1.02% | 0.77% | 0.71% | 0.67% | 0.66% | 0.62% | 0.66% | |
| Total Operating Expenses | $8,963 | $13,128 | $13,128 | $13,128 | $13,128 | $13,128 | $13,128 | $13,128 | $13,128 | $13,128 | $13,128 | $13,128 | |
| Profit Before Interest and Taxes | ($8,038) | ($3,178) | ($968) | $1,807 | $4,847 | $7,392 | $15,062 | $17,952 | $19,652 | $20,442 | $21,937 | $20,597 | |
| EBITDA | ($7,038) | ($2,178) | $32 | $2,807 | $5,847 | $8,392 | $16,062 | $18,952 | $20,652 | $21,442 | $22,937 | $21,597 | |
| Interest Expense | $750 | $738 | $726 | $714 | $702 | $690 | $678 | $666 | $654 | $642 | $630 | $618 | |
| Taxes Incurred | ($2,636) | ($979) | ($424) | $273 | $1,036 | $1,675 | $3,596 | $4,321 | $4,749 | $4,950 | $5,327 | $4,995 | |
| Net Profit | ($6,152) | ($2,937) | ($1,271) | $820 | $3,109 | $5,026 | $10,788 | $12,964 | $14,248 | $14,850 | $15,980 | $14,984 | |
| Net Profit/Sales | -219.71% | -21.89% | -8.06% | 4.37% | 14.23% | 20.52% | 33.28% | 36.61% | 38.39% | 38.91% | 39.79% | 39.36% | |
| Pro Forma Cash Flow | |||||||||||||
| Month 1 | Month 2 | Month 3 | Month 4 | Month 5 | Month 6 | Month 7 | Month 8 | Month 9 | Month 10 | Month 11 | Month 12 | ||
| Cash Received | |||||||||||||
| Cash from Operations | |||||||||||||
| Cash Sales | $2,800 | $13,420 | $15,760 | $18,750 | $21,845 | $24,495 | $32,415 | $35,415 | $37,115 | $38,165 | $40,165 | $38,065 | |
| Subtotal Cash from Operations | $2,800 | $13,420 | $15,760 | $18,750 | $21,845 | $24,495 | $32,415 | $35,415 | $37,115 | $38,165 | $40,165 | $38,065 | |
| Additional Cash Received | |||||||||||||
| Sales Tax, VAT, HST/GST Received | 0.00% | $0 | $0 | $0 | $0 | $0 | $0 | $0 | $0 | $0 | $0 | $0 | $0 |
| New Current Borrowing | $0 | $0 | $0 | $0 | $0 | $0 | $0 | $0 | $0 | $0 | $0 | $0 | |
| New Other Liabilities (interest-free) | $0 | $0 | $0 | $0 | $0 | $0 | $0 | $0 | $0 | $0 | $0 | $0 | |
| New Long-term Liabilities | $0 | $0 | $0 | $0 | $0 | $0 | $0 | $0 | $0 | $0 | $0 | $0 | |
| Sales of Other Current Assets | $0 | $0 | $0 | $0 | $0 | $0 | $0 | $0 | $0 | $0 | $0 | $0 | |
| Sales of Long-term Assets | $0 | $0 | $0 | $0 | $0 | $0 | $0 | $0 | $0 | $0 | $0 | $0 | |
| New Investment Received | $0 | $0 | $0 | $0 | $0 | $0 | $0 | $0 | $0 | $0 | $0 | $0 | |
| Subtotal Cash Received | $2,800 | $13,420 | $15,760 | $18,750 | $21,845 | $24,495 | $32,415 | $35,415 | $37,115 | $38,165 | $40,165 | $38,065 | |
| Expenditures | Month 1 | Month 2 | Month 3 | Month 4 | Month 5 | Month 6 | Month 7 | Month 8 | Month 9 | Month 10 | Month 11 | Month 12 | |
| Expenditures from Operations | |||||||||||||
| Cash Spending | $5,360 | $7,400 | $7,400 | $7,400 | $7,400 | $7,400 | $7,400 | $7,400 | $7,400 | $7,400 | $7,400 | $7,400 | |
| Bill Payments | $79 | $2,526 | $7,465 | $8,013 | $8,734 | $10,447 | $11,117 | $12,997 | $14,009 | $14,491 | $15,239 | $16,272 | |
| Subtotal Spent on Operations | $5,439 | $9,926 | $14,865 | $15,413 | $16,134 | $17,847 | $18,517 | $20,397 | $21,409 | $21,891 | $22,639 | $23,672 | |
| Additional Cash Spent | |||||||||||||
| Sales Tax, VAT, HST/GST Paid Out | $0 | $0 | $0 | $0 | $0 | $0 | $0 | $0 | $0 | $0 | $0 | $0 | |
| Principal Repayment of Current Borrowing | $0 | $0 | $0 | $0 | $0 | $0 | $0 | $0 | $0 | $0 | $0 | $0 | |
| Other Liabilities Principal Repayment | $0 | $0 | $0 | $0 | $0 | $0 | $0 | $0 | $0 | $0 | $0 | $0 | |
| Long-term Liabilities Principal Repayment | $0 | $1,596 | $1,596 | $1,596 | $1,596 | $1,596 | $1,596 | $1,596 | $1,596 | $1,596 | $1,596 | $1,596 | |
| Purchase Other Current Assets | $0 | $0 | $0 | $0 | $0 | $0 | $0 | $0 | $0 | $0 | $0 | $0 | |
| Purchase Long-term Assets | $0 | $0 | $0 | $0 | $0 | $0 | $0 | $0 | $0 | $0 | $0 | $0 | |
| Dividends | $0 | $0 | $0 | $0 | $0 | $0 | $0 | $0 | $0 | $0 | $0 | $0 | |
| Subtotal Cash Spent | $5,439 | $11,522 | $16,461 | $17,009 | $17,730 | $19,443 | $20,113 | $21,993 | $23,005 | $23,487 | $24,235 | $25,268 | |
| Net Cash Flow | ($2,639) | $1,898 | ($701) | $1,741 | $4,115 | $5,052 | $12,302 | $13,422 | $14,110 | $14,678 | $15,930 | $12,797 | |
| Cash Balance | $36,361 | $38,259 | $37,558 | $39,299 | $43,414 | $48,466 | $60,767 | $74,190 | $88,300 | $102,978 | $118,908 | $131,704 | |
| Pro Forma Balance Sheet | |||||||||||||
| Month 1 | Month 2 | Month 3 | Month 4 | Month 5 | Month 6 | Month 7 | Month 8 | Month 9 | Month 10 | Month 11 | Month 12 | ||
| Assets | Starting Balances | ||||||||||||
| Current Assets | |||||||||||||
| Cash | $39,000 | $36,361 | $38,259 | $37,558 | $39,299 | $43,414 | $48,466 | $60,767 | $74,190 | $88,300 | $102,978 | $118,908 | $131,704 |
| Inventory | $4,000 | $3,765 | $3,255 | $2,615 | $1,760 | $1,850 | $1,835 | $1,570 | $1,513 | $1,513 | $1,799 | $2,354 | $1,974 |
| Other Current Assets | $0 | $0 | $0 | $0 | $0 | $0 | $0 | $0 | $0 | $0 | $0 | $0 | $0 |
| Total Current Assets | $43,000 | $40,126 | $41,514 | $40,173 | $41,059 | $45,264 | $50,301 | $62,337 | $75,702 | $89,812 | $104,776 | $121,262 | $133,678 |
| Long-term Assets | |||||||||||||
| Long-term Assets | $100,000 | $100,000 | $100,000 | $100,000 | $100,000 | $100,000 | $100,000 | $100,000 | $100,000 | $100,000 | $100,000 | $100,000 | $100,000 |
| Accumulated Depreciation | $0 | $1,000 | $2,000 | $3,000 | $4,000 | $5,000 | $6,000 | $7,000 | $8,000 | $9,000 | $10,000 | $11,000 | $12,000 |
| Total Long-term Assets | $100,000 | $99,000 | $98,000 | $97,000 | $96,000 | $95,000 | $94,000 | $93,000 | $92,000 | $91,000 | $90,000 | $89,000 | $88,000 |
| Total Assets | $143,000 | $139,126 | $139,514 | $137,173 | $137,059 | $140,264 | $144,301 | $155,337 | $167,702 | $180,812 | $194,776 | $210,262 | $221,678 |
| Liabilities and Capital | Month 1 | Month 2 | Month 3 | Month 4 | Month 5 | Month 6 | Month 7 | Month 8 | Month 9 | Month 10 | Month 11 | Month 12 | |
| Current Liabilities | |||||||||||||
| Accounts Payable | $0 | $2,278 | $7,199 | $7,724 | $8,386 | $10,079 | $10,685 | $12,530 | $13,527 | $13,984 | $14,694 | $15,796 | $13,824 |
| Current Borrowing | $0 | $0 | $0 | $0 | $0 | $0 | $0 | $0 | $0 | $0 | $0 | $0 | $0 |
| Other Current Liabilities | $0 | $0 | $0 | $0 | $0 | $0 | $0 | $0 | $0 | $0 | $0 | $0 | $0 |
| Subtotal Current Liabilities | $0 | $2,278 | $7,199 | $7,724 | $8,386 | $10,079 | $10,685 | $12,530 | $13,527 | $13,984 | $14,694 | $15,796 | $13,824 |
| Long-term Liabilities | $100,000 | $100,000 | $98,404 | $96,808 | $95,212 | $93,616 | $92,020 | $90,424 | $88,828 | $87,232 | $85,636 | $84,040 | $82,444 |
| Total Liabilities | $100,000 | $102,278 | $105,603 | $104,532 | $103,598 | $103,695 | $102,705 | $102,954 | $102,355 | $101,216 | $100,330 | $99,836 | $96,268 |
| Paid-in Capital | $70,000 | $70,000 | $70,000 | $70,000 | $70,000 | $70,000 | $70,000 | $70,000 | $70,000 | $70,000 | $70,000 | $70,000 | $70,000 |
| Retained Earnings | ($27,000) | ($27,000) | ($27,000) | ($27,000) | ($27,000) | ($27,000) | ($27,000) | ($27,000) | ($27,000) | ($27,000) | ($27,000) | ($27,000) | ($27,000) |
| Earnings | $0 | ($6,152) | ($9,089) | ($10,359) | ($9,540) | ($6,431) | ($1,405) | $9,383 | $22,348 | $36,596 | $51,446 | $67,426 | $82,410 |
| Total Capital | $43,000 | $36,848 | $33,911 | $32,641 | $33,460 | $36,569 | $41,595 | $52,383 | $65,348 | $79,596 | $94,446 | $110,426 | $125,410 |
| Total Liabilities and Capital | $143,000 | $139,126 | $139,514 | $137,173 | $137,059 | $140,264 | $144,301 | $155,337 | $167,702 | $180,812 | $194,776 | $210,262 | $221,678 |
| Net Worth | $43,000 | $36,848 | $33,911 | $32,641 | $33,460 | $36,569 | $41,595 | $52,383 | $65,348 | $79,596 | $94,446 | $110,426 | $125,410 |
| Sales Forecast | |||||||||||||
| Month 1 | Month 2 | Month 3 | Month 4 | Month 5 | Month 6 | Month 7 | Month 8 | Month 9 | Month 10 | Month 11 | Month 12 | ||
| Sales | |||||||||||||
| Overnight Care | 0% | $840 | $2,800 | $4,200 | $6,300 | $6,300 | $6,300 | $11,200 | $11,200 | $11,200 | $11,200 | $11,200 | $11,200 |
| Day Care | 0% | $1,150 | $6,900 | $6,900 | $6,900 | $9,200 | $11,500 | $13,800 | $16,100 | $18,400 | $18,400 | $18,400 | $18,400 |
| In Home Care | 0% | $120 | $360 | $360 | $600 | $1,200 | $1,200 | $1,200 | $1,200 | $600 | $600 | $1,200 | $600 |
| Wash Your Own | 0% | $0 | $900 | $900 | $1,200 | $1,200 | $1,200 | $1,200 | $1,500 | $1,500 | $1,800 | $2,100 | $2,400 |
| Grooming | 0% | $0 | $0 | $400 | $500 | $500 | $600 | $600 | $750 | $750 | $1,000 | $1,000 | $900 |
| Retail | 0% | $150 | $250 | $400 | $600 | $600 | $800 | $800 | $1,000 | $1,000 | $1,500 | $2,500 | $1,000 |
| Obedience | 0% | $0 | $0 | $390 | $390 | $585 | $585 | $585 | $585 | $585 | $585 | $585 | $585 |
| Small Animal Care/cats | 0% | $540 | $2,160 | $2,160 | $2,160 | $2,160 | $2,160 | $2,880 | $2,880 | $2,880 | $2,880 | $2,880 | $2,880 |
| Special requests, misc. | 0% | $0 | $50 | $50 | $100 | $100 | $150 | $150 | $200 | $200 | $200 | $300 | $100 |
| Other | 0% | $0 | $0 | $0 | $0 | $0 | $0 | $0 | $0 | $0 | $0 | $0 | $0 |
| Total Sales | $2,800 | $13,420 | $15,760 | $18,750 | $21,845 | $24,495 | $32,415 | $35,415 | $37,115 | $38,165 | $40,165 | $38,065 | |
| Direct Cost of Sales | Month 1 | Month 2 | Month 3 | Month 4 | Month 5 | Month 6 | Month 7 | Month 8 | Month 9 | Month 10 | Month 11 | Month 12 | |
| Overnight Care | $50 | $100 | $150 | $200 | $200 | $200 | $400 | $400 | $400 | $400 | $400 | $400 | |
| Day Care | $75 | $150 | $150 | $150 | $200 | $200 | $250 | $250 | $250 | $250 | $250 | $250 | |
| In Home Care | $10 | $10 | $10 | $15 | $20 | $20 | $20 | $20 | $20 | $20 | $20 | $20 | |
| Wash Your Own | $0 | $25 | $25 | $30 | $30 | $30 | $30 | $35 | $35 | $40 | $40 | $50 | |
| Grooming | $0 | $20 | $25 | $25 | $25 | $25 | $25 | $25 | $25 | $30 | $30 | $25 | |
| Retail | $75 | $125 | $200 | $300 | $300 | $400 | $400 | $500 | $500 | $750 | $1,250 | $500 | |
| Obedience | $0 | $25 | $25 | $25 | $25 | $25 | $25 | $25 | $25 | $25 | $25 | $25 | |
| Small Animal Care/cats | $25 | $50 | $50 | $100 | $100 | $100 | $100 | $100 | $100 | $100 | $100 | $100 | |
| Special requests, misc. | $0 | $5 | $5 | $10 | $10 | $15 | $15 | $20 | $20 | $20 | $25 | $10 | |
| Other | $0 | $0 | $0 | $0 | $0 | $0 | $0 | $0 | $0 | $0 | $0 | $0 | |
| Subtotal Direct Cost of Sales | $235 | $510 | $640 | $855 | $910 | $1,015 | $1,265 | $1,375 | $1,375 | $1,635 | $2,140 | $1,380 | |

