
Shaw's Records Management and Data Storage
Executive Summary
Shaw’s Records Management & Data Storage (Shaw’s) is a full-service, computerized records management company providing secure storage and indexing of paper records, digital media and other business-critical information, including computer disks and tapes, optical disks, microfilm, audio and video tapes, medical records, and blueprints.
Our customer’s records are safe in our 30,000 square foot facility. Our comprehensive security system features exterior and interior cameras for 24-hour monitoring of the premises.
Shaw’s personalized service includes retention schedules, data conversion and ORC, and records relocation. We provide specially designed boxes and other supplies which make handling records easier.
At Shaw’s, we give our customers the competitive edge through state-of-the-art technology, unprecedented security and quick-response service. Our computerized facility is strategically located in the northeast corridor within easy reach of Monroe and Tracy. The northeast corridor is home to over 5,000 companies that are constantly seeking advantage in the marketplace.
In today’s business environment, quick and easy access to critical information gives our customers a competitive advantage. By outsourcing their records management and storage to Shaw’s, they can store their records in an organized environment and improve the speed and ease of access to those records.
Martin Shaw, owner of Shaw’s Record Management and Data Storage, has over twenty years of experience in the field. He has been instrumental in establishing record management systems with Alco Industries, Axiom, and Promerit.
1.1 Mission
The mission of Shaw’s is to assure that our customers can control all of their information, improving their regulatory compliance, and enhancing their cost effectiveness.
1.2 Objectives
Shaw’s objectives are as follows:
- Achieve sales goal during first year of operation.
- Achieve a customer base of 200 companies.
- Increase sales with modest stability during the second year of operation.
Company Summary
Shaw’s Records Management & Data Storage is a full-service, computerized records management company providing secure storage and indexing of paper records, digital media and other business-critical information. The company will be organized as a limited partnership.
Our computerized facility is strategically located in the northeast corridor within easy reach of Monroe and Tracy. Records are safe in our 30,000 square foot facility. Our comprehensive security system features exterior and interior cameras for 24-hour monitoring of the premises. Interior doors accessing the archive are locked, as are all dock doors and gates. Intrusion alarms and motion detectors are connected to the local police department and we have 24-hour off-site alarm monitoring. Surveillance cameras monitor all activity throughout the building and the archives section is surrounded by a 20′ high wired fence with locked gates.
2.1 Company Ownership
Shaw’s is owned by Martin Shaw and an investing partner.
2.2 Start-up Summary
The start-up expense for the Shaw’s is focused primarily on equipment, storage space, and materials needed for storage. Martin Shaw and the investing partner will contribute equally. In addition, Shaw will secure a long-term business loan.
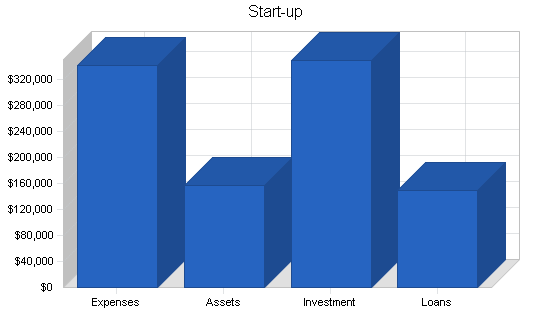
| Start-up Funding | |
| Start-up Expenses to Fund | $342,600 |
| Start-up Assets to Fund | $157,400 |
| Total Funding Required | $500,000 |
| Assets | |
| Non-cash Assets from Start-up | $0 |
| Cash Requirements from Start-up | $157,400 |
| Additional Cash Raised | $0 |
| Cash Balance on Starting Date | $157,400 |
| Total Assets | $157,400 |
| Liabilities and Capital | |
| Liabilities | |
| Current Borrowing | $0 |
| Long-term Liabilities | $150,000 |
| Accounts Payable (Outstanding Bills) | $0 |
| Other Current Liabilities (interest-free) | $0 |
| Total Liabilities | $150,000 |
| Capital | |
| Planned Investment | |
| Martin Shaw | $150,000 |
| Silent Partner | $200,000 |
| Additional Investment Requirement | $0 |
| Total Planned Investment | $350,000 |
| Loss at Start-up (Start-up Expenses) | ($342,600) |
| Total Capital | $7,400 |
| Total Capital and Liabilities | $157,400 |
| Total Funding | $500,000 |
| Start-up | |
| Requirements | |
| Start-up Expenses | |
| Legal | $2,000 |
| Stationery etc. | $600 |
| Brochures | $4,000 |
| Insurance | $1,000 |
| Rent | $5,000 |
| Leased Equipment | $180,000 |
| Storage Space Setup | $100,000 |
| Security | $50,000 |
| Total Start-up Expenses | $342,600 |
| Start-up Assets | |
| Cash Required | $157,400 |
| Other Current Assets | $0 |
| Long-term Assets | $0 |
| Total Assets | $157,400 |
| Total Requirements | $500,000 |
Products and Services
Shaw’s Records Management & Data Storage is a full-service, computerized records management company providing secure storage and indexing of paper records, digital media and other business-critical information, including computer disks and tapes, optical disks, microfilm, audio and video tapes, medical records, and blueprints.
Shaw’s personalized service includes retention schedules, data conversion and ORC, and records relocation. We provide specially designed boxes and other supplies which make handling records easier.
Shaw’s offers a Windows® based environment with a suite of coding and data management tools that can track a work order from the moment a container is requested until it is safely back in storage. This unique data system integrates every aspect of quality records management: request, retrieval, loading, curbside auditing, delivery validation, and return. Our system helps customers manage all their records–paper or electronic–and verifies the chain of custody at every step.
Market Analysis Summary
The northeast corridor is home to over 5,000 companies that are constantly seeking advantage in the marketplace. These companies represented over $3 billion in cumulative sales last year alone.
Companies located in the northeast corridor can be divided up in the following groups:
- Small Companies: 60% of the companies located in the northeast corridor are small companies. These companies have 50 to 150 employee and annual sales at around $5-$15 million. They represent a significant market since space and resources are critical to their growth and survival. Outsourcing record management is an excellent solution for a growing company that wants to control record compliance cost and needs more space.
- Medium-sized Companies: 25% of the companies located in the northeast corridor are medium-sized companies. These companies have over 300+ employees and their annual sales are between $20-50 million. Record management is a large part of their operating budget and is usually poorly organized and inefficient. Outsourcing record management can cap cost and improve retrieval time of critical documents.
- Large Companies: 15% of the companies located in the northeast corridor are large companies with over 1,000+ employees. These companies annual sales are $100-$300 million. Record management is now at the core of the strategic performance of the company. Archiving some percentage of cumulative records is an excellent strategy in protecting records and improving retrieval time.
4.1 Market Segmentation
Shaw’s will focus on the following target customers:
- Small companies;
- Medium companies;
- Large companies.

| Market Analysis | |||||||
| Year 1 | Year 2 | Year 3 | Year 4 | Year 5 | |||
| Potential Customers | Growth | CAGR | |||||
| Small Companies | 2% | 3,250 | 3,299 | 3,348 | 3,398 | 3,449 | 1.50% |
| Medium Companies | 1% | 1,750 | 1,762 | 1,774 | 1,786 | 1,799 | 0.69% |
| Large Companies | 0% | 250 | 251 | 252 | 253 | 254 | 0.40% |
| Total | 1.18% | 5,250 | 5,312 | 5,374 | 5,437 | 5,502 | 1.18% |
Strategy and Implementation Summary
Shaw’s Records Management and Data Storage has a strong sales advantage that will be the focus of our marketing. The advantage is the reputation and success of Martin Shaw in records management. For the past ten years, Mr. Shaw has been a valuable resource for record managers in the northeast corridor. His successes in improving the efficiency and accessibility of critical records are well documented and has been duplicated at a number of companies.
5.1 Sales Strategy
Martin Shaw will be the hub of our sales strategy. He will visit potential customers and deliver outsourcing proposals. Initially, Shaw’s will offer a 15% discount on storage rates for the first year. We anticipate that first month sales will be flat. Sales will pick up quickly in the second month.
5.1.1 Sales Forecast
The following is the sales forecast for three years.


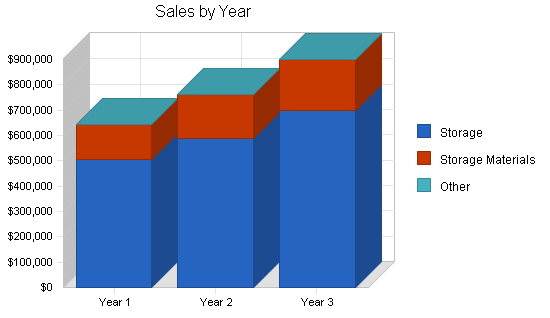
| Sales Forecast | |||
| Year 1 | Year 2 | Year 3 | |
| Sales | |||
| Storage | $506,000 | $590,000 | $700,000 |
| Storage Materials | $138,000 | $170,000 | $200,000 |
| Other | $0 | $0 | $0 |
| Total Sales | $644,000 | $760,000 | $900,000 |
| Direct Cost of Sales | Year 1 | Year 2 | Year 3 |
| Storage | $0 | $0 | $0 |
| Storage Materials | $59,550 | $85,000 | $100,000 |
| Other | $0 | $0 | $0 |
| Subtotal Direct Cost of Sales | $59,550 | $85,000 | $100,000 |
Management Summary
Shaw’s management system will be as follows:
- Martin Shaw will be responsible for day-to-day operation of the facility. He will also manage the sales team.
- A facility team will oversee the record storage and retrieval.
- A security team will be responsible for monitoring facility access.
- A customer service Team will be responsible for processing customer’s requests.
6.1 Personnel Plan
Shaw’s personnel are as follows:
- Martin Shaw
- Facility manager
- Security manager
- Customer service manager
- Facility/transport staff (4)
- Security staff (2)
- Customer service staff (2)
- Sales staff (2)
| Personnel Plan | |||
| Year 1 | Year 2 | Year 3 | |
| Martin Shaw | $36,000 | $36,000 | $38,000 |
| Facility Manager | $36,000 | $38,000 | $40,000 |
| Security Manager | $30,000 | $32,000 | $34,000 |
| Customer Service Manager | $36,000 | $38,000 | $40,000 |
| Facility Staff | $96,000 | $102,000 | $108,000 |
| Security Staff | $38,400 | $40,000 | $42,000 |
| Customer Service Staff | $40,800 | $42,000 | $44,000 |
| Sales Staff | $72,000 | $76,000 | $80,000 |
| Total People | 14 | 14 | 14 |
| Total Payroll | $385,200 | $404,000 | $426,000 |
Financial Plan
The following is the financial plan for Shaw’s Records Management and Data Storage.
7.1 Break-even Analysis
The monthly break-even point is calculated in the following table and chart.

| Break-even Analysis | |
| Monthly Revenue Break-even | $51,695 |
| Assumptions: | |
| Average Percent Variable Cost | 9% |
| Estimated Monthly Fixed Cost | $46,915 |
7.2 Projected Profit and Loss
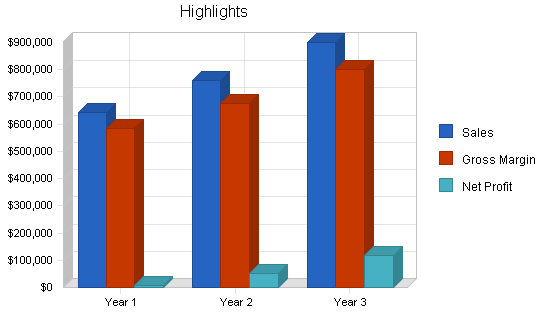
The following table and charts highlight the projected profit and loss for three years.


| Pro Forma Profit and Loss | |||
| Year 1 | Year 2 | Year 3 | |
| Sales | $644,000 | $760,000 | $900,000 |
| Direct Cost of Sales | $59,550 | $85,000 | $100,000 |
| Other Production Expenses | $0 | $0 | $0 |
| Total Cost of Sales | $59,550 | $85,000 | $100,000 |
| Gross Margin | $584,450 | $675,000 | $800,000 |
| Gross Margin % | 90.75% | 88.82% | 88.89% |
| Expenses | |||
| Payroll | $385,200 | $404,000 | $426,000 |
| Sales and Marketing and Other Expenses | $36,000 | $40,000 | $50,000 |
| Depreciation | $0 | $0 | $0 |
| Leased Equipment | $0 | $0 | $0 |
| Utilities | $12,000 | $12,000 | $12,000 |
| Insurance | $12,000 | $12,000 | $12,000 |
| Rent | $60,000 | $60,000 | $60,000 |
| Payroll Taxes | $57,780 | $60,600 | $63,900 |
| Other | $0 | $0 | $0 |
| Total Operating Expenses | $562,980 | $588,600 | $623,900 |
| Profit Before Interest and Taxes | $21,470 | $86,400 | $176,100 |
| EBITDA | $21,470 | $86,400 | $176,100 |
| Interest Expense | $13,375 | $10,500 | $7,500 |
| Taxes Incurred | $2,428 | $22,770 | $50,580 |
| Net Profit | $5,666 | $53,130 | $118,020 |
| Net Profit/Sales | 0.88% | 6.99% | 13.11% |
7.3 Projected Cash Flow
The following table and chart highlight the projected cash flow for three years.

| Pro Forma Cash Flow | |||
| Year 1 | Year 2 | Year 3 | |
| Cash Received | |||
| Cash from Operations | |||
| Cash Sales | $161,000 | $190,000 | $225,000 |
| Cash from Receivables | $347,325 | $545,562 | $645,505 |
| Subtotal Cash from Operations | $508,325 | $735,562 | $870,505 |
| Additional Cash Received | |||
| Sales Tax, VAT, HST/GST Received | $0 | $0 | $0 |
| New Current Borrowing | $0 | $0 | $0 |
| New Other Liabilities (interest-free) | $0 | $0 | $0 |
| New Long-term Liabilities | $0 | $0 | $0 |
| Sales of Other Current Assets | $0 | $0 | $0 |
| Sales of Long-term Assets | $0 | $0 | $0 |
| New Investment Received | $15,000 | $0 | $0 |
| Subtotal Cash Received | $523,325 | $735,562 | $870,505 |
| Expenditures | Year 1 | Year 2 | Year 3 |
| Expenditures from Operations | |||
| Cash Spending | $385,200 | $404,000 | $426,000 |
| Bill Payments | $224,641 | $306,470 | $351,615 |
| Subtotal Spent on Operations | $609,841 | $710,470 | $777,615 |
| Additional Cash Spent | |||
| Sales Tax, VAT, HST/GST Paid Out | $0 | $0 | $0 |
| Principal Repayment of Current Borrowing | $0 | $0 | $0 |
| Other Liabilities Principal Repayment | $0 | $0 | $0 |
| Long-term Liabilities Principal Repayment | $30,000 | $30,000 | $30,000 |
| Purchase Other Current Assets | $0 | $0 | $0 |
| Purchase Long-term Assets | $0 | $0 | $0 |
| Dividends | $0 | $0 | $0 |
| Subtotal Cash Spent | $639,841 | $740,470 | $807,615 |
| Net Cash Flow | ($116,516) | ($4,908) | $62,891 |
| Cash Balance | $40,884 | $35,977 | $98,867 |
7.4 Projected Balance Sheet
The following table highlights the projected balance sheet for three years.
| Pro Forma Balance Sheet | |||
| Year 1 | Year 2 | Year 3 | |
| Assets | |||
| Current Assets | |||
| Cash | $40,884 | $35,977 | $98,867 |
| Accounts Receivable | $135,675 | $160,113 | $189,608 |
| Other Current Assets | $0 | $0 | $0 |
| Total Current Assets | $176,559 | $196,090 | $288,475 |
| Long-term Assets | |||
| Long-term Assets | $0 | $0 | $0 |
| Accumulated Depreciation | $0 | $0 | $0 |
| Total Long-term Assets | $0 | $0 | $0 |
| Total Assets | $176,559 | $196,090 | $288,475 |
| Liabilities and Capital | Year 1 | Year 2 | Year 3 |
| Current Liabilities | |||
| Accounts Payable | $28,493 | $24,893 | $29,259 |
| Current Borrowing | $0 | $0 | $0 |
| Other Current Liabilities | $0 | $0 | $0 |
| Subtotal Current Liabilities | $28,493 | $24,893 | $29,259 |
| Long-term Liabilities | $120,000 | $90,000 | $60,000 |
| Total Liabilities | $148,493 | $114,893 | $89,259 |
| Paid-in Capital | $365,000 | $365,000 | $365,000 |
| Retained Earnings | ($342,600) | ($336,934) | ($283,804) |
| Earnings | $5,666 | $53,130 | $118,020 |
| Total Capital | $28,066 | $81,197 | $199,217 |
| Total Liabilities and Capital | $176,559 | $196,090 | $288,475 |
| Net Worth | $28,067 | $81,197 | $199,217 |
7.5 Business Ratios
Business ratios for the years of this plan are shown below. Industry profile ratios based on the Standard Industrial Classification (SIC) code 4226, Special Warehouse and Storage, are shown for comparison.
| Ratio Analysis | ||||
| Year 1 | Year 2 | Year 3 | Industry Profile | |
| Sales Growth | 0.00% | 18.01% | 18.42% | 1.00% |
| Percent of Total Assets | ||||
| Accounts Receivable | 76.84% | 81.65% | 65.73% | 23.10% |
| Other Current Assets | 0.00% | 0.00% | 0.00% | 22.30% |
| Total Current Assets | 100.00% | 100.00% | 100.00% | 46.50% |
| Long-term Assets | 0.00% | 0.00% | 0.00% | 53.50% |
| Total Assets | 100.00% | 100.00% | 100.00% | 100.00% |
| Current Liabilities | 16.14% | 12.69% | 10.14% | 31.00% |
| Long-term Liabilities | 67.97% | 45.90% | 20.80% | 25.60% |
| Total Liabilities | 84.10% | 58.59% | 30.94% | 56.60% |
| Net Worth | 15.90% | 41.41% | 69.06% | 43.40% |
| Percent of Sales | ||||
| Sales | 100.00% | 100.00% | 100.00% | 100.00% |
| Gross Margin | 90.75% | 88.82% | 88.89% | 100.00% |
| Selling, General & Administrative Expenses | 89.87% | 81.83% | 75.78% | 79.70% |
| Advertising Expenses | 5.59% | 5.26% | 5.56% | 0.30% |
| Profit Before Interest and Taxes | 3.33% | 11.37% | 19.57% | 1.50% |
| Main Ratios | ||||
| Current | 6.20 | 7.88 | 9.86 | 1.50 |
| Quick | 6.20 | 7.88 | 9.86 | 1.22 |
| Total Debt to Total Assets | 84.10% | 58.59% | 30.94% | 56.60% |
| Pre-tax Return on Net Worth | 28.84% | 93.48% | 84.63% | 3.10% |
| Pre-tax Return on Assets | 4.58% | 38.71% | 58.45% | 7.20% |
| Additional Ratios | Year 1 | Year 2 | Year 3 | |
| Net Profit Margin | 0.88% | 6.99% | 13.11% | n.a |
| Return on Equity | 20.19% | 65.43% | 59.24% | n.a |
| Activity Ratios | ||||
| Accounts Receivable Turnover | 3.56 | 3.56 | 3.56 | n.a |
| Collection Days | 56 | 95 | 95 | n.a |
| Accounts Payable Turnover | 8.88 | 12.17 | 12.17 | n.a |
| Payment Days | 27 | 32 | 28 | n.a |
| Total Asset Turnover | 3.65 | 3.88 | 3.12 | n.a |
| Debt Ratios | ||||
| Debt to Net Worth | 5.29 | 1.42 | 0.45 | n.a |
| Current Liab. to Liab. | 0.19 | 0.22 | 0.33 | n.a |
| Liquidity Ratios | ||||
| Net Working Capital | $148,067 | $171,197 | $259,217 | n.a |
| Interest Coverage | 1.61 | 8.23 | 23.48 | n.a |
| Additional Ratios | ||||
| Assets to Sales | 0.27 | 0.26 | 0.32 | n.a |
| Current Debt/Total Assets | 16% | 13% | 10% | n.a |
| Acid Test | 1.43 | 1.45 | 3.38 | n.a |
| Sales/Net Worth | 22.95 | 9.36 | 4.52 | n.a |
| Dividend Payout | 0.00 | 0.00 | 0.00 | n.a |
Appendix
| Sales Forecast | |||||||||||||
| Month 1 | Month 2 | Month 3 | Month 4 | Month 5 | Month 6 | Month 7 | Month 8 | Month 9 | Month 10 | Month 11 | Month 12 | ||
| Sales | |||||||||||||
| Storage | 0% | $0 | $15,000 | $20,000 | $27,000 | $36,000 | $43,000 | $50,000 | $50,000 | $60,000 | $65,000 | $70,000 | $70,000 |
| Storage Materials | 0% | $0 | $2,000 | $3,000 | $5,000 | $8,000 | $10,000 | $13,000 | $15,000 | $18,000 | $20,000 | $23,000 | $21,000 |
| Other | 0% | $0 | $0 | $0 | $0 | $0 | $0 | $0 | $0 | $0 | $0 | $0 | $0 |
| Total Sales | $0 | $17,000 | $23,000 | $32,000 | $44,000 | $53,000 | $63,000 | $65,000 | $78,000 | $85,000 | $93,000 | $91,000 | |
| Direct Cost of Sales | Month 1 | Month 2 | Month 3 | Month 4 | Month 5 | Month 6 | Month 7 | Month 8 | Month 9 | Month 10 | Month 11 | Month 12 | |
| Storage | $0 | $0 | $0 | $0 | $0 | $0 | $0 | $0 | $0 | $0 | $0 | $0 | |
| Storage Materials | $0 | $1,000 | $1,500 | $2,500 | $4,000 | $5,000 | $6,500 | $7,500 | $9,000 | $10,000 | $11,500 | $1,050 | |
| Other | $0 | $0 | $0 | $0 | $0 | $0 | $0 | $0 | $0 | $0 | $0 | $0 | |
| Subtotal Direct Cost of Sales | $0 | $1,000 | $1,500 | $2,500 | $4,000 | $5,000 | $6,500 | $7,500 | $9,000 | $10,000 | $11,500 | $1,050 | |
| Personnel Plan | |||||||||||||
| Month 1 | Month 2 | Month 3 | Month 4 | Month 5 | Month 6 | Month 7 | Month 8 | Month 9 | Month 10 | Month 11 | Month 12 | ||
| Martin Shaw | 0% | $3,000 | $3,000 | $3,000 | $3,000 | $3,000 | $3,000 | $3,000 | $3,000 | $3,000 | $3,000 | $3,000 | $3,000 |
| Facility Manager | 0% | $3,000 | $3,000 | $3,000 | $3,000 | $3,000 | $3,000 | $3,000 | $3,000 | $3,000 | $3,000 | $3,000 | $3,000 |
| Security Manager | 0% | $2,500 | $2,500 | $2,500 | $2,500 | $2,500 | $2,500 | $2,500 | $2,500 | $2,500 | $2,500 | $2,500 | $2,500 |
| Customer Service Manager | 0% | $3,000 | $3,000 | $3,000 | $3,000 | $3,000 | $3,000 | $3,000 | $3,000 | $3,000 | $3,000 | $3,000 | $3,000 |
| Facility Staff | 0% | $8,000 | $8,000 | $8,000 | $8,000 | $8,000 | $8,000 | $8,000 | $8,000 | $8,000 | $8,000 | $8,000 | $8,000 |
| Security Staff | 0% | $3,200 | $3,200 | $3,200 | $3,200 | $3,200 | $3,200 | $3,200 | $3,200 | $3,200 | $3,200 | $3,200 | $3,200 |
| Customer Service Staff | 0% | $3,400 | $3,400 | $3,400 | $3,400 | $3,400 | $3,400 | $3,400 | $3,400 | $3,400 | $3,400 | $3,400 | $3,400 |
| Sales Staff | 0% | $6,000 | $6,000 | $6,000 | $6,000 | $6,000 | $6,000 | $6,000 | $6,000 | $6,000 | $6,000 | $6,000 | $6,000 |
| Total People | 14 | 14 | 14 | 14 | 14 | 14 | 14 | 14 | 14 | 14 | 14 | 14 | |
| Total Payroll | $32,100 | $32,100 | $32,100 | $32,100 | $32,100 | $32,100 | $32,100 | $32,100 | $32,100 | $32,100 | $32,100 | $32,100 | |
| General Assumptions | |||||||||||||
| Month 1 | Month 2 | Month 3 | Month 4 | Month 5 | Month 6 | Month 7 | Month 8 | Month 9 | Month 10 | Month 11 | Month 12 | ||
| Plan Month | 1 | 2 | 3 | 4 | 5 | 6 | 7 | 8 | 9 | 10 | 11 | 12 | |
| Current Interest Rate | 10.00% | 10.00% | 10.00% | 10.00% | 10.00% | 10.00% | 10.00% | 10.00% | 10.00% | 10.00% | 10.00% | 10.00% | |
| Long-term Interest Rate | 10.00% | 10.00% | 10.00% | 10.00% | 10.00% | 10.00% | 10.00% | 10.00% | 10.00% | 10.00% | 10.00% | 10.00% | |
| Tax Rate | 30.00% | 30.00% | 30.00% | 30.00% | 30.00% | 30.00% | 30.00% | 30.00% | 30.00% | 30.00% | 30.00% | 30.00% | |
| Other | 0 | 0 | 0 | 0 | 0 | 0 | 0 | 0 | 0 | 0 | 0 | 0 | |
| Pro Forma Profit and Loss | |||||||||||||
| Month 1 | Month 2 | Month 3 | Month 4 | Month 5 | Month 6 | Month 7 | Month 8 | Month 9 | Month 10 | Month 11 | Month 12 | ||
| Sales | $0 | $17,000 | $23,000 | $32,000 | $44,000 | $53,000 | $63,000 | $65,000 | $78,000 | $85,000 | $93,000 | $91,000 | |
| Direct Cost of Sales | $0 | $1,000 | $1,500 | $2,500 | $4,000 | $5,000 | $6,500 | $7,500 | $9,000 | $10,000 | $11,500 | $1,050 | |
| Other Production Expenses | $0 | $0 | $0 | $0 | $0 | $0 | $0 | $0 | $0 | $0 | $0 | $0 | |
| Total Cost of Sales | $0 | $1,000 | $1,500 | $2,500 | $4,000 | $5,000 | $6,500 | $7,500 | $9,000 | $10,000 | $11,500 | $1,050 | |
| Gross Margin | $0 | $16,000 | $21,500 | $29,500 | $40,000 | $48,000 | $56,500 | $57,500 | $69,000 | $75,000 | $81,500 | $89,950 | |
| Gross Margin % | 0.00% | 94.12% | 93.48% | 92.19% | 90.91% | 90.57% | 89.68% | 88.46% | 88.46% | 88.24% | 87.63% | 98.85% | |
| Expenses | |||||||||||||
| Payroll | $32,100 | $32,100 | $32,100 | $32,100 | $32,100 | $32,100 | $32,100 | $32,100 | $32,100 | $32,100 | $32,100 | $32,100 | |
| Sales and Marketing and Other Expenses | $3,000 | $3,000 | $3,000 | $3,000 | $3,000 | $3,000 | $3,000 | $3,000 | $3,000 | $3,000 | $3,000 | $3,000 | |
| Depreciation | $0 | $0 | $0 | $0 | $0 | $0 | $0 | $0 | $0 | $0 | $0 | $0 | |
| Leased Equipment | $0 | $0 | $0 | $0 | $0 | $0 | $0 | $0 | $0 | $0 | $0 | $0 | |
| Utilities | $1,000 | $1,000 | $1,000 | $1,000 | $1,000 | $1,000 | $1,000 | $1,000 | $1,000 | $1,000 | $1,000 | $1,000 | |
| Insurance | $1,000 | $1,000 | $1,000 | $1,000 | $1,000 | $1,000 | $1,000 | $1,000 | $1,000 | $1,000 | $1,000 | $1,000 | |
| Rent | $5,000 | $5,000 | $5,000 | $5,000 | $5,000 | $5,000 | $5,000 | $5,000 | $5,000 | $5,000 | $5,000 | $5,000 | |
| Payroll Taxes | 15% | $4,815 | $4,815 | $4,815 | $4,815 | $4,815 | $4,815 | $4,815 | $4,815 | $4,815 | $4,815 | $4,815 | $4,815 |
| Other | $0 | $0 | $0 | $0 | $0 | $0 | $0 | $0 | $0 | $0 | $0 | $0 | |
| Total Operating Expenses | $46,915 | $46,915 | $46,915 | $46,915 | $46,915 | $46,915 | $46,915 | $46,915 | $46,915 | $46,915 | $46,915 | $46,915 | |
| Profit Before Interest and Taxes | ($46,915) | ($30,915) | ($25,415) | ($17,415) | ($6,915) | $1,085 | $9,585 | $10,585 | $22,085 | $28,085 | $34,585 | $43,035 | |
| EBITDA | ($46,915) | ($30,915) | ($25,415) | ($17,415) | ($6,915) | $1,085 | $9,585 | $10,585 | $22,085 | $28,085 | $34,585 | $43,035 | |
| Interest Expense | $1,229 | $1,208 | $1,188 | $1,167 | $1,146 | $1,125 | $1,104 | $1,083 | $1,063 | $1,042 | $1,021 | $1,000 | |
| Taxes Incurred | ($14,443) | ($9,637) | ($7,981) | ($5,575) | ($2,418) | ($12) | $2,544 | $2,850 | $6,307 | $8,113 | $10,069 | $12,611 | |
| Net Profit | ($33,701) | ($22,486) | ($18,622) | ($13,007) | ($5,643) | ($28) | $5,937 | $6,651 | $14,716 | $18,930 | $23,495 | $29,425 | |
| Net Profit/Sales | 0.00% | -132.27% | -80.96% | -40.65% | -12.82% | -0.05% | 9.42% | 10.23% | 18.87% | 22.27% | 25.26% | 32.33% | |
| Pro Forma Cash Flow | |||||||||||||
| Month 1 | Month 2 | Month 3 | Month 4 | Month 5 | Month 6 | Month 7 | Month 8 | Month 9 | Month 10 | Month 11 | Month 12 | ||
| Cash Received | |||||||||||||
| Cash from Operations | |||||||||||||
| Cash Sales | $0 | $4,250 | $5,750 | $8,000 | $11,000 | $13,250 | $15,750 | $16,250 | $19,500 | $21,250 | $23,250 | $22,750 | |
| Cash from Receivables | $0 | $0 | $425 | $12,900 | $17,475 | $24,300 | $33,225 | $40,000 | $47,300 | $49,075 | $58,675 | $63,950 | |
| Subtotal Cash from Operations | $0 | $4,250 | $6,175 | $20,900 | $28,475 | $37,550 | $48,975 | $56,250 | $66,800 | $70,325 | $81,925 | $86,700 | |
| Additional Cash Received | |||||||||||||
| Sales Tax, VAT, HST/GST Received | 0.00% | $0 | $0 | $0 | $0 | $0 | $0 | $0 | $0 | $0 | $0 | $0 | $0 |
| New Current Borrowing | $0 | $0 | $0 | $0 | $0 | $0 | $0 | $0 | $0 | $0 | $0 | $0 | |
| New Other Liabilities (interest-free) | $0 | $0 | $0 | $0 | $0 | $0 | $0 | $0 | $0 | $0 | $0 | $0 | |
| New Long-term Liabilities | $0 | $0 | $0 | $0 | $0 | $0 | $0 | $0 | $0 | $0 | $0 | $0 | |
| Sales of Other Current Assets | $0 | $0 | $0 | $0 | $0 | $0 | $0 | $0 | $0 | $0 | $0 | $0 | |
| Sales of Long-term Assets | $0 | $0 | $0 | $0 | $0 | $0 | $0 | $0 | $0 | $0 | $0 | $0 | |
| New Investment Received | $0 | $0 | $0 | $0 | $0 | $15,000 | $0 | $0 | $0 | $0 | $0 | $0 | |
| Subtotal Cash Received | $0 | $4,250 | $6,175 | $20,900 | $28,475 | $52,550 | $48,975 | $56,250 | $66,800 | $70,325 | $81,925 | $86,700 | |
| Expenditures | Month 1 | Month 2 | Month 3 | Month 4 | Month 5 | Month 6 | Month 7 | Month 8 | Month 9 | Month 10 | Month 11 | Month 12 | |
| Expenditures from Operations | |||||||||||||
| Cash Spending | $32,100 | $32,100 | $32,100 | $32,100 | $32,100 | $32,100 | $32,100 | $32,100 | $32,100 | $32,100 | $32,100 | $32,100 | |
| Bill Payments | $53 | $1,794 | $7,458 | $9,635 | $13,062 | $17,655 | $21,063 | $25,006 | $26,413 | $31,277 | $34,084 | $37,141 | |
| Subtotal Spent on Operations | $32,153 | $33,894 | $39,558 | $41,735 | $45,162 | $49,755 | $53,163 | $57,106 | $58,513 | $63,377 | $66,184 | $69,241 | |
| Additional Cash Spent | |||||||||||||
| Sales Tax, VAT, HST/GST Paid Out | $0 | $0 | $0 | $0 | $0 | $0 | $0 | $0 | $0 | $0 | $0 | $0 | |
| Principal Repayment of Current Borrowing | $0 | $0 | $0 | $0 | $0 | $0 | $0 | $0 | $0 | $0 | $0 | $0 | |
| Other Liabilities Principal Repayment | $0 | $0 | $0 | $0 | $0 | $0 | $0 | $0 | $0 | $0 | $0 | $0 | |
| Long-term Liabilities Principal Repayment | $2,500 | $2,500 | $2,500 | $2,500 | $2,500 | $2,500 | $2,500 | $2,500 | $2,500 | $2,500 | $2,500 | $2,500 | |
| Purchase Other Current Assets | $0 | $0 | $0 | $0 | $0 | $0 | $0 | $0 | $0 | $0 | $0 | $0 | |
| Purchase Long-term Assets | $0 | $0 | $0 | $0 | $0 | $0 | $0 | $0 | $0 | $0 | $0 | $0 | |
| Dividends | $0 | $0 | $0 | $0 | $0 | $0 | $0 | $0 | $0 | $0 | $0 | $0 | |
| Subtotal Cash Spent | $34,653 | $36,394 | $42,058 | $44,235 | $47,662 | $52,255 | $55,663 | $59,606 | $61,013 | $65,877 | $68,684 | $71,741 | |
| Net Cash Flow | ($34,653) | ($32,144) | ($35,883) | ($23,335) | ($19,187) | $295 | ($6,688) | ($3,356) | $5,787 | $4,448 | $13,241 | $14,959 | |
| Cash Balance | $122,747 | $90,603 | $54,720 | $31,386 | $12,199 | $12,494 | $5,806 | $2,450 | $8,237 | $12,684 | $25,925 | $40,884 | |
| Pro Forma Balance Sheet | |||||||||||||
| Month 1 | Month 2 | Month 3 | Month 4 | Month 5 | Month 6 | Month 7 | Month 8 | Month 9 | Month 10 | Month 11 | Month 12 | ||
| Assets | Starting Balances | ||||||||||||
| Current Assets | |||||||||||||
| Cash | $157,400 | $122,747 | $90,603 | $54,720 | $31,386 | $12,199 | $12,494 | $5,806 | $2,450 | $8,237 | $12,684 | $25,925 | $40,884 |
| Accounts Receivable | $0 | $0 | $12,750 | $29,575 | $40,675 | $56,200 | $71,650 | $85,675 | $94,425 | $105,625 | $120,300 | $131,375 | $135,675 |
| Other Current Assets | $0 | $0 | $0 | $0 | $0 | $0 | $0 | $0 | $0 | $0 | $0 | $0 | $0 |
| Total Current Assets | $157,400 | $122,747 | $103,353 | $84,295 | $72,061 | $68,399 | $84,144 | $91,481 | $96,875 | $113,862 | $132,984 | $157,300 | $176,559 |
| Long-term Assets | |||||||||||||
| Long-term Assets | $0 | $0 | $0 | $0 | $0 | $0 | $0 | $0 | $0 | $0 | $0 | $0 | $0 |
| Accumulated Depreciation | $0 | $0 | $0 | $0 | $0 | $0 | $0 | $0 | $0 | $0 | $0 | $0 | $0 |
| Total Long-term Assets | $0 | $0 | $0 | $0 | $0 | $0 | $0 | $0 | $0 | $0 | $0 | $0 | $0 |
| Total Assets | $157,400 | $122,747 | $103,353 | $84,295 | $72,061 | $68,399 | $84,144 | $91,481 | $96,875 | $113,862 | $132,984 | $157,300 | $176,559 |
| Liabilities and Capital | Month 1 | Month 2 | Month 3 | Month 4 | Month 5 | Month 6 | Month 7 | Month 8 | Month 9 | Month 10 | Month 11 | Month 12 | |
| Current Liabilities | |||||||||||||
| Accounts Payable | $0 | $1,548 | $7,140 | $9,204 | $12,477 | $16,958 | $20,230 | $24,131 | $25,374 | $30,145 | $32,837 | $36,158 | $28,493 |
| Current Borrowing | $0 | $0 | $0 | $0 | $0 | $0 | $0 | $0 | $0 | $0 | $0 | $0 | $0 |
| Other Current Liabilities | $0 | $0 | $0 | $0 | $0 | $0 | $0 | $0 | $0 | $0 | $0 | $0 | $0 |
| Subtotal Current Liabilities | $0 | $1,548 | $7,140 | $9,204 | $12,477 | $16,958 | $20,230 | $24,131 | $25,374 | $30,145 | $32,837 | $36,158 | $28,493 |
| Long-term Liabilities | $150,000 | $147,500 | $145,000 | $142,500 | $140,000 | $137,500 | $135,000 | $132,500 | $130,000 | $127,500 | $125,000 | $122,500 | $120,000 |
| Total Liabilities | $150,000 | $149,048 | $152,140 | $151,704 | $152,477 | $154,458 | $155,230 | $156,631 | $155,374 | $157,645 | $157,837 | $158,658 | $148,493 |
| Paid-in Capital | $350,000 | $350,000 | $350,000 | $350,000 | $350,000 | $350,000 | $365,000 | $365,000 | $365,000 | $365,000 | $365,000 | $365,000 | $365,000 |
| Retained Earnings | ($342,600) | ($342,600) | ($342,600) | ($342,600) | ($342,600) | ($342,600) | ($342,600) | ($342,600) | ($342,600) | ($342,600) | ($342,600) | ($342,600) | ($342,600) |
| Earnings | $0 | ($33,701) | ($56,187) | ($74,809) | ($87,816) | ($93,459) | ($93,487) | ($87,550) | ($80,899) | ($66,183) | ($47,253) | ($23,758) | $5,666 |
| Total Capital | $7,400 | ($26,301) | ($48,787) | ($67,409) | ($80,416) | ($86,059) | ($71,087) | ($65,150) | ($58,499) | ($43,783) | ($24,853) | ($1,358) | $28,066 |
| Total Liabilities and Capital | $157,400 | $122,747 | $103,353 | $84,295 | $72,061 | $68,399 | $84,144 | $91,481 | $96,875 | $113,862 | $132,984 | $157,300 | $176,559 |
| Net Worth | $7,400 | ($26,301) | ($48,787) | ($67,409) | ($80,416) | ($86,059) | ($71,087) | ($65,150) | ($58,499) | ($43,783) | ($24,853) | ($1,358) | $28,067 |

