
Security First Shredding
Executive Summary
Theft, vandalism, and industrial espionage are becoming ever increasing security problems. There are too many horror stories resulting from confidential information getting into the wrong hands. Today’s information explosion can be devastating to a business. With the increased use of office copiers and computers, staggering amounts of sensitive information is being generated and carelessly discarded.
Security First Shredding is a professional paper shredding company, providing the most secure, efficient, simple and cost effective plan available for destroying a company’s confidential information. Security First Shredding provides complete on-site and off-site document destruction services. Security First Shredding will service companies in the Madison area. The company has experience in product destruction as well as the shredding of microfilm, microfiche, credit cards, computer tapes and other forms of media storage.
A certificate of destruction will be provided with each invoice. We also offer recycling programs for non-confidential documents.
Janet Wilson, co-owner of Security First Shredding, has ten years of experience in the field of document destruction. She has worked for both Shredd-All and Capital Shredding in New York, before moving to the Madison area last year.
Security First Shredding will have two state-of-the-art disposal trucks that can shred documents at the business site or transport it to a recycling center for disposal.

1.1 Mission
The mission of Security First Shredding is to provide a cost-effective document disposal service that protects our customers demand for security.
1.2 Objectives
Security First Shredding’s objectives are as follows:
- Achieve sales goal during first year of operation.
- Achieve a customer base of 100 companies.
- Increase sales by 15% during the second year of operation.
Company Summary
Security First Shredding is a professional paper shredding company, providing the most secure, efficient, simple and cost effective plan available for destroying a company’s confidential information. Security First Shredding provides complete on-site and off-site document destruction services. The company will be organized as a limited partnership.
Security First Shredding has an 8,000 square foot facility located in the Westside Industrial Park. The park anchors the industrial section of the city and is within easy access of 80% of the potential customers.
2.1 Start-up Summary
The start-up expenses for the Security First Shredding is focused primarily on disposal equipment, disposal bins, and disposal trucks. Janet Wilson and the silent partner will each make substantial investments in the company. In addition, Wilson will secure a long-term loan business loan.
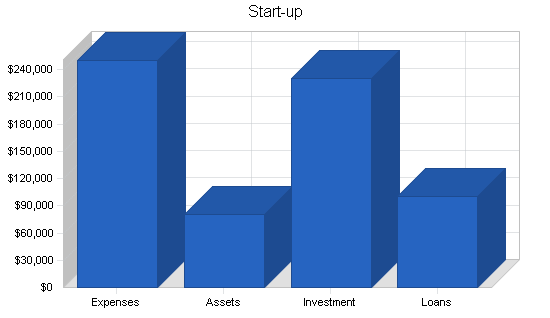
| Start-up Funding | |
| Start-up Expenses to Fund | $249,600 |
| Start-up Assets to Fund | $80,400 |
| Total Funding Required | $330,000 |
| Assets | |
| Non-cash Assets from Start-up | $0 |
| Cash Requirements from Start-up | $80,400 |
| Additional Cash Raised | $0 |
| Cash Balance on Starting Date | $80,400 |
| Total Assets | $80,400 |
| Liabilities and Capital | |
| Liabilities | |
| Current Borrowing | $0 |
| Long-term Liabilities | $100,000 |
| Accounts Payable (Outstanding Bills) | $0 |
| Other Current Liabilities (interest-free) | $0 |
| Total Liabilities | $100,000 |
| Capital | |
| Planned Investment | |
| Janet Wilson | $80,000 |
| Silent Partner | $150,000 |
| Additional Investment Requirement | $0 |
| Total Planned Investment | $230,000 |
| Loss at Start-up (Start-up Expenses) | ($249,600) |
| Total Capital | ($19,600) |
| Total Capital and Liabilities | $80,400 |
| Total Funding | $330,000 |
| Start-up | |
| Requirements | |
| Start-up Expenses | |
| Legal | $2,000 |
| Stationery etc. | $600 |
| Brochures | $4,000 |
| Insurance | $1,000 |
| Rent | $2,000 |
| Disposal Trucks | $110,000 |
| Disposal Bins | $50,000 |
| Disposal Equipment | $80,000 |
| Total Start-up Expenses | $249,600 |
| Start-up Assets | |
| Cash Required | $80,400 |
| Other Current Assets | $0 |
| Long-term Assets | $0 |
| Total Assets | $80,400 |
| Total Requirements | $330,000 |
2.2 Company Ownership
Security First Shredding is owned by Janet Wilson and a silent partner.
Services
Security First Shredding offers the following services:
Security
On-site document destruction service is the safest, most secure, and convenient means of disposing of your sensitive documents. Our bonded uniformed employees will take a customer’s classified documents from the security bins that we provide for the office directly to the mobile shredding unit where the materials will be destroyed.
Efficiency
The high-speed shredders mounted on our trucks are 40 times faster than most office shredders, reducing a customer’s cost of shredding by over 25%.
On-site destruction services
Security First Shredding will provide security bins to be placed throughout the office area. These bins have a built in lock to ensure documents cannot be removed without a key. The material will be destroyed on-site and the shredded paper will then be taken to our facility where it will be recycled.
Off-site destruction services
Security First Shredding also offers off-site document destruction. We will still supply the customer with security bins but the materials will be brought back to our facility to be shredded. In addition to the security consoles for the office, we offer 65-gallon schafer containers. These schaefer containers are used for high volume areas. Customers with large volumes of paper find this to be the most economical way to handle classified materials.
A certificate of destruction will be provided with each invoice.
Market Analysis Summary
Theft, vandalism, and industrial espionage are becoming ever increasing security problems. There are too many horror stories resulting from confidential information getting into the wrong hands. Today’s information explosion can be devastating to a business. With the increased use of office copiers and computers, staggering amounts of sensitive information is being generated and carelessly discarded.
Outdated or inactive company files can also become damaging once they have reached their legal limit of retention. Shredding this information protects a company against potential lawsuits.
The supreme court has ruled that information in the trash is “fair game” to anyone. Privacy laws make any company vulnerable to law suits when personal records are disclosed to outsiders–even by accident.
The 1974 federal privacy act was established to ensure that government agencies protect the privacy of individuals and businesses with regard to information held by them and to hold these agencies liable if any information is released without authorization.
It is estimated that corporate espionage costs U.S. businesses over $7 billion in losses yearly. It’s believed that one in four American adults have been defrauded in various identify theft schemes.
A company’s trash is a great source of a financial and personal catastrophe. It’s an unimaginable nightmare for most people, and a nefarious windfall for the growing ranks of corporate scavengers and identity thieves currently farming america’s trash.
Large corporations have internal disposal systems to protect themselves, but small to second tier companies typically have poor or inefficient systems in place. Madison has 3,000 businesses and companies that have potential need for a document disposal service.
4.1 Market Segmentation
Security First Shredding will focus on the following target customers:
- Small Businesses and Companies: These companies have 10 to 25 employees. They represent a significant market since internal document disposal is not cost-effective or efficient. Outsourcing disposal services is a excellent solution that will reduce the business disposal costs by 25%.
- Second Tier Companies: These companies have over 100+ employees. Record disposal is quickly becoming a important concern and is usually poorly organized and inefficient. Outsourcing disposal services can cap costs and improve the efficiency of the process.

| Market Analysis | |||||||
| Year 1 | Year 2 | Year 3 | Year 4 | Year 5 | |||
| Potential Customers | Growth | CAGR | |||||
| Small Companies | 4% | 2,300 | 2,392 | 2,488 | 2,588 | 2,692 | 4.01% |
| Second Tier Companies | 1% | 700 | 707 | 714 | 721 | 728 | 0.99% |
| Total | 3.33% | 3,000 | 3,099 | 3,202 | 3,309 | 3,420 | 3.33% |
Strategy and Implementation Summary
Security First Shredding will market an annual service contract at a 20% discount to small companies and a 15% discount to medium-size companies. We will offer a free on-site survey of the company’s facility to determine the company’s exact needs.
5.1 Competitive Edge
Security First Shredding’s competitive edge is our quick response to a customer’s request for services. Security First Shredding will respond within 24 hours of a request by a company for record shredding services. Our disposal trucks shred documents twice as fast as our competitors and has a greater load capacity.

Most importantly, Janet Wilson’s leadership is a tremendous competitive advantage. She was the top salesperson for both Shredd-All and Capital Shredding when she was with those companies. Her strength is her ability to use the assessment as a sales tool to demonstrate savings and promote the company’s services.
5.2 Sales Strategy
Security First Shredding’s sales strategy is to offer a free on-site disposal survey of the company’s facility. Janet Wilson, who performed such surveys with both Shredd-All and Capital Shredding in New York, will supervise the assessment. We anticipate that first month sales will be flat. Sales will pick up quickly in the second month.
5.2.1 Sales Forecast
The following is the sales forecast for three years.


| Sales Forecast | |||
| Year 1 | Year 2 | Year 3 | |
| Sales | |||
| On-site Disposal | $220,000 | $230,000 | $290,000 |
| Off-site Disposal | $232,000 | $230,000 | $290,000 |
| Other | $0 | $0 | $0 |
| Total Sales | $452,000 | $460,000 | $580,000 |
| Direct Cost of Sales | Year 1 | Year 2 | Year 3 |
| On-site Disposal | $17,200 | $23,000 | $29,000 |
| Off-site Disposal | $17,400 | $23,000 | $29,000 |
| Other | $0 | $0 | $0 |
| Subtotal Direct Cost of Sales | $34,600 | $46,000 | $58,000 |
Management Summary
Security First Shredding’s management system will be as follows:
- Janet Wilson will be responsible for day-to-day operation of the facility. She will also manage the sales team.
- An off-site facility team will manage disposal of records at the Security First Shredding’s facility.
- An on-site team will manage disposal at a customer site.
6.1 Personnel Plan
Security First Shredding’s personnel are as follows:
- Janet Wilson
- Off-site disposal manager
- Facility staff (4)
- On-site staff/drivers (4)
- Customer service staff (1)
- Sales staff (1)
| Personnel Plan | |||
| Year 1 | Year 2 | Year 3 | |
| Janet Wilson | $36,000 | $36,000 | $38,000 |
| Off-site Facility Manager | $30,000 | $32,000 | $34,000 |
| Off-site Facility Staff | $78,000 | $86,000 | $94,000 |
| On-site Staff/Drivers | $78,000 | $86,000 | $94,000 |
| Customer Service Staff | $19,200 | $21,000 | $23,000 |
| Sales Staff | $24,000 | $26,000 | $28,000 |
| Other | $0 | $0 | $0 |
| Total People | 12 | 12 | 12 |
| Total Payroll | $265,200 | $287,000 | $311,000 |
Financial Plan
The following is the financial plan for Security First Shredding.
7.1 Break-even Analysis
The monthly break-even point is shown in the table and chart below.

| Break-even Analysis | |
| Monthly Revenue Break-even | $31,528 |
| Assumptions: | |
| Average Percent Variable Cost | 8% |
| Estimated Monthly Fixed Cost | $29,115 |
7.2 Projected Profit and Loss
The following table and charts highlight the projected profit and loss for three years.


| Pro Forma Profit and Loss | |||
| Year 1 | Year 2 | Year 3 | |
| Sales | $452,000 | $460,000 | $580,000 |
| Direct Cost of Sales | $34,600 | $46,000 | $58,000 |
| Other Production Expenses | $0 | $0 | $0 |
| Total Cost of Sales | $34,600 | $46,000 | $58,000 |
| Gross Margin | $417,400 | $414,000 | $522,000 |
| Gross Margin % | 92.35% | 90.00% | 90.00% |
| Expenses | |||
| Payroll | $265,200 | $287,000 | $311,000 |
| Sales and Marketing and Other Expenses | $12,000 | $15,000 | $18,000 |
| Depreciation | $0 | $0 | $0 |
| Leased Equipment | $0 | $0 | $0 |
| Utilities | $4,800 | $0 | $0 |
| Insurance | $3,600 | $0 | $0 |
| Rent | $24,000 | $0 | $0 |
| Payroll Taxes | $39,780 | $43,050 | $46,650 |
| Other | $0 | $0 | $0 |
| Total Operating Expenses | $349,380 | $345,050 | $375,650 |
| Profit Before Interest and Taxes | $68,020 | $68,950 | $146,350 |
| EBITDA | $68,020 | $68,950 | $146,350 |
| Interest Expense | $9,350 | $8,200 | $7,000 |
| Taxes Incurred | $17,601 | $18,225 | $41,805 |
| Net Profit | $41,069 | $42,525 | $97,545 |
| Net Profit/Sales | 9.09% | 9.24% | 16.82% |
7.3 Projected Cash Flow
The following table and chart highlight the projected cash flow for three years.

| Pro Forma Cash Flow | |||
| Year 1 | Year 2 | Year 3 | |
| Cash Received | |||
| Cash from Operations | |||
| Cash Sales | $113,000 | $115,000 | $145,000 |
| Cash from Receivables | $242,375 | $343,290 | $409,347 |
| Subtotal Cash from Operations | $355,375 | $458,290 | $554,347 |
| Additional Cash Received | |||
| Sales Tax, VAT, HST/GST Received | $0 | $0 | $0 |
| New Current Borrowing | $0 | $0 | $0 |
| New Other Liabilities (interest-free) | $10,000 | $0 | $0 |
| New Long-term Liabilities | $0 | $0 | $0 |
| Sales of Other Current Assets | $0 | $0 | $0 |
| Sales of Long-term Assets | $0 | $0 | $0 |
| New Investment Received | $10,000 | $0 | $0 |
| Subtotal Cash Received | $375,375 | $458,290 | $554,347 |
| Expenditures | Year 1 | Year 2 | Year 3 |
| Expenditures from Operations | |||
| Cash Spending | $265,200 | $287,000 | $311,000 |
| Bill Payments | $122,728 | $142,754 | $168,087 |
| Subtotal Spent on Operations | $387,928 | $429,754 | $479,087 |
| Additional Cash Spent | |||
| Sales Tax, VAT, HST/GST Paid Out | $0 | $0 | $0 |
| Principal Repayment of Current Borrowing | $0 | $0 | $0 |
| Other Liabilities Principal Repayment | $0 | $0 | $0 |
| Long-term Liabilities Principal Repayment | $12,000 | $12,000 | $12,000 |
| Purchase Other Current Assets | $0 | $0 | $0 |
| Purchase Long-term Assets | $0 | $0 | $0 |
| Dividends | $0 | $0 | $0 |
| Subtotal Cash Spent | $399,928 | $441,754 | $491,087 |
| Net Cash Flow | ($24,553) | $16,536 | $63,261 |
| Cash Balance | $55,847 | $72,383 | $135,643 |
7.4 Projected Balance Sheet
The following table highlights the projected balance sheet for three years.
| Pro Forma Balance Sheet | |||
| Year 1 | Year 2 | Year 3 | |
| Assets | |||
| Current Assets | |||
| Cash | $55,847 | $72,383 | $135,643 |
| Accounts Receivable | $96,625 | $98,335 | $123,988 |
| Other Current Assets | $0 | $0 | $0 |
| Total Current Assets | $152,472 | $170,718 | $259,631 |
| Long-term Assets | |||
| Long-term Assets | $0 | $0 | $0 |
| Accumulated Depreciation | $0 | $0 | $0 |
| Total Long-term Assets | $0 | $0 | $0 |
| Total Assets | $152,472 | $170,718 | $259,631 |
| Liabilities and Capital | Year 1 | Year 2 | Year 3 |
| Current Liabilities | |||
| Accounts Payable | $23,003 | $10,724 | $14,092 |
| Current Borrowing | $0 | $0 | $0 |
| Other Current Liabilities | $10,000 | $10,000 | $10,000 |
| Subtotal Current Liabilities | $33,003 | $20,724 | $24,092 |
| Long-term Liabilities | $88,000 | $76,000 | $64,000 |
| Total Liabilities | $121,003 | $96,724 | $88,092 |
| Paid-in Capital | $240,000 | $240,000 | $240,000 |
| Retained Earnings | ($249,600) | ($208,531) | ($166,006) |
| Earnings | $41,069 | $42,525 | $97,545 |
| Total Capital | $31,469 | $73,994 | $171,539 |
| Total Liabilities and Capital | $152,472 | $170,718 | $259,631 |
| Net Worth | $31,469 | $73,994 | $171,539 |
7.5 Business Ratios
Business ratios for the years of this plan are shown below. Industry profile ratios based on the Standard Industrial Classification (SIC) code 7389, Business Services, are shown for comparison.
| Ratio Analysis | ||||
| Year 1 | Year 2 | Year 3 | Industry Profile | |
| Sales Growth | 0.00% | 1.77% | 26.09% | 8.20% |
| Percent of Total Assets | ||||
| Accounts Receivable | 63.37% | 57.60% | 47.76% | 26.30% |
| Other Current Assets | 0.00% | 0.00% | 0.00% | 44.20% |
| Total Current Assets | 100.00% | 100.00% | 100.00% | 74.30% |
| Long-term Assets | 0.00% | 0.00% | 0.00% | 25.70% |
| Total Assets | 100.00% | 100.00% | 100.00% | 100.00% |
| Current Liabilities | 21.65% | 12.14% | 9.28% | 49.00% |
| Long-term Liabilities | 57.72% | 44.52% | 24.65% | 13.80% |
| Total Liabilities | 79.36% | 56.66% | 33.93% | 62.80% |
| Net Worth | 20.64% | 43.34% | 66.07% | 37.20% |
| Percent of Sales | ||||
| Sales | 100.00% | 100.00% | 100.00% | 100.00% |
| Gross Margin | 92.35% | 90.00% | 90.00% | 0.00% |
| Selling, General & Administrative Expenses | 83.26% | 80.76% | 73.18% | 81.40% |
| Advertising Expenses | 2.65% | 3.26% | 3.10% | 1.70% |
| Profit Before Interest and Taxes | 15.05% | 14.99% | 25.23% | 2.10% |
| Main Ratios | ||||
| Current | 4.62 | 8.24 | 10.78 | 1.49 |
| Quick | 4.62 | 8.24 | 10.78 | 1.17 |
| Total Debt to Total Assets | 79.36% | 56.66% | 33.93% | 62.80% |
| Pre-tax Return on Net Worth | 186.44% | 82.10% | 81.24% | 4.20% |
| Pre-tax Return on Assets | 38.48% | 35.59% | 53.67% | 11.30% |
| Additional Ratios | Year 1 | Year 2 | Year 3 | |
| Net Profit Margin | 9.09% | 9.24% | 16.82% | n.a |
| Return on Equity | 130.51% | 57.47% | 56.86% | n.a |
| Activity Ratios | ||||
| Accounts Receivable Turnover | 3.51 | 3.51 | 3.51 | n.a |
| Collection Days | 56 | 103 | 93 | n.a |
| Accounts Payable Turnover | 6.34 | 12.17 | 12.17 | n.a |
| Payment Days | 30 | 47 | 26 | n.a |
| Total Asset Turnover | 2.96 | 2.69 | 2.23 | n.a |
| Debt Ratios | ||||
| Debt to Net Worth | 3.85 | 1.31 | 0.51 | n.a |
| Current Liab. to Liab. | 0.27 | 0.21 | 0.27 | n.a |
| Liquidity Ratios | ||||
| Net Working Capital | $119,469 | $149,994 | $235,539 | n.a |
| Interest Coverage | 7.27 | 8.41 | 20.91 | n.a |
| Additional Ratios | ||||
| Assets to Sales | 0.34 | 0.37 | 0.45 | n.a |
| Current Debt/Total Assets | 22% | 12% | 9% | n.a |
| Acid Test | 1.69 | 3.49 | 5.63 | n.a |
| Sales/Net Worth | 14.36 | 6.22 | 3.38 | n.a |
| Dividend Payout | 0.00 | 0.00 | 0.00 | n.a |
Appendix
| Sales Forecast | |||||||||||||
| Month 1 | Month 2 | Month 3 | Month 4 | Month 5 | Month 6 | Month 7 | Month 8 | Month 9 | Month 10 | Month 11 | Month 12 | ||
| Sales | |||||||||||||
| On-site Disposal | 0% | $0 | $6,000 | $8,000 | $10,000 | $14,000 | $19,000 | $20,000 | $23,000 | $26,000 | $29,000 | $32,000 | $33,000 |
| Off-site Disposal | 0% | $0 | $5,000 | $6,000 | $10,000 | $17,000 | $21,000 | $23,000 | $25,000 | $28,000 | $31,000 | $33,000 | $33,000 |
| Other | 0% | $0 | $0 | $0 | $0 | $0 | $0 | $0 | $0 | $0 | $0 | $0 | $0 |
| Total Sales | $0 | $11,000 | $14,000 | $20,000 | $31,000 | $40,000 | $43,000 | $48,000 | $54,000 | $60,000 | $65,000 | $66,000 | |
| Direct Cost of Sales | Month 1 | Month 2 | Month 3 | Month 4 | Month 5 | Month 6 | Month 7 | Month 8 | Month 9 | Month 10 | Month 11 | Month 12 | |
| On-site Disposal | $0 | $400 | $500 | $600 | $1,000 | $1,500 | $1,600 | $1,600 | $2,000 | $2,400 | $2,600 | $3,000 | |
| Off-site Disposal | $0 | $300 | $400 | $600 | $1,300 | $1,600 | $1,600 | $1,600 | $2,200 | $2,400 | $2,600 | $2,800 | |
| Other | $0 | $0 | $0 | $0 | $0 | $0 | $0 | $0 | $0 | $0 | $0 | $0 | |
| Subtotal Direct Cost of Sales | $0 | $700 | $900 | $1,200 | $2,300 | $3,100 | $3,200 | $3,200 | $4,200 | $4,800 | $5,200 | $5,800 | |
| Personnel Plan | |||||||||||||
| Month 1 | Month 2 | Month 3 | Month 4 | Month 5 | Month 6 | Month 7 | Month 8 | Month 9 | Month 10 | Month 11 | Month 12 | ||
| Janet Wilson | 0% | $3,000 | $3,000 | $3,000 | $3,000 | $3,000 | $3,000 | $3,000 | $3,000 | $3,000 | $3,000 | $3,000 | $3,000 |
| Off-site Facility Manager | 0% | $2,500 | $2,500 | $2,500 | $2,500 | $2,500 | $2,500 | $2,500 | $2,500 | $2,500 | $2,500 | $2,500 | $2,500 |
| Off-site Facility Staff | 0% | $6,500 | $6,500 | $6,500 | $6,500 | $6,500 | $6,500 | $6,500 | $6,500 | $6,500 | $6,500 | $6,500 | $6,500 |
| On-site Staff/Drivers | 0% | $6,500 | $6,500 | $6,500 | $6,500 | $6,500 | $6,500 | $6,500 | $6,500 | $6,500 | $6,500 | $6,500 | $6,500 |
| Customer Service Staff | 0% | $1,600 | $1,600 | $1,600 | $1,600 | $1,600 | $1,600 | $1,600 | $1,600 | $1,600 | $1,600 | $1,600 | $1,600 |
| Sales Staff | 0% | $2,000 | $2,000 | $2,000 | $2,000 | $2,000 | $2,000 | $2,000 | $2,000 | $2,000 | $2,000 | $2,000 | $2,000 |
| Other | 0% | $0 | $0 | $0 | $0 | $0 | $0 | $0 | $0 | $0 | $0 | $0 | $0 |
| Total People | 12 | 12 | 12 | 12 | 12 | 12 | 12 | 12 | 12 | 12 | 12 | 12 | |
| Total Payroll | $22,100 | $22,100 | $22,100 | $22,100 | $22,100 | $22,100 | $22,100 | $22,100 | $22,100 | $22,100 | $22,100 | $22,100 | |
| General Assumptions | |||||||||||||
| Month 1 | Month 2 | Month 3 | Month 4 | Month 5 | Month 6 | Month 7 | Month 8 | Month 9 | Month 10 | Month 11 | Month 12 | ||
| Plan Month | 1 | 2 | 3 | 4 | 5 | 6 | 7 | 8 | 9 | 10 | 11 | 12 | |
| Current Interest Rate | 10.00% | 10.00% | 10.00% | 10.00% | 10.00% | 10.00% | 10.00% | 10.00% | 10.00% | 10.00% | 10.00% | 10.00% | |
| Long-term Interest Rate | 10.00% | 10.00% | 10.00% | 10.00% | 10.00% | 10.00% | 10.00% | 10.00% | 10.00% | 10.00% | 10.00% | 10.00% | |
| Tax Rate | 30.00% | 30.00% | 30.00% | 30.00% | 30.00% | 30.00% | 30.00% | 30.00% | 30.00% | 30.00% | 30.00% | 30.00% | |
| Other | 0 | 0 | 0 | 0 | 0 | 0 | 0 | 0 | 0 | 0 | 0 | 0 | |
| Pro Forma Profit and Loss | |||||||||||||
| Month 1 | Month 2 | Month 3 | Month 4 | Month 5 | Month 6 | Month 7 | Month 8 | Month 9 | Month 10 | Month 11 | Month 12 | ||
| Sales | $0 | $11,000 | $14,000 | $20,000 | $31,000 | $40,000 | $43,000 | $48,000 | $54,000 | $60,000 | $65,000 | $66,000 | |
| Direct Cost of Sales | $0 | $700 | $900 | $1,200 | $2,300 | $3,100 | $3,200 | $3,200 | $4,200 | $4,800 | $5,200 | $5,800 | |
| Other Production Expenses | $0 | $0 | $0 | $0 | $0 | $0 | $0 | $0 | $0 | $0 | $0 | $0 | |
| Total Cost of Sales | $0 | $700 | $900 | $1,200 | $2,300 | $3,100 | $3,200 | $3,200 | $4,200 | $4,800 | $5,200 | $5,800 | |
| Gross Margin | $0 | $10,300 | $13,100 | $18,800 | $28,700 | $36,900 | $39,800 | $44,800 | $49,800 | $55,200 | $59,800 | $60,200 | |
| Gross Margin % | 0.00% | 93.64% | 93.57% | 94.00% | 92.58% | 92.25% | 92.56% | 93.33% | 92.22% | 92.00% | 92.00% | 91.21% | |
| Expenses | |||||||||||||
| Payroll | $22,100 | $22,100 | $22,100 | $22,100 | $22,100 | $22,100 | $22,100 | $22,100 | $22,100 | $22,100 | $22,100 | $22,100 | |
| Sales and Marketing and Other Expenses | $1,000 | $1,000 | $1,000 | $1,000 | $1,000 | $1,000 | $1,000 | $1,000 | $1,000 | $1,000 | $1,000 | $1,000 | |
| Depreciation | $0 | $0 | $0 | $0 | $0 | $0 | $0 | $0 | $0 | $0 | $0 | $0 | |
| Leased Equipment | $0 | $0 | $0 | $0 | $0 | $0 | $0 | $0 | $0 | $0 | $0 | $0 | |
| Utilities | $400 | $400 | $400 | $400 | $400 | $400 | $400 | $400 | $400 | $400 | $400 | $400 | |
| Insurance | $300 | $300 | $300 | $300 | $300 | $300 | $300 | $300 | $300 | $300 | $300 | $300 | |
| Rent | $2,000 | $2,000 | $2,000 | $2,000 | $2,000 | $2,000 | $2,000 | $2,000 | $2,000 | $2,000 | $2,000 | $2,000 | |
| Payroll Taxes | 15% | $3,315 | $3,315 | $3,315 | $3,315 | $3,315 | $3,315 | $3,315 | $3,315 | $3,315 | $3,315 | $3,315 | $3,315 |
| Other | $0 | $0 | $0 | $0 | $0 | $0 | $0 | $0 | $0 | $0 | $0 | $0 | |
| Total Operating Expenses | $29,115 | $29,115 | $29,115 | $29,115 | $29,115 | $29,115 | $29,115 | $29,115 | $29,115 | $29,115 | $29,115 | $29,115 | |
| Profit Before Interest and Taxes | ($29,115) | ($18,815) | ($16,015) | ($10,315) | ($415) | $7,785 | $10,685 | $15,685 | $20,685 | $26,085 | $30,685 | $31,085 | |
| EBITDA | ($29,115) | ($18,815) | ($16,015) | ($10,315) | ($415) | $7,785 | $10,685 | $15,685 | $20,685 | $26,085 | $30,685 | $31,085 | |
| Interest Expense | $825 | $817 | $808 | $800 | $792 | $783 | $775 | $767 | $758 | $750 | $742 | $733 | |
| Taxes Incurred | ($8,982) | ($5,890) | ($5,047) | ($3,335) | ($362) | $2,101 | $2,973 | $4,476 | $5,978 | $7,601 | $8,983 | $9,106 | |
| Net Profit | ($20,958) | ($13,742) | ($11,776) | ($7,781) | ($845) | $4,901 | $6,937 | $10,443 | $13,949 | $17,735 | $20,960 | $21,246 | |
| Net Profit/Sales | 0.00% | -124.93% | -84.12% | -38.90% | -2.72% | 12.25% | 16.13% | 21.76% | 25.83% | 29.56% | 32.25% | 32.19% | |
| Pro Forma Cash Flow | |||||||||||||
| Month 1 | Month 2 | Month 3 | Month 4 | Month 5 | Month 6 | Month 7 | Month 8 | Month 9 | Month 10 | Month 11 | Month 12 | ||
| Cash Received | |||||||||||||
| Cash from Operations | |||||||||||||
| Cash Sales | $0 | $2,750 | $3,500 | $5,000 | $7,750 | $10,000 | $10,750 | $12,000 | $13,500 | $15,000 | $16,250 | $16,500 | |
| Cash from Receivables | $0 | $0 | $275 | $8,325 | $10,650 | $15,275 | $23,475 | $30,075 | $32,375 | $36,150 | $40,650 | $45,125 | |
| Subtotal Cash from Operations | $0 | $2,750 | $3,775 | $13,325 | $18,400 | $25,275 | $34,225 | $42,075 | $45,875 | $51,150 | $56,900 | $61,625 | |
| Additional Cash Received | |||||||||||||
| Sales Tax, VAT, HST/GST Received | 0.00% | $0 | $0 | $0 | $0 | $0 | $0 | $0 | $0 | $0 | $0 | $0 | $0 |
| New Current Borrowing | $0 | $0 | $0 | $0 | $0 | $0 | $0 | $0 | $0 | $0 | $0 | $0 | |
| New Other Liabilities (interest-free) | $0 | $0 | $0 | $2,000 | $2,000 | $2,000 | $2,000 | $2,000 | $0 | $0 | $0 | $0 | |
| New Long-term Liabilities | $0 | $0 | $0 | $0 | $0 | $0 | $0 | $0 | $0 | $0 | $0 | $0 | |
| Sales of Other Current Assets | $0 | $0 | $0 | $0 | $0 | $0 | $0 | $0 | $0 | $0 | $0 | $0 | |
| Sales of Long-term Assets | $0 | $0 | $0 | $0 | $0 | $0 | $0 | $0 | $0 | $0 | $0 | $0 | |
| New Investment Received | $0 | $0 | $0 | $0 | $10,000 | $0 | $0 | $0 | $0 | $0 | $0 | $0 | |
| Subtotal Cash Received | $0 | $2,750 | $3,775 | $15,325 | $30,400 | $27,275 | $36,225 | $44,075 | $45,875 | $51,150 | $56,900 | $61,625 | |
| Expenditures | Month 1 | Month 2 | Month 3 | Month 4 | Month 5 | Month 6 | Month 7 | Month 8 | Month 9 | Month 10 | Month 11 | Month 12 | |
| Expenditures from Operations | |||||||||||||
| Cash Spending | $22,100 | $22,100 | $22,100 | $22,100 | $22,100 | $22,100 | $22,100 | $22,100 | $22,100 | $22,100 | $22,100 | $22,100 | |
| Bill Payments | ($1,142) | ($1,016) | $2,677 | $3,743 | $5,816 | $9,853 | $13,031 | $14,013 | $15,540 | $18,025 | $20,225 | $21,963 | |
| Subtotal Spent on Operations | $20,958 | $21,084 | $24,777 | $25,843 | $27,916 | $31,953 | $35,131 | $36,113 | $37,640 | $40,125 | $42,325 | $44,063 | |
| Additional Cash Spent | |||||||||||||
| Sales Tax, VAT, HST/GST Paid Out | $0 | $0 | $0 | $0 | $0 | $0 | $0 | $0 | $0 | $0 | $0 | $0 | |
| Principal Repayment of Current Borrowing | $0 | $0 | $0 | $0 | $0 | $0 | $0 | $0 | $0 | $0 | $0 | $0 | |
| Other Liabilities Principal Repayment | $0 | $0 | $0 | $0 | $0 | $0 | $0 | $0 | $0 | $0 | $0 | $0 | |
| Long-term Liabilities Principal Repayment | $1,000 | $1,000 | $1,000 | $1,000 | $1,000 | $1,000 | $1,000 | $1,000 | $1,000 | $1,000 | $1,000 | $1,000 | |
| Purchase Other Current Assets | $0 | $0 | $0 | $0 | $0 | $0 | $0 | $0 | $0 | $0 | $0 | $0 | |
| Purchase Long-term Assets | $0 | $0 | $0 | $0 | $0 | $0 | $0 | $0 | $0 | $0 | $0 | $0 | |
| Dividends | $0 | $0 | $0 | $0 | $0 | $0 | $0 | $0 | $0 | $0 | $0 | $0 | |
| Subtotal Cash Spent | $21,958 | $22,084 | $25,777 | $26,843 | $28,916 | $32,953 | $36,131 | $37,113 | $38,640 | $41,125 | $43,325 | $45,063 | |
| Net Cash Flow | ($21,958) | ($19,334) | ($22,002) | ($11,518) | $1,484 | ($5,678) | $94 | $6,962 | $7,235 | $10,025 | $13,575 | $16,562 | |
| Cash Balance | $58,442 | $39,108 | $17,106 | $5,588 | $7,072 | $1,394 | $1,488 | $8,450 | $15,685 | $25,710 | $39,285 | $55,847 | |
| Pro Forma Balance Sheet | |||||||||||||
| Month 1 | Month 2 | Month 3 | Month 4 | Month 5 | Month 6 | Month 7 | Month 8 | Month 9 | Month 10 | Month 11 | Month 12 | ||
| Assets | Starting Balances | ||||||||||||
| Current Assets | |||||||||||||
| Cash | $80,400 | $58,442 | $39,108 | $17,106 | $5,588 | $7,072 | $1,394 | $1,488 | $8,450 | $15,685 | $25,710 | $39,285 | $55,847 |
| Accounts Receivable | $0 | $0 | $8,250 | $18,475 | $25,150 | $37,750 | $52,475 | $61,250 | $67,175 | $75,300 | $84,150 | $92,250 | $96,625 |
| Other Current Assets | $0 | $0 | $0 | $0 | $0 | $0 | $0 | $0 | $0 | $0 | $0 | $0 | $0 |
| Total Current Assets | $80,400 | $58,442 | $47,358 | $35,581 | $30,738 | $44,822 | $53,869 | $62,738 | $75,625 | $90,985 | $109,860 | $131,535 | $152,472 |
| Long-term Assets | |||||||||||||
| Long-term Assets | $0 | $0 | $0 | $0 | $0 | $0 | $0 | $0 | $0 | $0 | $0 | $0 | $0 |
| Accumulated Depreciation | $0 | $0 | $0 | $0 | $0 | $0 | $0 | $0 | $0 | $0 | $0 | $0 | $0 |
| Total Long-term Assets | $0 | $0 | $0 | $0 | $0 | $0 | $0 | $0 | $0 | $0 | $0 | $0 | $0 |
| Total Assets | $80,400 | $58,442 | $47,358 | $35,581 | $30,738 | $44,822 | $53,869 | $62,738 | $75,625 | $90,985 | $109,860 | $131,535 | $152,472 |
| Liabilities and Capital | Month 1 | Month 2 | Month 3 | Month 4 | Month 5 | Month 6 | Month 7 | Month 8 | Month 9 | Month 10 | Month 11 | Month 12 | |
| Current Liabilities | |||||||||||||
| Accounts Payable | $0 | $0 | $3,658 | $4,658 | $6,595 | $10,524 | $13,669 | $14,602 | $16,046 | $18,457 | $20,597 | $22,312 | $23,003 |
| Current Borrowing | $0 | $0 | $0 | $0 | $0 | $0 | $0 | $0 | $0 | $0 | $0 | $0 | $0 |
| Other Current Liabilities | $0 | $0 | $0 | $0 | $2,000 | $4,000 | $6,000 | $8,000 | $10,000 | $10,000 | $10,000 | $10,000 | $10,000 |
| Subtotal Current Liabilities | $0 | $0 | $3,658 | $4,658 | $8,595 | $14,524 | $19,669 | $22,602 | $26,046 | $28,457 | $30,597 | $32,312 | $33,003 |
| Long-term Liabilities | $100,000 | $99,000 | $98,000 | $97,000 | $96,000 | $95,000 | $94,000 | $93,000 | $92,000 | $91,000 | $90,000 | $89,000 | $88,000 |
| Total Liabilities | $100,000 | $99,000 | $101,658 | $101,658 | $104,595 | $109,524 | $113,669 | $115,602 | $118,046 | $119,457 | $120,597 | $121,312 | $121,003 |
| Paid-in Capital | $230,000 | $230,000 | $230,000 | $230,000 | $230,000 | $240,000 | $240,000 | $240,000 | $240,000 | $240,000 | $240,000 | $240,000 | $240,000 |
| Retained Earnings | ($249,600) | ($249,600) | ($249,600) | ($249,600) | ($249,600) | ($249,600) | ($249,600) | ($249,600) | ($249,600) | ($249,600) | ($249,600) | ($249,600) | ($249,600) |
| Earnings | $0 | ($20,958) | ($34,700) | ($46,477) | ($54,257) | ($55,102) | ($50,201) | ($43,264) | ($32,821) | ($18,872) | ($1,137) | $19,823 | $41,069 |
| Total Capital | ($19,600) | ($40,558) | ($54,300) | ($66,077) | ($73,857) | ($64,702) | ($59,801) | ($52,864) | ($42,421) | ($28,472) | ($10,737) | $10,223 | $31,469 |
| Total Liabilities and Capital | $80,400 | $58,442 | $47,358 | $35,581 | $30,738 | $44,822 | $53,869 | $62,738 | $75,625 | $90,985 | $109,860 | $131,535 | $152,472 |
| Net Worth | ($19,600) | ($40,558) | ($54,300) | ($66,077) | ($73,857) | ($64,702) | ($59,801) | ($52,864) | ($42,421) | ($28,472) | ($10,738) | $10,223 | $31,469 |


