
The Shipping Centre
Executive Summary
The Shipping Centre is a full service shipping, fax transmittal, and private Mail Box company. It is an Oregon corporation, privately held and lead by Steve Freighter. The current package shipping center business has a lot of competition. The competition acts like their services are a commodity, just simple shipping services.
The Shipping Centre will gain market share through the use of their two competitive advantages, customer service and convenience. Because the industry is turning commodity-like, having superior customer service is one important way of achieving differentiation. The other advantage is convenience. The Shipping Centre is open beyond the standard business hours, offering a true convenience to full-time working customers, the type of customer that is typical for The Shipping Centre.
The Shipping Centre is able to have slightly lower service charges on shipping packages and better margins then the competition through the use of innovative software that creates significant efficiencies in work flow. This innovative work flow efficiency, coupled with the competitive advantages will allow The Shipping Centre to gain market share.
The Shipping Centre is scheduled to reach profitability by month 12 and by year three will have earned a modest profit that year.

1.1 Objectives
The objectives for the first three years of operation include:
- To create a service-based company whose primary goal is to exceed customers’ expectations.
- To increase the number of transactions served by 20% per year through superior performance.
- To develop a sustainable service-based company, surviving off its own cash flow.
1.2 Mission
The Shipping Centre’s mission is to provide the customer with whatever type of shipping needs they may have. We exist to attract and maintain customers. When we adhere to this maxim, everything else will fall into place. Our services will exceed the expectations of our customers.
Company Summary
The Shipping Centre, soon to be located in Salem, OR will be a full service shipping agency. Services will include USPS and UPS shipping, packaging of items, international shipments, and private Mail Boxes.
2.1 Company Ownership
The Shipping Centre is an Oregon Corporation, founded and owned by Steve Freighter.
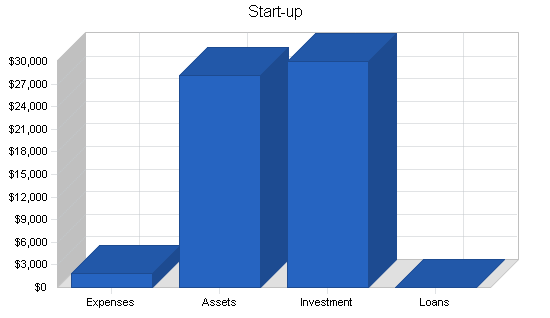
2.2 Start-up Summary
The Shipping Centre start-up costs include:
- Legal fees–for the formation of the corporation and general business issues.
- Office equipment–includes tables, desks, file cabinets, tape dispensers, rulers, scissors, etc.
- Two computer systems with DSL, and CD-RW.
- Special software for work flow efficiencies.
- Advertising in the local newspaper.
- Signs for the front of the store.
- Scale.
- Mail Box set-up.
The items that will be considered long-term assets (for depreciation purposes) are:
- Office equipment.
- Computers.
- Software.
- Signs.
- Scale.
- Mail Box set-up.
| Start-up | |
| Requirements | |
| Start-up Expenses | |
| Legal | $1,000 |
| Stationery etc. | $300 |
| Advertisements | $500 |
| Expensed Equipment | $0 |
| Other | $0 |
| Total Start-up Expenses | $1,800 |
| Start-up Assets | |
| Cash Required | $14,000 |
| Other Current Assets | $0 |
| Long-term Assets | $14,200 |
| Total Assets | $28,200 |
| Total Requirements | $30,000 |
| Start-up Funding | |
| Start-up Expenses to Fund | $1,800 |
| Start-up Assets to Fund | $28,200 |
| Total Funding Required | $30,000 |
| Assets | |
| Non-cash Assets from Start-up | $14,200 |
| Cash Requirements from Start-up | $14,000 |
| Additional Cash Raised | $0 |
| Cash Balance on Starting Date | $14,000 |
| Total Assets | $28,200 |
| Liabilities and Capital | |
| Liabilities | |
| Current Borrowing | $0 |
| Long-term Liabilities | $0 |
| Accounts Payable (Outstanding Bills) | $0 |
| Other Current Liabilities (interest-free) | $0 |
| Total Liabilities | $0 |
| Capital | |
| Planned Investment | |
| Investor 1 | $30,000 |
| Other | $0 |
| Additional Investment Requirement | $0 |
| Total Planned Investment | $30,000 |
| Loss at Start-up (Start-up Expenses) | ($1,800) |
| Total Capital | $28,200 |
| Total Capital and Liabilities | $28,200 |
| Total Funding | $30,000 |
Services
The Shipping Centre will provide full service shipping type services. Our main services will be:
- UPS and USPS shipping, including international shipping.
- Packaging of items, including weird shapes and fragile items.
- Private Mail Boxes.
- Fax service.
Market Analysis Summary
The Shipping Centre has three main customer groups: shipping customers, Mail Box customers, and fax customers.
4.1 Market Segmentation
The Shipping Centre’s customers can be broken down into three main groups:
- Shipping customers. The shipping customers can be further broken down into customers who have packages ready for shipment, and those that require a packaging service. The typical customer that needs a package shipped is someone who does not have access to ship packages at work and the Post Office is not convenient, or they need to ship via UPS. The other subgroup requires items to be packaged for them. The items are typically unusually sized, or may be quite fragile and they want an expert to package it to absolve them from liability.
- Mail Box customers. These customers are in need of a private Mail Box for a multitude of reasons including: convenience of location, cost, hours of operation, legality issues, etc.
- Fax customers. These customers are in need of a fax transmittal service, either to send or receive a fax and do not otherwise have access to a fax machine.

| Market Analysis | |||||||
| Year 1 | Year 2 | Year 3 | Year 4 | Year 5 | |||
| Potential Customers | Growth | CAGR | |||||
| Shipping Customers | 9% | 27,000 | 29,430 | 32,079 | 34,966 | 38,113 | 9.00% |
| P.O. Box Customers | 3% | 2,547 | 2,623 | 2,702 | 2,783 | 2,866 | 2.99% |
| Fax Customers | 6% | 8,574 | 9,088 | 9,633 | 10,211 | 10,824 | 6.00% |
| Total | 7.97% | 38,121 | 41,141 | 44,414 | 47,960 | 51,803 | 7.97% |
4.2 Target Market Segment Strategy
The Shipping Centre is targeting these customers because they represent a growing portion of the population.
- Shipping customers. This segment of the population has grown steadily in the last few years in large part due to the Internet. When a customer purchases a product over the Internet and they need to return it for whatever reason, the easiest solution is to drop it off at a store like The Shipping Centre. Another growing segment of these customers is eBay sellers who are shipping out the goods that they are selling. Shipping customers are also mail-order customers who have an item to return back to the catalog company. Lastly, there are people sending packages to whomever. They are typically enticed by a shipping option that is fast and convenient, two things that do not describe the Post Office or a regional UPS shipping center as. Additionally, there are the customers who are in need of packaging for an item. Americans are working increasingly longer hours, and people do not have the time to package things up, this is especially true for weird shaped items or fragile merchandise. To do it right, these things take time–and time is a luxury that people are increasingly unwilling to devote toward packaging, they would rather pay someone to do this.
- Mail Box customers. This is a segment of customers that is not increasing in significant amounts (although eBay transactions have boosted use in this area), but there are customers that require Mail Boxes and it does not take up much space to offer the service.
- Fax customers. This segment has a steady demand for fax transmittal services. Although many thought the use of email would reduce the number of transmittals done via the fax, oddly, this has not happened yet.
4.3 Service Business Analysis
Currently there are several different companies that offer a similar service offering to The Shipping Centre. They are typically located in high traffic areas. They provide Mail Box service as well as fax and shipping. These different companies offer a commodity-like service. People tend to make choices based on convenience. Market research indicates that consumers perceive little difference between competitors, and there is little loyalty that customers display toward a specific store other than convenience.
Strategy and Implementation Summary
The Shipping Centre will be located in a high traffic strip mall. While the rent for this location will be high, the high traffic area will bring in sufficient business. In addition to being quite visible in the city, The Shipping Centre will be advertising in assorted local newspapers and flyers to raise awareness about the company. These efforts will generate interest for the company. The Shipping Centre will turn the interest into sales through the use of good pricing, superior customer service and convenience in the form of extra long business hours that is not currently offered by the competition.

5.1 Competitive Edge
The Shipping Centre’s competitive edge will be based on two factors, customer service and convenience.
- Customer Service. The Shipping Centre will offer exemplary customer service that will stand out in the otherwise commodity like delivery of services in this business space. The competitors customer service is acceptable, they are generally helpful and nice, but you do not leave the store with an overwhelming feeling that you as the customer, were worshipped. This will change with The Shipping Centre’s customer service. After visiting The Shipping Centre you will leave with an overwhelming feeling of how superior customer service treatment was. When you leave The Shipping Centre with that feeling, that will stick in your head and will be effective in differentiating The Shipping Centre from its competitors.
- Convenience. Most of the competition has normal business hours. While this works for some people, our market research indicates that people are using these services because they work during the day and they are in need of a quick and easy solution. By offering extended business hours, The Shipping Centre becomes immediately more convenient, by allowing working individuals to service their shipping etc. needs after work hours.
5.2 Sales Strategy
The Shipping Centre’s sales strategy will be based on work flow efficiencies and superior customer service.
- Work flow efficiencies. Typically when competitors send a package using either UPS or USPS, they enter the information into software from the specific shipping vendor (i.e. UPS). Once the information is entered into the UPS software, the software generates the shipping tag and corresponding price. The customer pays the amount and leaves. Now the employee must enter all this information into their computer software to track the transaction. Handling the transaction twice is inefficient. The Shipping Centre can offer slighty better prices and margins by making this process more efficient. This will be done with special software that takes the information from the UPS and USPS software and automatically transfers it into the back-end software that The Shipping Centre uses. This will cut time spent on tracking transactions in half and improve accuracy as the number of times the information is entered increases, there is an increase in the likelihood of errors.
- Superior customer service. This will help boost sales as people become accustomed to The Shipping Centre’s level of service and become a return customer, developing a long-term mutually beneficial relationship. Typically people that send packages do so with some frequency. If they buy things over the Internet or by phone, they do not do so on isolated occasion, they do so with some regularity. With this in mind, The Shipping Centre’s customer service will turn them into regular customers.
5.2.1 Sales Forecast
The first month will be spent setting up the business. There will not be any sales activity during this time period. By the second month the store will be open to customers and they will begin to trickle in. It will not be until months four and five that there becomes a steady stream of customers.
For the shipping and fax service The Shipping Centre expects a steady increase in business. For the Mail Boxes, there will be a steady increase until the boxes are near full utilization and then there will be a plateau of sales activity from the boxes.


| Sales Forecast | |||
| Year 1 | Year 2 | Year 3 | |
| Sales | |||
| Shipping Customers | $195,425 | $365,412 | $389,850 |
| P.O. Box Customers | $24,432 | $26,000 | $26,987 |
| Fax Customers | $19,997 | $33,058 | $41,254 |
| Total Sales | $239,854 | $424,470 | $458,091 |
| Direct Cost of Sales | Year 1 | Year 2 | Year 3 |
| Shipping Customers | $87,941 | $164,435 | $175,433 |
| P.O. Box Customers | $2,443 | $2,600 | $2,699 |
| Fax Customers | $10,998 | $18,182 | $22,690 |
| Subtotal Direct Cost of Sales | $101,383 | $185,217 | $200,821 |
5.3 Milestones
The Shipping Centre will have several milestones early on.
- Business plan completion.
- Completion of the storefront/back office.
- Completion of software.
- Revenues growing steadily, yearly.
| Milestones | |||||
| Milestone | Start Date | End Date | Budget | Manager | Department |
| Business Plan Completion | 1/1/2001 | 1/1/2001 | $0 | Steve | Marketing |
| Completion of Storefront/Backoffice | 1/1/2001 | 2/1/2001 | $0 | Steve | Department |
| Completion of Software | 1/1/2001 | 2/15/2001 | $10,000 | Steve | Department |
| Totals | $10,000 | ||||
Management Summary
Steve Freighter is the founder and owner of The Shipping Centre, an Oregon Corporation. Steve is forming The Shipping Centre as a corporation to eliminate any personal liability issues. Steve has a degree in political science from Oregon State University. While at OSU, Steve worked part time at UPS as a driver. This part-time job gave Steve valuable insight into the shipping business.
While at OSU, Steve took a business consulting course and Steve’s semester project was to do a full business consultation for a company of his choice. Recognizing that he would like to have his own company some day, he studied a company called Mailboxes Etc. From this project, Steve got valuable insight into the business.
The main conclusion that Steve presented to the company was that the services provided were too commodity like and the business space was quite competitive. He suggested some sort of meaningful differentiation. The company ultimately did not heed Steve’s advice, partly because of ties with the corporate parent, partly because of cost issues, their margins were not enough to be able to institute the changes Steve suggested. Steve has walked away from this project with the insight and industry knowledge needed to allow his store to succeed.
These experiences as a whole, provide Steve with a wealth of practical and analytical knowledge needed to nurture The Shipping Centre into a profit making venture.
6.1 Personnel Plan
The staff will consist of Steve working full time for The Shipping Centre. In addition, by month two Steve will be bringing on a part-time employee. That employee will be turned into full time by month three and Steve will bring on board a second full-time employee by the fourth month. By month seven Steve will bring on board a third part-time employee.
| Personnel Plan | |||
| Year 1 | Year 2 | Year 3 | |
| Steve | $30,000 | $30,000 | $30,000 |
| Employee 1 | $15,120 | $19,200 | $20,500 |
| Employee 2 | $12,960 | $19,200 | $20,500 |
| Employee 3 | $8,640 | $9,000 | $9,700 |
| Total People | 4 | 4 | 4 |
| Total Payroll | $66,720 | $77,400 | $80,700 |
Financial Plan
The following sections will outline important financial information.
7.1 Important Assumptions
The following table highlights important assumptions.
| General Assumptions | |||
| Year 1 | Year 2 | Year 3 | |
| Plan Month | 1 | 2 | 3 |
| Current Interest Rate | 10.00% | 10.00% | 10.00% |
| Long-term Interest Rate | 10.00% | 10.00% | 10.00% |
| Tax Rate | 25.42% | 25.00% | 25.42% |
| Other | 0 | 0 | 0 |
7.2 Break-even Analysis
The Break-even Analysis indicates what The Shipping Centre must achieve in monthly sales to break even.

| Break-even Analysis | |
| Monthly Revenue Break-even | $16,314 |
| Assumptions: | |
| Average Percent Variable Cost | 42% |
| Estimated Monthly Fixed Cost | $9,418 |
7.3 Projected Profit and Loss
The following table will indicate projected profit and loss.


| Pro Forma Profit and Loss | |||
| Year 1 | Year 2 | Year 3 | |
| Sales | $239,854 | $424,470 | $458,091 |
| Direct Cost of Sales | $101,383 | $185,217 | $200,821 |
| Other | $0 | $0 | $0 |
| Total Cost of Sales | $101,383 | $185,217 | $200,821 |
| Gross Margin | $138,471 | $239,253 | $257,270 |
| Gross Margin % | 57.73% | 56.37% | 56.16% |
| Expenses | |||
| Payroll | $66,720 | $77,400 | $80,700 |
| Sales and Marketing and Other Expenses | $3,900 | $3,900 | $3,900 |
| Depreciation | $350 | $4,200 | $4,200 |
| Leased Equipment | $0 | $0 | $0 |
| Utilities | $1,500 | $1,500 | $1,500 |
| DSL | $540 | $540 | $540 |
| Rent | $30,000 | $30,000 | $30,000 |
| Payroll Taxes | $10,008 | $11,610 | $12,105 |
| Other | $0 | $0 | $0 |
| Total Operating Expenses | $113,018 | $129,150 | $132,945 |
| Profit Before Interest and Taxes | $25,453 | $110,103 | $124,325 |
| EBITDA | $25,803 | $114,303 | $128,525 |
| Interest Expense | $0 | $0 | $0 |
| Taxes Incurred | $6,052 | $27,526 | $31,599 |
| Net Profit | $19,401 | $82,577 | $92,726 |
| Net Profit/Sales | 8.09% | 19.45% | 20.24% |
7.4 Projected Cash Flow
The following chart and table will indicate projected cash flow.

| Pro Forma Cash Flow | |||
| Year 1 | Year 2 | Year 3 | |
| Cash Received | |||
| Cash from Operations | |||
| Cash Sales | $239,854 | $424,470 | $458,091 |
| Subtotal Cash from Operations | $239,854 | $424,470 | $458,091 |
| Additional Cash Received | |||
| Sales Tax, VAT, HST/GST Received | $0 | $0 | $0 |
| New Current Borrowing | $0 | $0 | $0 |
| New Other Liabilities (interest-free) | $0 | $0 | $0 |
| New Long-term Liabilities | $0 | $0 | $0 |
| Sales of Other Current Assets | $0 | $0 | $0 |
| Sales of Long-term Assets | $0 | $0 | $0 |
| New Investment Received | $0 | $0 | $0 |
| Subtotal Cash Received | $239,854 | $424,470 | $458,091 |
| Expenditures | Year 1 | Year 2 | Year 3 |
| Expenditures from Operations | |||
| Cash Spending | $66,720 | $77,400 | $80,700 |
| Bill Payments | $132,722 | $259,560 | $278,807 |
| Subtotal Spent on Operations | $199,442 | $336,960 | $359,507 |
| Additional Cash Spent | |||
| Sales Tax, VAT, HST/GST Paid Out | $0 | $0 | $0 |
| Principal Repayment of Current Borrowing | $0 | $0 | $0 |
| Other Liabilities Principal Repayment | $0 | $0 | $0 |
| Long-term Liabilities Principal Repayment | $0 | $0 | $0 |
| Purchase Other Current Assets | $0 | $0 | $0 |
| Purchase Long-term Assets | $0 | $0 | $0 |
| Dividends | $0 | $0 | $0 |
| Subtotal Cash Spent | $199,442 | $336,960 | $359,507 |
| Net Cash Flow | $40,412 | $87,510 | $98,584 |
| Cash Balance | $54,412 | $141,922 | $240,506 |
7.5 Projected Balance Sheet
The following table will indicate the projected balance sheet.
| Pro Forma Balance Sheet | |||
| Year 1 | Year 2 | Year 3 | |
| Assets | |||
| Current Assets | |||
| Cash | $54,412 | $141,922 | $240,506 |
| Other Current Assets | $0 | $0 | $0 |
| Total Current Assets | $54,412 | $141,922 | $240,506 |
| Long-term Assets | |||
| Long-term Assets | $14,200 | $14,200 | $14,200 |
| Accumulated Depreciation | $350 | $4,550 | $8,750 |
| Total Long-term Assets | $13,850 | $9,650 | $5,450 |
| Total Assets | $68,262 | $151,572 | $245,956 |
| Liabilities and Capital | Year 1 | Year 2 | Year 3 |
| Current Liabilities | |||
| Accounts Payable | $20,661 | $21,394 | $23,052 |
| Current Borrowing | $0 | $0 | $0 |
| Other Current Liabilities | $0 | $0 | $0 |
| Subtotal Current Liabilities | $20,661 | $21,394 | $23,052 |
| Long-term Liabilities | $0 | $0 | $0 |
| Total Liabilities | $20,661 | $21,394 | $23,052 |
| Paid-in Capital | $30,000 | $30,000 | $30,000 |
| Retained Earnings | ($1,800) | $17,601 | $100,178 |
| Earnings | $19,401 | $82,577 | $92,726 |
| Total Capital | $47,601 | $130,178 | $222,904 |
| Total Liabilities and Capital | $68,262 | $151,572 | $245,956 |
| Net Worth | $47,601 | $130,178 | $222,904 |
7.6 Business Ratios
The following table compares the standard business ratios for the Private Mail Centers industry, NAICS code 561431 against the ratios calculated for the financial forecasts of this plan.
| Ratio Analysis | ||||
| Year 1 | Year 2 | Year 3 | Industry Profile | |
| Sales Growth | 0.00% | 76.97% | 7.92% | 10.93% |
| Percent of Total Assets | ||||
| Other Current Assets | 0.00% | 0.00% | 0.00% | 46.15% |
| Total Current Assets | 79.71% | 93.63% | 97.78% | 76.67% |
| Long-term Assets | 20.29% | 6.37% | 2.22% | 23.33% |
| Total Assets | 100.00% | 100.00% | 100.00% | 100.00% |
| Current Liabilities | 30.27% | 14.11% | 9.37% | 40.41% |
| Long-term Liabilities | 0.00% | 0.00% | 0.00% | 17.31% |
| Total Liabilities | 30.27% | 14.11% | 9.37% | 57.72% |
| Net Worth | 69.73% | 85.89% | 90.63% | 42.28% |
| Percent of Sales | ||||
| Sales | 100.00% | 100.00% | 100.00% | 100.00% |
| Gross Margin | 57.73% | 56.37% | 56.16% | 100.00% |
| Selling, General & Administrative Expenses | 59.50% | 41.48% | 40.04% | 76.26% |
| Advertising Expenses | 0.50% | 0.28% | 0.26% | 2.58% |
| Profit Before Interest and Taxes | 10.61% | 25.94% | 27.14% | 1.39% |
| Main Ratios | ||||
| Current | 2.63 | 6.63 | 10.43 | 1.42 |
| Quick | 2.63 | 6.63 | 10.43 | 1.14 |
| Total Debt to Total Assets | 30.27% | 14.11% | 9.37% | 67.09% |
| Pre-tax Return on Net Worth | 53.47% | 84.58% | 55.78% | 3.47% |
| Pre-tax Return on Assets | 37.29% | 72.64% | 50.55% | 10.56% |
| Additional Ratios | Year 1 | Year 2 | Year 3 | |
| Net Profit Margin | 8.09% | 19.45% | 20.24% | n.a |
| Return on Equity | 40.76% | 63.43% | 41.60% | n.a |
| Activity Ratios | ||||
| Accounts Payable Turnover | 7.42 | 12.17 | 12.17 | n.a |
| Payment Days | 27 | 29 | 29 | n.a |
| Total Asset Turnover | 3.51 | 2.80 | 1.86 | n.a |
| Debt Ratios | ||||
| Debt to Net Worth | 0.43 | 0.16 | 0.10 | n.a |
| Current Liab. to Liab. | 1.00 | 1.00 | 1.00 | n.a |
| Liquidity Ratios | ||||
| Net Working Capital | $33,751 | $120,528 | $217,454 | n.a |
| Interest Coverage | 0.00 | 0.00 | 0.00 | n.a |
| Additional Ratios | ||||
| Assets to Sales | 0.28 | 0.36 | 0.54 | n.a |
| Current Debt/Total Assets | 30% | 14% | 9% | n.a |
| Acid Test | 2.63 | 6.63 | 10.43 | n.a |
| Sales/Net Worth | 5.04 | 3.26 | 2.06 | n.a |
| Dividend Payout | 0.00 | 0.00 | 0.00 | n.a |
Appendix
| Sales Forecast | |||||||||||||
| Month 1 | Month 2 | Month 3 | Month 4 | Month 5 | Month 6 | Month 7 | Month 8 | Month 9 | Month 10 | Month 11 | Month 12 | ||
| Sales | |||||||||||||
| Shipping Customers | 0% | $0 | $9,856 | $10,255 | $11,254 | $13,565 | $14,875 | $15,989 | $18,987 | $20,145 | $23,658 | $26,987 | $29,854 |
| P.O. Box Customers | 0% | $0 | $1,200 | $1,500 | $1,800 | $2,014 | $2,214 | $2,455 | $2,656 | $2,658 | $2,698 | $2,612 | $2,625 |
| Fax Customers | 0% | $0 | $800 | $1,101 | $1,300 | $1,454 | $1,547 | $1,989 | $2,212 | $2,312 | $2,356 | $2,401 | $2,525 |
| Total Sales | $0 | $11,856 | $12,856 | $14,354 | $17,033 | $18,636 | $20,433 | $23,855 | $25,115 | $28,712 | $32,000 | $35,004 | |
| Direct Cost of Sales | Month 1 | Month 2 | Month 3 | Month 4 | Month 5 | Month 6 | Month 7 | Month 8 | Month 9 | Month 10 | Month 11 | Month 12 | |
| Shipping Customers | $0 | $4,435 | $4,615 | $5,064 | $6,104 | $6,694 | $7,195 | $8,544 | $9,065 | $10,646 | $12,144 | $13,434 | |
| P.O. Box Customers | $0 | $120 | $150 | $180 | $201 | $221 | $246 | $266 | $266 | $270 | $261 | $263 | |
| Fax Customers | $0 | $440 | $606 | $715 | $800 | $851 | $1,094 | $1,217 | $1,272 | $1,296 | $1,321 | $1,389 | |
| Subtotal Direct Cost of Sales | $0 | $4,995 | $5,370 | $5,959 | $7,105 | $7,766 | $8,535 | $10,026 | $10,603 | $12,212 | $13,726 | $15,086 | |
| Personnel Plan | |||||||||||||
| Month 1 | Month 2 | Month 3 | Month 4 | Month 5 | Month 6 | Month 7 | Month 8 | Month 9 | Month 10 | Month 11 | Month 12 | ||
| Steve | 0% | $2,500 | $2,500 | $2,500 | $2,500 | $2,500 | $2,500 | $2,500 | $2,500 | $2,500 | $2,500 | $2,500 | $2,500 |
| Employee 1 | 0% | $0 | $720 | $1,440 | $1,440 | $1,440 | $1,440 | $1,440 | $1,440 | $1,440 | $1,440 | $1,440 | $1,440 |
| Employee 2 | 0% | $0 | $0 | $0 | $1,440 | $1,440 | $1,440 | $1,440 | $1,440 | $1,440 | $1,440 | $1,440 | $1,440 |
| Employee 3 | 0% | $0 | $0 | $0 | $0 | $0 | $0 | $1,440 | $1,440 | $1,440 | $1,440 | $1,440 | $1,440 |
| Total People | 1 | 2 | 2 | 3 | 3 | 3 | 4 | 4 | 4 | 4 | 4 | 4 | |
| Total Payroll | $2,500 | $3,220 | $3,940 | $5,380 | $5,380 | $5,380 | $6,820 | $6,820 | $6,820 | $6,820 | $6,820 | $6,820 | |
| General Assumptions | |||||||||||||
| Month 1 | Month 2 | Month 3 | Month 4 | Month 5 | Month 6 | Month 7 | Month 8 | Month 9 | Month 10 | Month 11 | Month 12 | ||
| Plan Month | 1 | 2 | 3 | 4 | 5 | 6 | 7 | 8 | 9 | 10 | 11 | 12 | |
| Current Interest Rate | 10.00% | 10.00% | 10.00% | 10.00% | 10.00% | 10.00% | 10.00% | 10.00% | 10.00% | 10.00% | 10.00% | 10.00% | |
| Long-term Interest Rate | 10.00% | 10.00% | 10.00% | 10.00% | 10.00% | 10.00% | 10.00% | 10.00% | 10.00% | 10.00% | 10.00% | 10.00% | |
| Tax Rate | 30.00% | 25.00% | 25.00% | 25.00% | 25.00% | 25.00% | 25.00% | 25.00% | 25.00% | 25.00% | 25.00% | 25.00% | |
| Other | 0 | 0 | 0 | 0 | 0 | 0 | 0 | 0 | 0 | 0 | 0 | 0 | |
| Pro Forma Profit and Loss | |||||||||||||
| Month 1 | Month 2 | Month 3 | Month 4 | Month 5 | Month 6 | Month 7 | Month 8 | Month 9 | Month 10 | Month 11 | Month 12 | ||
| Sales | $0 | $11,856 | $12,856 | $14,354 | $17,033 | $18,636 | $20,433 | $23,855 | $25,115 | $28,712 | $32,000 | $35,004 | |
| Direct Cost of Sales | $0 | $4,995 | $5,370 | $5,959 | $7,105 | $7,766 | $8,535 | $10,026 | $10,603 | $12,212 | $13,726 | $15,086 | |
| Other | $0 | $0 | $0 | $0 | $0 | $0 | $0 | $0 | $0 | $0 | $0 | $0 | |
| Total Cost of Sales | $0 | $4,995 | $5,370 | $5,959 | $7,105 | $7,766 | $8,535 | $10,026 | $10,603 | $12,212 | $13,726 | $15,086 | |
| Gross Margin | $0 | $6,861 | $7,486 | $8,395 | $9,928 | $10,870 | $11,899 | $13,829 | $14,512 | $16,500 | $18,274 | $19,918 | |
| Gross Margin % | 0.00% | 57.87% | 58.23% | 58.48% | 58.28% | 58.33% | 58.23% | 57.97% | 57.78% | 57.47% | 57.11% | 56.90% | |
| Expenses | |||||||||||||
| Payroll | $2,500 | $3,220 | $3,940 | $5,380 | $5,380 | $5,380 | $6,820 | $6,820 | $6,820 | $6,820 | $6,820 | $6,820 | |
| Sales and Marketing and Other Expenses | $325 | $325 | $325 | $325 | $325 | $325 | $325 | $325 | $325 | $325 | $325 | $325 | |
| Depreciation | $350 | $0 | $0 | $0 | $0 | $0 | $0 | $0 | $0 | $0 | $0 | $0 | |
| Leased Equipment | $0 | $0 | $0 | $0 | $0 | $0 | $0 | $0 | $0 | $0 | $0 | $0 | |
| Utilities | $125 | $125 | $125 | $125 | $125 | $125 | $125 | $125 | $125 | $125 | $125 | $125 | |
| DSL | $45 | $45 | $45 | $45 | $45 | $45 | $45 | $45 | $45 | $45 | $45 | $45 | |
| Rent | $2,500 | $2,500 | $2,500 | $2,500 | $2,500 | $2,500 | $2,500 | $2,500 | $2,500 | $2,500 | $2,500 | $2,500 | |
| Payroll Taxes | 15% | $375 | $483 | $591 | $807 | $807 | $807 | $1,023 | $1,023 | $1,023 | $1,023 | $1,023 | $1,023 |
| Other | $0 | $0 | $0 | $0 | $0 | $0 | $0 | $0 | $0 | $0 | $0 | $0 | |
| Total Operating Expenses | $6,220 | $6,698 | $7,526 | $9,182 | $9,182 | $9,182 | $10,838 | $10,838 | $10,838 | $10,838 | $10,838 | $10,838 | |
| Profit Before Interest and Taxes | ($6,220) | $163 | ($40) | ($787) | $746 | $1,688 | $1,061 | $2,991 | $3,674 | $5,662 | $7,436 | $9,080 | |
| EBITDA | ($5,870) | $163 | ($40) | ($787) | $746 | $1,688 | $1,061 | $2,991 | $3,674 | $5,662 | $7,436 | $9,080 | |
| Interest Expense | $0 | $0 | $0 | $0 | $0 | $0 | $0 | $0 | $0 | $0 | $0 | $0 | |
| Taxes Incurred | ($1,866) | $41 | ($10) | ($197) | $186 | $422 | $265 | $748 | $919 | $1,416 | $1,859 | $2,270 | |
| Net Profit | ($4,354) | $122 | ($30) | ($590) | $559 | $1,266 | $795 | $2,243 | $2,756 | $4,247 | $5,577 | $6,810 | |
| Net Profit/Sales | 0.00% | 1.03% | -0.24% | -4.11% | 3.28% | 6.79% | 3.89% | 9.40% | 10.97% | 14.79% | 17.43% | 19.46% | |
| Pro Forma Cash Flow | |||||||||||||
| Month 1 | Month 2 | Month 3 | Month 4 | Month 5 | Month 6 | Month 7 | Month 8 | Month 9 | Month 10 | Month 11 | Month 12 | ||
| Cash Received | |||||||||||||
| Cash from Operations | |||||||||||||
| Cash Sales | $0 | $11,856 | $12,856 | $14,354 | $17,033 | $18,636 | $20,433 | $23,855 | $25,115 | $28,712 | $32,000 | $35,004 | |
| Subtotal Cash from Operations | $0 | $11,856 | $12,856 | $14,354 | $17,033 | $18,636 | $20,433 | $23,855 | $25,115 | $28,712 | $32,000 | $35,004 | |
| Additional Cash Received | |||||||||||||
| Sales Tax, VAT, HST/GST Received | 0.00% | $0 | $0 | $0 | $0 | $0 | $0 | $0 | $0 | $0 | $0 | $0 | $0 |
| New Current Borrowing | $0 | $0 | $0 | $0 | $0 | $0 | $0 | $0 | $0 | $0 | $0 | $0 | |
| New Other Liabilities (interest-free) | $0 | $0 | $0 | $0 | $0 | $0 | $0 | $0 | $0 | $0 | $0 | $0 | |
| New Long-term Liabilities | $0 | $0 | $0 | $0 | $0 | $0 | $0 | $0 | $0 | $0 | $0 | $0 | |
| Sales of Other Current Assets | $0 | $0 | $0 | $0 | $0 | $0 | $0 | $0 | $0 | $0 | $0 | $0 | |
| Sales of Long-term Assets | $0 | $0 | $0 | $0 | $0 | $0 | $0 | $0 | $0 | $0 | $0 | $0 | |
| New Investment Received | $0 | $0 | $0 | $0 | $0 | $0 | $0 | $0 | $0 | $0 | $0 | $0 | |
| Subtotal Cash Received | $0 | $11,856 | $12,856 | $14,354 | $17,033 | $18,636 | $20,433 | $23,855 | $25,115 | $28,712 | $32,000 | $35,004 | |
| Expenditures | Month 1 | Month 2 | Month 3 | Month 4 | Month 5 | Month 6 | Month 7 | Month 8 | Month 9 | Month 10 | Month 11 | Month 12 | |
| Expenditures from Operations | |||||||||||||
| Cash Spending | $2,500 | $3,220 | $3,940 | $5,380 | $5,380 | $5,380 | $6,820 | $6,820 | $6,820 | $6,820 | $6,820 | $6,820 | |
| Bill Payments | $50 | $1,738 | $8,528 | $8,967 | $9,615 | $11,124 | $12,018 | $12,883 | $14,817 | $15,609 | $17,711 | $19,662 | |
| Subtotal Spent on Operations | $2,550 | $4,958 | $12,468 | $14,347 | $14,995 | $16,504 | $18,838 | $19,703 | $21,637 | $22,429 | $24,531 | $26,482 | |
| Additional Cash Spent | |||||||||||||
| Sales Tax, VAT, HST/GST Paid Out | $0 | $0 | $0 | $0 | $0 | $0 | $0 | $0 | $0 | $0 | $0 | $0 | |
| Principal Repayment of Current Borrowing | $0 | $0 | $0 | $0 | $0 | $0 | $0 | $0 | $0 | $0 | $0 | $0 | |
| Other Liabilities Principal Repayment | $0 | $0 | $0 | $0 | $0 | $0 | $0 | $0 | $0 | $0 | $0 | $0 | |
| Long-term Liabilities Principal Repayment | $0 | $0 | $0 | $0 | $0 | $0 | $0 | $0 | $0 | $0 | $0 | $0 | |
| Purchase Other Current Assets | $0 | $0 | $0 | $0 | $0 | $0 | $0 | $0 | $0 | $0 | $0 | $0 | |
| Purchase Long-term Assets | $0 | $0 | $0 | $0 | $0 | $0 | $0 | $0 | $0 | $0 | $0 | $0 | |
| Dividends | $0 | $0 | $0 | $0 | $0 | $0 | $0 | $0 | $0 | $0 | $0 | $0 | |
| Subtotal Cash Spent | $2,550 | $4,958 | $12,468 | $14,347 | $14,995 | $16,504 | $18,838 | $19,703 | $21,637 | $22,429 | $24,531 | $26,482 | |
| Net Cash Flow | ($2,550) | $6,898 | $388 | $7 | $2,038 | $2,132 | $1,595 | $4,152 | $3,478 | $6,283 | $7,469 | $8,522 | |
| Cash Balance | $11,450 | $18,348 | $18,736 | $18,743 | $20,781 | $22,913 | $24,508 | $28,660 | $32,138 | $38,421 | $45,890 | $54,412 | |
| Pro Forma Balance Sheet | |||||||||||||
| Month 1 | Month 2 | Month 3 | Month 4 | Month 5 | Month 6 | Month 7 | Month 8 | Month 9 | Month 10 | Month 11 | Month 12 | ||
| Assets | Starting Balances | ||||||||||||
| Current Assets | |||||||||||||
| Cash | $14,000 | $11,450 | $18,348 | $18,736 | $18,743 | $20,781 | $22,913 | $24,508 | $28,660 | $32,138 | $38,421 | $45,890 | $54,412 |
| Other Current Assets | $0 | $0 | $0 | $0 | $0 | $0 | $0 | $0 | $0 | $0 | $0 | $0 | $0 |
| Total Current Assets | $14,000 | $11,450 | $18,348 | $18,736 | $18,743 | $20,781 | $22,913 | $24,508 | $28,660 | $32,138 | $38,421 | $45,890 | $54,412 |
| Long-term Assets | |||||||||||||
| Long-term Assets | $14,200 | $14,200 | $14,200 | $14,200 | $14,200 | $14,200 | $14,200 | $14,200 | $14,200 | $14,200 | $14,200 | $14,200 | $14,200 |
| Accumulated Depreciation | $0 | $350 | $350 | $350 | $350 | $350 | $350 | $350 | $350 | $350 | $350 | $350 | $350 |
| Total Long-term Assets | $14,200 | $13,850 | $13,850 | $13,850 | $13,850 | $13,850 | $13,850 | $13,850 | $13,850 | $13,850 | $13,850 | $13,850 | $13,850 |
| Total Assets | $28,200 | $25,300 | $32,198 | $32,586 | $32,593 | $34,631 | $36,763 | $38,358 | $42,510 | $45,988 | $52,271 | $59,740 | $68,262 |
| Liabilities and Capital | Month 1 | Month 2 | Month 3 | Month 4 | Month 5 | Month 6 | Month 7 | Month 8 | Month 9 | Month 10 | Month 11 | Month 12 | |
| Current Liabilities | |||||||||||||
| Accounts Payable | $0 | $1,454 | $8,230 | $8,648 | $9,246 | $10,724 | $11,590 | $12,390 | $14,299 | $15,021 | $17,057 | $18,949 | $20,661 |
| Current Borrowing | $0 | $0 | $0 | $0 | $0 | $0 | $0 | $0 | $0 | $0 | $0 | $0 | $0 |
| Other Current Liabilities | $0 | $0 | $0 | $0 | $0 | $0 | $0 | $0 | $0 | $0 | $0 | $0 | $0 |
| Subtotal Current Liabilities | $0 | $1,454 | $8,230 | $8,648 | $9,246 | $10,724 | $11,590 | $12,390 | $14,299 | $15,021 | $17,057 | $18,949 | $20,661 |
| Long-term Liabilities | $0 | $0 | $0 | $0 | $0 | $0 | $0 | $0 | $0 | $0 | $0 | $0 | $0 |
| Total Liabilities | $0 | $1,454 | $8,230 | $8,648 | $9,246 | $10,724 | $11,590 | $12,390 | $14,299 | $15,021 | $17,057 | $18,949 | $20,661 |
| Paid-in Capital | $30,000 | $30,000 | $30,000 | $30,000 | $30,000 | $30,000 | $30,000 | $30,000 | $30,000 | $30,000 | $30,000 | $30,000 | $30,000 |
| Retained Earnings | ($1,800) | ($1,800) | ($1,800) | ($1,800) | ($1,800) | ($1,800) | ($1,800) | ($1,800) | ($1,800) | ($1,800) | ($1,800) | ($1,800) | ($1,800) |
| Earnings | $0 | ($4,354) | ($4,232) | ($4,262) | ($4,853) | ($4,293) | ($3,027) | ($2,232) | $11 | $2,767 | $7,013 | $12,591 | $19,401 |
| Total Capital | $28,200 | $23,846 | $23,968 | $23,938 | $23,347 | $23,907 | $25,173 | $25,968 | $28,211 | $30,967 | $35,213 | $40,791 | $47,601 |
| Total Liabilities and Capital | $28,200 | $25,300 | $32,198 | $32,586 | $32,593 | $34,631 | $36,763 | $38,358 | $42,510 | $45,988 | $52,271 | $59,740 | $68,262 |
| Net Worth | $28,200 | $23,846 | $23,968 | $23,938 | $23,347 | $23,907 | $25,173 | $25,968 | $28,211 | $30,967 | $35,213 | $40,791 | $47,601 |

