
Belle Epoque Dinner Theatre
Executive Summary
Belle Epoque will be a restaurant and exciting Dinner Show located in Bigsmalltown, Upstate, that celebrates the era of cultural refinement, social elegance, and general prosperity in the last decades of the 19th and first decade of the 20th centuries. The exuberance of the “Gay 90s” era will be rekindled as we model our restaurant on the establishments of the Montmartre district of Paris such as the famous Moulin de la Galette.
The decor will be similar to that of the restaurant/dance hall/theatres of 1890s, and feature artwork of the Impressionists such as Pierre-Auguste Renoir, Henri de Toulouse-Lautrec, Mary Cassat, and Berthe Morisot. Hosting and serving staff will dress in period costume.
The combination of a Montmartre dance hall, bon vivants, famous artist and lively music is why our restaurant is so dynamic. The exciting and exhilarating aspect of this restaurant is that it transcends beyond decorations and moves into a real life, first person experience – face to face. From the singing aloud of ditty’s, to the hearty, back-slapping laughter or breathtaking can-can dancing – every second is a treasured, emotional meeting with Alfred Dreyfus or Madam La Goulue, “look-alikes.”
Our menu is a varied, international, tasteful extravaganza. Each page is highly illustrated with artists’ drawings of the regional cuisine, a tiny map of the world showing the region and indigenous ingredients. The majority of the menu is the cuisine of France, and America, though we will offer specialties from Japan, Korea, Phillipines, Italy, Germany, France, Mexico, Spain, Belgium and Middle East. A few pages are devoted to White House and Camp David stylings where Chef Joachim served the First Family. We will offer a 10 item wine card “By the Glass Daily Selection”, wines by the bottle, and a special cellar collection.
Belle Epoque is the first in what hopefully will become a chain of similarly themed restaurants. It offers a new and exciting concept that is already being done in other successful era’s such as, “Capitan Hook” www.capitanhook.com and “Medieval Times” www.medievaltimes.com. These concepts are expanding with cash driven proofs of winning financial operation. Originally laughed at and stereotyped as ridiculous for a dining concept, these outlets are reaching new potential and breaking previously set sales figures. Medieval Times started as a single location and opened its eighth restaurant and show in March, 2004. We aim to attract customers from the same market niche, but with a Impressionist/Moulin Rouge theme.
Executive Chef Joachim Oignons will lead the management team. Chef Joachim is retiring from a 30-year military career during which he won many awards, served as Executive Chef to the President of the United States, and managed multiple U.S. government restaurant/food service venues world wide.
1.1 Mission
Belle Epoque offers an impressive, blockbuster revue of international food, fare and drink centered around the high culture and exuberant night life of the Montmartre district of 19th century Paris. Our combination is wonderful food and Impressionist history. This revue also includes our shows, acts, skits, original music and entertainment for the customer – whom we live to impress and make happy.
In each and every facet of all that we do – the focus remains on the customer. Likewise, our employees never work “for us” – rather they work “with us” – and as such – they are our customers also. We are all serving each other in some capacity.
Our focus includes community service, involvement and family. We will always be deeply involved with the community and people of Bigsmalltown. Belle Epoque is also an excellent place to work, a professional environment that is challenging, rewarding, creative, and respectful of ideas and individuals. Belle Epoque ultimately provides excellent value to its customers and fair reward to its owners and employees.
1.2 Keys to Success
- Production of a high quality menu and superior ingredient sourcing.
- Training of a crack workforce, with paper lists that detail daily actions, and managerial follow-up that ensures winning goals are completed. Food production books, recipes, management routine, records and returns will be detailed.
- Practice by dinner show participants and actors will produce a fantastic show. Continued excellence in performance will come in diversity of workforce training and a, “Qualification Card,” system – similar to the system successfully used by the U.S. Navy.
- Distribution of some profits to the workforce will breed cyclical results that exceed first five year goals.
- Unusual interior design and outdoor landscaping.
- The actors and staff learn habits, quips, funny answers and anecdotal comments for customer enjoyment. Similar in concept to the highly profitable and world known, “Ed Debevics” “50’s” diner in Chicago.
- Excellence in fulfilling the promise – reliable, trustworthy expertise in operation, leadership and management of the show and restaurants.
- Developing visibility to generate new business leads.
- Leveraging from a single pool of expertise into multiple revenue generation opportunities: bar, restaurant, catering, show, and events.
Among the National Restaurant Association highlights for this year in the restaurant industry are:
- The restaurant industry’s anticipated sales of $440.1 billion equal 4% of the U.S. gross domestic product.
- This coming year will mark the 13th consecutive year of real growth for the restaurant industry.
- The number of restaurant locations in the United States will grow to 878,000.
- The restaurant industry will employ 12 million people, making it the largest private-sector employer in the nation.
- Continued expansion will occur, driven by Americans’ need for convenience and socialization, and a healthy increase in disposable income.
- New menu items in response to diners’ increasingly sophisticated tastes, and heightened interest in health and nutrition.
- Greater efforts by lawmakers to regulate restaurants.
According to Norwalk, CT based Adams Beverage Group and Restaurants and Institutions magazine (June 1)
- Wine sales in restaurants rose 8.1% lat year
1.3 Objectives
- Build and create a restaurant that celebrates the belle epoque/gay 90s era in European/American history. Celebrating the high society of that era will be done via skits, acts, drinks, music, demonstrations, food, a small museum, fantastic show and dance. The measurable objectives will be:
- Opening night in full regalia and profitability within two months
- Gross sales receipts of $1,000,000 by third month
- Food costs not to exceed 35% total operation
- Deliver a stunning, unbelievable, international menu to the local and summer “swell” community that produces 96% satisfaction surveys or higher and profits in excess of 200% Return on Investment (ROI). Surveys to be done for sixteen weeks by an independent third-party review agency.
- The international menu will reflect the Belle Epoque era of the late 19th and early 20th centuries. This objective will be reviewed by a number of friends who are Presidents and Continental Directors of their respective countries in the World Association of Cooks Societies (WACS)(www.wacs2000.org).
- Continuous analysis and outsider inspections will be held to fine-tune objectives via goal planning, Directives, Operations, Objectives ands Milestones (DOOM) and weekly Best Objectives Review Evaluation (BORE) meetings.
- Objectives will be handled in a planning and strategy sense espoused by business leaders. Business will be conducted monitoring our Profit and Loss statement numbers, local business owners of restaurants and their own marketing ploy, advertising and profits. Consultants will be on minor, as needed retainers not to exceed $10,000 per annum.

Company Summary
Belle Epoque is a restaurant with lunch and dinner menus and a theme show for dinner only. It welcomes artists, historians, living history interpreters, and re-enactors to its grounds for, plein aire painting sessions, historical shows and events. It features the culinary adventures and exquisite tastes of late 19th century Paris as prepared under the exacting standards of Executive Chef Joachim Oignons.
Chef Joachim retired as a Senior Chief Petty Officer and was the first ever American Culinary Federation Executive Chef in Camp David’s history. As a Navy Executive Chef to the President of the United States he excelled in the history of America at the Catoctin Mountain Retreat and at the White House. He later was asked by the Navy to live around the world, in Asia, Arabia and in Europe – cooking for Admirals in Japan, at NATO and for Lords, Prime Ministers, Kings and Queens, royalty, stars and public personalities. His food is fully representative of direct experiences – worldwide, with international culinary favorites learned firsthand.
2.1 Company Ownership
Belle Epoque has been solely chartered as a Upstate LLC corporation based in Border County, owned by its principal investor and principal operator, Executive Chef Joachim Oignons. It is expected to drop the LLC status within three to five years and seek Sub-chapter S, followed by C status, pending changing tax laws, the economy and review of profit and loss statements. Additional investors may bring forward additional operations assistance and staff.
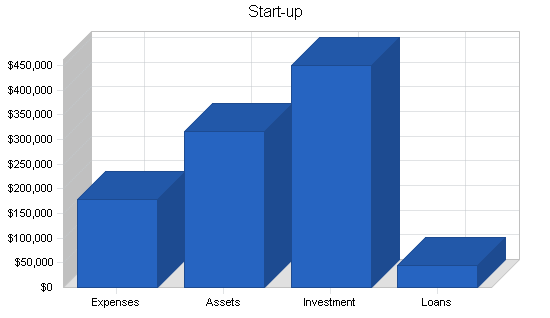
2.2 Start-up Summary
Start-up expenses include legal costs, artwork, property lease or purchase, remodeling, logo design, computer software, stationery, liquor license, and related expenses.
Start-up assets required include short-term assets (office furniture, tablewear and glasswear, signage, and small kitchen equipment and utensils, kitchen and server uniforms and costumes etc.) and initial cash to handle the first few months of operations – as sales and accounts receivable play through the cash flow. Inventory for the first two weeks of operations will need to be ordered and delivered in the week prior to opening.
Long-term assets include office computers, serving staff workstations, kitchen terminals, POS terminals, security and fire alarm systems, shelving, food storage.
This plan assumes moving into a retrofit of a former restaurant where tables, chairs and kitchen stoves and equipment are in place. If that is not available an additional $500,000 to $600,000 will be needed for a scratch start.
| Start-up | |
| Requirements | |
| Start-up Expenses | |
| Legal and Attorney’s Fees | $12,288 |
| Stationery and Office Supplies | $12,341 |
| Brochures | $3,382 |
| Consultants | $3,900 |
| Insurance | $9,809 |
| Remodeling Expenses | $19,400 |
| Utilities | $2,000 |
| Liquor License | $100,000 |
| Rent or Mortgage 1st month/startup | $14,000 |
| Research and Development | $1,300 |
| Total Start-up Expenses | $178,420 |
| Start-up Assets | |
| Cash Required | $50,000 |
| Start-up Inventory | $75,000 |
| Other Current Assets | $17,000 |
| Long-term Assets | $175,000 |
| Total Assets | $317,000 |
| Total Requirements | $495,420 |
Services
Belle Epoque offers a first-of-its-kind in the area entertainment and dining concept with excellent, tasty food. The interaction with live human actors from 1890s Paris is fascinating. The concept is not content to just deliver the service of good food and friendliness though. It offers colorful, haute culture actors by day, and an entertaining, optional Moulin de la Galette evening dinner show that will amaze and delight. Our table side service is extremely fun and unique. The wine bottle selection and daily, “by the glass,” wine card will be in addition to our selection of beer on tap and fully stocked bar. The catering will also entertain and thrill customers (i.e. bringing the show to their event).
Market Analysis Summary
Our main target market is quite simply the well known vacationing family or vacationing friends, lovers and fun-seekers. A smaller sub-section of locals will visit us as well.
The local winter season resident population is 250,000 people (Source: U.S. Census).
- The summer season visitor attendance is 4.5 million visitors of which:
- 75.5% are families with two or more children
- 17.6% are single
- 2.6% are senior citizens
- 78.3% are between the ages of 28 and 54
- 56.34% earn more than $50,000 per year
- The average stay is 4.6 days
- Spending per day varies between $78 to $300
Tourism dollars generated in Bigsmalltown are $3.64 billion (Source: Rovelstad & Associates, Longwoods International)
TOURIST SEASON IS BASICALLY FIVE MONTHS LONG – FROM MAY TO SEPTEMBER
- Restaurants generate $1.006 billion
- Retail generates $675 million
- Lodging generates $1.183 billion
- Automobile generates $449 million
- Recreation generates $303 million
- Transportation generates $30 million
Bigsmalltown at a Glance as of 2003 – The Official Border County Government Report
PEOPLE
- 102,326 year round residents with an estimated summer population of 614,261
- 5% of the people are under 5 years old
- 22% percent are under 18 years old
- 20% are over the age of 65 years old
- Per capital income is $24,172
- Median household income is $41,591 and is increasing
- There are 91,000 housing units consisting of 46% year round residents and 54% used for seasonal and recreational
GEOGRAPHY
- Encompassing 256 square miles of land area located at the southern tip of Upstate
- Made up of 16 municipalities
- 30 miles of white sandy beaches and islands with thousands of acres on the mainland preserved for open space, farmlands and natural conservation
- With over 70 square miles, Village Township is the largest geographically of all the municipalities
- Bocage Township is the most populated with almost 23,000 people
ECONOMY
- Tourism represents the number one industry generating over $3 billion a year in revenues
- Total labor force of 49,201 people
- There are 3,693 private establishments
- The Services sector of the economy employs 37% of the labor force followed by the Trades that employ 36%
- Government employs 10% of the labor force
4.1 Market Segmentation
We use this topic to explain the Market Analysis table and chart, below. Our analysis is based on a list of potential customer groups, each of which is a market segment.
- The family segment looking for fun while on their week of vacation.
- The local residents included in the summer population looking to see something new or to take guests in town out to a great, proud place. Local residents are increasing with condominium ownership and increased building.
- Long distance drivers coming in especially to experience our dinner show. This last geographic segment will normally travel one driving day or up to 300 miles for a short weekend stay.
There are two specific sub-groups of clientele within each of the listed segments: the lunch crowd, casual drinking (wine specifically, market encouraged), and our nightly “Admiral’s Table” crowd. Both of these segments (especially wine drinkers) are slightly more sophisticated; average bar drinking age is about 25 to 34-plus years old while the dining room averages 35 to 54-plus. Household income is upper middle, in the $75,000 and up range. We hold these specific two groups to be similar to McCormick & Schmick’s – a close match to our offerings (data as reported in Market Watch, October, 2003).
Some of the more recent trends include correlating behavioral patterns and so-called psychographics, which produced the famous classification of, “yuppies,” as young urban professionals, and of course the, “baby boomers,” with certain buying patterns. We believe both of these segments will frequent Belle Epoque.
Teenagers sort themselves into marketing groups with names like, “preppies, dudes, gothic, jocks, and skaters.” Each of these labels actually stands for certain sets of behavior patterns, and has some value in segmentation. These segments will attend our offerings in groups for class trips and major events. They also will attend with their parents for general dining and we plan on marketing directly to their segment. An example of successful teenager marketing is the offering of bottled sodas instead of just fountain service. Teenagers are highly ranked for their liking of bottled soda over all other categories – due to its extra pep and fizz.
Marketing one simple item to a specific segment generates sales across the board. Especially when teens encourage parents to “go to Belle Epoque tonight.” This is only one, direct example of techniques to be employed for market domination via segmentation understanding. We have other areas and methods scheduled. Many are based on award-winning experience, financial success, and published books by noted experts.

| Market Analysis | |||||||
| Year 1 | Year 2 | Year 3 | Year 4 | Year 5 | |||
| Potential Customers | Growth | CAGR | |||||
| Weekly summer population | 5% | 225,000 | 235,000 | 245,000 | 255,000 | 265,000 | 4.18% |
| Weekly winter population | 5% | 4,808 | 5,008 | 5,208 | 5,408 | 5,608 | 3.92% |
| Long distance customers | 2% | 5,000 | 8,000 | 12,000 | 15,000 | 20,000 | 41.42% |
| Total | 5.47% | 234,808 | 248,008 | 262,208 | 275,408 | 290,608 | 5.47% |
4.2 Target Market Segment Strategy
We cannot survive just waiting for customers to come to us. Instead, we must focus on the specific market segments whose needs match our offerings. Focusing on targeted segments is the key to our future. We will attract customers with live performances and distribution of brochures.
Therefore, we need to focus our marketing message and our product offerings. We need to develop our message, communicate it, and make good on it. The Marketing Strategy topic contains the details of our tactics and programs.
4.3 Service Business Analysis
The restaurant and entertainment show business is dynamic and fast paced. It offers exciting food and dining experiences with high profit margins. Interested owners who have extensive multi-decade experience will almost always do well. Those who have theater and acting experience, combined with 20 to 30 years of business success, will do extremely well in profit, employee and customer happiness. This service business provides rewards via customer satisfaction surveys.
4.3.1 Competition and Buying Patterns
In one part of the restaurant market competition depends on reputation, advertising, and the dining experience of the customer. In another, competition centers around location and parking. In most cases the restaurant industry strongly relies on word-of-mouth recommendations over advertising. Word of mouth is the secret in retaining long-term satisfied customers. This, combined with changing drama shows each year, and other side acts, will ensure that diners return.
Customers will choose our business over others from the first time they see our actors dressed up in the mall handing out brochures or in parking lots staging mini-shows. We have extensive experience with free publicity. For instance, Chef Joachim recently appeared on the Today show. He has also filmed many other shows all over the world and in a number of different languages.
Appearances on the public boardwalks, streets and anywhere that is free – such as at huge events, competitions, conventions and more, will attract the public. Customers will definitely choose us due to our personal and face-to-face interaction in a dining experience. Host and serving staff will dress in period costumes, and those with a yen toward acting and performance will be encouraged to play the parts of denizens of Montmartre, during the Paris’ cultural heyday. Staff will regularly portray famous members of Parisian high society including Impressionist painters, theatre doyens, writers, philosophers, etc.
All too often the problem with today’s restaurants is that they look great, have waterfalls or beautiful physical decoration, or great motifs and themes, but are missing the human element…the host or server who is unpredictable and physically shakes your hand. The dining experience should not be another video simulator or Nintendo game. Even serious businessmen and businesswomen can get excited over a corporate event held in our Belle Epoque restaurant where they can talk with actors who believe that they are back in that era (called first person acting). What might someone say and what answer might come back? Something snappy or robust?
The buying patterns of our customers will be repeat patterns. Our pricing for food, taste, and product delivered will exceed local expectations. We rely on the world tastes and travels of Chef Joachim and team – difficult to equal or duplicate.
Strategy and Implementation Summary
5.1 Competitive Edge
Our competitive edge will be to cut wide open the competition with our amazing and exciting actors. We will be different from all others because of our creativity, presentation, marketing, advertising and delivery. We will stand out with sustainable value, something that we can maintain and develop over time – the transition from real life into fantasy escape. The competitive edge, that puts us ahead of most competitors is the opportunity to live and interact in history or another world. Stepping into our world will reveal discussion with people of the time and physically doing things with them – while enjoying a great meal and a show.
The ultimate edge is that we allow people to be in our show and to walk a few hours or days in history’s shoes. This is the opportunity for customers to gain instant fame on stage with the crowds cheering and clapping. That is a competitive edge, with benefit, that all humans dream of. But, beyond that, we also will offer the opportunity to live and work in our historic world for a reasonable price.
Patrons are not forced to attend the dinner show. They can still have dinner in our separate dining room.
Chef Joachim Oignons’ experience at the White House and at Camp David provide acclaim, reputation, and credibility when combined with his 30 years of naval service.
We start with a critical competitive edge: there are few competitors we know of that can claim anywhere near as much hype, attention to detail and people, excitement, dancing, singing or showmanship with historic proportions. The closest thing to our platform in this geographic area is The Capsized Sailor—Seafood on the Pier. Our positioning on this point is very hard to match, as long as we maintain this focus in our strategy, marketing, business development, and fulfillment. We are aware that the tendency to dilute this expertise with premature expansion will dull the importance of our competitive edge. Also, excessive changing of our plan and rollout could break the creative side of the operation.
5.2 Marketing Strategy
Marketing will be our life blood of crowd draws and excitement. Our Marketing Strategy has been explained a bit already. Our Sales Strategy is the easiest of our plans.
Our Marketing Strategy first and foremost is born out of three governing functions:
- An indignant refusal to adopt typical high cost advertising schemes in print, television or internet campaigns. Throwing tens of thousands of dollars at billboards or magazines is a crutch for those less creative. The impact we can have with other creative means will be impressive.
- “Beyond belief,” word-of-mouth and first person character advertising. Guaranteed to affect image, awareness and propensity to buy. A meeting with one of our six historical Impressionist painters or with one of our Paris Opera or Ballet Prima Donna’s will not be forgotten.
- Ingenious strategic placement and appearance into market at the right time and stunning venue with our actors and, “Boulevardiers.” One of the easiest ones is the strolling the promenade and boulevard by our high society Madames et Monsieur, handing out leaflets. Other events will include partnering with various wine and spirit distributors for special promotions.
5.3 Sales Strategy
Sales in our business is customer service. It is repeat business. One doesn’t just sell a glass or bottle of wine and boost the check price, one develops a proposal that works for the client, that convinces him or her to crave the wine. Direct-in house sales classes will be held to teach staff how to “get in with the smile,” “enjoy laughter with customers” and then go for the boost in the check price by selling that dessert, beer or wine. We can also make money with our extensive selections of tea, coffee, cheese and cigars.
With our innovative, drama sales platforms wallets will fly out of pants pockets and purses. Our independent tests and studies show that what sells most is human interaction and excitement. Paying attention to people, listening and talking with them, admiring their face and clothes – this adoration – this sales truth of genuine, heartfelt, over-the-top achievement – this is what makes dynamic drama sales happen. Our goal is extraordinary attention to reveal extraordinary sales.
We must always be aware of the big-company feeder phenomenon of the split between selling the restaurant and failure to fulfill the sale with entertainment and luscious food, which leads to client dissatisfaction. The human sale should be developed and scoped, sold, and fulfilled by the same people. If you see, run over to meet and greet Impressionist painter Edgar Degas and his retinue of Paris Ballet dancers on the mall as you are shopping, then you expect to see him that night at the restaurant. Our customers should never buy into a sale from one partner and have it delivered by anybody other than that same partner. The promise shall be fulfilled.
5.3.1 Sales Forecast
Lunch Hour Sales are figured on starting in April of 2005 with 27 available days of weather x 190 seatings (based @ 200 seats avail total over a three hour period with 1.0 turnovers – 10:30 AM to 1:30 PM) at $14.00 average check take. In May this rises to 220 covers or a 1.1 ratio. For the months of June, July and August this escalates to full capacity of the 200 seats and two turnovers, with a cap of 385 out of 400 in four hours and 27 days of good weather. The Direct Cost of Sales in this category is 38% of Sales Forecast.
Dinner Sales are figured on starting in April of 2005 with 27 available days of weather x 110 seatings (based @ 200 seats avail total over a four hour period with 1.0 turnovers – 6:00 PM to 10:00 PM) at $24.00 average check take. In May this rises to 140 covers. For the months of June, July and August this escalates to full capacity of the 200 seats and two turnovers, with a cap of 385 out of 400 in four hours and 27 days of good weather. The Direct Cost of Sales in this category is 36% of Sales Forecast.
Dinner Show Sales are figured on starting in April of 2005 with 27 available days of weather x 101 seatings (based @ 340 seats avail total over a three hour period with 1.0 turnovers – 7:00 PM to 10:00 PM) at $55.00 fixed ticket price. In May this rises to 201 covers. For the months of June, July and August this escalates to full capacity of 320 of the 340 seats and 27 days of good weather. The Direct Cost of Sales in this category is 25% of Sales Forecast.
Bar Sales are figured on 50 people per night at $20.00 for 15 nights in April, May, September and October. In June, July and August the bar will book out at 200 people per night and be filled with excitement and games from 6:00 PM to 2:00 AM. Average take is expected to be $35.00 per person. One of the primary pulls will be the two sunken pool tables. The Direct Cost of Sales in this category is 36% of Sales Forecast.
Be in the Show Sales are figured on 10 participants per night at $65.00 with 27 days of good weather. The Direct Cost of Sales in this category is 25% of Sales Forecast.
Catering Sales are not desired to be our strong suit or a strong sales platform. But, we do expect to do at least two events in the summer including the Boulevarier Festival. The Direct Cost of Sales in this category is 55% of Sales Forecast.
High Tea with a Lady, Wives of the Impressionist Painters Sales will be brisk at 30 people per afternoon for 27 days of good weather each month. Prix Fixe will be $18.00 per person from 2:00 PM to 4:00 PM each day. The Direct Cost of Sales in this category is 38% of Sales Forecast.


| Sales Forecast | |||
| Year 1 | Year 2 | Year 3 | |
| Unit Sales | |||
| Lunch Sales | 78,975 | 86,873 | 95,560 |
| High Tea Sales | 9,720 | 10,692 | 11,761 |
| Dinner Sales | 66,335 | 72,969 | 80,265 |
| Dinner Show Sales | 68,074 | 74,881 | 82,370 |
| Bar Sales | 28,350 | 31,185 | 34,304 |
| Be In the Show Sales | 3,240 | 3,564 | 3,920 |
| Catering Sales | 4 | 4 | 5 |
| Total Unit Sales | 254,698 | 280,168 | 308,185 |
| Unit Prices | Year 1 | Year 2 | Year 3 |
| Lunch Sales | $14.00 | $14.98 | $16.03 |
| High Tea Sales | $18.00 | $19.26 | $20.61 |
| Dinner Sales | $24.00 | $25.68 | $27.48 |
| Dinner Show Sales | $55.00 | $58.85 | $62.97 |
| Bar Sales | $28.57 | $30.57 | $32.71 |
| Be In the Show Sales | $65.00 | $69.55 | $74.42 |
| Catering Sales | $7,250.00 | $7,757.50 | $8,300.53 |
| Sales | |||
| Lunch Sales | $1,105,650 | $1,301,350 | $1,531,689 |
| High Tea Sales | $174,960 | $205,928 | $242,377 |
| Dinner Sales | $1,592,040 | $1,873,831 | $2,205,499 |
| Dinner Show Sales | $3,744,070 | $4,406,770 | $5,186,769 |
| Bar Sales | $810,000 | $953,370 | $1,122,116 |
| Be In the Show Sales | $210,600 | $247,876 | $291,750 |
| Catering Sales | $29,000 | $34,133 | $40,175 |
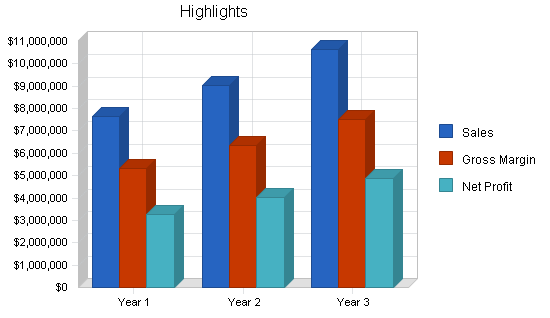
| Total Sales | $7,666,320 | $9,023,259 | $10,620,375 |
| Direct Unit Costs | Year 1 | Year 2 | Year 3 |
| Lunch Sales | $5.32 | $5.53 | $5.81 |
| High Tea Sales | $6.84 | $7.11 | $7.47 |
| Dinner Sales | $8.64 | $8.99 | $9.43 |
| Dinner Show Sales | $13.75 | $14.30 | $15.02 |
| Bar Sales | $10.29 | $10.70 | $11.23 |
| Be In the Show Sales | $16.25 | $16.90 | $17.75 |
| Catering Sales | $3,987.50 | $4,147.00 | $4,354.35 |
| Direct Cost of Sales | |||
| Lunch Sales | $420,147 | $480,648 | $555,149 |
| High Tea Sales | $66,485 | $76,059 | $87,848 |
| Dinner Sales | $573,134 | $655,666 | $757,294 |
| Dinner Show Sales | $936,018 | $1,070,804 | $1,236,779 |
| Bar Sales | $291,600 | $333,590 | $385,297 |
| Be In the Show Sales | $52,650 | $60,232 | $69,567 |
| Catering Sales | $15,950 | $18,247 | $21,075 |
| Subtotal Direct Cost of Sales | $2,355,984 | $2,695,245 | $3,113,008 |
5.4 Milestones
The accompanying table lists important program milestones, with dates and managers in charge, and budgets for each. The milestone schedule indicates our emphasis on planning for implementation.
What the table doesn’t show is the commitment behind it. Our business plan includes complete provisions for plan-vs.-actual analysis, and we will hold monthly follow-up meetings to discuss the variance and course corrections.

| Milestones | |||||
| Milestone | Start Date | End Date | Budget | Manager | Department |
| Business Plan | 10/18/2004 | 1/23/2005 | $709 | J. Oignons | BOD |
| Property scouting | 12/18/2003 | 6/1/2004 | $580 | A. Spergras | Property |
| Interior Design | 8/30/2004 | 10/30/2004 | $11,548 | T. Matto | Gourmet |
| Print Design & Production | 9/22/2004 | 11/12/2004 | $45,723 | O. Bergene | Media & PR |
| Script writing | 9/22/2004 | 9/22/2004 | $4,000 | C. Wensleydale | Theatrical |
| Menu rollout | 2/4/2005 | 4/12/2005 | $430 | J. Oignons | F & B |
| Stage design and build | 2/2/2005 | 3/28/2005 | $19,050 | C. Wensleydale | Theatrical |
| Legal rollout | 1/1/2004 | 6/1/2004 | $22,288 | S. Prouts | Legal |
| Design sketches | 12/22/2004 | 1/22/2005 | $300 | O. Bergene | Media & PR |
| Logo design | 1/22/2005 | 2/12/2005 | $100 | J.Oignons | Media & PR |
| Totals | $104,728 | ||||
Web Plan Summary
It will showcase the 1890s Paris high-society decor of the restaurant, and the exuberant, social elegance of the Moulin de la Galette show and costumes of our staff.
The website needs to be a simple yet classy and well designed website that, at the same time, is in keeping with the latest trends in user interface design. A site that is too flashy, or tries to use too much of the latest Shockwave or Flash technology can be over done, and cause potential customers to look elsewhere for online excitement as well as a meal or show. A particular, small section will offer a stunning and robust Flash MX presentation of the gay 90s Paris Impressionist arts scene.
To further show off its expertise the website may create a resources area, offering articles, research, re-enacting tips and sales to interested parties. We will accept reservations online as well as partner with Amazon, PayPal and book sellers to sell products while holding no inventory. Of course, all of the items will be totally Impressionist/Moulin Rouge/Age of Elegance in nature. We will accept all credit cards via our merchant accounts.
The key to the website strategy will be combining a very well designed front end, with a back end capable of recording leads and proposal requests, as well as running our own online marketing program.
We will sell targeted advertising to specific market groups, as well as partnering with online retailers to sell relevant products to the users.
6.1 Website Marketing Strategy
Marketing for us will center primarily around distribution of our URL, initially via paper means. That will plug and pull unique hits on our real time database reporting and stats. Our restaurant concept will not rely on achieving first hit status for keywords to draw customers into the premises. Rather, a visit to the website will most always be an after-the-fact event. For instance, after visiting the restaurant or after reading our brochure or after hearing our commercial on the radio.
We will garner some specific unique entry hits via usage of our time proven keyword and html skills. These will result in number one placement across certain keywords and dozens of engines, worldwide. Such is our proven success of using numerous URLs, keyword generation and testing with the number one rated international “Web Position Gold 2” program. In addition to that, whole, separate websites are built specifically for precise search engines. The most intelligent designers are able to achieve #1 ranking via weekly updating across 1,200+ engines. Our primary goal model is the Google engine.
We will be linked to from hundreds of websites, including the Greater Bigmalltown Chamber of Commerce and US Chamber of Commerce.
6.2 Development Requirements
The website will be initially developed with few technical resources. A simple hosting provider, Ludditeorgweb.com services, will host the site and provide the technical back end out of Sunscorch City, USA.
We will work with a contracted user interface designer to develop the simple, classy, yet Internet focused site. The user interface designer will work with a graphic artist to come up with the website logo, and the website graphics. A number of articles, photos and features will be provided based on our recreation of the 1890s Paris Boulevardier lifestyle.
The maintenance of the site will be done by the owner. As the website rolls out future development such as newsletters and downloadable games, a technical resource may need to be contracted to build the high-end items.
Management Summary
The initial management team depends on the founder, Joachim Oignons and his recruitment of managers. As we grow, we may take on additional consulting help, plus graphic/editorial, sales, and marketing. By opening, Belle Epoque’s management team will be composed of:
Executive Chef Joachim will manage the kitchen staff and oversee the financials
Serving Staff manager – T.O. Matto
Sommelier/Bar manager – A. Bisynthe
Performance manager – C. Wensleydale
* Management team resumes, confidential and proprietary information have been removed from this sample plan.
7.1 Personnel Plan
The following table summarizes our personnel expenditures for the first three years, with compensation increasing from less than $634K the first year to about $700K in the third.
Employees include hosts, kitchen staff, serving staff, performance staff, bartending staff, and dishwashing/cleanup staff, sufficient to cover the hours of operation, prep-time and cleanup. Restaurant serving hours begin at 10:30 AM, and the bar closes at 2:00 AM. A Bookkeeper/Office Assistant will also be hired.
We believe this plan is a fair compromise between fairness and expedience, and meets the commitment of our mission statement. The detailed monthly personnel plan for the first year is included in the appendices.
| Personnel Plan | |||
| Year 1 | Year 2 | Year 3 | |
| Executive Chef Joachim Oignons-owner | $59,000 | $61,950 | $65,048 |
| Serving Staff Manager | $36,000 | $37,800 | $39,690 |
| Sommelier/Bar Manager | $36,000 | $37,800 | $39,690 |
| Performance Manager | $36,000 | $37,800 | $39,690 |
| Host/Serving Staff | $129,024 | $135,475 | $142,249 |
| Kitchen Staff | $169,344 | $177,811 | $186,702 |
| Performance Staff | $124,416 | $130,637 | $137,169 |
| Bar Staff | $32,256 | $33,869 | $35,562 |
| Bookkeeper/Office Assistant | $12,000 | $12,600 | $13,230 |
| Total People | 0 | 0 | 0 |
| Total Payroll | $634,040 | $665,742 | $699,029 |
Financial Plan
We are assuming a low start-up funding figure of approximated $500,000. The business will grow exponentially by a net worth of about two million dollars per year and this growth is based off of sheer cash profits and managerial excellence. Growth will be self financed. No additional funding will be needed.
8.1 Important Assumptions
The financial plan depends on important assumptions, most of which are shown in the following table as annual assumptions. The monthly assumptions are included in the appendices. From the beginning, we recognize that our direct marketing will be critical to advertising, a factor we can influence easily. Weather and catastrophe cannot be so easily planned on and would delay project by a year (hurricane, tornado, etc…) At least we are planning on the potential problem, and dealing with it.
Interest rates, tax rates, and personnel burden are based on conservative assumptions.
Two of the more important underlying assumptions are:
- We assume a strong economy, without major recession.
- We assume funding will be maintained and strongly backed.
One item of particular note is that we have set our cost of goods for food sales at high percentage factors of 30% to 36%. The majority of seasoned managers would raise an eyebrow at those percentages. We intend to beat these percentages and therefore bring in a windfall on our P & L. One important assumption is our capability to decrease food waste and costs.
| General Assumptions | |||
| Year 1 | Year 2 | Year 3 | |
| Plan Month | 1 | 2 | 3 |
| Current Interest Rate | 10.00% | 10.00% | 10.00% |
| Long-term Interest Rate | 8.20% | 8.20% | 8.20% |
| Tax Rate | 25.00% | 25.00% | 25.00% |
| Other | 0 | 0 | 0 |
8.2 Start-up Funding
Start-up funding requirements come to just shy of $500,000. This presumes we can move into an established, equiped restaurant space. Expenses and asset purchases will increase dramatically if we must fully outfit and equip a space for its first use as a restaurant.
Funding will be through a combination of owner investment, outside investment, and long-term loans. A small amount of current borrowing (credit card purchases) complete the start-up funding.
| Start-up Funding | |
| Start-up Expenses to Fund | $178,420 |
| Start-up Assets to Fund | $317,000 |
| Total Funding Required | $495,420 |
| Assets | |
| Non-cash Assets from Start-up | $267,000 |
| Cash Requirements from Start-up | $50,000 |
| Additional Cash Raised | $420 |
| Cash Balance on Starting Date | $50,420 |
| Total Assets | $317,420 |
| Liabilities and Capital | |
| Liabilities | |
| Current Borrowing | $5,420 |
| Long-term Liabilities | $40,000 |
| Accounts Payable (Outstanding Bills) | $0 |
| Other Current Liabilities (interest-free) | $0 |
| Total Liabilities | $45,420 |
| Capital | |
| Planned Investment | |
| Owner | $50,420 |
| Investor | $400,000 |
| Additional Investment Requirement | $0 |
| Total Planned Investment | $450,420 |
| Loss at Start-up (Start-up Expenses) | ($178,420) |
| Total Capital | $272,000 |
| Total Capital and Liabilities | $317,420 |
| Total Funding | $495,840 |
8.3 Business Ratios
The following table shows the projected businesses ratios. We expect to maintain healthy ratios for profitability, risk, and return. The Standard Industrial Classification (SIC) Code for the industry we chose is French Restaurant (5812.0104), though there is no SIC that accurately describes our offering platform of dinner theatre. We used the Industry Ratios report for Eating Places (5812) to generate the industry profile shown in the following table.
| Ratio Analysis | ||||
| Year 1 | Year 2 | Year 3 | Industry Profile | |
| Sales Growth | 0.00% | 17.70% | 17.70% | 7.60% |
| Percent of Total Assets | ||||
| Inventory | 1.79% | 1.00% | 0.73% | 3.60% |
| Other Current Assets | 0.46% | 0.22% | 0.14% | 35.60% |
| Total Current Assets | 95.58% | 98.01% | 98.84% | 43.70% |
| Long-term Assets | 4.42% | 1.99% | 1.16% | 56.30% |
| Total Assets | 100.00% | 100.00% | 100.00% | 100.00% |
| Current Liabilities | 5.68% | 4.70% | 3.46% | 32.70% |
| Long-term Liabilities | 0.90% | 0.33% | 0.13% | 28.50% |
| Total Liabilities | 6.58% | 5.03% | 3.60% | 61.20% |
| Net Worth | 93.42% | 94.97% | 96.40% | 38.80% |
| Percent of Sales | ||||
| Sales | 100.00% | 100.00% | 100.00% | 100.00% |
| Gross Margin | 69.27% | 70.13% | 70.69% | 60.50% |
| Selling, General & Administrative Expenses | 32.12% | 34.20% | 34.10% | 39.80% |
| Advertising Expenses | 1.12% | 1.10% | 1.08% | 3.20% |
| Profit Before Interest and Taxes | 56.94% | 59.34% | 61.10% | 0.70% |
| Main Ratios | ||||
| Current | 16.82 | 20.84 | 28.56 | 0.98 |
| Quick | 16.50 | 20.63 | 28.35 | 0.65 |
| Total Debt to Total Assets | 6.58% | 5.03% | 3.60% | 61.20% |
| Pre-tax Return on Net Worth | 126.67% | 74.25% | 56.06% | 1.70% |
| Pre-tax Return on Assets | 118.34% | 70.52% | 54.04% | 4.30% |
| Additional Ratios | Year 1 | Year 2 | Year 3 | |
| Net Profit Margin | 42.67% | 44.48% | 45.81% | n.a |
| Return on Equity | 95.01% | 55.69% | 42.04% | n.a |
| Activity Ratios | ||||
| Inventory Turnover | 24.00 | 38.04 | 38.21 | n.a |
| Accounts Payable Turnover | 17.85 | 12.17 | 12.17 | n.a |
| Payment Days | 27 | 24 | 28 | n.a |
| Total Asset Turnover | 2.08 | 1.19 | 0.88 | n.a |
| Debt Ratios | ||||
| Debt to Net Worth | 0.07 | 0.05 | 0.04 | n.a |
| Current Liab. to Liab. | 0.86 | 0.93 | 0.96 | n.a |
| Liquidity Ratios | ||||
| Net Working Capital | $3,313,676 | $7,081,367 | $11,450,067 | n.a |
| Interest Coverage | 1,354.42 | 2,241.85 | 3,837.09 | n.a |
| Additional Ratios | ||||
| Assets to Sales | 0.48 | 0.84 | 1.13 | n.a |
| Current Debt/Total Assets | 6% | 5% | 3% | n.a |
| Acid Test | 16.50 | 20.63 | 28.35 | n.a |
| Sales/Net Worth | 2.23 | 1.25 | 0.92 | n.a |
| Dividend Payout | 0.03 | 0.06 | 0.10 | n.a |
8.4 Break-even Analysis
The following chart and table summarize our break-even analysis. We expect to reach break-even a few months into the business operation. With favorable response from PR exposure and teaser advertising, in the first month we open, April of 2005, we may achieve goal and break even.
The break-even assumes variable costs of 38% percent of revenue. This assumption is probably too high, and therefore conservative. With initial monthly expenses of over $86,600 we will need averaged monthly revenues of about $140,000 to break-even.

| Break-even Analysis | |
| Monthly Units Break-even | 127,018 |
| Monthly Revenue Break-even | $127,018 |
| Assumptions: | |
| Average Per-Unit Revenue | $1.00 |
| Average Per-Unit Variable Cost | $0.38 |
| Estimated Monthly Fixed Cost | $78,751 |
8.5 Projected Profit and Loss
Our advertising budget pulls data from several tables; the fact that we are spending less than the industry average will be due to getting such great reviews in the consumer and press related magazines and newspapers. Also, of specific note is our unique marketing stunts and plan that does not rely on traditional advertising schemes.
We are profitable in the first year at just over $3 million. As with the break-even, we are projecting very conservatively regarding cost of sales and gross margin. Our cost of goods should be much lower, and gross margin higher, than in this projection. We prefer to project conservatively so that we make sure we have enough cash.
Based on 30+ years of restaurant experience we have budgeted for continued computer and equipage purchases. If we do open in a previously equipped restaurant space we know we will need replacements. If we must open with brand new, guaranteed equipment, we will not have replacement expenses as soon. Normal wear and tear and breakage of plates, glasses, tableware, etc. are budgeted monthly.
Labor costs may be lower than the pro forma projects – but we are planning on worst-case scenario of our attention being diverted as we grow into exactly what we need and when. Later years may be lower as we learn more about how much labor is truly critical. Conversely, if our dinner and show concept is well received, we may have to increase staff (and therefore labor costs) to serve the customer demand.
The Gross Margin Percentage holds steady from year to year due to holding menu and show prices with minimal increases to cover increased food costs and operating expenses. This may be unrealistic – the quandary is – do we want to raise our prices each year or hold them fast. Customer response surveys combined with economic condition analysis will yield the answer to this after the first twelve months. Either way, at worst, we forecast profits between $3-$4 million per annum.


| Pro Forma Profit and Loss | |||
| Year 1 | Year 2 | Year 3 | |
| Sales | $7,666,320 | $9,023,259 | $10,620,375 |
| Direct Cost of Sales | $2,355,984 | $2,695,245 | $3,113,008 |
| Other Production Expenses | $0 | $0 | $0 |
| Total Cost of Sales | $2,355,984 | $2,695,245 | $3,113,008 |
| Gross Margin | $5,310,336 | $6,328,013 | $7,507,367 |
| Gross Margin % | 69.27% | 70.13% | 70.69% |
| Expenses | |||
| Payroll | $634,040 | $665,742 | $699,029 |
| Sales and Marketing and Other Expenses | $92,807 | $81,632 | $81,632 |
| Depreciation | $12,000 | $12,000 | $12,000 |
| MICROS syterm, phones, security, fire, computer upgrades | $10,000 | $10,000 | $10,000 |
| Exterminating | $300 | $300 | $300 |
| Ceramic/Glass/Silver Upkeep | $2,400 | $2,400 | $3,000 |
| Maintenance/Repairs | $22,000 | $20,000 | $22,000 |
| Linen and Dry Cleaning | $2,100 | $2,400 | $2,700 |
| Dish and Cleaning Supplies | $4,800 | $5,000 | $5,250 |
| Office Products Upkeep | $2,400 | $2,500 | $2,600 |
| Paper Products Upkeep | $9,600 | $10,000 | $11,000 |
| Utilities | $28,160 | $30,160 | $32,160 |
| Insurance | $8,604 | $9,104 | $9,604 |
| Rent | $49,800 | $54,800 | $56,800 |
| Employee Healthcare | $36,000 | $38,000 | $40,000 |
| Comps/Donations/Handouts | $30,000 | $30,000 | $30,000 |
| Payroll Taxes | $0 | $0 | $0 |
| Total Operating Expenses | $945,011 | $974,038 | $1,018,075 |
| Profit Before Interest and Taxes | $4,365,325 | $5,353,975 | $6,489,292 |
| EBITDA | $4,377,325 | $5,365,975 | $6,501,292 |
| Interest Expense | $3,223 | $2,388 | $1,691 |
| Taxes Incurred | $1,090,525 | $1,337,897 | $1,621,900 |
| Net Profit | $3,271,576 | $4,013,690 | $4,865,701 |
| Net Profit/Sales | 42.67% | 44.48% | 45.81% |
8.6 Projected Cash Flow
The plan projects a $11,340,000 net worth by 2007 (three years of operation in a high activity vacation environment). The plan anticipates full staffing, a small management team, and maximum acceptance by the dining public. The highest sales will be in the prime summer vacation months, but we believe our unique offering will draw customers to Belle Epoque all year long.
If our sales and profits forecasts prove accurate Chef Joachim will expand his management team and accelerate the long-term plan of opening a second and third Belle Epoque restaurants in other demographic markets. The opening of the second venue will be financed by the profits from this restaurant, and the third site will be financed by the profits from the first two ventures. Obviously this will result in substantial changes in the cash flow and profit figures in year two and year three of this plan.
Cash flow projections are critical to our success. The monthly cash flow is shown in the illustration, with one bar representing the cash flow per month, and the other the monthly cash balance. The annual cash flow figures are included here and the more important detailed monthly numbers are included in the appendices.

| Pro Forma Cash Flow | |||
| Year 1 | Year 2 | Year 3 | |
| Cash Received | |||
| Cash from Operations | |||
| Cash Sales | $7,666,320 | $9,023,259 | $10,620,375 |
| Subtotal Cash from Operations | $7,666,320 | $9,023,259 | $10,620,375 |
| Additional Cash Received | |||
| Sales Tax, VAT, HST/GST Received | $536,642 | $631,628 | $743,426 |
| New Current Borrowing | $0 | $0 | $0 |
| New Other Liabilities (interest-free) | $0 | $0 | $0 |
| New Long-term Liabilities | $0 | $0 | $0 |
| Sales of Other Current Assets | $0 | $0 | $0 |
| Sales of Long-term Assets | $0 | $0 | $0 |
| New Investment Received | $0 | $0 | $0 |
| Subtotal Cash Received | $8,202,962 | $9,654,887 | $11,363,802 |
| Expenditures | Year 1 | Year 2 | Year 3 |
| Expenditures from Operations | |||
| Cash Spending | $634,040 | $665,742 | $699,029 |
| Bill Payments | $3,530,306 | $4,194,008 | $4,996,678 |
| Subtotal Spent on Operations | $4,164,346 | $4,859,750 | $5,695,707 |
| Additional Cash Spent | |||
| Sales Tax, VAT, HST/GST Paid Out | $536,642 | $631,628 | $743,426 |
| Principal Repayment of Current Borrowing | $5,400 | $0 | $0 |
| Other Liabilities Principal Repayment | $0 | $0 | $0 |
| Long-term Liabilities Principal Repayment | $6,900 | $8,000 | $9,000 |
| Purchase Other Current Assets | $0 | $0 | $0 |
| Purchase Long-term Assets | $0 | $0 | $0 |
| Dividends | $100,000 | $250,000 | $500,000 |
| Subtotal Cash Spent | $4,813,288 | $5,749,378 | $6,948,133 |
| Net Cash Flow | $3,389,674 | $3,905,508 | $4,415,668 |
| Cash Balance | $3,440,094 | $7,345,603 | $11,761,271 |
8.7 Projected Balance Sheet
The balance sheet in the following table shows managed but sufficient growth of net worth, and a sufficiently healthy financial position. The monthly estimates are included in the appendices.
| Pro Forma Balance Sheet | |||
| Year 1 | Year 2 | Year 3 | |
| Assets | |||
| Current Assets | |||
| Cash | $3,440,094 | $7,345,603 | $11,761,271 |
| Inventory | $66,090 | $75,607 | $87,326 |
| Other Current Assets | $17,000 | $17,000 | $17,000 |
| Total Current Assets | $3,523,184 | $7,438,209 | $11,865,597 |
| Long-term Assets | |||
| Long-term Assets | $175,000 | $175,000 | $175,000 |
| Accumulated Depreciation | $12,000 | $24,000 | $36,000 |
| Total Long-term Assets | $163,000 | $151,000 | $139,000 |
| Total Assets | $3,686,184 | $7,589,209 | $12,004,597 |
| Liabilities and Capital | Year 1 | Year 2 | Year 3 |
| Current Liabilities | |||
| Accounts Payable | $209,488 | $356,823 | $415,509 |
| Current Borrowing | $20 | $20 | $20 |
| Other Current Liabilities | $0 | $0 | $0 |
| Subtotal Current Liabilities | $209,508 | $356,843 | $415,529 |
| Long-term Liabilities | $33,100 | $25,100 | $16,100 |
| Total Liabilities | $242,608 | $381,943 | $431,629 |
| Paid-in Capital | $450,420 | $450,420 | $450,420 |
| Retained Earnings | ($278,420) | $2,743,156 | $6,256,847 |
| Earnings | $3,271,576 | $4,013,690 | $4,865,701 |
| Total Capital | $3,443,576 | $7,207,267 | $11,572,967 |
| Total Liabilities and Capital | $3,686,184 | $7,589,209 | $12,004,597 |
| Net Worth | $3,443,576 | $7,207,267 | $11,572,967 |
Appendix
| Sales Forecast | |||||||||||||
| Month 1 | Month 2 | Month 3 | Month 4 | Month 5 | Month 6 | Month 7 | Month 8 | Month 9 | Month 10 | Month 11 | Month 12 | ||
| Unit Sales | |||||||||||||
| Lunch Sales | 0% | 5,130 | 5,940 | 10,395 | 10,395 | 10,395 | 5,940 | 5,130 | 5,130 | 5,130 | 5,130 | 5,130 | 5,130 |
| High Tea Sales | 0% | 810 | 810 | 810 | 810 | 810 | 810 | 810 | 810 | 810 | 810 | 810 | 810 |
| Dinner Sales | 0% | 2,970 | 3,780 | 10,395 | 10,395 | 10,395 | 5,000 | 5,000 | 4,000 | 3,700 | 3,500 | 3,700 | 3,500 |
| Dinner Show Sales | 0% | 2,727 | 5,427 | 8,640 | 8,640 | 8,640 | 7,000 | 6,000 | 5,000 | 5,000 | 4,000 | 3,000 | 4,000 |
| Bar Sales | 0% | 1,350 | 1,350 | 5,400 | 5,400 | 5,400 | 1,350 | 1,350 | 1,350 | 1,350 | 1,350 | 1,350 | 1,350 |
| Be In the Show Sales | 0% | 270 | 270 | 270 | 270 | 270 | 270 | 270 | 270 | 270 | 270 | 270 | 270 |
| Catering Sales | 0% | 0 | 0 | 0 | 1 | 1 | 0 | 0 | 0 | 2 | 0 | 0 | 0 |
| Total Unit Sales | 13,257 | 17,577 | 35,910 | 35,911 | 35,911 | 20,370 | 18,560 | 16,560 | 16,262 | 15,060 | 14,260 | 15,060 | |
| Unit Prices | Month 1 | Month 2 | Month 3 | Month 4 | Month 5 | Month 6 | Month 7 | Month 8 | Month 9 | Month 10 | Month 11 | Month 12 | |
| Lunch Sales | $14.00 | $14.00 | $14.00 | $14.00 | $14.00 | $14.00 | $14.00 | $14.00 | $14.00 | $14.00 | $14.00 | $14.00 | |
| High Tea Sales | $18.00 | $18.00 | $18.00 | $18.00 | $18.00 | $18.00 | $18.00 | $18.00 | $18.00 | $18.00 | $18.00 | $18.00 | |
| Dinner Sales | $24.00 | $24.00 | $24.00 | $24.00 | $24.00 | $24.00 | $24.00 | $24.00 | $24.00 | $24.00 | $24.00 | $24.00 | |
| Dinner Show Sales | $55.00 | $55.00 | $55.00 | $55.00 | $55.00 | $55.00 | $55.00 | $55.00 | $55.00 | $55.00 | $55.00 | $55.00 | |
| Bar Sales | $20.00 | $20.00 | $35.00 | $35.00 | $35.00 | $20.00 | $20.00 | $20.00 | $20.00 | $20.00 | $20.00 | $20.00 | |
| Be In the Show Sales | $65.00 | $65.00 | $65.00 | $65.00 | $65.00 | $65.00 | $65.00 | $65.00 | $65.00 | $65.00 | $65.00 | $65.00 | |
| Catering Sales | $0.00 | $0.00 | $0.00 | $9,000.00 | $10,000.00 | $0.00 | $0.00 | $0.00 | $5,000.00 | $0.00 | $0.00 | $0.00 | |
| Sales | |||||||||||||
| Lunch Sales | $71,820 | $83,160 | $145,530 | $145,530 | $145,530 | $83,160 | $71,820 | $71,820 | $71,820 | $71,820 | $71,820 | $71,820 | |
| High Tea Sales | $14,580 | $14,580 | $14,580 | $14,580 | $14,580 | $14,580 | $14,580 | $14,580 | $14,580 | $14,580 | $14,580 | $14,580 | |
| Dinner Sales | $71,280 | $90,720 | $249,480 | $249,480 | $249,480 | $120,000 | $120,000 | $96,000 | $88,800 | $84,000 | $88,800 | $84,000 | |
| Dinner Show Sales | $149,985 | $298,485 | $475,200 | $475,200 | $475,200 | $385,000 | $330,000 | $275,000 | $275,000 | $220,000 | $165,000 | $220,000 | |
| Bar Sales | $27,000 | $27,000 | $189,000 | $189,000 | $189,000 | $27,000 | $27,000 | $27,000 | $27,000 | $27,000 | $27,000 | $27,000 | |
| Be In the Show Sales | $17,550 | $17,550 | $17,550 | $17,550 | $17,550 | $17,550 | $17,550 | $17,550 | $17,550 | $17,550 | $17,550 | $17,550 | |
| Catering Sales | $0 | $0 | $0 | $9,000 | $10,000 | $0 | $0 | $0 | $10,000 | $0 | $0 | $0 | |
| Total Sales | $352,215 | $531,495 | $1,091,340 | $1,100,340 | $1,101,340 | $647,290 | $580,950 | $501,950 | $504,750 | $434,950 | $384,750 | $434,950 | |
| Direct Unit Costs | Month 1 | Month 2 | Month 3 | Month 4 | Month 5 | Month 6 | Month 7 | Month 8 | Month 9 | Month 10 | Month 11 | Month 12 | |
| Lunch Sales | 38.00% | $5.32 | $5.32 | $5.32 | $5.32 | $5.32 | $5.32 | $5.32 | $5.32 | $5.32 | $5.32 | $5.32 | $5.32 |
| High Tea Sales | 38.00% | $6.84 | $6.84 | $6.84 | $6.84 | $6.84 | $6.84 | $6.84 | $6.84 | $6.84 | $6.84 | $6.84 | $6.84 |
| Dinner Sales | 36.00% | $8.64 | $8.64 | $8.64 | $8.64 | $8.64 | $8.64 | $8.64 | $8.64 | $8.64 | $8.64 | $8.64 | $8.64 |
| Dinner Show Sales | 25.00% | $13.75 | $13.75 | $13.75 | $13.75 | $13.75 | $13.75 | $13.75 | $13.75 | $13.75 | $13.75 | $13.75 | $13.75 |
| Bar Sales | 36.00% | $7.20 | $7.20 | $12.60 | $12.60 | $12.60 | $7.20 | $7.20 | $7.20 | $7.20 | $7.20 | $7.20 | $7.20 |
| Be In the Show Sales | 25.00% | $16.25 | $16.25 | $16.25 | $16.25 | $16.25 | $16.25 | $16.25 | $16.25 | $16.25 | $16.25 | $16.25 | $16.25 |
| Catering Sales | 55.00% | $0.00 | $0.00 | $0.00 | $4,950.00 | $5,500.00 | $0.00 | $0.00 | $0.00 | $2,750.00 | $0.00 | $0.00 | $0.00 |
| Direct Cost of Sales | |||||||||||||
| Lunch Sales | $27,292 | $31,601 | $55,301 | $55,301 | $55,301 | $31,601 | $27,292 | $27,292 | $27,292 | $27,292 | $27,292 | $27,292 | |
| High Tea Sales | $5,540 | $5,540 | $5,540 | $5,540 | $5,540 | $5,540 | $5,540 | $5,540 | $5,540 | $5,540 | $5,540 | $5,540 | |
| Dinner Sales | $25,661 | $32,659 | $89,813 | $89,813 | $89,813 | $43,200 | $43,200 | $34,560 | $31,968 | $30,240 | $31,968 | $30,240 | |
| Dinner Show Sales | $37,496 | $74,621 | $118,800 | $118,800 | $118,800 | $96,250 | $82,500 | $68,750 | $68,750 | $55,000 | $41,250 | $55,000 | |
| Bar Sales | $9,720 | $9,720 | $68,040 | $68,040 | $68,040 | $9,720 | $9,720 | $9,720 | $9,720 | $9,720 | $9,720 | $9,720 | |
| Be In the Show Sales | $4,388 | $4,388 | $4,388 | $4,388 | $4,388 | $4,388 | $4,388 | $4,388 | $4,388 | $4,388 | $4,388 | $4,388 | |
| Catering Sales | $0 | $0 | $0 | $4,950 | $5,500 | $0 | $0 | $0 | $5,500 | $0 | $0 | $0 | |
| Subtotal Direct Cost of Sales | $110,097 | $158,529 | $341,882 | $346,832 | $347,382 | $190,699 | $172,640 | $150,250 | $153,158 | $132,180 | $120,158 | $132,180 | |
| Personnel Plan | |||||||||||||
| Month 1 | Month 2 | Month 3 | Month 4 | Month 5 | Month 6 | Month 7 | Month 8 | Month 9 | Month 10 | Month 11 | Month 12 | ||
| Executive Chef Joachim Oignons-owner | 0% | $4,000 | $5,000 | $5,000 | $5,000 | $5,000 | $5,000 | $5,000 | $5,000 | $5,000 | $5,000 | $5,000 | $5,000 |
| Serving Staff Manager | 0% | $3,000 | $3,000 | $3,000 | $3,000 | $3,000 | $3,000 | $3,000 | $3,000 | $3,000 | $3,000 | $3,000 | $3,000 |
| Sommelier/Bar Manager | 0% | $3,000 | $3,000 | $3,000 | $3,000 | $3,000 | $3,000 | $3,000 | $3,000 | $3,000 | $3,000 | $3,000 | $3,000 |
| Performance Manager | 0% | $3,000 | $3,000 | $3,000 | $3,000 | $3,000 | $3,000 | $3,000 | $3,000 | $3,000 | $3,000 | $3,000 | $3,000 |
| Host/Serving Staff | 0% | $10,752 | $10,752 | $10,752 | $10,752 | $10,752 | $10,752 | $10,752 | $10,752 | $10,752 | $10,752 | $10,752 | $10,752 |
| Kitchen Staff | 0% | $14,112 | $14,112 | $14,112 | $14,112 | $14,112 | $14,112 | $14,112 | $14,112 | $14,112 | $14,112 | $14,112 | $14,112 |
| Performance Staff | 0% | $10,368 | $10,368 | $10,368 | $10,368 | $10,368 | $10,368 | $10,368 | $10,368 | $10,368 | $10,368 | $10,368 | $10,368 |
| Bar Staff | 0% | $2,688 | $2,688 | $2,688 | $2,688 | $2,688 | $2,688 | $2,688 | $2,688 | $2,688 | $2,688 | $2,688 | $2,688 |
| Bookkeeper/Office Assistant | 0% | $1,000 | $1,000 | $1,000 | $1,000 | $1,000 | $1,000 | $1,000 | $1,000 | $1,000 | $1,000 | $1,000 | $1,000 |
| Total People | 0 | 0 | 0 | 0 | 0 | 0 | 0 | 0 | 0 | 0 | 0 | 0 | |
| Total Payroll | $51,920 | $52,920 | $52,920 | $52,920 | $52,920 | $52,920 | $52,920 | $52,920 | $52,920 | $52,920 | $52,920 | $52,920 | |
| General Assumptions | |||||||||||||
| Month 1 | Month 2 | Month 3 | Month 4 | Month 5 | Month 6 | Month 7 | Month 8 | Month 9 | Month 10 | Month 11 | Month 12 | ||
| Plan Month | 1 | 2 | 3 | 4 | 5 | 6 | 7 | 8 | 9 | 10 | 11 | 12 | |
| Current Interest Rate | 10.00% | 10.00% | 10.00% | 10.00% | 10.00% | 10.00% | 10.00% | 10.00% | 10.00% | 10.00% | 10.00% | 10.00% | |
| Long-term Interest Rate | 8.20% | 8.20% | 8.20% | 8.20% | 8.20% | 8.20% | 8.20% | 8.20% | 8.20% | 8.20% | 8.20% | 8.20% | |
| Tax Rate | 25.00% | 25.00% | 25.00% | 25.00% | 25.00% | 25.00% | 25.00% | 25.00% | 25.00% | 25.00% | 25.00% | 25.00% | |
| Other | 0 | 0 | 0 | 0 | 0 | 0 | 0 | 0 | 0 | 0 | 0 | 0 | |
| Pro Forma Profit and Loss | |||||||||||||
| Month 1 | Month 2 | Month 3 | Month 4 | Month 5 | Month 6 | Month 7 | Month 8 | Month 9 | Month 10 | Month 11 | Month 12 | ||
| Sales | $352,215 | $531,495 | $1,091,340 | $1,100,340 | $1,101,340 | $647,290 | $580,950 | $501,950 | $504,750 | $434,950 | $384,750 | $434,950 | |
| Direct Cost of Sales | $110,097 | $158,529 | $341,882 | $346,832 | $347,382 | $190,699 | $172,640 | $150,250 | $153,158 | $132,180 | $120,158 | $132,180 | |
| Other Production Expenses | $0 | $0 | $0 | $0 | $0 | $0 | $0 | $0 | $0 | $0 | $0 | $0 | |
| Total Cost of Sales | $110,097 | $158,529 | $341,882 | $346,832 | $347,382 | $190,699 | $172,640 | $150,250 | $153,158 | $132,180 | $120,158 | $132,180 | |
| Gross Margin | $242,118 | $372,966 | $749,458 | $753,508 | $753,958 | $456,591 | $408,311 | $351,701 | $351,593 | $302,771 | $264,593 | $302,771 | |
| Gross Margin % | 68.74% | 70.17% | 68.67% | 68.48% | 68.46% | 70.54% | 70.28% | 70.07% | 69.66% | 69.61% | 68.77% | 69.61% | |
| Expenses | |||||||||||||
| Payroll | $51,920 | $52,920 | $52,920 | $52,920 | $52,920 | $52,920 | $52,920 | $52,920 | $52,920 | $52,920 | $52,920 | $52,920 | |
| Sales and Marketing and Other Expenses | $2,846 | $3,671 | $3,671 | $3,671 | $3,671 | $3,671 | $12,671 | $13,671 | $13,671 | $14,251 | $13,671 | $3,671 | |
| Depreciation | $1,000 | $1,000 | $1,000 | $1,000 | $1,000 | $1,000 | $1,000 | $1,000 | $1,000 | $1,000 | $1,000 | $1,000 | |
| MICROS syterm, phones, security, fire, computer upgrades | $0 | $0 | $0 | $0 | $0 | $0 | $0 | $0 | $0 | $10,000 | $0 | $0 | |
| Exterminating | $25 | $25 | $25 | $25 | $25 | $25 | $25 | $25 | $25 | $25 | $25 | $25 | |
| Ceramic/Glass/Silver Upkeep | $200 | $200 | $200 | $200 | $200 | $200 | $200 | $200 | $200 | $200 | $200 | $200 | |
| Maintenance/Repairs | $0 | $2,000 | $2,000 | $2,000 | $2,000 | $2,000 | $2,000 | $2,000 | $2,000 | $2,000 | $2,000 | $2,000 | |
| Linen and Dry Cleaning | $175 | $175 | $175 | $175 | $175 | $175 | $175 | $175 | $175 | $175 | $175 | $175 | |
| Dish and Cleaning Supplies | $400 | $400 | $400 | $400 | $400 | $400 | $400 | $400 | $400 | $400 | $400 | $400 | |
| Office Products Upkeep | $200 | $200 | $200 | $200 | $200 | $200 | $200 | $200 | $200 | $200 | $200 | $200 | |
| Paper Products Upkeep | $800 | $800 | $800 | $800 | $800 | $800 | $800 | $800 | $800 | $800 | $800 | $800 | |
| Utilities | $1,430 | $1,430 | $1,430 | $1,430 | $1,430 | $1,430 | $2,430 | $3,430 | $3,430 | $3,430 | $3,430 | $3,430 | |
| Insurance | $717 | $717 | $717 | $717 | $717 | $717 | $717 | $717 | $717 | $717 | $717 | $717 | |
| Rent | $1,400 | $4,400 | $4,400 | $4,400 | $4,400 | $4,400 | $4,400 | $4,400 | $4,400 | $4,400 | $4,400 | $4,400 | |
| Employee Healthcare | $3,000 | $3,000 | $3,000 | $3,000 | $3,000 | $3,000 | $3,000 | $3,000 | $3,000 | $3,000 | $3,000 | $3,000 | |
| Comps/Donations/Handouts | 15% | $2,500 | $2,500 | $2,500 | $2,500 | $2,500 | $2,500 | $2,500 | $2,500 | $2,500 | $2,500 | $2,500 | $2,500 |
| Payroll Taxes | 15% | $0 | $0 | $0 | $0 | $0 | $0 | $0 | $0 | $0 | $0 | $0 | $0 |
| Total Operating Expenses | $66,613 | $73,438 | $73,438 | $73,438 | $73,438 | $73,438 | $83,438 | $85,438 | $85,438 | $96,018 | $85,438 | $75,438 | |
| Profit Before Interest and Taxes | $175,505 | $299,528 | $676,020 | $680,070 | $680,520 | $383,153 | $324,872 | $266,262 | $266,154 | $206,752 | $179,154 | $227,333 | |
| EBITDA | $176,505 | $300,528 | $677,020 | $681,070 | $681,520 | $384,153 | $325,872 | $267,262 | $267,154 | $207,752 | $180,154 | $228,333 | |
| Interest Expense | $311 | $303 | $295 | $288 | $280 | $272 | $265 | $257 | $249 | $242 | $234 | $226 | |
| Taxes Incurred | $43,799 | $74,806 | $168,931 | $169,946 | $170,060 | $95,720 | $81,152 | $66,501 | $66,476 | $51,628 | $44,730 | $56,777 | |
| Net Profit | $131,396 | $224,419 | $506,793 | $509,837 | $510,180 | $287,161 | $243,456 | $199,504 | $199,429 | $154,883 | $134,190 | $170,330 | |
| Net Profit/Sales | 37.31% | 42.22% | 46.44% | 46.33% | 46.32% | 44.36% | 41.91% | 39.75% | 39.51% | 35.61% | 34.88% | 39.16% | |
| Pro Forma Cash Flow | |||||||||||||
| Month 1 | Month 2 | Month 3 | Month 4 | Month 5 | Month 6 | Month 7 | Month 8 | Month 9 | Month 10 | Month 11 | Month 12 | ||
| Cash Received | |||||||||||||
| Cash from Operations | |||||||||||||
| Cash Sales | $352,215 | $531,495 | $1,091,340 | $1,100,340 | $1,101,340 | $647,290 | $580,950 | $501,950 | $504,750 | $434,950 | $384,750 | $434,950 | |
| Subtotal Cash from Operations | $352,215 | $531,495 | $1,091,340 | $1,100,340 | $1,101,340 | $647,290 | $580,950 | $501,950 | $504,750 | $434,950 | $384,750 | $434,950 | |
| Additional Cash Received | |||||||||||||
| Sales Tax, VAT, HST/GST Received | 7.00% | $24,655 | $37,205 | $76,394 | $77,024 | $77,094 | $45,310 | $40,667 | $35,137 | $35,333 | $30,447 | $26,933 | $30,447 |
| New Current Borrowing | $0 | $0 | $0 | $0 | $0 | $0 | $0 | $0 | $0 | $0 | $0 | $0 | |
| New Other Liabilities (interest-free) | $0 | $0 | $0 | $0 | $0 | $0 | $0 | $0 | $0 | $0 | $0 | $0 | |
| New Long-term Liabilities | $0 | $0 | $0 | $0 | $0 | $0 | $0 | $0 | $0 | $0 | $0 | $0 | |
| Sales of Other Current Assets | $0 | $0 | $0 | $0 | $0 | $0 | $0 | $0 | $0 | $0 | $0 | $0 | |
| Sales of Long-term Assets | $0 | $0 | $0 | $0 | $0 | $0 | $0 | $0 | $0 | $0 | $0 | $0 | |
| New Investment Received | $0 | $0 | $0 | $0 | $0 | $0 | $0 | $0 | $0 | $0 | $0 | $0 | |
| Subtotal Cash Received | $376,870 | $568,700 | $1,167,734 | $1,177,364 | $1,178,434 | $692,600 | $621,617 | $537,087 | $540,083 | $465,397 | $411,683 | $465,397 | |
| Expenditures | Month 1 | Month 2 | Month 3 | Month 4 | Month 5 | Month 6 | Month 7 | Month 8 | Month 9 | Month 10 | Month 11 | Month 12 | |
| Expenditures from Operations | |||||||||||||
| Cash Spending | $51,920 | $52,920 | $52,920 | $52,920 | $52,920 | $52,920 | $52,920 | $52,920 | $52,920 | $52,920 | $52,920 | $52,920 | |
| Bill Payments | $4,932 | $152,261 | $288,870 | $619,528 | $539,007 | $527,194 | $229,424 | $273,304 | $237,848 | $251,615 | $214,824 | $191,498 | |
| Subtotal Spent on Operations | $56,852 | $205,181 | $341,790 | $672,448 | $591,927 | $580,114 | $282,344 | $326,224 | $290,768 | $304,535 | $267,744 | $244,418 | |
| Additional Cash Spent | |||||||||||||
| Sales Tax, VAT, HST/GST Paid Out | $24,655 | $37,205 | $76,394 | $77,024 | $77,094 | $45,310 | $40,667 | $35,137 | $35,333 | $30,447 | $26,933 | $30,447 | |
| Principal Repayment of Current Borrowing | $450 | $450 | $450 | $450 | $450 | $450 | $450 | $450 | $450 | $450 | $450 | $450 | |
| Other Liabilities Principal Repayment | $0 | $0 | $0 | $0 | $0 | $0 | $0 | $0 | $0 | $0 | $0 | $0 | |
| Long-term Liabilities Principal Repayment | $575 | $575 | $575 | $575 | $575 | $575 | $575 | $575 | $575 | $575 | $575 | $575 | |
| Purchase Other Current Assets | $0 | $0 | $0 | $0 | $0 | $0 | $0 | $0 | $0 | $0 | $0 | $0 | |
| Purchase Long-term Assets | $0 | $0 | $0 | $0 | $0 | $0 | $0 | $0 | $0 | $0 | $0 | $0 | |
| Dividends | $0 | $0 | $0 | $0 | $0 | $0 | $0 | $0 | $0 | $0 | $0 | $100,000 | |
| Subtotal Cash Spent | $82,532 | $243,411 | $419,209 | $750,497 | $670,046 | $626,449 | $324,035 | $362,386 | $327,126 | $336,007 | $295,701 | $375,890 | |
| Net Cash Flow | $294,338 | $325,289 | $748,525 | $426,867 | $508,388 | $66,151 | $297,581 | $174,701 | $212,957 | $129,390 | $115,981 | $89,507 | |
| Cash Balance | $344,758 | $670,047 | $1,418,571 | $1,845,438 | $2,353,826 | $2,419,978 | $2,717,559 | $2,892,260 | $3,105,216 | $3,234,606 | $3,350,587 | $3,440,094 | |
| Pro Forma Balance Sheet | |||||||||||||
| Month 1 | Month 2 | Month 3 | Month 4 | Month 5 | Month 6 | Month 7 | Month 8 | Month 9 | Month 10 | Month 11 | Month 12 | ||
| Assets | Starting Balances | ||||||||||||
| Current Assets | |||||||||||||
| Cash | $50,420 | $344,758 | $670,047 | $1,418,571 | $1,845,438 | $2,353,826 | $2,419,978 | $2,717,559 | $2,892,260 | $3,105,216 | $3,234,606 | $3,350,587 | $3,440,094 |
| Inventory | $75,000 | $55,048 | $79,265 | $170,941 | $173,416 | $173,691 | $95,349 | $86,320 | $75,125 | $76,579 | $66,090 | $60,079 | $66,090 |
| Other Current Assets | $17,000 | $17,000 | $17,000 | $17,000 | $17,000 | $17,000 | $17,000 | $17,000 | $17,000 | $17,000 | $17,000 | $17,000 | $17,000 |
| Total Current Assets | $142,420 | $416,807 | $766,312 | $1,606,513 | $2,035,854 | $2,544,517 | $2,532,327 | $2,820,879 | $2,984,385 | $3,198,795 | $3,317,696 | $3,427,666 | $3,523,184 |
| Long-term Assets | |||||||||||||
| Long-term Assets | $175,000 | $175,000 | $175,000 | $175,000 | $175,000 | $175,000 | $175,000 | $175,000 | $175,000 | $175,000 | $175,000 | $175,000 | $175,000 |
| Accumulated Depreciation | $0 | $1,000 | $2,000 | $3,000 | $4,000 | $5,000 | $6,000 | $7,000 | $8,000 | $9,000 | $10,000 | $11,000 | $12,000 |
| Total Long-term Assets | $175,000 | $174,000 | $173,000 | $172,000 | $171,000 | $170,000 | $169,000 | $168,000 | $167,000 | $166,000 | $165,000 | $164,000 | $163,000 |
| Total Assets | $317,420 | $590,807 | $939,312 | $1,778,513 | $2,206,854 | $2,714,517 | $2,701,327 | $2,988,879 | $3,151,385 | $3,364,795 | $3,482,696 | $3,591,666 | $3,686,184 |
| Liabilities and Capital | Month 1 | Month 2 | Month 3 | Month 4 | Month 5 | Month 6 | Month 7 | Month 8 | Month 9 | Month 10 | Month 11 | Month 12 | |
| Current Liabilities | |||||||||||||
| Accounts Payable | $0 | $143,016 | $268,127 | $601,560 | $521,090 | $519,598 | $220,272 | $265,393 | $229,420 | $244,427 | $208,469 | $184,274 | $209,488 |
| Current Borrowing | $5,420 | $4,970 | $4,520 | $4,070 | $3,620 | $3,170 | $2,720 | $2,270 | $1,820 | $1,370 | $920 | $470 | $20 |
| Other Current Liabilities | $0 | $0 | $0 | $0 | $0 | $0 | $0 | $0 | $0 | $0 | $0 | $0 | $0 |
| Subtotal Current Liabilities | $5,420 | $147,986 | $272,647 | $605,630 | $524,710 | $522,768 | $222,992 | $267,663 | $231,240 | $245,797 | $209,389 | $184,744 | $209,508 |
| Long-term Liabilities | $40,000 | $39,425 | $38,850 | $38,275 | $37,700 | $37,125 | $36,550 | $35,975 | $35,400 | $34,825 | $34,250 | $33,675 | $33,100 |
| Total Liabilities | $45,420 | $187,411 | $311,497 | $643,905 | $562,410 | $559,893 | $259,542 | $303,638 | $266,640 | $280,622 | $243,639 | $218,419 | $242,608 |
| Paid-in Capital | $450,420 | $450,420 | $450,420 | $450,420 | $450,420 | $450,420 | $450,420 | $450,420 | $450,420 | $450,420 | $450,420 | $450,420 | $450,420 |
| Retained Earnings | ($178,420) | ($178,420) | ($178,420) | ($178,420) | ($178,420) | ($178,420) | ($178,420) | ($178,420) | ($178,420) | ($178,420) | ($178,420) | ($178,420) | ($278,420) |
| Earnings | $0 | $131,396 | $355,815 | $862,608 | $1,372,444 | $1,882,624 | $2,169,785 | $2,413,241 | $2,612,745 | $2,812,173 | $2,967,057 | $3,101,247 | $3,271,576 |
| Total Capital | $272,000 | $403,396 | $627,815 | $1,134,608 | $1,644,444 | $2,154,624 | $2,441,785 | $2,685,241 | $2,884,745 | $3,084,173 | $3,239,057 | $3,373,247 | $3,443,576 |
| Total Liabilities and Capital | $317,420 | $590,807 | $939,312 | $1,778,513 | $2,206,854 | $2,714,517 | $2,701,327 | $2,988,879 | $3,151,385 | $3,364,795 | $3,482,696 | $3,591,666 | $3,686,184 |
| Net Worth | $272,000 | $403,396 | $627,815 | $1,134,608 | $1,644,444 | $2,154,624 | $2,441,785 | $2,685,241 | $2,884,745 | $3,084,173 | $3,239,057 | $3,373,247 | $3,443,576 |

