
Rocks by Request
Executive Summary
Purchasing an engagement ring could be a hassle, especially for those who know little about diamonds. Current studies indicate that there are 1.7 million engagement rings purchased per year in the United States (74% of brides, from 2.3 million weddings), with an average expenditure of approximately $2,000 per diamond engagement ring.
With the revolution in connectivity and interactivity through the Internet, potential buyers can learn more about the characteristics of diamonds they intend to buy before going to jewelers. In this case, we solve that very problem of “knowing so little” about the characteristics of the merchandise. People can now learn and gather information before they actually going to their family/neighborhood jewelers to purchase diamonds.
Learning and gathering information on the Internet is not what the online retailers want. They want the learning and gathering process to translate into sales. However, selling diamonds online is not the same as selling books online. People want to see the actual merchandise before buying. “What happens if the brilliance of the diamond shown on the Web is actually lower than in the one I purchased?”
It is the question of how to leverage “high-touch” among the high-end dot-com retailers. While others engaging in low-end jewelry items have been primarily pushing the quantity sold, we struggle to find the right formula to bring these high-end loose diamonds to consumers.
Rocks by Request (RBR) is the answer to this. RBR was established in the Bay Area three years ago, by a third-generation jeweler, Rock Stone. After its three-year operation, RBR is planning to expand its operations outside the state of California. The RBR concept is quite simple, leveraging local jewelers as its “front-end.” Through this strategy, RBR answers both “credibility” and “high touch” issues in selling its high-end merchandise via the Internet.
RBR is positioning itself differently in the aftermath of the dot-com bust. While maintaining connectivity, interactivity, and speed, RBR will also “humanize” e-commerce by combining both technology and tradition in diamond retail industry.
In this strategic plan, we describe how to further optimize the connectivity, interactivity, and speed in developing recommendations for RBR’s new business strategy.
1.1 Objectives
- To develop an additional course(s) of action, recommendation, and change(s) to RBR’s current strategy in order to expand the market share in the loose diamond e-tailing industry.
- To advise RBR of industry insights and market trends in the diamond business, provide a psychographic study of the current and potential engagement market, and describe the competitive landscape of this business.
1.2 Mission
Our mission is to expand our current 2% market share to a greater portion in online diamond retail. When we look at the diamond retailing industry itself, the current 2% is rather low compared to the number of diamonds sold yearly in the United States. In order to meet the growth criteria, RBR must extend its network of jewelers and strengthen alliances with media and Internet vendors, as well as increase its R&D effort to deliver the latest technology in e-commerce.
1.3 Keys to Success
Some of the key factors that will help RBR expand its operations include:
- Extending its network of family jewelers across the U.S. and globally.
- Setting up additional warehouses to meet the needs.
- Improving logistic/supply chain that enables fast delivery and return.
- Repositioning the look of the current website by upgrading graphic elements and state-of-the-art navigation.
- Setting up alliances with supporting media and the Internet to promote the idea of purchasing loose diamonds online.
- Adding more product categories into the existing loose diamond category, such as gold settings for pendants, rings, and earrings, and gold trinkets/accessories aimed at younger audience.

Company Summary
Rocks by Request (RBR) is different from other e-business diamond retailers. Most of them are brokers, which means that they go to the diamond wholesalers (who buy from cutters) and give each wholesaler a back-end password to update their inventory. RBR purchases its diamonds, which gives us control over the merchandise, such as the flexibility to ship the diamond to local jewelers, while most of the competitors are in consignment agreements with stone cutters to distribute the loose diamonds.
RBR uses a combination of cyberspace and traditional methods for its business model. The purpose is to leverage a “high touch” perception, which is the main “show” in the diamond business. RBR also applies a slightly different approach from other hybrid Internet companies, by using local stores across California as its “front-end” to its customers; most of them own the brick-and-mortar as well as the Internet business.
The business model is appealing for local jewelers who are aware of the importance of e-commerce but are unsure how to use it to expand their business. The RBR model benefits both RBR and local jewelers participating in the program by using the strengths of each. RBR obtains customers in different geographical areas, and the local jewelers widen their customer base, while generating more revenue.
2.1 Company History
Rocks by Request was established in three years ago as an answer to the dot com re-invention. Rock Stone, the visionary behind the brand, created a fusion of traditional brick-and-mortar concept with the touch of connectivity. Mr. Stone did not merely extend the family business, but transform it into the business of the future. The initial funding was partially from Mr. Stone’s savings and from father’s company, including the a substantial number of loose diamonds. After showing a promising growth in three year of operation, Mr. Stone is optimistic that his business will grow further into a world class venture through own financing. He realizes that marketing is the key to “pull” the interest of people to try, as well as expanding distribution outlet by cooperating with local jewelers.
Unlike other e-commerce that involves in selling diamonds online, RBR has a unique approach in establishing its identity. First, RBR does not operate the dot-com’s “virtual store” like the Blue Nile, Diamonds.com, and the rest of e-tailers in the industry. And second, RBR does not identify itself with the dot-com revolution, but as the traditional wholesaler that goes connected with the new economy, of course with the help of the Internet, RBR can now enter the retailing arena in selling diamonds to end consumers.
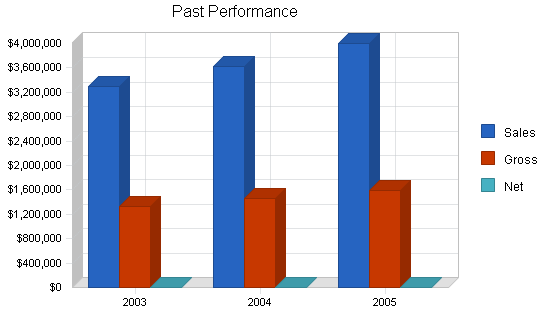
| Past Performance | |||
| 2003 | 2004 | 2005 | |
| Sales | $3,300,000 | $3,630,000 | $3,993,000 |
| Gross Margin | $1,320,000 | $1,452,000 | $1,597,200 |
| Gross Margin % | 40.00% | 40.00% | 40.00% |
| Operating Expenses | $900,000 | $900,000 | $900,000 |
| Inventory Turnover | 0.00 | 0.00 | 7.99 |
| Balance Sheet | |||
| 2003 | 2004 | 2005 | |
| Current Assets | |||
| Cash | $3,080,000 | $2,752,000 | $2,287,000 |
| Inventory | $0 | $0 | $600,000 |
| Other Current Assets | $600,000 | $200,000 | $30,000 |
| Total Current Assets | $3,680,000 | $2,952,000 | $2,917,000 |
| Long-term Assets | |||
| Long-term Assets | $0 | $0 | $0 |
| Accumulated Depreciation | $0 | $0 | $0 |
| Total Long-term Assets | $0 | $0 | $0 |
| Total Assets | $3,680,000 | $2,952,000 | $2,917,000 |
| Current Liabilities | |||
| Accounts Payable | $260,000 | $200,000 | $120,000 |
| Current Borrowing | $0 | $0 | $0 |
| Other Current Liabilities (interest free) | $0 | $0 | $0 |
| Total Current Liabilities | $260,000 | $200,000 | $120,000 |
| Long-term Liabilities | $0 | $0 | $0 |
| Total Liabilities | $260,000 | $200,000 | $120,000 |
| Paid-in Capital | $3,000,000 | $2,200,000 | $1,500,000 |
| Retained Earnings | $420,000 | $552,000 | $1,297,000 |
| Earnings | $0 | $0 | $0 |
| Total Capital | $3,420,000 | $2,752,000 | $2,797,000 |
| Total Capital and Liabilities | $3,680,000 | $2,952,000 | $2,917,000 |
| Other Inputs | |||
| Payment Days | 30 | 30 | 30 |
2.2 Company Ownership
The company is privately held. The Managing Director of RBR is a third-generation diamond trader, and has already established long-term relationships with local jewelry stores and end customers, some of whom are the third generation of patrons and long-time family clients. In the next growth installment, RBR is open to selling portions of the company’s ownership to investors.
2.3 Company Locations and Facilities
The company currently operates two offices. For strategic and marketing purposes, RBR is headquartered in a building mainly occupied by jewelry suppliers, from loose diamond wholesalers, to precious/semi precious stone suppliers, to jewelry retail stores. It is a destination stop in the city, known for a good bargain in certified loose-diamond jewelry.

RBR also operates a warehouse equipped with state-of-the-art technology that enables quick processing in delivering and returning the loose diamonds to and from partner jewelers.
The employees working at the warehouse include four controllers, who are responsible in finance and accounting, one programmer (who also maintains IT), one buyer who goes out to diamond cutters and selects the products for inventory, and one sales person.
Products
RBR’s main product is loose diamonds, from emerald-cut to round-cut diamonds, with brilliant color and V VS 1, meaning Very, Very Slightly Included, or an excellent quality diamond. All of RBR’s diamonds are GIA certified (Gemological Institute of America™) with laser inscription inside. RBR was positioned as a diamond wholesaler rather than a retailer in the past. RBR had been supplying local jewelers in the area for more than twenty years and maintained very strong relationships.
In the diamond business, we determine the price of a diamond according to the “4C” criteria:
Clarity: The most expensive diamond is the one that is absolutely clear in clarity, but many of them have inclusions (scratches or trace minerals) that can detract from the pure beauty of the diamond. Clarity has several categories that affect the price of a diamond: FL (Flawless, no internal/external flaws), VVS1, VVS2 (Very, Very Slightly Included, an excellent quality of diamond), VS1, VS2 (Very Slightly Included, not visible to the eye), S1, S2 (Slightly Included, may be visible to the eye), I1, I2, I3 (Included, the lowest grades of clarity). RBR does not carry the last two clarity grades in its inventory.
Color: A diamond can divide light into a spectrum of colors, and reflect light as more or less colorful, depending on the color grade. The less color in a diamond, the better the color grade. Color grades are categorized into D (absolutely colorless, the highest color grade), E (colorless, only traces of color and only detected by gemologists), F (colorless, slight color detected, still a high quality diamond), G-H (near colorless, color noticeable, but still an excellent value), I-J (near colorless, color slightly detectable), K-M (low grade color), N-Z (low grade color). RBR does not carry the last three color grades in its inventory to maintain a good selection of diamonds.
Cut: The roundness, depth, width and uniformity of the facets determine a diamond’s brilliance. Cut is the most important characteristic of a diamond; even with perfect color and clarity, a poor cut will affect its brilliance.
Carat: The weight of a diamond. In the engagement-ring market today, usually the “dowry” is around 1 carat and above.
3.1 Product Description
RBR carries various diamond shapes in its inventory:
- Round, with a price ranging from $360 to $970,000 depending on the 4Cs.
- Princess, with a price ranging from $370 to $200,000 depending on the 4Cs.
- Emerald, with a price ranging from $270 to $550,000 depending on the 4Cs.
- Asscher, with a price ranging from $500 to $300,000 depending on the 4Cs.
- Marquis, with a price ranging from $615 to $500,000 depending on the 4Cs.
- Oval, with a price ranging from $460 to $240,000 depending on the 4Cs.
- Radiant, with a price ranging from $470 to $512,000 depending on the 4Cs.
- Pear, with a price ranging from $460 to $1,150,000 depending on the 4Cs.
- Heart, with a price ranging from $570 to $280,000 depending on the 4Cs.
- Cushion, with a price ranging from $895 to $480,000 depending on the 4Cs.
In addition to our selection of fine diamonds, we also carry signature items made exclusively for RBR. These collections include the world’s finest round-cut diamonds and emerald-cut diamonds, which are rare.
3.2 Sales Literature
In addition to the interactive website, we also publish an annual diamond catalog that is distributed throughout our network of local jewelers. The catalog includes the diamond report and information regarding the 4Cs (Carat, Clarity, Color, Cut) of the merchandise. The names and addresses of RBR’s network jewelers will also be printed in the annual diamond catalog.
This catalog is also available for customers by filling out a request form that is available through the website, free of charge.
3.3 Sourcing
RBR has an already long-term relationship with several diamond cutters in the world, such as Levy Diamond Cutters Inc. (Israel), and Schumacher Diamond Cutters Inc. (Antwerp, Belgium). The relationship of RBR and these diamond cutters is traced back to the owner’s father, who has purchased loose diamonds directly from these sources since 1970.
3.4 Future Products
As the company expands, it requires a new product category to increase its sales volume. Other players in the game (Diamonds.com and BlueNile) have been enjoying the growth of its popular trinkets sales, in addition to setting sales. Although RBR has been focusing on loose diamonds in the past three years, the company now realizes the importance of variety and options. Customers want not only an excellent quality of diamond but an extraordinary design setting for themselves and their loved ones.
3.5 Technology
RBR uses a hybrid of traditional brick-and-mortar with Internet connectivity, utilizing local jewelry stores to participate in leveraging the “high touch” aspects of diamond shopping.The technology model is quite simple. An eye-catching front-end, to capture the attention of the customers, and logistics back-end to expedite the delivery of the merchandise to our network of local jewelers in the area.
How does it work? For example, one customer is interested in seeing and examining a diamond for an engagement ring. After selecting up to two diamonds and setting up an appointment with a jeweler, merchandise is then shipped within 24 hours (if the order was placed before the cut-off time of 4 PM). RBR notifies the jeweler via e-mail for an appointment. Sales will be made on the spot.
This dynamic relationship of course does not come easily, although it is true that local jewelers basically have less risk or maybe no risk compared to RBR in building the partnerships. In our city, there is only one jeweler who currently participates in the RBR’s program. In the greater local area, there are only four jewelers who participate.
Location selection is another problem that needs to be solved by the strategic decision-makers at RBR. In our city, the participating jeweler is located far from the classic downtown area where most of the upscale jewelers are located. Again, the scarcity of jewelers that are willing to participate in the program is the main reason. To increase RBR’s strategic infrastructure business, it needs to continue adding local jewelers into its selection, within the main shopping vicinity, not outside.
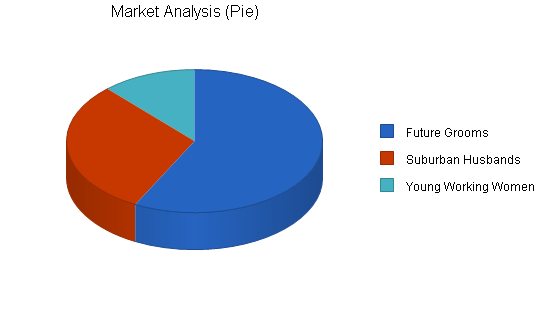
Market Analysis Summary
We divide the market into “Future Grooms,” “Suburban Husbands,” and “Young Working Women.” Men will be our priority target because according to our research, “surprise factor” is still what makes the engagement ring market flourish in the U.S. Engagement rings are considered an essential investment in any marriage proposal in the U.S. Also, thanks to De Beers’ recent campaign, we can now easily market the three-diamond anniversary ring to the audience.
4.1 Market Segmentation
The “Future Grooms” category is composed of young men, age 28 to 45, with annual income above $40,000, living in metro area. Most men in this age group are in their prime career and about to start a family of their own. Many of them are still dating their college sweethearts and living together, ready to embark on their new journey in life.
Judging from the income, we concluded that most of these men are computer literate, of course connected to the Internet, and living a bachelor’s lifestyle, probably engaging in high profile sports, such as rock climbing and skiing.
We also include sports car in their life, supposing the mid 30s bachelor’s lifestyle. They are likely to be active people with cruising as parts of their daily plan. They do not tend to be extra price-sensitive. With this psychographic profile of our audience, we can develop some recommendations for RBR’s strategy.
The “Suburban Husbands” are a slightly older demographic than the previous segment, consisting of men from age 32 to 55, with annual incomes above $80,000, living in the suburbs. Most of these men are already going for their fifth year wedding anniversary. In the celebration of their marriage, many of them are “tangled” with the idea of the three diamond ring (past-present-future). As romantic as it sounds, these suburban husbands are spending more than $5,000 on an anniversary ring for the occasion.
The third category is “Young Working Women.” As women are now becoming the majority of Web surfers, due to the popularity of women’s community websites, such as iVillage and so forth, they represent the strength in e-tailing. Women pay more attention to detail than men do. In choosing their diamonds, women would like to see firsthand before charging the bill to their credit cards. Now, with the option to examine the diamond at their nearest jewelers, RBR is perhaps the one and only destination for women purchasing diamond jewelry on the Internet.
| Market Analysis | |||||||
| 2006 | 2007 | 2008 | 2009 | 2010 | |||
| Potential Customers | Growth | CAGR | |||||
| Future Grooms | 20% | 1,700,000 | 2,040,000 | 2,448,000 | 2,937,600 | 3,525,120 | 20.00% |
| Suburban Husbands | 20% | 900,000 | 1,080,000 | 1,296,000 | 1,555,200 | 1,866,240 | 20.00% |
| Young Working Women | 20% | 350,000 | 420,000 | 504,000 | 604,800 | 725,760 | 20.00% |
| Total | 20.00% | 2,950,000 | 3,540,000 | 4,248,000 | 5,097,600 | 6,117,120 | 20.00% |
4.2 Target Market Segment Strategy
RBR has been focusing on the “Future Grooms” market since 2002. The main reason behind the selection of this target segment is that the engagement ring market has been the largest segment in diamond purchasing in the U.S. for the last three decades. In a partriarchal tradition, men offering their marriage proposal usually accompany it with a gift. The gift has to represent something that is valuable to both families or parties. In Western culture, a diamond ring fulfills this “value” requirement both by its monetary value, and its sentimental or romantic associations. A diamond ring is so connected to the idea of engagement that it in itself can signify the proposal; simply by presenting a diamond ring, men in the U.S. make an offer of marriage.
This had been the focus of RBR’s marketing campaign. RBR emphasized loose diamonds, meaning that the company let customers choose various settings from their own trusted jewelers. Loose diamonds are attractive to RBR’s main target segment, as they are simple and do not require customers to limit themselves to what setting is available from the merchant. For instance, if the customer does not find the setting he likes at one jeweler, he can go to other RBR-partnered jewelers to find the exact setting required.
The female target market segment had been showing a significant growth in the last three years. This trend has contributed to the RBR’s expansion plan by adding innovative setting design into the sales strategy.
4.2.1 Market Needs
Recognition and Exclusivity
Selling diamonds is the same as selling image, individuality, and luxury. At traditional jewelers’ shops, many customers want their engagement rings to be unique, custom-made, the one-and-only. Future brides would not want their rings to be generic. Traditional jewelers made this possible by building close relationships with their customers who probably know them through word of mouth or family networks. Bride and groom could spend hours and hours to make sure the design is fabulous.
Security/Absence of Fear
Trust is the key to achieve customers’ assurance in purchasing diamonds from RBR. The relationship between RBR and its customers begins with customers who go to the website and find out about the company and how to deal with the company. The part with the words “no money down” and “no obligation” is the starting point in establishing trust, along with “money-back guarantee,” as claimed by other diamond e-tailers. It is as fundamental as traditional jewelers when they say, “Look around and take your time.”
Love
A diamond engagement ring represents love in a material form. And this is an exclusive love, which can only be represented in one unique diamond.
4.2.2 Value
The basic idea for RBR’s e-commerce strategy is to sell loose high quality diamonds at wholesale prices. It is essential to motivate customers with high buying power in getting the best value for their money, without depreciating the character of the merchandise.
So, how are we going to sell a high quality diamond at the best price offered (wholesale price), and at the same time not cheapen the image of our company?
The answer is exclusivity. As we know, customers who are in the market of buying an engagement ring are concerned with appearances. Men want to look good by giving their fiancee the best quality diamond ring. No one wants to give his fiancee a diamond ring from a wholesaler, warehouse or cheap outlet. So, upper echelon retailer is the answer. This is where Blue Nile, Diamonds.com and RBR come in, presenting themselves as upper-end retailers, instead of wholesalers. With a good and “high-end” look on the front-end website, we transformed the personality of the companies into high-end retail.
How does an e-commerce business support the high-touch feature in selling high-end product such as diamonds? Unless we have a total virtual reality environment, the high-touch feature can still be done by utilizing the real (physical) store as the interface to see and touch the diamond. There is nothing that can surpass this combination. Customers can select online, then inspect their selection physically, when RBR ships the maximum of two diamonds to local jewelers in the area.
Credibility
Other diamond e-tailers on the Web today do not come from generations of credible jewelers. Most of them are publicly traded companies, such as BlueNile (listed on NYSE), or an extension of existing brand such as Mondera. RBR offers a unique blend of technology and old tradition in diamond buying. Offering a convenience of local jewelers and the efficiency of high tech era. These two factors are the keys to success in the aftermath of the dot com era.
4.2.3 Market Growth
As the baby boomer generation retires in the near future, the demographic landscape in the U.S. is changing; Generation X (born between 1963 to 1979) is beginning to make up the largest working class in the nation. Often portrayed by the media as cynical, extreme-sports lovers, and body piercing slackers, Generation X (now roughly 22 to 36) is actually characterized by independent, career-minded, and technology-savvy young adults.
More and more Generation Xers are now getting married, or are planning to do so soon. With more than enough disposable income, they are gaining the majority of purchase power in the U.S.
4.3 Industry Analysis
Currently, total diamond sales in the U.S. have reached $5.5 billion, out of total jewelry sales of $40 billion. This number includes everything from engagement rings, anniversary jewelry, watches, and so on. In the engagement market alone, there are approximately $400 million in diamond sales annually, with 10% of them being distributed through the Internet. Our opportunity is the two million weddings annually with prior engagement in upper-echelon diamond rings.
The diamond market itself is fragmented (signified by the volume of vendors targeting “mass” market) and seasonal, during holidays in particular, when gift-giving traditionally takes place. As many vendors are now offering almost similar products, customers want more than just a mere solitaire diamond ring, they want innovative design with their 1 carat, round-cut engagement ring. The market is divided into three echelons: premium end, middle end, and low end. The premium end is dominated by top brands such as Tiffany & Co., Cartier, Bvlgari, and most of the European diamond retailers. The middle end is dominated by Zales and other local jewelers, while the low end market is being distributed to “mass” retailers such as Costco Jewelry or Wal-Mart Jewelry.
Online diamond retail also has different categories, parallel to the brick-and-mortar stores. BlueNile is typical of the upper-echelon vendor for high-end online diamonds, while Best Gem targets mostly middle end customers.
RBR only deals in the upper echelon of high quality diamonds, with an average sale of $3,500 per loose diamond.
Our initial target is the top 35% of the diamond market, including the top ten percent of upper-echelon buyers, for total sales of 250,000 diamonds per year. We will also market to the 50% of buyers in the mid-echelon, as they will eventually shift their buying from chain jewelers to high-end engagement diamonds.
25% of the total online diamond sales are currently held by Blue Nile. Diamonds.com is second, with 12% market share. RBR and other players share the remaining 63% of the online market.
4.3.1 Distribution Patterns
The products (diamonds) move from diamond mines to diamond cutters, then either directly to large retailers, or to wholesalers, who further distribute them to smaller retailers (mom and pop jewelry shops).
In short, major jewelry stores could sell much cheaper diamonds than the mom-and-pop shops, as they purchase larger quantities than their local counterparts. However, the mom-and-pop jewelry shops do consignment sales with their diamond suppliers to compete with large jewelry chains.
Customers who already have a long-term relationship with their local stores usually trust their local jewelers more than the large brands. The consignment business strategy had enabled mom-and-pop jewelry stores to compete with large, middle-end diamond retailer giants such as Zales Corporation.
4.3.2 Competition and Buying Patterns
As mentioned in earlier chapters, RBR has a fierce competition in the online diamond retail area, but competition is just as strong in the traditional brick-and-mortar market. Big names such as Tiffany & Co., Zales Jewelers, and Cartier currently dominate the high-end diamond market in the U.S.
In 2001, Tiffany & Co. sales had reached $1.6 Billion, while Cartier and Zales had reached $3.2 Billion and $2.8 Billion, respectively. All three of the major players have their presence online (and ship worldwide), which is a major threat for RBR and other online diamond retailers. With multiple brick-and-mortar locations around the world, Tiffany & Co., Cartier, and Zales are sure to continue dominating the diamond business for the next decade.
However, new opportunities are opening up for online sales. Thanks to the government intervention in online fraud and e-commerce policy, more customers are now confident in the safety of purchasing via the Internet. Customers are using these online stores as an alternative, to access good value for their diamonds, rather than buying the top-tier, overpriced diamond brands.
4.3.3 Main Competitors
There are several players in the diamond e-tailing market today. Some of the big players are www.diamonds.com, www.bluenile.com, www.diamond.com (an Odimo company), www.mondera.com and www.bestgem.com. These companies are similar in their fine quality of products, GIA Certification, and warranty in their diamond selections. The scope of this analysis is the slight and unique differences in their business strategies gaining share in the online diamond markets.
Diamonds.com
The company’s product lines are not limited to loose diamonds. Business strategy used is similar to those traditional brick-and-mortar jewelry stores with a “touch” of e-business’ connectivity, interactivity, and speed. Product lines offered on the website vary from rings to earrings, which can later be set with customers’ diamond selections, or without if customers wish to buy just the settings.
The website offers the convenience of online shopping with features such as “proceed to checkout” and “shipping method.” Like most e-tailers and direct competitors, a toll free number is listed at the bottom right corner to assist customers with questions and concerns from 9 – 5, Monday – Friday. If customers hesitate to call in, Diamonds.com also offers FAQ and e-mail addresses of different departments, such as general inquiry and sales. In addition, it displays the BBB (Better Business Bureau), JVC (Jewelers Vigilance Committee), and Trust-E endorsements to enhance customers’ trust in the business and site.
A new feature, “Create your own,” is still under construction that will enhance high-touch aspects, as customers will later interact with the website in the customization of their orders. “Special Request” button is also available for customers who could not find specific merchandise online and need assistance in finding them.
Diamonds.com is currently opening its online financing program for greater purchasing options. Sizing and repairs are also available from time to time, as customers may need to reset their stones or clean their jewelry. Since it does not state an affiliation with local jewelers, as RBR does, sizing and repairs are probably done with prior arrangement made by the company’s customer service department.
Blue Nile
Currently, Blue Nile is largest online diamond seller in the market, with gross revenue of $50 million USD yearly; 30% of sales are from loose diamonds. The company is publicly owned with high capital to be spent on advertising campaigns.
Blue Nile carries more product lines than its competitors, not limited to rings, necklaces, earrings, and other jewelry related products, but also including apparel and accessories, such as watches, pens, key rings, and money clips.
Similar to Diamonds.com, Blue Nile also offers the convenience of online shopping with its checkout and shipping method features. Its “build your own ring” feature is similar to Diamonds.com’s future “Create your own,” where customers can choose their rings and virtually set their diamond selections into them in order to see what the final product would look like.
The website has more features than its competitors, such as Gift Ideas, a suggestion site for special events in order to attract customers to not only look, but book. Blue Nile’s online personality maintains a “classy” look and strong brand, enhanced by the website’s technical capabilities. As brand is the name of the game in today’s new economy, Blue Nile has developed a logo that represents the company with the “B” inside two symmetrical “N”-shaped boxes.
Loose diamonds are mostly made customized for Blue Nile. Financing is also available to give customers more purchasing power in shopping with Blue Nile.
Diamond.com
Under its parent company (Odimo Inc., formerly known as DiamondDepot.com), Diamond.com has maintained its presence among competitors in the online diamond retail.
Similar to Diamonds.com in character, Diamond.com offers a slightly wider product range, with its collection of watches. Most of its online features are similar to both Diamonds.com and Blue Nile. It has a highly interactive, design-your-own ring feature on the website like the others, although it is almost hidden, which will show the feature only after you select your diamond.
On the other hand, Diamond.com does offer a tracking feature of customers’ order like most e-tailers, such as Amazon.com and Barnes & Noble. This is an advantage, particularly in dealing with first time customers who are eagerly awaiting the merchandise from their expensive online purchases. According to one study, tracking systems in online retailers would enhance customers’ trust by providing an estimated time of arrival for the merchandise.
Repairs could be performed by filing out an online form, which must be sent out, along with the products, to its corporate office.
One distinct feature is that the company ships the merchandise to limited countries outside the United States, whereas the others mostly serve only the U.S.
Best Gem
All of its loose diamonds come from its own inventory, to avoid conflict if more than one customer accesses the site and wants the same diamond in the database. However, the down side of it is that the company does not display its own diamonds from the inventory, instead using generic types of graphic to show its collection. This strategy will create a doubt in customers’ mind as to whether to buy the merchandise as shown on the website and about getting the same goods as showed on the picture. Although a warranty of return if not satisfied is offered, some customers might not want to go through hassle of dealing with unsatisfying merchandise.
Mondera
Mondera creates its personality as a “traditional” diamond retailer on the Internet by portraying the value in New York’s diamond district and their family history. As a company established under an internationally known parent company, Mondera has no problem in gaining customers’ trust in its selection of fine diamonds and jewelry.
The company is also serving customers worldwide as Diamond.com does, and offers wide selection of product lines from cuff links to money clips. The website has a “Create your own” feature for higher interactivity between customers and the site in customizing orders. The website also offers a complementary advice from Mondera’s gemologists who are standing by to answer customer questions and concerns about the diamonds. The company is spending a lot of money in advertising and has an excellent promotion strategy such as celebrity features in many of its collections.
Competitive Analysis Table
|
Competitors |
C |
I |
S |
Simplicity |
Trust |
Customer Service |
High Touch |
Selection |
Price |
|
Diamonds.com |
+ |
++ |
+ |
Yes |
Yes |
Yes |
No |
Good |
Wholesale |
| Blue Nile |
+ |
++ |
+ |
Yes |
Yes+ |
Yes |
No |
Very Good |
35% |
| Diamond.com |
+ |
++ |
+ |
Yes |
Yes |
Yes |
No |
Very Good |
N/A |
| Best Gem |
+ |
+ |
+ |
Yes |
Yes |
Yes |
No |
Very Good |
Wholesale |
| Mondera |
+ |
++ |
+ |
Yes |
Yes+ |
Yes |
No |
Very Good |
35%+ |
C= Connectivity; I= Interactivity; S= Speed
4.3.4 Industry Participants
There are two main categories of players in the diamond industries: online retailers and traditional brick-and-mortar retailers. Both are subdivided into three classes; premium end, middle end and low end market.
Individual competitors are described under “Main Competitors,” below.
Strategy and Implementation Summary
The growth strategy of RBR will require an expansion of the current divisions inside the organization, a restructuring of the company. Without the benefits of the restructuring, it is likely that the RBR business will stagnate. The process of restructuring, however, is not without any risk, as the current business practices that had been the foundation of the company will have to be slightly adjusted in response to today’s retail environment.
There will be two phases of restructuring the company. First, changes will be made in the current RBR location. Second, we must revamp the RBR brand to build and strengthen customers’ “emotional” attachment to it.
Transformation Into Corporate Style of Management
Overcoming the issue of total owner involvement in the business is the most fundamental for any diamond retailer today. RBR is still under “centralized” management with Mr. Stone acting as CEO, Business Development Officer, Purchasing Manager, and Marketing Communication Manager. This creates a conflict of interest within the company. For instance, after Mr. Stone finished working on RBR’s marketing program for the year, he hesitated to pursue most of the programs due to his priority involvement in Business Development (making alliances, adding revenue streams). With better delegation, Mr. Stone’s role in the company can be limited to just expanding the business rather than following up on marketing programs.
Positioning Through New Brand Development
Clearly, the current RBR brand cannot support the next level of growth. The brand does not appeal to an increasing Generation X, the savvy and sophisticated demographic in the U.S. But changing the RBR brand does not mean disregarding the existing value of the company (credibility, integrity, hybrid of traditional and technology).
Business researchers have suggested that there are several reasons a small business would need to change their brand image. There is no recognition of the brand and the potential customers are not clear about the message behind the brand. Or the brand is recognized, but the message the company wishes to convey is not being conveyed. In the case of RBR, that could mean that former customers might be confused about the new direction the company is taking. Another reason to change brand names is that the market for the company’s product has changed dramatically. While the change in market for RBR has not been dramatic, it has been a big enough change that the brand needs some updating in order that the company can begin to compete in new markets.
There are two most critical steps in brand development for RBR. First, the company must secure a more prestigious location for its networked jewelers in positioning its new image in the market. Second, RBR needs to start to manufacture a setting design of its own, branded as “RBR Jewelers.” That will strengthen customer awareness and help the company in positioning itself in the future.
The revised brand messaging will suggest the company’s seriousness in increasing its value in serving the customers. Some of the characteristics of the new brand will reflect the sense of:
- Sophistication
- Exclusivity
- Globalization
- Professionalism
- Respect
- Fashionable/Contemporary
- Youthful
- Mysticism
5.1 Strategy Pyramid
Organizational restructuring is the hardest part in RBR’s growth plan. RBR’s management culture is currently centered on the “one-man-show” model, and as a consequence, employees sometimes feel uncomfortable in the work environment and are less likely to contribute to the overall performance of the company. Although this has given us flexibility, this style of management has limited the company’s growth.
By recruiting non-family members to posts in strategic positions such as CFO and managers, RBR will create more accountability in its performance. Later, RBR as a company must continue to invest in increasing the competency of its people through attending various seminars related to online retailing and marketing high-end merchandise in the connected economy. Through the creation of corporate culture, RBR will become a professional company dedicated to good governance and will one day yield greater performance.
The brand re-development for RBR will include an emphasis on its new marketing campaign, “One Diamond, One Love.” The emotional marketing campaign will appeal to the savvy generation of today. RBR should shift its perception from being the “affordable” diamond retailer/wholesaler toward high-end image (without sacrificing the price) such as Tiffany & Co. However, the dilemma for RBR is to gain this prestigious image and at the same time try to maintain the “mass” market that is currently dominated by other players such as Diamond.com.
5.2 Competitive Edge
The overall concept is to utilize the Internet to connect customers with store inventory, and utilize local jewelers as a mean to support the “high-touch” feature of RBR.
This concept benefits not only RBR, but local jewelers and customers as well. There is no one else in an online diamond retailing industry applying the combination of virtual and traditional brick-and-mortar, except those who utilize the Internet to support their main traditional businesses, so RBR is the only one who has the “high-touch” feature in the competition of online loose diamond retailing.
By working with participating local jewelers, RBR eliminates the obligation to purchase the diamonds before inspection, unlike its competitors. With RBR, diamonds (limit 2 per customer) are shipped to jewelers in the area for free, even if the customer decides not to purchase in the end. In short, it is an absolutely risk-free guarantee!
5.3 Marketing Strategy
The concept of e-marketing is similar to a traditional marketing, which is the process of planning and executing conception, pricing, promotion, and distribution of ideas, goods, and services to create exchanges that satisfy the company’s objectives. Marketing does not necessarily mean forms of advertising of products, but fully utilizing all of the company’s resources into getting the customers to buy our products. In this case study, we will explore the three marketing strategies for RBR that are involved in e-commerce marketing, including posting and positioning, and traditional marketing, including advertising and the combination of all.
5.3.1 Promotion Strategy
The most challenging facet in marketing for RBR is the combination of both electronic and traditional publication. In here we are focusing on the aspects of push and pull method to attract customers in buying the diamonds from RBR.
The pull approach is what RBR does in its website to attract customers to buy, not look, as to educating themselves about diamonds (lookers versus bookers). Pull strategy may include a reverse promotion such as special deals, values, and incentives, but limited to logistical activities, such as free settings for the holiday seasons or on special occasions, such as valentine’s days. Both positioning and posting the website are part of the pull strategy, also with web optimization process that we discussed before in the earlier segment of this case study.
Now, the push approach is more exciting where RBR puts out a combination of programs to push the customer into the site, whether by advertising campaign, direct mail, promotion / in-store promotion, publicity, and strategic alliance with other firms to support RBR’s competitive advantages.
Advertising
The upside in doing a major advertising campaign is the efficiency for reaching many potential buyers simultaneously; it is effective in creating image of the brand, and the variety of media to choose from. However, the downsides are the cost and it reaches random targets that might not be our potential buyers. The only way to do this is to find out from our exact demographic and psychographic profile from the SRI data to target which media, unless we have an unlimited amount of money to spent on advertising. The SRI data will provide the name of subscription magazines of our target customers, so we can prepare when to launch the advertising publication into these media. Men’s magazines, television and radio ads are not completely out of the option if we know specific time before hand. For instance, we can focus our advertising campaign around January and February when Valentine’s Day is near.
Sales promotion
These activities include special deals to stimulate demand. Sales promotion is proven effective in changing the short-term behavior of buyers. However, sales promotion whether it is been done online or in-store, could hurt the brand image, as we noted on the vision part, that diamonds is about exclusivity and recognition, and how we as the diamond seller are not going to cheapen the image of our company.
Publicity
The upside in publicity is the low cost and the messages seen more credible than marketer-sponsored messages. Barriers such as uncooperative media, heavy competition, and less control over the message seem to be the downside in this activity.
However, we can still bench-mark other companies like our competitor, Mondera.com, in endorsing our product in the celebrity events. Maybe not big celebrity exposure as Mondera.com with A list stars such as Elizabeth Hurley and Britney Spears, but we can always find B celebrities to wear our diamonds into the events, such as the Emmys or on MTV. After all, diamonds are about superficiality and vanity, and if the customers see something that their famous stars wear, for instance one TV star got engaged with the US $20,000 diamond from RBR’s inventory, who would not follow?
Direct Mail
Who does not like getting a catalog in the mailbox, especially the ones from Tiffany’s or Cartier? We will use the same methodology as the traditional upper diamond retailers’ approach in catalogs where they create an image of exclusivity of their brand. Although this method is going to cost some amount of money, it is yet still powerful in getting our brand recognized by potential customers.
5.3.2 Positioning Statement
For discriminating diamond purchases who prefer to shop online, Rocks by Request offers a unique combination of high-tech and high-touch shopping. Unlike other online retailers, we work with local diamond merchants to let you inspect your chosen stones in person before buying.
5.3.3 Pricing Strategy
RBR implements standard pricing from the Rappaport. For instance, a 1 carat VVS1 loose diamond is priced between $5,900 to $6,200. RBR’s settings are priced from $100 to $800, depending on the design complexity. All of RBR’s settings will be made of 18k yellow gold or 14k white gold.
In the expansion plan, RBR will outsource the manufacture of accessories made of 14k white gold decorated with small-carat diamonds ranging from 0.01 to 0.3 carat. The pricing of RBR’s signature accessories will range from $90 to $200 to attract the emerging young female audience.
5.4 Sales Strategy
RBR sales strategy will not differ from its previous operating model: the local jewelers. Local jewelers (mom-and-pop shops partnered with RBR) are the sales-savvy people with an already long term relationship with their existing clients. RBR’s network of local jewelers will receive 10% commission fee depending on the amount of sales they made, and this will go to other cost of good sales in RBR’s projected profit and loss table. Settings will not be included in the commission, for the reason that the local jewelers also need to sell their own design.
Usually, after customers view the perfect loose diamonds, they will select the local jewelers in the area to actually examine the merchandise. Then, customers select their preference of setting, and pay for the merchandise. Local jewelers act as the real time “front-end” for our customers, and credibility associate in our business. This sales strategy has been proven to work for the last three years of RBR’s operation.
5.4.1 Sales Forecast
As we are adding two additional categories, settings and accessories, RBR will expect a boost in revenue for the years ahead. However, the forecast is rather conservative, due to fierce competition that offer similar product categories. In order to boost the volume of sales, RBR is now projecting a 10% decrease of its margin from 40% to 30%. This strategy is necessary to attract potential local jewelers, as well as maintaining current partners in distributing RBR’s merchandise.
Due to the difficulty in valuing loose diamonds in units (4Cs characteristics and relationship-based business model), RBR’s sales forecast is based on values rather than units. Please note that when the merchandise is at local jewelers’ hand, bargaining takes place. Customers who already had a long relationship with their local jewelers tend to bargain the price of the diamonds or if sales are down, usually local jewelers tend to lower their margin in order to expand their client base by offering cheaper prices than other jewelers.This is how local jewelers can still compete with big brand names, because of the relationship-based business model. RBR set the average 30% margin for all of its loose diamonds sales to simplify the reporting. However, the numbers are relative ranging from 25% to 50% margin in the diamond retail industry.
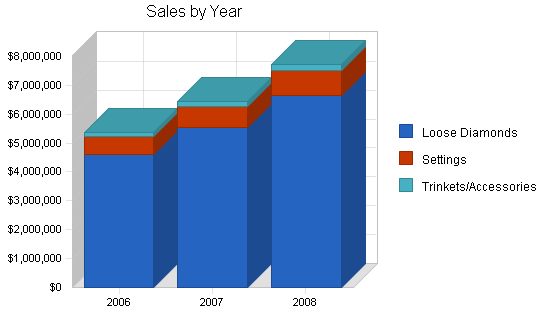
| Sales Forecast | |||
| 2006 | 2007 | 2008 | |
| Sales | |||
| Loose Diamonds | $4,620,000 | $5,544,000 | $6,652,800 |
| Settings | $600,000 | $720,000 | $864,000 |
| Trinkets/Accessories | $140,000 | $168,000 | $200,100 |
| Total Sales | $5,360,000 | $6,432,000 | $7,716,900 |
| Direct Cost of Sales | 2006 | 2007 | 2008 |
| Loose Diamonds | $3,234,000 | $3,880,800 | $4,656,400 |
| Settings | $420,000 | $504,000 | $604,000 |
| Trinkets/Accessories | $98,000 | $118,000 | $140,000 |
| Subtotal Direct Cost of Sales | $3,752,000 | $4,502,800 | $5,400,400 |
5.5 Strategic Alliances
Strategic alliance has one significant impact in creating brand image. It is sometimes proven more powerful than the image created by advertising campaigns alone. As noted earlier, I propose an alliance (s) with financing firms such as Visa, American Express, and Master Card to boost the image and customers’ spending power. In addition we will join Shop@AOL, which is slightly different from posting the website on AOL, but to include our diamonds into AOL’s selection of engagement diamonds. This will have a great impact on our image as well, as we are in the same place as AOL’s endorsed online diamond retailers, such as Blue Nile and Diamonds.com.
Yahoo! and Amazon are now entering high-end retailing. RBR must be able to become one of their endorsed merchants to expand the brand awareness of the company.
5.6 Milestones
The milestones program shows the detailed implementation schedule for RBR’s expansion in its product portfolio and distribution strategy. Mr. Stone himself will lead the project in finding potential upscale jewelry stores in the area, and control the budget in several strategic areas.

| Milestones | |||||
| Milestone | Start Date | End Date | Budget | Manager | Department |
| Website Redesign | 11/20/2005 | 2/12/2006 | $500 | Jay Pegg | IT |
| Annual Marketing Program | 11/16/2005 | 1/2/2006 | $48,000 | Buzz Wird | Marketing |
| Finding Potential Jeweler Partner | 10/28/2005 | 6/6/2009 | $1,200 | Rock Stone | Business Dvpmnt |
| Establish Alliance With Internet Vendors | 12/15/2005 | 2/10/2006 | $1,200 | Rock Stone | Business Dvpmnt |
| Establish Relationship With Outsourcing Workshops | 12/2/2005 | 2/12/2006 | $1,200 | Rock Stone | Business Dvpmnt |
| Revamp Logo Design | 11/20/2005 | 6/6/2009 | $800 | Rock Stone | Business Dvpmnt |
| Establish Relationship With Banks For Co Branding | 11/22/2005 | 1/17/2006 | $1,200 | Buck Pound | Business Dvpmnt |
| Upgrade Existing Warehouse | 12/2/2005 | 3/20/2006 | $12,000 | Chip N. Storage | Operation |
| Update List of New Local Jeweler Partners | 1/5/2006 | 1/9/2006 | $0 | Jay Pegg | IT |
| Totals | $66,100 | ||||
Web Plan Summary
The new RBR website will have several new features that will add to the company’s competitive advantage in online diamond retailing. Some of these features, such as “Design Your Own Ring” and “Live Online Sales Assistance,” have already been implemented by other players in the marketplace.
New features of RBR website will include:
- “Design Your Own Ring,” utilizing Macromedia Flash that will enable customers to view their ring setting with their own selection of diamond shape.
- “Live Online Sales Assistance,” that will be available from 8AM to 8PM Pacific Standard Time.
- Paypal friendly.
- “3-D Interactive,” utilizing Macromedia Flash, so that customers can view 360 degrees of the selected ring.
6.1 Website Marketing Strategy
Optimizing our Search Results
This process refers to optimizing RBR’s website by including the frequent use of keywords from customers going to search engines looking for diamonds, such as “diamonds,” “diamond,” and “wholesale diamonds” into its Web pages. Optimization is currently handled by an organization called WebMama.com. IT personnel at WebMama.com puts the use of words in a fashion where search engines pick them up. This all being done in text rather than in pdf format as the spiders and callers only work in text environment. Another way to position the website is by optimizing the meta-text, which means the back-end of the website, where it tells the search engine about the presence of RBR’s website.
The concept of web optimization is quite simple, knowing that search engines’ spiders would not go as far as two levels in delivering the websites to Internet users. Note that flash pages are not friendly to the spiders, so it is advisable not to put flashy pages on the first two levels. There are doors to get in every website from the search engines, which in the case of RBR, it uses four doors. In order to optimize RBR’s doors with the search engines portals, we use strategy that is derived from the common customers’ habit if they were looking for diamonds online. For instance, customers will use the four C’s to educate themselves about the diamonds they are going to buy, and RBR provides the four C’s information in the first level of its website to get customers learning about the four C’s from RBR.
Currently the Web positioning strategy is more than adequate to put RBR among other competitors. Although it is in Yahoo’s 19th rank when customers type keyword “diamonds,” it still visible for them to view the website.
Now, with the optimized keywords and meta-texts in position, RBR needs to do one final step, posting the site for search engines.
Current posting on Yahoo! indicates sponsorship under the word “wholesale diamonds” and “engagement diamonds,” but not under single keywords”diamonds” or “diamond,” which is not posing a problem as long as the optimization process keeps up with the fast pace in the changing trend of the Internet.
Although Yahoo! and Google are the most used search engines in the world today, my recommendation in this part is to post RBR’s website under Shop@AOL, for the reason that AOL is the biggest online community where its users listen for virtual “word of mouth” with other chatters or members. As Blue Nile and Diamond.com are already in sponsorship with AOL, along with Macy’s and Ice.com that are now expanding to the upper echelon of loose diamond retail, RBR should establish a connection with AOL to increase its competitiveness in the industry.
6.2 Development Requirements
In developing this high-tech website, RBR will utilize mainly Macromedia Flash software, as well as open source software to achieve cost efficiency in this area. RBR’s IT Manager will be responsible in the development of both front-end and back-end of the website. RBR’s in-house programmer will be responsible to create the program that will enable these new features, while for data entry, image cropping, and simple programming, RBR will use temp workers to help minimize the budget. Temp workers will also be contracted on an as-needed basis in the maintenance and update of the website.
Management Summary
Rock Stone, CEO of RBR, will be responsible for developing business strategy, identifying business opportunities, and achieving projected revenue and expense targets.
Our CFO will be responsible for supervising the finance and accounting department.
Our Marketing and Brand Manager will be responsible for developing brand advertising and marketing programs.
7.1 Organizational Structure
The new organization restructuring will focus on the relationship between the owner and the other managers, not necessarily limiting the involvement of the owner. The purpose of this new organizational model is to increase the accountability of each subdivision to gain maximum performance.
- Mr. Stone will act as a CEO/Strategic Business Officer. The role of Vice President and CFO will be combined.
- Jay Pegg will be responsible for the IT development of the company, both front-end design and back-end database management.
- The Marketing Department, headed by Buzz Wird, will include Branding Development.
- Warehouse and Logistic Operation will be headed by Mr. Chip N. Storage.
7.2 Personnel Plan
Mr. Stone will now receive an annual salary instead of taking the whole profit as it was in the past. The purpose of giving salary to owner is to accumulate extra cash for the further development of the company.
| Personnel Plan | |||
| 2006 | 2007 | 2008 | |
| CEO/Owner | $108,000 | $108,000 | $108,000 |
| CFO | $78,000 | $78,000 | $78,000 |
| Marketing/Brand Manager | $54,000 | $54,000 | $54,000 |
| Marketing Personnel | $24,000 | $24,000 | $24,000 |
| IT Manager | $54,000 | $54,000 | $54,000 |
| Programmer | $38,400 | $38,400 | $38,400 |
| Web Designer | $26,400 | $26,400 | $26,400 |
| General Administrative Assistant | $24,000 | $24,000 | $24,000 |
| Shipping Personnel 1 | $22,000 | $22,000 | $22,000 |
| Security Guard 1 | $24,000 | $24,000 | $24,000 |
| Security Guard 2 | $24,000 | $24,000 | $24,000 |
| Security Guard 3 | $24,000 | $24,000 | $24,000 |
| Security Guard 4 | $24,000 | $24,000 | $24,000 |
| Shipping Personnel 2 | $22,000 | $22,000 | $22,000 |
| Total People | 15 | 15 | 15 |
| Total Payroll | $546,799 | $546,800 | $546,800 |
Financial Plan
Our financial plan is based on our overall strategy of new market development. We will cut our margins from 40% to 30% to increase our appeal to a wider audience. With lower prices, we must rely on online marketing efforts and local jewelers to maintain and enhance the prestige of our brand.
8.1 Important Assumptions
Our assumption is based on the historical 20% annual sales growth since 2002. This is a rather conservative sales projection. As we expand our categories and revamp the technology, in addition to building a stronger image brand, we expect a higher growth percentage during three years of operation.
8.2 Key Financial Indicators
We will decrease our gross margin from 40% in previous years to 30% of all loose diamond sales, to boost sales volume. As mentioned in a previous chapter, we purchased a large amount of loose diamonds directly from our network of diamond cutters with 30 days collection days. Based on our estimated operating expense monthly, we expect to generate more sales to cover our fixed expenses.

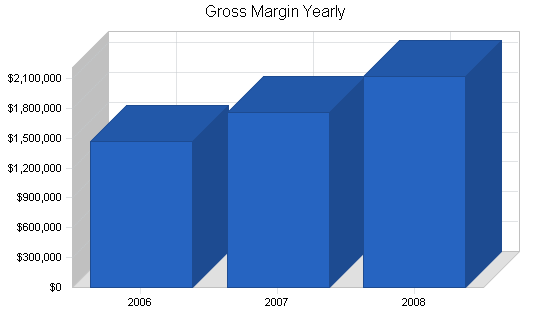
8.3 Projected Profit and Loss
Our estimated Net Profit for 2006 and 2007 is presented in the accompanying table and charts.


| Pro Forma Profit and Loss | |||
| 2006 | 2007 | 2008 | |
| Sales | $5,360,000 | $6,432,000 | $7,716,900 |
| Direct Cost of Sales | $3,752,000 | $4,502,800 | $5,400,400 |
| Other Costs of Sales | $138,600 | $166,400 | $199,600 |
| Total Cost of Sales | $3,890,600 | $4,669,200 | $5,600,000 |
| Gross Margin | $1,469,400 | $1,762,800 | $2,116,900 |
| Gross Margin % | 27.41% | 27.41% | 27.43% |
| Expenses | |||
| Payroll | $546,799 | $546,800 | $546,800 |
| Marketing/Promotion | $48,000 | $48,000 | $48,000 |
| Depreciation | $0 | $0 | $0 |
| Rent @ Brannan Street | $36,000 | $36,000 | $36,000 |
| Utilities @ Brannan Street | $4,200 | $4,200 | $4,200 |
| Warehouse Utilities | $7,200 | $7,200 | $7,200 |
| Payroll Taxes | $0 | $0 | $0 |
| Warehouse Rent | $72,000 | $72,000 | $72,000 |
| Web Hosting | $480 | $480 | $480 |
| Database Maintainence | $100 | $100 | $100 |
| Shipping | $30,000 | $30,000 | $30,000 |
| Total Operating Expenses | $744,779 | $744,780 | $744,780 |
| Profit Before Interest and Taxes | $724,621 | $1,018,020 | $1,372,120 |
| EBITDA | $724,621 | $1,018,020 | $1,372,120 |
| Interest Expense | $0 | $0 | $0 |
| Taxes Incurred | $217,386 | $305,406 | $411,636 |
| Net Profit | $507,234 | $712,614 | $960,484 |
| Net Profit/Sales | 9.46% | 11.08% | 12.45% |
8.4 Break-even Analysis
With monthly fixed costs and variable costs, the table and chart below show what we need to sell in diamonds each month to break even. We are well past the break-even point, even with these lower margins.

| Break-even Analysis | |
| Monthly Revenue Break-even | $206,883 |
| Assumptions: | |
| Average Percent Variable Cost | 70% |
| Estimated Monthly Fixed Cost | $62,065 |
8.5 Projected Cash Flow
Our projected cash flow is outlined in the following chart and table.

| Pro Forma Cash Flow | |||
| 2006 | 2007 | 2008 | |
| Cash Received | |||
| Cash from Operations | |||
| Cash Sales | $5,360,000 | $6,432,000 | $7,716,900 |
| Subtotal Cash from Operations | $5,360,000 | $6,432,000 | $7,716,900 |
| Additional Cash Received | |||
| Sales Tax, VAT, HST/GST Received | $0 | $0 | $0 |
| New Current Borrowing | $0 | $0 | $0 |
| New Other Liabilities (interest-free) | $0 | $0 | $0 |
| New Long-term Liabilities | $0 | $0 | $0 |
| Sales of Other Current Assets | $0 | $0 | $0 |
| Sales of Long-term Assets | $0 | $0 | $0 |
| New Investment Received | $0 | $0 | $0 |
| Subtotal Cash Received | $5,360,000 | $6,432,000 | $7,716,900 |
| Expenditures | 2006 | 2007 | 2008 |
| Expenditures from Operations | |||
| Cash Spending | $546,799 | $546,800 | $546,800 |
| Bill Payments | $3,791,764 | $5,151,736 | $6,198,175 |
| Subtotal Spent on Operations | $4,338,563 | $5,698,536 | $6,744,975 |
| Additional Cash Spent | |||
| Sales Tax, VAT, HST/GST Paid Out | $0 | $0 | $0 |
| Principal Repayment of Current Borrowing | $0 | $0 | $0 |
| Other Liabilities Principal Repayment | $0 | $0 | $0 |
| Long-term Liabilities Principal Repayment | $0 | $0 | $0 |
| Purchase Other Current Assets | $0 | $0 | $0 |
| Purchase Long-term Assets | $0 | $0 | $0 |
| Dividends | $0 | $0 | $0 |
| Subtotal Cash Spent | $4,338,563 | $5,698,536 | $6,744,975 |
| Net Cash Flow | $1,021,437 | $733,464 | $971,925 |
| Cash Balance | $3,308,437 | $4,041,902 | $5,013,827 |
8.6 Projected Balance Sheet
The table below outlines the projected balance sheet.
| Pro Forma Balance Sheet | |||
| 2006 | 2007 | 2008 | |
| Assets | |||
| Current Assets | |||
| Cash | $3,308,437 | $4,041,902 | $5,013,827 |
| Inventory | $312,667 | $375,233 | $450,033 |
| Other Current Assets | $30,000 | $30,000 | $30,000 |
| Total Current Assets | $3,651,104 | $4,447,135 | $5,493,860 |
| Long-term Assets | |||
| Long-term Assets | $0 | $0 | $0 |
| Accumulated Depreciation | $0 | $0 | $0 |
| Total Long-term Assets | $0 | $0 | $0 |
| Total Assets | $3,651,104 | $4,447,135 | $5,493,860 |
| Liabilities and Capital | 2006 | 2007 | 2008 |
| Current Liabilities | |||
| Accounts Payable | $346,869 | $430,287 | $516,527 |
| Current Borrowing | $0 | $0 | $0 |
| Other Current Liabilities | $0 | $0 | $0 |
| Subtotal Current Liabilities | $346,869 | $430,287 | $516,527 |
| Long-term Liabilities | $0 | $0 | $0 |
| Total Liabilities | $346,869 | $430,287 | $516,527 |
| Paid-in Capital | $1,500,000 | $1,500,000 | $1,500,000 |
| Retained Earnings | $1,297,000 | $1,804,234 | $2,516,848 |
| Earnings | $507,234 | $712,614 | $960,484 |
| Total Capital | $3,304,234 | $4,016,848 | $4,977,332 |
| Total Liabilities and Capital | $3,651,104 | $4,447,135 | $5,493,860 |
| Net Worth | $3,304,234 | $4,016,848 | $4,977,332 |
8.7 Business Ratios
Business ratios for the years of this plan are shown below. Industry profile ratios based on the Standard Industrial Classification (SIC) code 5999.15, Diamonds, Gems and Precious Stones.
| Ratio Analysis | ||||
| 2006 | 2007 | 2008 | Industry Profile | |
| Sales Growth | 34.23% | 20.00% | 19.98% | 6.95% |
| Percent of Total Assets | ||||
| Inventory | 8.56% | 8.44% | 8.19% | 35.78% |
| Other Current Assets | 0.82% | 0.67% | 0.55% | 21.61% |
| Total Current Assets | 100.00% | 100.00% | 100.00% | 89.85% |
| Long-term Assets | 0.00% | 0.00% | 0.00% | 10.15% |
| Total Assets | 100.00% | 100.00% | 100.00% | 100.00% |
| Current Liabilities | 9.50% | 9.68% | 9.40% | 29.22% |
| Long-term Liabilities | 0.00% | 0.00% | 0.00% | 8.75% |
| Total Liabilities | 9.50% | 9.68% | 9.40% | 37.97% |
| Net Worth | 90.50% | 90.32% | 90.60% | 62.03% |
| Percent of Sales | ||||
| Sales | 100.00% | 100.00% | 100.00% | 100.00% |
| Gross Margin | 27.41% | 27.41% | 27.43% | 19.18% |
| Selling, General & Administrative Expenses | 17.95% | 16.33% | 14.99% | 8.17% |
| Advertising Expenses | 0.00% | 0.00% | 0.00% | 0.93% |
| Profit Before Interest and Taxes | 13.52% | 15.83% | 17.78% | 2.22% |
| Main Ratios | ||||
| Current | 10.53 | 10.34 | 10.64 | 2.80 |
| Quick | 9.62 | 9.46 | 9.76 | 1.48 |
| Total Debt to Total Assets | 9.50% | 9.68% | 9.40% | 45.68% |
| Pre-tax Return on Net Worth | 21.93% | 25.34% | 27.57% | 5.98% |
| Pre-tax Return on Assets | 19.85% | 22.89% | 24.98% | 11.00% |
| Additional Ratios | 2006 | 2007 | 2008 | |
| Net Profit Margin | 9.46% | 11.08% | 12.45% | n.a |
| Return on Equity | 15.35% | 17.74% | 19.30% | n.a |
| Activity Ratios | ||||
| Inventory Turnover | 11.29 | 13.09 | 13.09 | n.a |
| Accounts Payable Turnover | 11.59 | 12.17 | 12.17 | n.a |
| Payment Days | 28 | 27 | 27 | n.a |
| Total Asset Turnover | 1.47 | 1.45 | 1.40 | n.a |
| Debt Ratios | ||||
| Debt to Net Worth | 0.10 | 0.11 | 0.10 | n.a |
| Current Liab. to Liab. | 1.00 | 1.00 | 1.00 | n.a |
| Liquidity Ratios | ||||
| Net Working Capital | $3,304,234 | $4,016,848 | $4,977,332 | n.a |
| Interest Coverage | 0.00 | 0.00 | 0.00 | n.a |
| Additional Ratios | ||||
| Assets to Sales | 0.68 | 0.69 | 0.71 | n.a |
| Current Debt/Total Assets | 10% | 10% | 9% | n.a |
| Acid Test | 9.62 | 9.46 | 9.76 | n.a |
| Sales/Net Worth | 1.62 | 1.60 | 1.55 | n.a |
| Dividend Payout | 0.00 | 0.00 | 0.00 | n.a |
Appendix
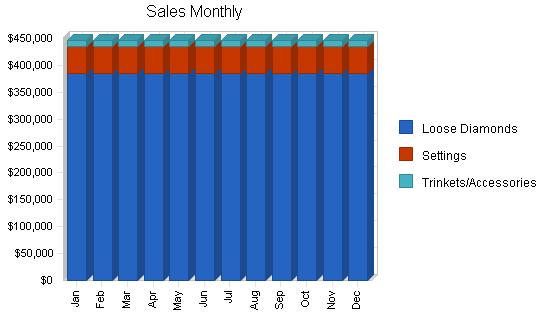
| Sales Forecast | |||||||||||||
| Jan | Feb | Mar | Apr | May | Jun | Jul | Aug | Sep | Oct | Nov | Dec | ||
| Sales | |||||||||||||
| Loose Diamonds | 0% | $385,000 | $385,000 | $385,000 | $385,000 | $385,000 | $385,000 | $385,000 | $385,000 | $385,000 | $385,000 | $385,000 | $385,000 |
| Settings | 0% | $50,000 | $50,000 | $50,000 | $50,000 | $50,000 | $50,000 | $50,000 | $50,000 | $50,000 | $50,000 | $50,000 | $50,000 |
| Trinkets/Accessories | 0% | $11,667 | $11,667 | $11,667 | $11,667 | $11,667 | $11,667 | $11,667 | $11,667 | $11,667 | $11,667 | $11,667 | $11,667 |
| Total Sales | $446,667 | $446,667 | $446,667 | $446,667 | $446,667 | $446,667 | $446,667 | $446,667 | $446,667 | $446,667 | $446,667 | $446,667 | |
| Direct Cost of Sales | Jan | Feb | Mar | Apr | May | Jun | Jul | Aug | Sep | Oct | Nov | Dec | |
| Loose Diamonds | $269,500 | $269,500 | $269,500 | $269,500 | $269,500 | $269,500 | $269,500 | $269,500 | $269,500 | $269,500 | $269,500 | $269,500 | |
| Settings | $35,000 | $35,000 | $35,000 | $35,000 | $35,000 | $35,000 | $35,000 | $35,000 | $35,000 | $35,000 | $35,000 | $35,000 | |
| Trinkets/Accessories | $8,167 | $8,167 | $8,167 | $8,167 | $8,167 | $8,167 | $8,167 | $8,167 | $8,167 | $8,167 | $8,167 | $8,167 | |
| Subtotal Direct Cost of Sales | $312,667 | $312,667 | $312,667 | $312,667 | $312,667 | $312,667 | $312,667 | $312,667 | $312,667 | $312,667 | $312,667 | $312,667 | |
| Personnel Plan | |||||||||||||
| Jan | Feb | Mar | Apr | May | Jun | Jul | Aug | Sep | Oct | Nov | Dec | ||
| CEO/Owner | 0% | $9,000 | $9,000 | $9,000 | $9,000 | $9,000 | $9,000 | $9,000 | $9,000 | $9,000 | $9,000 | $9,000 | $9,000 |
| CFO | 0% | $6,500 | $6,500 | $6,500 | $6,500 | $6,500 | $6,500 | $6,500 | $6,500 | $6,500 | $6,500 | $6,500 | $6,500 |
| Marketing/Brand Manager | 0% | $4,500 | $4,500 | $4,500 | $4,500 | $4,500 | $4,500 | $4,500 | $4,500 | $4,500 | $4,500 | $4,500 | $4,500 |
| Marketing Personnel | 0% | $2,000 | $2,000 | $2,000 | $2,000 | $2,000 | $2,000 | $2,000 | $2,000 | $2,000 | $2,000 | $2,000 | $2,000 |
| IT Manager | 0% | $4,500 | $4,500 | $4,500 | $4,500 | $4,500 | $4,500 | $4,500 | $4,500 | $4,500 | $4,500 | $4,500 | $4,500 |
| Programmer | 0% | $3,200 | $3,200 | $3,200 | $3,200 | $3,200 | $3,200 | $3,200 | $3,200 | $3,200 | $3,200 | $3,200 | $3,200 |
| Web Designer | 0% | $2,200 | $2,200 | $2,200 | $2,200 | $2,200 | $2,200 | $2,200 | $2,200 | $2,200 | $2,200 | $2,200 | $2,200 |
| General Administrative Assistant | 0% | $2,000 | $2,000 | $2,000 | $2,000 | $2,000 | $2,000 | $2,000 | $2,000 | $2,000 | $2,000 | $2,000 | $2,000 |
| Shipping Personnel 1 | 0% | $1,833 | $1,833 | $1,833 | $1,833 | $1,833 | $1,833 | $1,833 | $1,833 | $1,833 | $1,833 | $1,833 | $1,833 |
| Security Guard 1 | 0% | $2,000 | $2,000 | $2,000 | $2,000 | $2,000 | $2,000 | $2,000 | $2,000 | $2,000 | $2,000 | $2,000 | $2,000 |
| Security Guard 2 | 0% | $2,000 | $2,000 | $2,000 | $2,000 | $2,000 | $2,000 | $2,000 | $2,000 | $2,000 | $2,000 | $2,000 | $2,000 |
| Security Guard 3 | 0% | $2,000 | $2,000 | $2,000 | $2,000 | $2,000 | $2,000 | $2,000 | $2,000 | $2,000 | $2,000 | $2,000 | $2,000 |
| Security Guard 4 | 0% | $2,000 | $2,000 | $2,000 | $2,000 | $2,000 | $2,000 | $2,000 | $2,000 | $2,000 | $2,000 | $2,000 | $2,000 |
| Shipping Personnel 2 | 0% | $1,833 | $1,833 | $1,833 | $1,833 | $1,833 | $1,833 | $1,833 | $1,833 | $1,833 | $1,833 | $1,833 | $1,833 |
| Total People | 15 | 15 | 15 | 15 | 15 | 15 | 15 | 15 | 15 | 15 | 15 | 15 | |
| Total Payroll | $45,566 | $45,567 | $45,567 | $45,567 | $45,567 | $45,567 | $45,567 | $45,567 | $45,567 | $45,567 | $45,567 | $45,567 | |
| Pro Forma Profit and Loss | |||||||||||||
| Jan | Feb | Mar | Apr | May | Jun | Jul | Aug | Sep | Oct | Nov | Dec | ||
| Sales | $446,667 | $446,667 | $446,667 | $446,667 | $446,667 | $446,667 | $446,667 | $446,667 | $446,667 | $446,667 | $446,667 | $446,667 | |
| Direct Cost of Sales | $312,667 | $312,667 | $312,667 | $312,667 | $312,667 | $312,667 | $312,667 | $312,667 | $312,667 | $312,667 | $312,667 | $312,667 | |
| Other Costs of Sales | $11,550 | $11,550 | $11,550 | $11,550 | $11,550 | $11,550 | $11,550 | $11,550 | $11,550 | $11,550 | $11,550 | $11,550 | |
| Total Cost of Sales | $324,217 | $324,217 | $324,217 | $324,217 | $324,217 | $324,217 | $324,217 | $324,217 | $324,217 | $324,217 | $324,217 | $324,217 | |
| Gross Margin | $122,450 | $122,450 | $122,450 | $122,450 | $122,450 | $122,450 | $122,450 | $122,450 | $122,450 | $122,450 | $122,450 | $122,450 | |
| Gross Margin % | 27.41% | 27.41% | 27.41% | 27.41% | 27.41% | 27.41% | 27.41% | 27.41% | 27.41% | 27.41% | 27.41% | 27.41% | |
| Expenses | |||||||||||||
| Payroll | $45,566 | $45,567 | $45,567 | $45,567 | $45,567 | $45,567 | $45,567 | $45,567 | $45,567 | $45,567 | $45,567 | $45,567 | |
| Marketing/Promotion | $4,000 | $4,000 | $4,000 | $4,000 | $4,000 | $4,000 | $4,000 | $4,000 | $4,000 | $4,000 | $4,000 | $4,000 | |
| Depreciation | $0 | $0 | $0 | $0 | $0 | $0 | $0 | $0 | $0 | $0 | $0 | $0 | |
| Rent @ Brannan Street | $3,000 | $3,000 | $3,000 | $3,000 | $3,000 | $3,000 | $3,000 | $3,000 | $3,000 | $3,000 | $3,000 | $3,000 | |
| Utilities @ Brannan Street | $350 | $350 | $350 | $350 | $350 | $350 | $350 | $350 | $350 | $350 | $350 | $350 | |
| Warehouse Utilities | $600 | $600 | $600 | $600 | $600 | $600 | $600 | $600 | $600 | $600 | $600 | $600 | |
| Payroll Taxes | 15% | $0 | $0 | $0 | $0 | $0 | $0 | $0 | $0 | $0 | $0 | $0 | $0 |
| Warehouse Rent | $6,000 | $6,000 | $6,000 | $6,000 | $6,000 | $6,000 | $6,000 | $6,000 | $6,000 | $6,000 | $6,000 | $6,000 | |
| Web Hosting | $40 | $40 | $40 | $40 | $40 | $40 | $40 | $40 | $40 | $40 | $40 | $40 | |
| Database Maintainence | 15% | $8 | $8 | $8 | $8 | $8 | $8 | $8 | $8 | $8 | $8 | $8 | $8 |
| Shipping | $2,500 | $2,500 | $2,500 | $2,500 | $2,500 | $2,500 | $2,500 | $2,500 | $2,500 | $2,500 | $2,500 | $2,500 | |
| Total Operating Expenses | $62,064 | $62,065 | $62,065 | $62,065 | $62,065 | $62,065 | $62,065 | $62,065 | $62,065 | $62,065 | $62,065 | $62,065 | |
| Profit Before Interest and Taxes | $60,386 | $60,385 | $60,385 | $60,385 | $60,385 | $60,385 | $60,385 | $60,385 | $60,385 | $60,385 | $60,385 | $60,385 | |
| EBITDA | $60,386 | $60,385 | $60,385 | $60,385 | $60,385 | $60,385 | $60,385 | $60,385 | $60,385 | $60,385 | $60,385 | $60,385 | |
| Interest Expense | $0 | $0 | $0 | $0 | $0 | $0 | $0 | $0 | $0 | $0 | $0 | $0 | |
| Taxes Incurred | $18,116 | $18,116 | $18,116 | $18,116 | $18,116 | $18,116 | $18,116 | $18,116 | $18,116 | $18,116 | $18,116 | $18,116 | |
| Net Profit | $42,270 | $42,270 | $42,270 | $42,270 | $42,270 | $42,270 | $42,270 | $42,270 | $42,270 | $42,270 | $42,270 | $42,270 | |
| Net Profit/Sales | 9.46% | 9.46% | 9.46% | 9.46% | 9.46% | 9.46% | 9.46% | 9.46% | 9.46% | 9.46% | 9.46% | 9.46% | |
| Pro Forma Cash Flow | |||||||||||||
| Jan | Feb | Mar | Apr | May | Jun | Jul | Aug | Sep | Oct | Nov | Dec | ||
| Cash Received | |||||||||||||
| Cash from Operations | |||||||||||||
| Cash Sales | $446,667 | $446,667 | $446,667 | $446,667 | $446,667 | $446,667 | $446,667 | $446,667 | $446,667 | $446,667 | $446,667 | $446,667 | |
| Subtotal Cash from Operations | $446,667 | $446,667 | $446,667 | $446,667 | $446,667 | $446,667 | $446,667 | $446,667 | $446,667 | $446,667 | $446,667 | $446,667 | |
| Additional Cash Received | |||||||||||||
| Sales Tax, VAT, HST/GST Received | 0.00% | $0 | $0 | $0 | $0 | $0 | $0 | $0 | $0 | $0 | $0 | $0 | $0 |
| New Current Borrowing | $0 | $0 | $0 | $0 | $0 | $0 | $0 | $0 | $0 | $0 | $0 | $0 | |
| New Other Liabilities (interest-free) | $0 | $0 | $0 | $0 | $0 | $0 | $0 | $0 | $0 | $0 | $0 | $0 | |
| New Long-term Liabilities | $0 | $0 | $0 | $0 | $0 | $0 | $0 | $0 | $0 | $0 | $0 | $0 | |
| Sales of Other Current Assets | $0 | $0 | $0 | $0 | $0 | $0 | $0 | $0 | $0 | $0 | $0 | $0 | |
| Sales of Long-term Assets | $0 | $0 | $0 | $0 | $0 | $0 | $0 | $0 | $0 | $0 | $0 | $0 | |
| New Investment Received | $0 | $0 | $0 | $0 | $0 | $0 | $0 | $0 | $0 | $0 | $0 | $0 | |
| Subtotal Cash Received | $446,667 | $446,667 | $446,667 | $446,667 | $446,667 | $446,667 | $446,667 | $446,667 | $446,667 | $446,667 | $446,667 | $446,667 | |
| Expenditures | Jan | Feb | Mar | Apr | May | Jun | Jul | Aug | Sep | Oct | Nov | Dec | |
| Expenditures from Operations | |||||||||||||
| Cash Spending | $45,566 | $45,567 | $45,567 | $45,567 | $45,567 | $45,567 | $45,567 | $45,567 | $45,567 | $45,567 | $45,567 | $45,567 | |
| Bill Payments | $128,205 | $246,164 | $247,853 | $298,897 | $358,831 | $358,831 | $358,831 | $358,831 | $358,831 | $358,831 | $358,831 | $358,831 | |
| Subtotal Spent on Operations | $173,771 | $291,731 | $293,419 | $344,464 | $404,397 | $404,397 | $404,397 | $404,397 | $404,397 | $404,397 | $404,397 | $404,397 | |
| Additional Cash Spent | |||||||||||||
| Sales Tax, VAT, HST/GST Paid Out | $0 | $0 | $0 | $0 | $0 | $0 | $0 | $0 | $0 | $0 | $0 | $0 | |
| Principal Repayment of Current Borrowing | $0 | $0 | $0 | $0 | $0 | $0 | $0 | $0 | $0 | $0 | $0 | $0 | |
| Other Liabilities Principal Repayment | $0 | $0 | $0 | $0 | $0 | $0 | $0 | $0 | $0 | $0 | $0 | $0 | |
| Long-term Liabilities Principal Repayment | $0 | $0 | $0 | $0 | $0 | $0 | $0 | $0 | $0 | $0 | $0 | $0 | |
| Purchase Other Current Assets | $0 | $0 | $0 | $0 | $0 | $0 | $0 | $0 | $0 | $0 | $0 | $0 | |
| Purchase Long-term Assets | $0 | $0 | $0 | $0 | $0 | $0 | $0 | $0 | $0 | $0 | $0 | $0 | |
| Dividends | $0 | $0 | $0 | $0 | $0 | $0 | $0 | $0 | $0 | $0 | $0 | $0 | |
| Subtotal Cash Spent | $173,771 | $291,731 | $293,419 | $344,464 | $404,397 | $404,397 | $404,397 | $404,397 | $404,397 | $404,397 | $404,397 | $404,397 | |
| Net Cash Flow | $272,896 | $154,936 | $153,247 | $102,203 | $42,270 | $42,270 | $42,270 | $42,270 | $42,270 | $42,270 | $42,270 | $42,270 | |
| Cash Balance | $2,559,896 | $2,714,832 | $2,868,079 | $2,970,281 | $3,012,551 | $3,054,820 | $3,097,090 | $3,139,359 | $3,181,629 | $3,223,898 | $3,266,168 | $3,308,437 | |
| Pro Forma Balance Sheet | |||||||||||||
| Jan | Feb | Mar | Apr | May | Jun | Jul | Aug | Sep | Oct | Nov | Dec | ||
| Assets | Starting Balances | ||||||||||||
| Current Assets | |||||||||||||
| Cash | $2,287,000 | $2,559,896 | $2,714,832 | $2,868,079 | $2,970,281 | $3,012,551 | $3,054,820 | $3,097,090 | $3,139,359 | $3,181,629 | $3,223,898 | $3,266,168 | $3,308,437 |
| Inventory | $600,000 | $487,333 | $374,666 | $312,667 | $312,667 | $312,667 | $312,667 | $312,667 | $312,667 | $312,667 | $312,667 | $312,667 | $312,667 |
| Other Current Assets | $30,000 | $30,000 | $30,000 | $30,000 | $30,000 | $30,000 | $30,000 | $30,000 | $30,000 | $30,000 | $30,000 | $30,000 | $30,000 |
| Total Current Assets | $2,917,000 | $3,077,229 | $3,119,498 | $3,210,745 | $3,312,948 | $3,355,217 | $3,397,487 | $3,439,756 | $3,482,026 | $3,524,295 | $3,566,565 | $3,608,834 | $3,651,104 |
| Long-term Assets | |||||||||||||
| Long-term Assets | $0 | $0 | $0 | $0 | $0 | $0 | $0 | $0 | $0 | $0 | $0 | $0 | $0 |
| Accumulated Depreciation | $0 | $0 | $0 | $0 | $0 | $0 | $0 | $0 | $0 | $0 | $0 | $0 | $0 |
| Total Long-term Assets | $0 | $0 | $0 | $0 | $0 | $0 | $0 | $0 | $0 | $0 | $0 | $0 | $0 |
| Total Assets | $2,917,000 | $3,077,229 | $3,119,498 | $3,210,745 | $3,312,948 | $3,355,217 | $3,397,487 | $3,439,756 | $3,482,026 | $3,524,295 | $3,566,565 | $3,608,834 | $3,651,104 |
| Liabilities and Capital | Jan | Feb | Mar | Apr | May | Jun | Jul | Aug | Sep | Oct | Nov | Dec | |
| Current Liabilities | |||||||||||||
| Accounts Payable | $120,000 | $237,959 | $237,958 | $286,936 | $346,869 | $346,869 | $346,869 | $346,869 | $346,869 | $346,869 | $346,869 | $346,869 | $346,869 |
| Current Borrowing | $0 | $0 | $0 | $0 | $0 | $0 | $0 | $0 | $0 | $0 | $0 | $0 | $0 |
| Other Current Liabilities | $0 | $0 | $0 | $0 | $0 | $0 | $0 | $0 | $0 | $0 | $0 | $0 | $0 |
| Subtotal Current Liabilities | $120,000 | $237,959 | $237,958 | $286,936 | $346,869 | $346,869 | $346,869 | $346,869 | $346,869 | $346,869 | $346,869 | $346,869 | $346,869 |
| Long-term Liabilities | $0 | $0 | $0 | $0 | $0 | $0 | $0 | $0 | $0 | $0 | $0 | $0 | $0 |
| Total Liabilities | $120,000 | $237,959 | $237,958 | $286,936 | $346,869 | $346,869 | $346,869 | $346,869 | $346,869 | $346,869 | $346,869 | $346,869 | $346,869 |
| Paid-in Capital | $1,500,000 | $1,500,000 | $1,500,000 | $1,500,000 | $1,500,000 | $1,500,000 | $1,500,000 | $1,500,000 | $1,500,000 | $1,500,000 | $1,500,000 | $1,500,000 | $1,500,000 |
| Retained Earnings | $1,297,000 | $1,297,000 | $1,297,000 | $1,297,000 | $1,297,000 | $1,297,000 | $1,297,000 | $1,297,000 | $1,297,000 | $1,297,000 | $1,297,000 | $1,297,000 | $1,297,000 |
| Earnings | $0 | $42,270 | $84,539 | $126,809 | $169,078 | $211,348 | $253,617 | $295,887 | $338,156 | $380,426 | $422,695 | $464,965 | $507,234 |
| Total Capital | $2,797,000 | $2,839,270 | $2,881,539 | $2,923,809 | $2,966,078 | $3,008,348 | $3,050,617 | $3,092,887 | $3,135,156 | $3,177,426 | $3,219,695 | $3,261,965 | $3,304,234 |
| Total Liabilities and Capital | $2,917,000 | $3,077,229 | $3,119,498 | $3,210,745 | $3,312,948 | $3,355,217 | $3,397,487 | $3,439,756 | $3,482,026 | $3,524,295 | $3,566,565 | $3,608,834 | $3,651,104 |
| Net Worth | $2,797,000 | $2,839,270 | $2,881,539 | $2,923,809 | $2,966,078 | $3,008,348 | $3,050,617 | $3,092,887 | $3,135,156 | $3,177,426 | $3,219,695 | $3,261,965 | $3,304,234 |

