
The Tooth Fairy
Executive Summary
The Tooth Fairy is the dentistry practice of Steve Extractor. The Tooth Fairy will offer general and cosmetic dentistry to the citizens of Eugene, Oregon. Through a combination of industry benchmark customer service and flexibility, The Tooth Fairy will quickly gain market share.
Steve will leverage the years he spent in private practice to model his new business. His past experience in conjunction with his forward-looking customer-centric business model will allow him to rapidly grow a large and loyal patient base. Profitability will be reached by month 10, and sales will reach comfortable levels by the end of year two.
1.1 Objectives
The objectives for the first years of operation include:
- To create a start-up organization from an already existing practice whose primary goal is to exceed customer’s expectations.
- To increase the number of clients by 20% per year through superior performance and word-of-mouth referrals.
- To form a dentistry practice that is able to eventually survive off its own cash flow.
1.2 Mission
The Tooth Fairy’s mission is to provide the finest dental care. We exist to attract and maintain customers. When we adhere to this maxim, everything else will fall into place. Our services will exceed the expectations of our customers.
1.3 Keys to Success
The key to success is to meet the market need and exceed customer’s expectations.
Company Summary
The Tooth Fairy, to be located in Eugene, OR, will offer both general dentistry as well as cosmetic dentistry. General dentistry consists of primarily of cleaning and fillings, while cosmetic dentistry consists of teeth whitening, veneers, and gap removal. The Tooth Fairy is forecasted to reach profitability by month 10 and have respectable third year profits.
2.1 Company Ownership
The Tooth Fairy is an Oregon limited liability corporation owned by Steve Extractor.
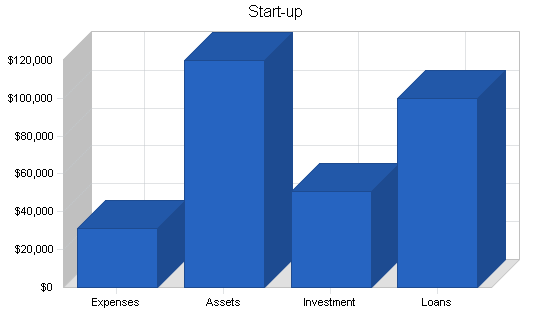
2.2 Start-up Summary
The following are the required start-up costs:
The purchase of Dan Jokerdoc D.D.S.’ private practice. The purchase includes the patient list, office space, front chair and desk, two dental chairs, two light systems, fully-equiped sterilization room, compression air system with a suction unit, x-ray unit, mirrors, and a phone system. This practice has been valued by the following variables: equipment, office space already built for a dentist, goodwill, and future revenue streams. The equipment has been valued at $30,000, $15,000 for tenant improvements on the office space, the patient list at $5,000 and $25,000 for future profitability. The entire practice was sold for $65,000 because Dr. Jokerdoc was in need of quick cash. Statistical studies have shown that patients that are made comfortable are likely to stay with the new doctor when a practice is sold. This will help with cash flow, minimizing the amount of start-up cash. The bulk of the equipment needed will procured through the purchase of the practice, however, there is a lot of equipment that will be needed to be purchased separately.
The following list details what else will be needed.
- Front desk equipment including a Xerox machine, fax machine, a computer terminal with Microsoft office, QuickBooks Pro, laser printer and a CD-RW.
- Disposables which include: assorted trays and explorers, x-ray film, filling material, paper products, and impression material.
- Placing instrument.
- Curing instrument.
- Ultrasonic scaler (for removal of prophylaxis).
- High- and low-speed drills (enough for two operators).
Please note that all items that are to be used for more than a year will be classified as long-term capital assets and will be depreciated using the G.A.A.P approved straight-line method of depreciation.
| Start-up | |
| Requirements | |
| Start-up Expenses | |
| Legal | $1,000 |
| Stationery etc. | $100 |
| Existing Practice (the portion that is not a capital asset | $20,000 |
| Remodeling of office | $10,000 |
| Insurance | $0 |
| Rent | $0 |
| Research and Development | $0 |
| Expensed Equipment | $0 |
| Other | $0 |
| Total Start-up Expenses | $31,100 |
| Start-up Assets | |
| Cash Required | $68,100 |
| Other Current Assets | $0 |
| Long-term Assets | $51,800 |
| Total Assets | $119,900 |
| Total Requirements | $151,000 |
| Start-up Funding | |
| Start-up Expenses to Fund | $31,100 |
| Start-up Assets to Fund | $119,900 |
| Total Funding Required | $151,000 |
| Assets | |
| Non-cash Assets from Start-up | $51,800 |
| Cash Requirements from Start-up | $68,100 |
| Additional Cash Raised | $0 |
| Cash Balance on Starting Date | $68,100 |
| Total Assets | $119,900 |
| Liabilities and Capital | |
| Liabilities | |
| Current Borrowing | $0 |
| Long-term Liabilities | $100,000 |
| Accounts Payable (Outstanding Bills) | $0 |
| Other Current Liabilities (interest-free) | $0 |
| Total Liabilities | $100,000 |
| Capital | |
| Planned Investment | |
| Steve | $51,000 |
| Other | $0 |
| Other | $0 |
| Additional Investment Requirement | $0 |
| Total Planned Investment | $51,000 |
| Loss at Start-up (Start-up Expenses) | ($31,100) |
| Total Capital | $19,900 |
| Total Capital and Liabilities | $119,900 |
| Total Funding | $151,000 |
Services
The Tooth Fairy provides both general improvements consisting primarily of cleaning and fillings, as well as cosmetics improvements. The cost for cleanings are around $100, not including x-rays. The cost for fillings ranges significantly depending on the material used. Dr. Extractor will be deriving the majority of revenue from cosmetics by the end of the year.
Cosmetics can be classified into three main areas:
- Teeth whitening. There are many different ways a tooth can be stained, common causes are age, antibiotics, excess fluoride, illness, and certain beverage consumption. Teeth whitening removes the discoloration and restores the original whiteness. Dr. Extractor is currently using a state-of-art home treatment. The home treatment begins with a casting of the patient’s teeth made from an impression taken at the office. A bleaching tray is made from this impression and the Dr. then provides the patient with all the necessary instructions and material to accomplish the whitening at home. Costs are around $300.
- Veneers. These are porcelain shells that are bonded to the front of the teeth. They reshape the tooth and make the tooth whiter in color. The costs of veneers range from $600-800 per tooth.
- Gap removal. This procedure uses tooth-colored plastic that is bonded to places where there should be tooth material. The removal of gaps makes a significant improvement to a smile. The cost for gap removal ranges from $300-$1,000.
The Tooth Fairy will be billing customers at a per procedure rate. Only a portion of the cosmetics will be billed to an insurance company, the bulk will be paid by the individual.
Market Analysis Summary
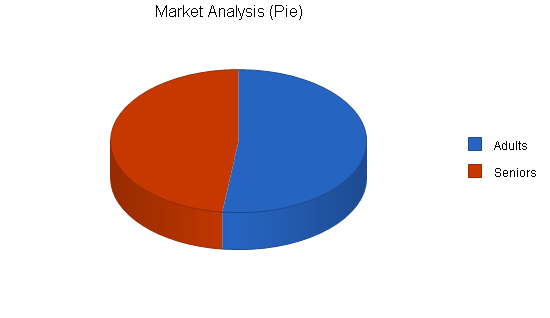
While people of all ages require a general dentist, Dr. Extractor will be concentrating his practice on cosmetic improvements. There are two distinct groups of people who use cosmetic dentistry. The first group is young adults, a group of people that are concerned with their appearance. The second group is seniors, equally concerned with their appearance, but for reasons, typically economic, have not had the ability to get the work done before.
4.1 Market Segmentation
The Tooth Fairy has two distinct groups of customers:
- Adults. Younger adults, typically 27-39 who are concerned with their appearance. This group can be further defined as both male and female with individual incomes over $45,000 a year. While some of the target group are professionals, a large segment of this target segment are-live-at-home spouses who do not have a full time job. This group is more likely than not to consider cosmetic surgery as a method from improving their appearance.
- Seniors. This group sees dental work as a safe way to improve they way they look. They prefer cosmetic dentistry over plastic surgery, which is viewed as a risky cosmetic surgery that this group is less likely to use. The seniors typically live off of more than $50,000 a year in retirement savings. This group is almost entirely retired and their day is mainly composed of leisure time activities.

| Market Analysis | |||||||
| Year 1 | Year 2 | Year 3 | Year 4 | Year 5 | |||
| Potential Customers | Growth | CAGR | |||||
| Adults | 9% | 18,774 | 20,464 | 22,306 | 24,314 | 26,502 | 9.00% |
| Seniors | 8% | 17,321 | 18,707 | 20,204 | 21,820 | 23,566 | 8.00% |
| Total | 8.52% | 36,095 | 39,171 | 42,510 | 46,134 | 50,068 | 8.52% |
4.2 Target Market Segment Strategy
The Tooth Fairy will target two different segments with specific strategies in the marketing campaign. While the Yellow Page advertisements will develop visibility among both groups, the seminars will be specifically directed toward the “seniors.”
4.3 Service Business Analysis
The dentist industry is following a trend away from general maintenance toward cosmetics. There is less rampant decay of teeth now relative to five to 10 years ago so dentists are concentrating on areas where there is increased demand.
Please note that The Tooth Fairly’s growth rate is higher than the industry average. This can be explained by the fact that Steve is concentrating on an emerging niche, and as he is starting a practice from ground zero, so higher than average growth rates can be expected.
4.3.1 Competition and Buying Patterns
There are two forms of competitors:
- The generalist. This type of dentist has a practice centered around general maintenance and does not specialize.
- The specialist. This type of dentist will have a general practice, but in addition to the general practice, they have an area that they specialize in, such as cosmetics.
The buying patterns of patients are based on referrals and trust. People will chose a dentist preferably based on a referral if that is possible. People new to an area may be unable to get a referral so they find a service provider based on advertising or the Yellow Pages and if they feel comfortable with the provider then they tend to form a long-term relationship with them.
Strategy and Implementation Summary
The marketing strategy will utilize three different methods to generate visibility for The Tooth Fairy’s practice. The sales strategy will be based on educating the consumer so that their decision is an informed one. By educating the prospective patient, you are empowering them to make the decision rationally by themselves, making them feel comfortable with their choice.
5.1 Competitive Edge
The Tooth Fairy will leverage their two competitive edges to generate market share.
- Customer service. The Tooth Fairy’s entire practice is based on a customer centric service model. This business model is particularly emphasized when Dr. Extractor is working with patients. The Dr. believes that the patient must make an informed decision regarding their cosmetic needs. The Dr. will take significant time detailing what occurs during the procedure, any side effects the patient may notice, as well as the success/failure rate. Only after the patient has been educated regarding the procedure will the Dr. allow the patient to go forward with the procedure.
- Flexibility. The Dr. recognizes that his patients have busy schedules so he has tailored his practice around being flexible to meet the customers needs. This is an extension to their competitive advantage of customer service, however, the Dr.’s concentration on flexibility is worth noting separately. The Dr. does not have set office hours in which to schedule appointments within. He is willing to schedule an appointment at whatever time is needed, including nights or weekends.
5.2 Marketing Strategy
The marketing strategy will be based on developing visibility among prospective patients. The first aspect of the marketing campaign is a large advertisement in the Yellow Pages which briefly lists the different procedures that the Dr. offers, as well as his flexibility.
Another method to increase visibility will be free informational seminars that the Dr. will offer, typically through community organizations. These seminars are an event where people can go and get more information concerning cosmetics as well as get a free individual consultation. The seminars will be especially attractive to seniors who have more free time, as well as typically take advantage of free informational seminars.
The third marketing strategy will employ networking through the various organizations that the Dr. is a member of including his church, the Lyons club, the Rotary club, as well as the country club. As a visible, active member of these organizations, the Dr. will leverage his personal relationships to generate interest in his services.
5.3 Sales Strategy
The sales strategy is based on educating the consumer as much as possible so that they are asking for the service instead of the Dr. trying to convince them they should have the procedure done. This method is quite effective because it allows the consumer to feel that they arrived at the decision themselves instead of them agreeing to a sales pitch.
When a patient comes in to see the doctor, there is no charge for the initial consultation. During this consultation, the Dr. will educate the customer on the different procedures and then analyze the patient’s particular needs. The patient is then free to ask any questions they have. After the customer is fully knowledgeable about all the different variables that will effect their procedure, they are then allowed to make a decision as to whether to have any work done. This sales strategy is geared toward turning prospective customers into long-term customers who are then quite vocal to their friends about the pleasant experiences they had with The Tooth Fairy.
5.3.1 Sales Forecast
The first month will be used to get the new office in order, set up appointments and begin marketing activities. Month two will see a few appointments, primarily from the prior practice. Months five through seven will see a jump in cosmetic appointments. After month seven, there should be a steady increase in sales activity.


| Sales Forecast | |||
| Year 1 | Year 2 | Year 3 | |
| Sales | |||
| General dentistry | $58,551 | $82,343 | $97,656 |
| Cosmetics | $118,321 | $267,545 | $312,912 |
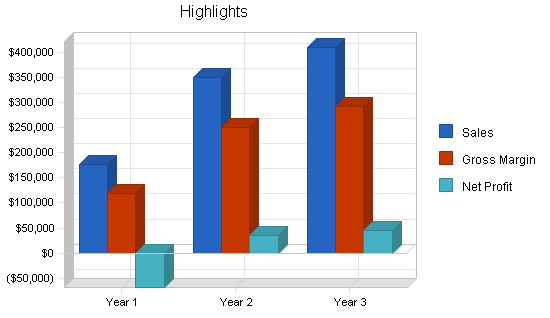
| Total Sales | $176,872 | $349,888 | $410,568 |
| Direct Cost of Sales | Year 1 | Year 2 | Year 3 |
| General dentistry | $35,131 | $49,406 | $58,594 |
| Cosmetics | $22,481 | $50,834 | $59,453 |
| Subtotal Direct Cost of Sales | $57,612 | $100,239 | $118,047 |
5.4 Milestones
The Tooth Fairy will have several milestones early on:
- Business plan completion.
- Office set-up.
- The 20th cosmetic procedure.
- Profitability.
| Milestones | |||||
| Milestone | Start Date | End Date | Budget | Manager | Department |
| Business plan completion | 1/1/2001 | 2/1/2001 | $0 | Steve | Steve |
| Office set-up | 1/1/2001 | 2/1/2001 | $0 | Steve | Steve |
| The 20th cosmetic procedure | 1/1/2001 | 3/1/2001 | $0 | Steve | Steve |
| Profitability | 1/1/2001 | 11/1/2001 | $0 | Steve | Everyone |
| Totals | $0 | ||||
Management Summary
Steve Extractor got his undergraduate degree in biology from Case Western Reserve. While at Case, Steve knew he wanted to practice health care but was unsure of exactly what. Toward the end of his years at Case, Steve discovered his interest in dentistry.
Several years later Steve became a graduate of The Ohio State University College of Dentistry. Steve knew that he did not want to live in Ohio for the rest of his life so he immediately upon graduating moved out to Oregon, a state that he was always fond of due to its natural beauty. The first four months were difficult to make contacts and find a job, but Steve eventually landed a job in an eight person firm doing general dentistry.
This was a good environment for Steve because it allowed him to use his colleagues as mentors to grow his skill sets. Steve spent five years practicing general dentistry, and by this time, Steve was no longer developing professionally so he decided to learn new cosmetic techniques. While still practicing, Steve began to shadow his colleagues learning cosmetic techniques. After four months of the shadowing, Steve began to see clients for cosmetic procedures and was quite proficient.
At this point friction within the practice began to surface as the other Drs. began to feel threatened by Steve’s new skills and thought that his success would be at the expense of their profits. It was then that Steve decided that his best career move would be to open up his own practice, allowing him the freedom to manage it himself. He began by looking for already established practices which would allow him to open his practice quicker because all the equipment was set up and ready to go. In order to save money when purchasing an existing practice, Steve decided to look for practices that did not have a large list of patients. After several months of looking, Steve found a Dr. who was retiring with a small list of patients and went into negotiations for the practice. After three weeks, the deal was sealed.
6.1 Personnel Plan
In addition to Steve, a hygienist, a dental assistant and a front desk person will be hired during month two.
| Personnel Plan | |||
| Year 1 | Year 2 | Year 3 | |
| Steve | $48,000 | $60,000 | $80,000 |
| Hygienist | $27,500 | $30,000 | $32,000 |
| Assistant | $24,200 | $26,400 | $28,000 |
| Front desk person | $22,000 | $24,000 | $26,000 |
| Total People | 4 | 4 | 4 |
| Total Payroll | $121,700 | $140,400 | $166,000 |
Financial Plan
The following sections will outline important financial information.
7.1 Important Assumptions
The following table details important financial assumptions.
| General Assumptions | |||
| Year 1 | Year 2 | Year 3 | |
| Plan Month | 1 | 2 | 3 |
| Current Interest Rate | 10.00% | 10.00% | 10.00% |
| Long-term Interest Rate | 10.00% | 10.00% | 10.00% |
| Tax Rate | 30.00% | 30.00% | 30.00% |
| Other | 0 | 0 | 0 |
7.2 Break-even Analysis
The Break-even Analysis indicates what will be needed in monthly revenue to reach the break-even point.

| Break-even Analysis | |
| Monthly Revenue Break-even | $22,025 |
| Assumptions: | |
| Average Percent Variable Cost | 33% |
| Estimated Monthly Fixed Cost | $14,851 |
7.3 Projected Profit and Loss
The following table will indicate projected profit and loss.


| Pro Forma Profit and Loss | |||
| Year 1 | Year 2 | Year 3 | |
| Sales | $176,872 | $349,888 | $410,568 |
| Direct Cost of Sales | $57,612 | $100,239 | $118,047 |
| Other Production Expenses | $0 | $0 | $0 |
| Total Cost of Sales | $57,612 | $100,239 | $118,047 |
| Gross Margin | $119,260 | $249,649 | $292,521 |
| Gross Margin % | 67.43% | 71.35% | 71.25% |
| Expenses | |||
| Payroll | $121,700 | $140,400 | $166,000 |
| Sales and Marketing and Other Expenses | $2,700 | $2,700 | $2,700 |
| Depreciation | $10,356 | $863 | $863 |
| ADA dues | $600 | $600 | $600 |
| Utilities | $1,800 | $1,800 | $1,800 |
| Insurance- office and malpractice | $4,800 | $4,800 | $4,800 |
| Rent | $18,000 | $18,000 | $18,000 |
| Payroll Taxes | $18,255 | $21,060 | $24,900 |
| Other | $0 | $0 | $0 |
| Total Operating Expenses | $178,211 | $190,223 | $219,663 |
| Profit Before Interest and Taxes | ($58,951) | $59,426 | $72,858 |
| EBITDA | ($48,595) | $60,289 | $73,721 |
| Interest Expense | $9,670 | $9,053 | $8,362 |
| Taxes Incurred | $0 | $15,112 | $19,349 |
| Net Profit | ($68,621) | $35,261 | $45,147 |
| Net Profit/Sales | -38.80% | 10.08% | 11.00% |
7.4 Projected Cash Flow
The following chart and table will indicate projected cash flow.

| Pro Forma Cash Flow | |||
| Year 1 | Year 2 | Year 3 | |
| Cash Received | |||
| Cash from Operations | |||
| Cash Sales | $176,872 | $349,888 | $410,568 |
| Subtotal Cash from Operations | $176,872 | $349,888 | $410,568 |
| Additional Cash Received | |||
| Sales Tax, VAT, HST/GST Received | $0 | $0 | $0 |
| New Current Borrowing | $0 | $0 | $0 |
| New Other Liabilities (interest-free) | $0 | $0 | $0 |
| New Long-term Liabilities | $0 | $0 | $0 |
| Sales of Other Current Assets | $0 | $0 | $0 |
| Sales of Long-term Assets | $0 | $0 | $0 |
| New Investment Received | $0 | $0 | $0 |
| Subtotal Cash Received | $176,872 | $349,888 | $410,568 |
| Expenditures | Year 1 | Year 2 | Year 3 |
| Expenditures from Operations | |||
| Cash Spending | $121,700 | $140,400 | $166,000 |
| Bill Payments | $100,579 | $171,973 | $196,487 |
| Subtotal Spent on Operations | $222,279 | $312,373 | $362,487 |
| Additional Cash Spent | |||
| Sales Tax, VAT, HST/GST Paid Out | $0 | $0 | $0 |
| Principal Repayment of Current Borrowing | $0 | $0 | $0 |
| Other Liabilities Principal Repayment | $0 | $0 | $0 |
| Long-term Liabilities Principal Repayment | $6,185 | $6,576 | $7,232 |
| Purchase Other Current Assets | $0 | $0 | $0 |
| Purchase Long-term Assets | $0 | $0 | $0 |
| Dividends | $0 | $0 | $0 |
| Subtotal Cash Spent | $228,464 | $318,949 | $369,719 |
| Net Cash Flow | ($51,592) | $30,939 | $40,849 |
| Cash Balance | $16,508 | $47,447 | $88,296 |
7.5 Projected Balance Sheet
The following table will indicate the projected balance sheet.
| Pro Forma Balance Sheet | |||
| Year 1 | Year 2 | Year 3 | |
| Assets | |||
| Current Assets | |||
| Cash | $16,508 | $47,447 | $88,296 |
| Other Current Assets | $0 | $0 | $0 |
| Total Current Assets | $16,508 | $47,447 | $88,296 |
| Long-term Assets | |||
| Long-term Assets | $51,800 | $51,800 | $51,800 |
| Accumulated Depreciation | $10,356 | $11,219 | $12,082 |
| Total Long-term Assets | $41,444 | $40,581 | $39,718 |
| Total Assets | $57,952 | $88,028 | $128,014 |
| Liabilities and Capital | Year 1 | Year 2 | Year 3 |
| Current Liabilities | |||
| Accounts Payable | $12,858 | $14,249 | $16,320 |
| Current Borrowing | $0 | $0 | $0 |
| Other Current Liabilities | $0 | $0 | $0 |
| Subtotal Current Liabilities | $12,858 | $14,249 | $16,320 |
| Long-term Liabilities | $93,815 | $87,239 | $80,007 |
| Total Liabilities | $106,672 | $101,488 | $96,327 |
| Paid-in Capital | $51,000 | $51,000 | $51,000 |
| Retained Earnings | ($31,100) | ($99,721) | ($64,460) |
| Earnings | ($68,621) | $35,261 | $45,147 |
| Total Capital | ($48,721) | ($13,460) | $31,688 |
| Total Liabilities and Capital | $57,952 | $88,028 | $128,014 |
| Net Worth | ($48,721) | ($13,460) | $31,688 |
7.6 Business Ratios
Business ratios for the years of this plan are shown below. Industry profile ratios based on the Standard Industrial Classification (SIC) code 8021, Offices of Dentists, are shown for comparison.
| Ratio Analysis | ||||
| Year 1 | Year 2 | Year 3 | Industry Profile | |
| Sales Growth | 0.00% | 97.82% | 17.34% | 6.10% |
| Percent of Total Assets | ||||
| Other Current Assets | 0.00% | 0.00% | 0.00% | 45.00% |
| Total Current Assets | 28.49% | 53.90% | 68.97% | 62.20% |
| Long-term Assets | 71.51% | 46.10% | 31.03% | 37.80% |
| Total Assets | 100.00% | 100.00% | 100.00% | 100.00% |
| Current Liabilities | 22.19% | 16.19% | 12.75% | 30.10% |
| Long-term Liabilities | 161.88% | 99.10% | 62.50% | 30.10% |
| Total Liabilities | 184.07% | 115.29% | 75.25% | 60.20% |
| Net Worth | -84.07% | -15.29% | 24.75% | 39.80% |
| Percent of Sales | ||||
| Sales | 100.00% | 100.00% | 100.00% | 100.00% |
| Gross Margin | 67.43% | 71.35% | 71.25% | 0.00% |
| Selling, General & Administrative Expenses | 106.22% | 61.27% | 60.25% | 68.30% |
| Advertising Expenses | 1.36% | 0.69% | 0.58% | 1.60% |
| Profit Before Interest and Taxes | -33.33% | 16.98% | 17.75% | 3.40% |
| Main Ratios | ||||
| Current | 1.28 | 3.33 | 5.41 | 2.11 |
| Quick | 1.28 | 3.33 | 5.41 | 1.70 |
| Total Debt to Total Assets | 184.07% | 115.29% | 75.25% | 60.20% |
| Pre-tax Return on Net Worth | 140.85% | -374.25% | 203.54% | 10.00% |
| Pre-tax Return on Assets | -118.41% | 57.22% | 50.38% | 25.20% |
| Additional Ratios | Year 1 | Year 2 | Year 3 | |
| Net Profit Margin | -38.80% | 10.08% | 11.00% | n.a |
| Return on Equity | 0.00% | 0.00% | 142.48% | n.a |
| Activity Ratios | ||||
| Accounts Payable Turnover | 8.82 | 12.17 | 12.17 | n.a |
| Payment Days | 27 | 29 | 28 | n.a |
| Total Asset Turnover | 3.05 | 3.97 | 3.21 | n.a |
| Debt Ratios | ||||
| Debt to Net Worth | 0.00 | 0.00 | 3.04 | n.a |
| Current Liab. to Liab. | 0.12 | 0.14 | 0.17 | n.a |
| Liquidity Ratios | ||||
| Net Working Capital | $3,650 | $33,198 | $71,976 | n.a |
| Interest Coverage | -6.10 | 6.56 | 8.71 | n.a |
| Additional Ratios | ||||
| Assets to Sales | 0.33 | 0.25 | 0.31 | n.a |
| Current Debt/Total Assets | 22% | 16% | 13% | n.a |
| Acid Test | 1.28 | 3.33 | 5.41 | n.a |
| Sales/Net Worth | 0.00 | 0.00 | 12.96 | n.a |
| Dividend Payout | 0.00 | 0.00 | 0.00 | n.a |
Appendix
| Sales Forecast | |||||||||||||
| Month 1 | Month 2 | Month 3 | Month 4 | Month 5 | Month 6 | Month 7 | Month 8 | Month 9 | Month 10 | Month 11 | Month 12 | ||
| Sales | |||||||||||||
| General dentistry | 0% | $0 | $3,500 | $3,800 | $4,454 | $5,142 | $5,334 | $5,565 | $5,645 | $6,001 | $6,224 | $6,343 | $6,543 |
| Cosmetics | 0% | $0 | $0 | $0 | $4,500 | $5,232 | $8,876 | $9,876 | $11,746 | $14,545 | $17,656 | $21,345 | $24,545 |
| Total Sales | $0 | $3,500 | $3,800 | $8,954 | $10,374 | $14,210 | $15,441 | $17,391 | $20,546 | $23,880 | $27,688 | $31,088 | |
| Direct Cost of Sales | Month 1 | Month 2 | Month 3 | Month 4 | Month 5 | Month 6 | Month 7 | Month 8 | Month 9 | Month 10 | Month 11 | Month 12 | |
| General dentistry | $0 | $2,100 | $2,280 | $2,672 | $3,085 | $3,200 | $3,339 | $3,387 | $3,601 | $3,734 | $3,806 | $3,926 | |
| Cosmetics | $0 | $0 | $0 | $855 | $994 | $1,686 | $1,876 | $2,232 | $2,764 | $3,355 | $4,056 | $4,664 | |
| Subtotal Direct Cost of Sales | $0 | $2,100 | $2,280 | $3,527 | $4,079 | $4,887 | $5,215 | $5,619 | $6,364 | $7,089 | $7,861 | $8,589 | |
| Personnel Plan | |||||||||||||
| Month 1 | Month 2 | Month 3 | Month 4 | Month 5 | Month 6 | Month 7 | Month 8 | Month 9 | Month 10 | Month 11 | Month 12 | ||
| Steve | 0% | $4,000 | $4,000 | $4,000 | $4,000 | $4,000 | $4,000 | $4,000 | $4,000 | $4,000 | $4,000 | $4,000 | $4,000 |
| Hygienist | 0% | $0 | $2,500 | $2,500 | $2,500 | $2,500 | $2,500 | $2,500 | $2,500 | $2,500 | $2,500 | $2,500 | $2,500 |
| Assistant | 0% | $0 | $2,200 | $2,200 | $2,200 | $2,200 | $2,200 | $2,200 | $2,200 | $2,200 | $2,200 | $2,200 | $2,200 |
| Front desk person | 0% | $0 | $2,000 | $2,000 | $2,000 | $2,000 | $2,000 | $2,000 | $2,000 | $2,000 | $2,000 | $2,000 | $2,000 |
| Total People | 1 | 4 | 4 | 4 | 4 | 4 | 4 | 4 | 4 | 4 | 4 | 4 | |
| Total Payroll | $4,000 | $10,700 | $10,700 | $10,700 | $10,700 | $10,700 | $10,700 | $10,700 | $10,700 | $10,700 | $10,700 | $10,700 | |
| General Assumptions | |||||||||||||
| Month 1 | Month 2 | Month 3 | Month 4 | Month 5 | Month 6 | Month 7 | Month 8 | Month 9 | Month 10 | Month 11 | Month 12 | ||
| Plan Month | 1 | 2 | 3 | 4 | 5 | 6 | 7 | 8 | 9 | 10 | 11 | 12 | |
| Current Interest Rate | 10.00% | 10.00% | 10.00% | 10.00% | 10.00% | 10.00% | 10.00% | 10.00% | 10.00% | 10.00% | 10.00% | 10.00% | |
| Long-term Interest Rate | 10.00% | 10.00% | 10.00% | 10.00% | 10.00% | 10.00% | 10.00% | 10.00% | 10.00% | 10.00% | 10.00% | 10.00% | |
| Tax Rate | 30.00% | 30.00% | 30.00% | 30.00% | 30.00% | 30.00% | 30.00% | 30.00% | 30.00% | 30.00% | 30.00% | 30.00% | |
| Other | 0 | 0 | 0 | 0 | 0 | 0 | 0 | 0 | 0 | 0 | 0 | 0 | |
| Pro Forma Profit and Loss | |||||||||||||
| Month 1 | Month 2 | Month 3 | Month 4 | Month 5 | Month 6 | Month 7 | Month 8 | Month 9 | Month 10 | Month 11 | Month 12 | ||
| Sales | $0 | $3,500 | $3,800 | $8,954 | $10,374 | $14,210 | $15,441 | $17,391 | $20,546 | $23,880 | $27,688 | $31,088 | |
| Direct Cost of Sales | $0 | $2,100 | $2,280 | $3,527 | $4,079 | $4,887 | $5,215 | $5,619 | $6,364 | $7,089 | $7,861 | $8,589 | |
| Other Production Expenses | $0 | $0 | $0 | $0 | $0 | $0 | $0 | $0 | $0 | $0 | $0 | $0 | |
| Total Cost of Sales | $0 | $2,100 | $2,280 | $3,527 | $4,079 | $4,887 | $5,215 | $5,619 | $6,364 | $7,089 | $7,861 | $8,589 | |
| Gross Margin | $0 | $1,400 | $1,520 | $5,427 | $6,295 | $9,323 | $10,226 | $11,772 | $14,182 | $16,791 | $19,827 | $22,499 | |
| Gross Margin % | 0.00% | 40.00% | 40.00% | 60.61% | 60.68% | 65.61% | 66.22% | 67.69% | 69.02% | 70.31% | 71.61% | 72.37% | |
| Expenses | |||||||||||||
| Payroll | $4,000 | $10,700 | $10,700 | $10,700 | $10,700 | $10,700 | $10,700 | $10,700 | $10,700 | $10,700 | $10,700 | $10,700 | |
| Sales and Marketing and Other Expenses | $225 | $225 | $225 | $225 | $225 | $225 | $225 | $225 | $225 | $225 | $225 | $225 | |
| Depreciation | $863 | $863 | $863 | $863 | $863 | $863 | $863 | $863 | $863 | $863 | $863 | $863 | |
| ADA dues | $50 | $50 | $50 | $50 | $50 | $50 | $50 | $50 | $50 | $50 | $50 | $50 | |
| Utilities | $150 | $150 | $150 | $150 | $150 | $150 | $150 | $150 | $150 | $150 | $150 | $150 | |
| Insurance- office and malpractice | $400 | $400 | $400 | $400 | $400 | $400 | $400 | $400 | $400 | $400 | $400 | $400 | |
| Rent | $1,500 | $1,500 | $1,500 | $1,500 | $1,500 | $1,500 | $1,500 | $1,500 | $1,500 | $1,500 | $1,500 | $1,500 | |
| Payroll Taxes | 15% | $600 | $1,605 | $1,605 | $1,605 | $1,605 | $1,605 | $1,605 | $1,605 | $1,605 | $1,605 | $1,605 | $1,605 |
| Other | $0 | $0 | $0 | $0 | $0 | $0 | $0 | $0 | $0 | $0 | $0 | $0 | |
| Total Operating Expenses | $7,788 | $15,493 | $15,493 | $15,493 | $15,493 | $15,493 | $15,493 | $15,493 | $15,493 | $15,493 | $15,493 | $15,493 | |
| Profit Before Interest and Taxes | ($7,788) | ($14,093) | ($13,973) | ($10,066) | ($9,198) | ($6,170) | ($5,267) | ($3,721) | ($1,311) | $1,298 | $4,334 | $7,006 | |
| EBITDA | ($6,925) | ($13,230) | ($13,110) | ($9,203) | ($8,335) | ($5,307) | ($4,404) | ($2,858) | ($448) | $2,161 | $5,197 | $7,869 | |
| Interest Expense | $829 | $825 | $821 | $817 | $812 | $808 | $804 | $800 | $795 | $791 | $786 | $782 | |
| Taxes Incurred | $0 | $0 | $0 | $0 | $0 | $0 | $0 | $0 | $0 | $0 | $0 | $0 | |
| Net Profit | ($8,617) | ($14,918) | ($14,794) | ($10,883) | ($10,011) | ($6,978) | ($6,071) | ($4,520) | ($2,106) | $507 | $3,547 | $6,224 | |
| Net Profit/Sales | 0.00% | -426.23% | -389.31% | -121.54% | -96.50% | -49.11% | -39.32% | -25.99% | -10.25% | 2.12% | 12.81% | 20.02% | |
| Pro Forma Cash Flow | |||||||||||||
| Month 1 | Month 2 | Month 3 | Month 4 | Month 5 | Month 6 | Month 7 | Month 8 | Month 9 | Month 10 | Month 11 | Month 12 | ||
| Cash Received | |||||||||||||
| Cash from Operations | |||||||||||||
| Cash Sales | $0 | $3,500 | $3,800 | $8,954 | $10,374 | $14,210 | $15,441 | $17,391 | $20,546 | $23,880 | $27,688 | $31,088 | |
| Subtotal Cash from Operations | $0 | $3,500 | $3,800 | $8,954 | $10,374 | $14,210 | $15,441 | $17,391 | $20,546 | $23,880 | $27,688 | $31,088 | |
| Additional Cash Received | |||||||||||||
| Sales Tax, VAT, HST/GST Received | 0.00% | $0 | $0 | $0 | $0 | $0 | $0 | $0 | $0 | $0 | $0 | $0 | $0 |
| New Current Borrowing | $0 | $0 | $0 | $0 | $0 | $0 | $0 | $0 | $0 | $0 | $0 | $0 | |
| New Other Liabilities (interest-free) | $0 | $0 | $0 | $0 | $0 | $0 | $0 | $0 | $0 | $0 | $0 | $0 | |
| New Long-term Liabilities | $0 | $0 | $0 | $0 | $0 | $0 | $0 | $0 | $0 | $0 | $0 | $0 | |
| Sales of Other Current Assets | $0 | $0 | $0 | $0 | $0 | $0 | $0 | $0 | $0 | $0 | $0 | $0 | |
| Sales of Long-term Assets | $0 | $0 | $0 | $0 | $0 | $0 | $0 | $0 | $0 | $0 | $0 | $0 | |
| New Investment Received | $0 | $0 | $0 | $0 | $0 | $0 | $0 | $0 | $0 | $0 | $0 | $0 | |
| Subtotal Cash Received | $0 | $3,500 | $3,800 | $8,954 | $10,374 | $14,210 | $15,441 | $17,391 | $20,546 | $23,880 | $27,688 | $31,088 | |
| Expenditures | Month 1 | Month 2 | Month 3 | Month 4 | Month 5 | Month 6 | Month 7 | Month 8 | Month 9 | Month 10 | Month 11 | Month 12 | |
| Expenditures from Operations | |||||||||||||
| Cash Spending | $4,000 | $10,700 | $10,700 | $10,700 | $10,700 | $10,700 | $10,700 | $10,700 | $10,700 | $10,700 | $10,700 | $10,700 | |
| Bill Payments | $125 | $3,858 | $6,861 | $7,072 | $8,292 | $8,849 | $9,636 | $9,963 | $10,373 | $11,113 | $11,835 | $12,602 | |
| Subtotal Spent on Operations | $4,125 | $14,558 | $17,561 | $17,772 | $18,992 | $19,549 | $20,336 | $20,663 | $21,073 | $21,813 | $22,535 | $23,302 | |
| Additional Cash Spent | |||||||||||||
| Sales Tax, VAT, HST/GST Paid Out | $0 | $0 | $0 | $0 | $0 | $0 | $0 | $0 | $0 | $0 | $0 | $0 | |
| Principal Repayment of Current Borrowing | $0 | $0 | $0 | $0 | $0 | $0 | $0 | $0 | $0 | $0 | $0 | $0 | |
| Other Liabilities Principal Repayment | $0 | $0 | $0 | $0 | $0 | $0 | $0 | $0 | $0 | $0 | $0 | $0 | |
| Long-term Liabilities Principal Repayment | $492 | $496 | $500 | $505 | $509 | $513 | $517 | $522 | $526 | $530 | $535 | $539 | |
| Purchase Other Current Assets | $0 | $0 | $0 | $0 | $0 | $0 | $0 | $0 | $0 | $0 | $0 | $0 | |
| Purchase Long-term Assets | $0 | $0 | $0 | $0 | $0 | $0 | $0 | $0 | $0 | $0 | $0 | $0 | |
| Dividends | $0 | $0 | $0 | $0 | $0 | $0 | $0 | $0 | $0 | $0 | $0 | $0 | |
| Subtotal Cash Spent | $4,617 | $15,054 | $18,061 | $18,277 | $19,501 | $20,062 | $20,853 | $21,184 | $21,599 | $22,344 | $23,070 | $23,841 | |
| Net Cash Flow | ($4,617) | ($11,554) | ($14,261) | ($9,323) | ($9,127) | ($5,852) | ($5,412) | ($3,793) | ($1,053) | $1,536 | $4,618 | $7,247 | |
| Cash Balance | $63,483 | $51,929 | $37,667 | $28,344 | $19,217 | $13,365 | $7,953 | $4,160 | $3,107 | $4,643 | $9,261 | $16,508 | |
| Pro Forma Balance Sheet | |||||||||||||
| Month 1 | Month 2 | Month 3 | Month 4 | Month 5 | Month 6 | Month 7 | Month 8 | Month 9 | Month 10 | Month 11 | Month 12 | ||
| Assets | Starting Balances | ||||||||||||
| Current Assets | |||||||||||||
| Cash | $68,100 | $63,483 | $51,929 | $37,667 | $28,344 | $19,217 | $13,365 | $7,953 | $4,160 | $3,107 | $4,643 | $9,261 | $16,508 |
| Other Current Assets | $0 | $0 | $0 | $0 | $0 | $0 | $0 | $0 | $0 | $0 | $0 | $0 | $0 |
| Total Current Assets | $68,100 | $63,483 | $51,929 | $37,667 | $28,344 | $19,217 | $13,365 | $7,953 | $4,160 | $3,107 | $4,643 | $9,261 | $16,508 |
| Long-term Assets | |||||||||||||
| Long-term Assets | $51,800 | $51,800 | $51,800 | $51,800 | $51,800 | $51,800 | $51,800 | $51,800 | $51,800 | $51,800 | $51,800 | $51,800 | $51,800 |
| Accumulated Depreciation | $0 | $863 | $1,726 | $2,589 | $3,452 | $4,315 | $5,178 | $6,041 | $6,904 | $7,767 | $8,630 | $9,493 | $10,356 |
| Total Long-term Assets | $51,800 | $50,937 | $50,074 | $49,211 | $48,348 | $47,485 | $46,622 | $45,759 | $44,896 | $44,033 | $43,170 | $42,307 | $41,444 |
| Total Assets | $119,900 | $114,420 | $102,003 | $86,878 | $76,692 | $66,702 | $59,987 | $53,712 | $49,056 | $47,140 | $47,813 | $51,568 | $57,952 |
| Liabilities and Capital | Month 1 | Month 2 | Month 3 | Month 4 | Month 5 | Month 6 | Month 7 | Month 8 | Month 9 | Month 10 | Month 11 | Month 12 | |
| Current Liabilities | |||||||||||||
| Accounts Payable | $0 | $3,629 | $6,627 | $6,797 | $7,998 | $8,528 | $9,304 | $9,618 | $10,003 | $10,720 | $11,416 | $12,158 | $12,858 |
| Current Borrowing | $0 | $0 | $0 | $0 | $0 | $0 | $0 | $0 | $0 | $0 | $0 | $0 | $0 |
| Other Current Liabilities | $0 | $0 | $0 | $0 | $0 | $0 | $0 | $0 | $0 | $0 | $0 | $0 | $0 |
| Subtotal Current Liabilities | $0 | $3,629 | $6,627 | $6,797 | $7,998 | $8,528 | $9,304 | $9,618 | $10,003 | $10,720 | $11,416 | $12,158 | $12,858 |
| Long-term Liabilities | $100,000 | $99,508 | $99,011 | $98,511 | $98,006 | $97,497 | $96,984 | $96,467 | $95,945 | $95,419 | $94,889 | $94,354 | $93,815 |
| Total Liabilities | $100,000 | $103,137 | $105,638 | $105,307 | $106,005 | $106,025 | $106,289 | $106,085 | $105,949 | $106,139 | $106,305 | $106,512 | $106,672 |
| Paid-in Capital | $51,000 | $51,000 | $51,000 | $51,000 | $51,000 | $51,000 | $51,000 | $51,000 | $51,000 | $51,000 | $51,000 | $51,000 | $51,000 |
| Retained Earnings | ($31,100) | ($31,100) | ($31,100) | ($31,100) | ($31,100) | ($31,100) | ($31,100) | ($31,100) | ($31,100) | ($31,100) | ($31,100) | ($31,100) | ($31,100) |
| Earnings | $0 | ($8,617) | ($23,535) | ($38,329) | ($49,212) | ($59,223) | ($66,201) | ($72,273) | ($76,793) | ($78,899) | ($78,392) | ($74,845) | ($68,621) |
| Total Capital | $19,900 | $11,283 | ($3,635) | ($18,429) | ($29,312) | ($39,323) | ($46,301) | ($52,373) | ($56,893) | ($58,999) | ($58,492) | ($54,945) | ($48,721) |
| Total Liabilities and Capital | $119,900 | $114,420 | $102,003 | $86,878 | $76,692 | $66,702 | $59,987 | $53,712 | $49,056 | $47,140 | $47,813 | $51,568 | $57,952 |
| Net Worth | $19,900 | $11,283 | ($3,635) | ($18,429) | ($29,312) | ($39,323) | ($46,301) | ($52,373) | ($56,893) | ($58,999) | ($58,492) | ($54,945) | ($48,721) |

