
Wright's Dental Lab
Executive Summary
Wright’s Dental Laboratory is being established with the goal of providing dentists with restorations of superior quality and value. We offer all the state-of-the-art esthetic materials. Our product quality and services are excellent.
At Wright’s Dental Laboratory, we recognize that every practice is different… and every doctor is unique. We will take the time to listen to casework problems. Examine the doctor’s individual situation. In short, we reach a full understanding of their needs before we recommend a solution. Then, working as their partner, we put our extensive resources to work for them.
The result is creative and practical solutions to their casework needs on a consistent basis. All backed by over twenty-five years of experience and an investment in the techniques that enhance patient care quality like Product C*, Brand B, Brand B Model 2, and Product E, as well as all the premier implant systems. At Wright’s Dental Laboratory, our products and services are a valuable complement to well-established restorative treatment plans that promote aesthetics, tooth reinforcement and conservative preparation techniques.
*Registered Trademark brand and product names have been disguised throughout this sample plan.
Keys to Success
The keys to success for Wright’s Dental Laboratory are:
- Our dental laboratory must continually adjust its methods to meet the constantly evolving challenges of dentistry and aspirations of the dental professional.
- Our dental laboratory must be deeply and loyally committed to maintaining CONSISTENT product excellence.
- Our dental laboratory’s only dynamic resource is people. It must develop opportunities for each person to use his/her abilities to the utmost of their potential.
Objectives
The objectives of Wright’s Dental Laboratory are as follows:
- Increase sales significantly each year.
- Increase the number of dentists using lab services aggressively each year.
- Expand service area to include the entire LochJaw tri-county area.

Company Summary
Wright’s Dental Laboratory offers state-of-the-art dental restorations services to dental professionals.
Charles Wright attended State University and is a certified dental technician. He entered the dental laboratory industry in 1994 and by 2000 he had established his own small dental laboratory. Charles now joins his expertise with that of his brother, David, to create Wright’s Dental Laboratory. The synergy of their respective talents will allow the precision restorative capabilities of Wright’s Dental Laboratory to consistently provide leading-edge technologies and a high index of progressive services to the profession in the greater LochJaw area.
As an advocate of continuing dental education, Mr. Wright’s commitment to continuing education is illustrated by his involvement with metal-free restorations. Charles has successfully completed training in such state of the art techniques as Product E and Product E model 2 and Brand B model 2. He has also completed training for all the premier implant systems including Brand J, Brand K, Product L, Product M, Brand N, and Brand O.
Among his accomplishments, Charles has held the posts of vice president, secretary and treasurer of the Oregon State Dental Laboratory Association. Additionally, he is a member of the National Association of Dental Laboratories (NADL), the State Dental Laboratory Association and the American Academy of Cosmetic Dentistry (AACD).
David Wright attended State University and is a certified dental technician. He has spent over ten years working with some of the region’s most respected practitioners. David is committed to continuing education and has successfully completed Corporation X’s Advanced Crown & Bridge Dental Studies. He has also successfully completed training in all the premier implant systems including Brand J, Brand K, Product L, Product M, Brand N and Brand O.
David entered the dental laboratory industry in 1991. He began his training under the tutelage of his father with various phases of fixed and removable techniques. Over the years, David completed his training to become fully proficient in the design and fabrication of precision attachment restorations, implants and full mouth rehabilitation cases.
Start-up Summary
The start-up cost of Wright’s Dental Laboratory will consist primarily of equipment. Charles and David will each invest personal funds and also secure a long-term loan.

| Start-up | |
| Requirements | |
| Start-up Expenses | |
| Legal | $1,000 |
| Stationery etc. | $300 |
| Brochures | $1,000 |
| Insurance | $2,000 |
| Rent | $2,000 |
| Lab Setup | $30,000 |
| Office Setup | $20,000 |
| Expensed Equipment | $20,000 |
| Total Start-up Expenses | $76,300 |
| Start-up Assets | |
| Cash Required | $71,700 |
| Start-up Inventory | $10,000 |
| Other Current Assets | $12,000 |
| Long-term Assets | $80,000 |
| Total Assets | $173,700 |
| Total Requirements | $250,000 |
Company Ownership
Wright’s Dental Laboratory, located in a custom designed, 8,000 square foot facility using the latest, state-of-the-art restoration production systems and computerized case tracking, is owned by Charles and David Wright. The company will operate as a general partnership with both Charles and David performing management functions.
Wright’s Dental Laboratory offers state-of-the-art dental restorations services to dental professionals.
Charles Wright attended State University and is a certified dental technician. He entered the dental laboratory industry in 1994 and by 2000 he had established his own small dental laboratory. Charles now joins his expertise with that of his brother, David, to create Wright’s Dental Laboratory. The synergy of their respective talents will allow the precision restorative capabilities of Wright’s Dental Laboratory to consistently provide leading-edge technologies and a high index of progressive services to the profession in the greater LochJaw area.
As an advocate of continuing dental education, Mr. Wright’s commitment to continuing education is illustrated by his involvement with metal-free restorations. Charles has successfully completed training in such state of the art techniques as Product E and Product E model 2 and Brand B model 2. He has also completed training for all the premier implant systems including Brand J, Brand K, Product L, Product M, Brand N, and Brand O.
Among his accomplishments, Charles has held the posts of vice president, secretary and treasurer of the Oregon State Dental Laboratory Association. Additionally, he is a member of the National Association of Dental Laboratories (NADL), the State Dental Laboratory Association and the American Academy of Cosmetic Dentistry (AACD).
David Wright attended State University and is a certified dental technician. He has spent over ten years working with some of the region’s most respected practitioners. David is committed to continuing education and has successfully completed Corporation X’s Advanced Crown & Bridge Dental Studies. He has also successfully completed training in all the premier implant systems including Brand J, Brand K, Product L, Product M, Brand N and Brand O.
David entered the dental laboratory industry in 1991. He began his training under the tutelage of his father with various phases of fixed and removable techniques. Over the years, David completed his training to become fully proficient in the design and fabrication of precision attachment restorations, implants and full mouth rehabilitation cases.
Start-up Summary
The start-up cost of Wright’s Dental Laboratory will consist primarily of equipment. Charles and David will each invest personal funds and also secure a long-term loan.
| Start-up | |
| Requirements | |
| Start-up Expenses | |
| Legal | $1,000 |
| Stationery etc. | $300 |
| Brochures | $1,000 |
| Insurance | $2,000 |
| Rent | $2,000 |
| Lab Setup | $30,000 |
| Office Setup | $20,000 |
| Expensed Equipment | $20,000 |
| Total Start-up Expenses | $76,300 |
| Start-up Assets | |
| Cash Required | $71,700 |
| Start-up Inventory | $10,000 |
| Other Current Assets | $12,000 |
| Long-term Assets | $80,000 |
| Total Assets | $173,700 |
| Total Requirements | $250,000 |
Company Ownership
Wright’s Dental Laboratory, located in a custom designed, 8,000 square foot facility using the latest, state-of-the-art restoration production systems and computerized case tracking, is owned by Charles and David Wright. The company will operate as a general partnership with both Charles and David performing management functions.

Products
Wright’s Dental Laboratory offers the following products:
| CROWN AND BRIDGE | ||
| Ceramics | Brand A | Brand B |
| Porcelain to metal | Brand A inlay/onlay | Brand B inlay |
| Porcelain veneers | Brand A bond to metal | Brand B model 2 |
| Product C | ||
| Product D | ||
| Product E | ||
| Product F | ||
| Product F model 2 | ||
| REMOVABLES | ||
| Dentures & Partials | Splints/Stents | Orthodontics |
| Full dentures | Brand G | |
| Partial dentures | Hard splint (night guard) | |
| Night guards | Implant stent | |
| Relines | Sports guard | |
| Laser welded repairs | Surgical template | |
| Soft liners | Bleaching fluoride trays | |
| Brand H |
Market Analysis Summary
The LochJaw tri-county area has over 300 dentists. Next to salaries and benefits for associates, assistants and hygienists, dental laboratory fees are a dentist’s greatest expense.
Currently, there are seven dental labs in LochJaw. Of the seven, only four are full service. Most importantly, a new lab has not opened in the LochJaw area in the past six years. Over the past six years, the area’s population has grown tremendously. The current labs have not invested in the newest technology. Wright’s Dental Laboratory will set a new standard for products and services.
No where is this more important than in the dental care for children and seniors. The new materials and techniques creates more options for dentists to serve their young and senior patients. Wright’s Dental Laboratory is investing heavily in these new techniques and materials.
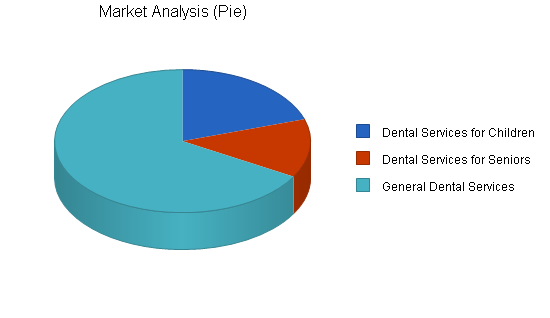
Market Segmentation
Wright’s Dental Laboratory will focus on dental professionals who work in the following three areas:
- Dental services for seniors;
- Dental services for children;
- General dental services.
| Market Analysis | |||||||
| Year 1 | Year 2 | Year 3 | Year 4 | Year 5 | |||
| Potential Customers | Growth | CAGR | |||||
| Dental Services for Children | 10% | 60 | 66 | 73 | 80 | 88 | 10.05% |
| Dental Services for Seniors | 15% | 40 | 46 | 53 | 61 | 70 | 15.02% |
| General Dental Services | 13% | 200 | 226 | 255 | 288 | 325 | 12.91% |
| Total | 12.64% | 300 | 338 | 381 | 429 | 483 | 12.64% |
Strategy and Implementation Summary
Wright’s Dental Laboratory will aggressively pursue dental professionals in the LochJaw area by offering discounted services to encourage them to try the new lab. Charles Wright will manage the marketing campaign to promote the business. He has extensive contacts in the dental community that will be critical to the building of the business.
Sales Strategy
The sales strategy will focus on offering dental professionals the new techniques and equipment that will assist them in serving their speciality populations (i.e., children and seniors).
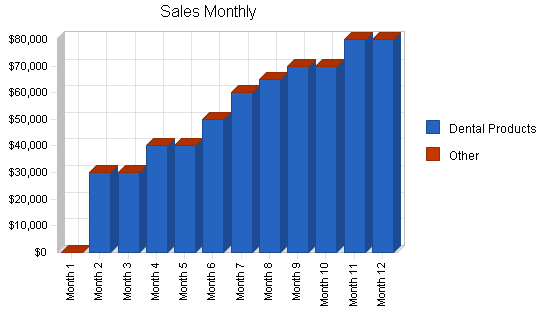
Sales Forecast
For the first month there will be no sales, as the company will be establishing its operations. We anticipate that sales will grow quickly during the second and third month of operation.
The following is the sales forecast for three years.

| Sales Forecast | |||
| Year 1 | Year 2 | Year 3 | |
| Sales | |||
| Dental Products | $615,000 | $750,000 | $880,000 |
| Other | $0 | $0 | $0 |
| Total Sales | $615,000 | $750,000 | $880,000 |
| Direct Cost of Sales | Year 1 | Year 2 | Year 3 |
| Dental Products | $221,000 | $269,250 | $315,920 |
| Other | $0 | $0 | $0 |
| Subtotal Direct Cost of Sales | $221,000 | $269,250 | $315,920 |
Management Summary
The management team for Wright’s Dental Laboratory will be Charles and David Wright. Charles will be responsible for marketing, sales, customer relations. David will be responsible for managing the dental lab operation.
Personnel Plan
The personnel plan for Wright’s Dental Laboratory is as follows:
- Marketing/sales manager
- Lab manager
- Lab techs (4)
- Customer service (1)
Part way through the second year of operation it is estimated that the Lab will have to hire an additional customer service operator.
| Personnel Plan | |||
| Year 1 | Year 2 | Year 3 | |
| Marketing/Sales Mgr | $48,000 | $50,000 | $52,000 |
| Lab Mgr | $48,000 | $50,000 | $52,000 |
| 4 Lab Techs | $144,000 | $152,000 | $160,000 |
| Customer Service | $24,000 | $38,000 | $60,000 |
| Total People | 7 | 7 | 7 |
| Total Payroll | $264,000 | $290,000 | $324,000 |
Financial Plan
The following is the financial plan for Wright’s Dental Laboratory.
Start-up Funding
Each of the two Wright’s, David and Charles, will invest in the venture. An additional long-term loan will be secured from the SBA, or local lenders, with an interest rate not more that 10%.
| Start-up Funding | |
| Start-up Expenses to Fund | $76,300 |
| Start-up Assets to Fund | $173,700 |
| Total Funding Required | $250,000 |
| Assets | |
| Non-cash Assets from Start-up | $102,000 |
| Cash Requirements from Start-up | $71,700 |
| Additional Cash Raised | $0 |
| Cash Balance on Starting Date | $71,700 |
| Total Assets | $173,700 |
| Liabilities and Capital | |
| Liabilities | |
| Current Borrowing | $0 |
| Long-term Liabilities | $100,000 |
| Accounts Payable (Outstanding Bills) | $0 |
| Other Current Liabilities (interest-free) | $0 |
| Total Liabilities | $100,000 |
| Capital | |
| Planned Investment | |
| Charles | $75,000 |
| David | $75,000 |
| Additional Investment Requirement | $0 |
| Total Planned Investment | $150,000 |
| Loss at Start-up (Start-up Expenses) | ($76,300) |
| Total Capital | $73,700 |
| Total Capital and Liabilities | $173,700 |
| Total Funding | $250,000 |
Break-even Analysis
The following table and chart display the monthly break-even point.

| Break-even Analysis | |
| Monthly Revenue Break-even | $49,013 |
| Assumptions: | |
| Average Percent Variable Cost | 36% |
| Estimated Monthly Fixed Cost | $31,400 |
Projected Profit and Loss
The following table and charts will highlight projected profit and loss for the next three years.


| Pro Forma Profit and Loss | |||
| Year 1 | Year 2 | Year 3 | |
| Sales | $615,000 | $750,000 | $880,000 |
| Direct Cost of Sales | $221,000 | $269,250 | $315,920 |
| Other Production Expenses | $0 | $0 | $0 |
| Total Cost of Sales | $221,000 | $269,250 | $315,920 |
| Gross Margin | $394,000 | $480,750 | $564,080 |
| Gross Margin % | 64.07% | 64.10% | 64.10% |
| Expenses | |||
| Payroll | $264,000 | $290,000 | $324,000 |
| Sales and Marketing and Other Expenses | $24,000 | $30,000 | $35,000 |
| Depreciation | $12,000 | $12,000 | $12,000 |
| Leased Equipment | $0 | $0 | $0 |
| Utilities | $6,000 | $6,000 | $6,000 |
| Insurance | $7,200 | $7,200 | $7,200 |
| Rent | $24,000 | $24,000 | $24,000 |
| Payroll Taxes | $39,600 | $43,500 | $48,600 |
| Other | $0 | $0 | $0 |
| Total Operating Expenses | $376,800 | $412,700 | $456,800 |
| Profit Before Interest and Taxes | $17,200 | $68,050 | $107,280 |
| EBITDA | $29,200 | $80,050 | $119,280 |
| Interest Expense | $12,463 | $12,520 | $11,777 |
| Taxes Incurred | $1,421 | $16,659 | $28,651 |
| Net Profit | $3,316 | $38,871 | $66,852 |
| Net Profit/Sales | 0.54% | 5.18% | 7.60% |
Projected Cash Flow
The following table and chart highlight the projected cash flow for three years. It will be necessary for each Wright brother to loan the company additional funds mid-year.

| Pro Forma Cash Flow | |||
| Year 1 | Year 2 | Year 3 | |
| Cash Received | |||
| Cash from Operations | |||
| Cash Sales | $153,750 | $187,500 | $220,000 |
| Cash from Receivables | $343,250 | $536,598 | $635,057 |
| Subtotal Cash from Operations | $497,000 | $724,098 | $855,057 |
| Additional Cash Received | |||
| Sales Tax, VAT, HST/GST Received | $0 | $0 | $0 |
| New Current Borrowing | $0 | $0 | $0 |
| New Other Liabilities (interest-free) | $0 | $0 | $0 |
| New Long-term Liabilities | $40,000 | $0 | $0 |
| Sales of Other Current Assets | $0 | $0 | $0 |
| Sales of Long-term Assets | $0 | $0 | $0 |
| New Investment Received | $0 | $0 | $0 |
| Subtotal Cash Received | $537,000 | $724,098 | $855,057 |
| Expenditures | Year 1 | Year 2 | Year 3 |
| Expenditures from Operations | |||
| Cash Spending | $264,000 | $290,000 | $324,000 |
| Bill Payments | $314,168 | $418,284 | $475,335 |
| Subtotal Spent on Operations | $578,168 | $708,284 | $799,335 |
| Additional Cash Spent | |||
| Sales Tax, VAT, HST/GST Paid Out | $0 | $0 | $0 |
| Principal Repayment of Current Borrowing | $0 | $0 | $0 |
| Other Liabilities Principal Repayment | $0 | $0 | $0 |
| Long-term Liabilities Principal Repayment | $9,864 | $9,864 | $5,000 |
| Purchase Other Current Assets | $0 | $0 | $0 |
| Purchase Long-term Assets | $0 | $0 | $0 |
| Dividends | $0 | $0 | $0 |
| Subtotal Cash Spent | $588,032 | $718,148 | $804,335 |
| Net Cash Flow | ($51,032) | $5,950 | $50,722 |
| Cash Balance | $20,668 | $26,618 | $77,340 |
Projected Balance Sheet
The following table highlights the projected balance sheet for three years.
| Pro Forma Balance Sheet | |||
| Year 1 | Year 2 | Year 3 | |
| Assets | |||
| Current Assets | |||
| Cash | $20,668 | $26,618 | $77,340 |
| Accounts Receivable | $118,000 | $143,902 | $168,846 |
| Inventory | $30,800 | $31,307 | $35,377 |
| Other Current Assets | $12,000 | $12,000 | $12,000 |
| Total Current Assets | $181,468 | $213,827 | $293,562 |
| Long-term Assets | |||
| Long-term Assets | $80,000 | $80,000 | $80,000 |
| Accumulated Depreciation | $12,000 | $24,000 | $36,000 |
| Total Long-term Assets | $68,000 | $56,000 | $44,000 |
| Total Assets | $249,468 | $269,827 | $337,562 |
| Liabilities and Capital | Year 1 | Year 2 | Year 3 |
| Current Liabilities | |||
| Accounts Payable | $42,317 | $33,669 | $39,552 |
| Current Borrowing | $0 | $0 | $0 |
| Other Current Liabilities | $0 | $0 | $0 |
| Subtotal Current Liabilities | $42,317 | $33,669 | $39,552 |
| Long-term Liabilities | $130,136 | $120,272 | $115,272 |
| Total Liabilities | $172,453 | $153,941 | $154,824 |
| Paid-in Capital | $150,000 | $150,000 | $150,000 |
| Retained Earnings | ($76,300) | ($72,984) | ($34,114) |
| Earnings | $3,316 | $38,871 | $66,852 |
| Total Capital | $77,016 | $115,886 | $182,738 |
| Total Liabilities and Capital | $249,468 | $269,827 | $337,562 |
| Net Worth | $77,016 | $115,886 | $182,738 |
Business Ratios
Business ratios for the years of this plan are shown below. Industry profile ratios based on the Standard Industrial Classification (SIC) code 8072, Dental Laboratories, are shown for comparison.
| Ratio Analysis | ||||
| Year 1 | Year 2 | Year 3 | Industry Profile | |
| Sales Growth | n.a. | 21.95% | 17.33% | 6.60% |
| Percent of Total Assets | ||||
| Accounts Receivable | 47.30% | 53.33% | 50.02% | 15.10% |
| Inventory | 12.35% | 11.60% | 10.48% | 4.50% |
| Other Current Assets | 4.81% | 4.45% | 3.55% | 56.00% |
| Total Current Assets | 72.74% | 79.25% | 86.97% | 75.60% |
| Long-term Assets | 27.26% | 20.75% | 13.03% | 24.40% |
| Total Assets | 100.00% | 100.00% | 100.00% | 100.00% |
| Current Liabilities | 16.96% | 12.48% | 11.72% | 34.20% |
| Long-term Liabilities | 52.17% | 44.57% | 34.15% | 18.20% |
| Total Liabilities | 69.13% | 57.05% | 45.87% | 52.40% |
| Net Worth | 30.87% | 42.95% | 54.13% | 47.60% |
| Percent of Sales | ||||
| Sales | 100.00% | 100.00% | 100.00% | 100.00% |
| Gross Margin | 64.07% | 64.10% | 64.10% | 0.00% |
| Selling, General & Administrative Expenses | 63.37% | 58.73% | 56.34% | 70.40% |
| Advertising Expenses | 3.90% | 4.00% | 3.98% | 0.20% |
| Profit Before Interest and Taxes | 2.80% | 9.07% | 12.19% | 10.10% |
| Main Ratios | ||||
| Current | 4.29 | 6.35 | 7.42 | 1.81 |
| Quick | 3.56 | 5.42 | 6.53 | 1.25 |
| Total Debt to Total Assets | 69.13% | 57.05% | 45.87% | 52.40% |
| Pre-tax Return on Net Worth | 6.15% | 47.92% | 52.26% | 18.10% |
| Pre-tax Return on Assets | 1.90% | 20.58% | 28.29% | 38.00% |
| Additional Ratios | Year 1 | Year 2 | Year 3 | |
| Net Profit Margin | 0.54% | 5.18% | 7.60% | n.a |
| Return on Equity | 4.31% | 33.54% | 36.58% | n.a |
| Activity Ratios | ||||
| Accounts Receivable Turnover | 3.91 | 3.91 | 3.91 | n.a |
| Collection Days | 56 | 85 | 86 | n.a |
| Inventory Turnover | 10.48 | 8.67 | 9.48 | n.a |
| Accounts Payable Turnover | 8.42 | 12.17 | 12.17 | n.a |
| Payment Days | 28 | 34 | 28 | n.a |
| Total Asset Turnover | 2.47 | 2.78 | 2.61 | n.a |
| Debt Ratios | ||||
| Debt to Net Worth | 2.24 | 1.33 | 0.85 | n.a |
| Current Liab. to Liab. | 0.25 | 0.22 | 0.26 | n.a |
| Liquidity Ratios | ||||
| Net Working Capital | $139,152 | $180,158 | $254,010 | n.a |
| Interest Coverage | 1.38 | 5.44 | 9.11 | n.a |
| Additional Ratios | ||||
| Assets to Sales | 0.41 | 0.36 | 0.38 | n.a |
| Current Debt/Total Assets | 17% | 12% | 12% | n.a |
| Acid Test | 0.77 | 1.15 | 2.26 | n.a |
| Sales/Net Worth | 7.99 | 6.47 | 4.82 | n.a |
| Dividend Payout | 0.00 | 0.00 | 0.00 | n.a |
Appendix
| Sales Forecast | |||||||||||||
| Month 1 | Month 2 | Month 3 | Month 4 | Month 5 | Month 6 | Month 7 | Month 8 | Month 9 | Month 10 | Month 11 | Month 12 | ||
| Sales | |||||||||||||
| Dental Products | 0% | $0 | $30,000 | $30,000 | $40,000 | $40,000 | $50,000 | $60,000 | $65,000 | $70,000 | $70,000 | $80,000 | $80,000 |
| Other | 0% | $0 | $0 | $0 | $0 | $0 | $0 | $0 | $0 | $0 | $0 | $0 | $0 |
| Total Sales | $0 | $30,000 | $30,000 | $40,000 | $40,000 | $50,000 | $60,000 | $65,000 | $70,000 | $70,000 | $80,000 | $80,000 | |
| Direct Cost of Sales | Month 1 | Month 2 | Month 3 | Month 4 | Month 5 | Month 6 | Month 7 | Month 8 | Month 9 | Month 10 | Month 11 | Month 12 | |
| Dental Products | $0 | $12,000 | $12,000 | $15,000 | $15,000 | $18,000 | $21,000 | $22,000 | $25,000 | $25,000 | $28,000 | $28,000 | |
| Other | $0 | $0 | $0 | $0 | $0 | $0 | $0 | $0 | $0 | $0 | $0 | $0 | |
| Subtotal Direct Cost of Sales | $0 | $12,000 | $12,000 | $15,000 | $15,000 | $18,000 | $21,000 | $22,000 | $25,000 | $25,000 | $28,000 | $28,000 | |
| Personnel Plan | |||||||||||||
| Month 1 | Month 2 | Month 3 | Month 4 | Month 5 | Month 6 | Month 7 | Month 8 | Month 9 | Month 10 | Month 11 | Month 12 | ||
| Marketing/Sales Mgr | 0% | $4,000 | $4,000 | $4,000 | $4,000 | $4,000 | $4,000 | $4,000 | $4,000 | $4,000 | $4,000 | $4,000 | $4,000 |
| Lab Mgr | 0% | $4,000 | $4,000 | $4,000 | $4,000 | $4,000 | $4,000 | $4,000 | $4,000 | $4,000 | $4,000 | $4,000 | $4,000 |
| 4 Lab Techs | 0% | $12,000 | $12,000 | $12,000 | $12,000 | $12,000 | $12,000 | $12,000 | $12,000 | $12,000 | $12,000 | $12,000 | $12,000 |
| Customer Service | 0% | $2,000 | $2,000 | $2,000 | $2,000 | $2,000 | $2,000 | $2,000 | $2,000 | $2,000 | $2,000 | $2,000 | $2,000 |
| Total People | 7 | 7 | 7 | 7 | 7 | 7 | 7 | 7 | 7 | 7 | 7 | 7 | |
| Total Payroll | $22,000 | $22,000 | $22,000 | $22,000 | $22,000 | $22,000 | $22,000 | $22,000 | $22,000 | $22,000 | $22,000 | $22,000 | |
| General Assumptions | |||||||||||||
| Month 1 | Month 2 | Month 3 | Month 4 | Month 5 | Month 6 | Month 7 | Month 8 | Month 9 | Month 10 | Month 11 | Month 12 | ||
| Plan Month | 1 | 2 | 3 | 4 | 5 | 6 | 7 | 8 | 9 | 10 | 11 | 12 | |
| Current Interest Rate | 10.00% | 10.00% | 10.00% | 10.00% | 10.00% | 10.00% | 10.00% | 10.00% | 10.00% | 10.00% | 10.00% | 10.00% | |
| Long-term Interest Rate | 10.00% | 10.00% | 10.00% | 10.00% | 10.00% | 10.00% | 10.00% | 10.00% | 10.00% | 10.00% | 10.00% | 10.00% | |
| Tax Rate | 30.00% | 30.00% | 30.00% | 30.00% | 30.00% | 30.00% | 30.00% | 30.00% | 30.00% | 30.00% | 30.00% | 30.00% | |
| Other | 0 | 0 | 0 | 0 | 0 | 0 | 0 | 0 | 0 | 0 | 0 | 0 | |
| Pro Forma Profit and Loss | |||||||||||||
| Month 1 | Month 2 | Month 3 | Month 4 | Month 5 | Month 6 | Month 7 | Month 8 | Month 9 | Month 10 | Month 11 | Month 12 | ||
| Sales | $0 | $30,000 | $30,000 | $40,000 | $40,000 | $50,000 | $60,000 | $65,000 | $70,000 | $70,000 | $80,000 | $80,000 | |
| Direct Cost of Sales | $0 | $12,000 | $12,000 | $15,000 | $15,000 | $18,000 | $21,000 | $22,000 | $25,000 | $25,000 | $28,000 | $28,000 | |
| Other Production Expenses | $0 | $0 | $0 | $0 | $0 | $0 | $0 | $0 | $0 | $0 | $0 | $0 | |
| Total Cost of Sales | $0 | $12,000 | $12,000 | $15,000 | $15,000 | $18,000 | $21,000 | $22,000 | $25,000 | $25,000 | $28,000 | $28,000 | |
| Gross Margin | $0 | $18,000 | $18,000 | $25,000 | $25,000 | $32,000 | $39,000 | $43,000 | $45,000 | $45,000 | $52,000 | $52,000 | |
| Gross Margin % | 0.00% | 60.00% | 60.00% | 62.50% | 62.50% | 64.00% | 65.00% | 66.15% | 64.29% | 64.29% | 65.00% | 65.00% | |
| Expenses | |||||||||||||
| Payroll | $22,000 | $22,000 | $22,000 | $22,000 | $22,000 | $22,000 | $22,000 | $22,000 | $22,000 | $22,000 | $22,000 | $22,000 | |
| Sales and Marketing and Other Expenses | $2,000 | $2,000 | $2,000 | $2,000 | $2,000 | $2,000 | $2,000 | $2,000 | $2,000 | $2,000 | $2,000 | $2,000 | |
| Depreciation | $1,000 | $1,000 | $1,000 | $1,000 | $1,000 | $1,000 | $1,000 | $1,000 | $1,000 | $1,000 | $1,000 | $1,000 | |
| Leased Equipment | $0 | $0 | $0 | $0 | $0 | $0 | $0 | $0 | $0 | $0 | $0 | $0 | |
| Utilities | $500 | $500 | $500 | $500 | $500 | $500 | $500 | $500 | $500 | $500 | $500 | $500 | |
| Insurance | $600 | $600 | $600 | $600 | $600 | $600 | $600 | $600 | $600 | $600 | $600 | $600 | |
| Rent | $2,000 | $2,000 | $2,000 | $2,000 | $2,000 | $2,000 | $2,000 | $2,000 | $2,000 | $2,000 | $2,000 | $2,000 | |
| Payroll Taxes | 15% | $3,300 | $3,300 | $3,300 | $3,300 | $3,300 | $3,300 | $3,300 | $3,300 | $3,300 | $3,300 | $3,300 | $3,300 |
| Other | $0 | $0 | $0 | $0 | $0 | $0 | $0 | $0 | $0 | $0 | $0 | $0 | |
| Total Operating Expenses | $31,400 | $31,400 | $31,400 | $31,400 | $31,400 | $31,400 | $31,400 | $31,400 | $31,400 | $31,400 | $31,400 | $31,400 | |
| Profit Before Interest and Taxes | ($31,400) | ($13,400) | ($13,400) | ($6,400) | ($6,400) | $600 | $7,600 | $11,600 | $13,600 | $13,600 | $20,600 | $20,600 | |
| EBITDA | ($30,400) | ($12,400) | ($12,400) | ($5,400) | ($5,400) | $1,600 | $8,600 | $12,600 | $14,600 | $14,600 | $21,600 | $21,600 | |
| Interest Expense | $833 | $833 | $833 | $1,000 | $1,156 | $1,146 | $1,136 | $1,126 | $1,115 | $1,105 | $1,095 | $1,084 | |
| Taxes Incurred | ($9,670) | ($4,270) | ($4,270) | ($2,220) | ($2,267) | ($164) | $1,939 | $3,142 | $3,745 | $3,748 | $5,852 | $5,855 | |
| Net Profit | ($22,563) | ($9,963) | ($9,963) | ($5,180) | ($5,289) | ($382) | $4,525 | $7,332 | $8,739 | $8,746 | $13,654 | $13,661 | |
| Net Profit/Sales | 0.00% | -33.21% | -33.21% | -12.95% | -13.22% | -0.76% | 7.54% | 11.28% | 12.48% | 12.49% | 17.07% | 17.08% | |
| Pro Forma Cash Flow | |||||||||||||
| Month 1 | Month 2 | Month 3 | Month 4 | Month 5 | Month 6 | Month 7 | Month 8 | Month 9 | Month 10 | Month 11 | Month 12 | ||
| Cash Received | |||||||||||||
| Cash from Operations | |||||||||||||
| Cash Sales | $0 | $7,500 | $7,500 | $10,000 | $10,000 | $12,500 | $15,000 | $16,250 | $17,500 | $17,500 | $20,000 | $20,000 | |
| Cash from Receivables | $0 | $0 | $750 | $22,500 | $22,750 | $30,000 | $30,250 | $37,750 | $45,125 | $48,875 | $52,500 | $52,750 | |
| Subtotal Cash from Operations | $0 | $7,500 | $8,250 | $32,500 | $32,750 | $42,500 | $45,250 | $54,000 | $62,625 | $66,375 | $72,500 | $72,750 | |
| Additional Cash Received | |||||||||||||
| Sales Tax, VAT, HST/GST Received | 0.00% | $0 | $0 | $0 | $0 | $0 | $0 | $0 | $0 | $0 | $0 | $0 | $0 |
| New Current Borrowing | $0 | $0 | $0 | $0 | $0 | $0 | $0 | $0 | $0 | $0 | $0 | $0 | |
| New Other Liabilities (interest-free) | $0 | $0 | $0 | $0 | $0 | $0 | $0 | $0 | $0 | $0 | $0 | $0 | |
| New Long-term Liabilities | $0 | $0 | $0 | $20,000 | $20,000 | $0 | $0 | $0 | $0 | $0 | $0 | $0 | |
| Sales of Other Current Assets | $0 | $0 | $0 | $0 | $0 | $0 | $0 | $0 | $0 | $0 | $0 | $0 | |
| Sales of Long-term Assets | $0 | $0 | $0 | $0 | $0 | $0 | $0 | $0 | $0 | $0 | $0 | $0 | |
| New Investment Received | $0 | $0 | $0 | $0 | $0 | $0 | $0 | $0 | $0 | $0 | $0 | $0 | |
| Subtotal Cash Received | $0 | $7,500 | $8,250 | $52,500 | $52,750 | $42,500 | $45,250 | $54,000 | $62,625 | $66,375 | $72,500 | $72,750 | |
| Expenditures | Month 1 | Month 2 | Month 3 | Month 4 | Month 5 | Month 6 | Month 7 | Month 8 | Month 9 | Month 10 | Month 11 | Month 12 | |
| Expenditures from Operations | |||||||||||||
| Cash Spending | $22,000 | $22,000 | $22,000 | $22,000 | $22,000 | $22,000 | $22,000 | $22,000 | $22,000 | $22,000 | $22,000 | $22,000 | |
| Bill Payments | ($437) | $250 | $20,057 | $17,247 | $25,374 | $22,569 | $30,852 | $35,775 | $35,961 | $41,450 | $38,533 | $46,536 | |
| Subtotal Spent on Operations | $21,563 | $22,250 | $42,057 | $39,247 | $47,374 | $44,569 | $52,852 | $57,775 | $57,961 | $63,450 | $60,533 | $68,536 | |
| Additional Cash Spent | |||||||||||||
| Sales Tax, VAT, HST/GST Paid Out | $0 | $0 | $0 | $0 | $0 | $0 | $0 | $0 | $0 | $0 | $0 | $0 | |
| Principal Repayment of Current Borrowing | $0 | $0 | $0 | $0 | $0 | $0 | $0 | $0 | $0 | $0 | $0 | $0 | |
| Other Liabilities Principal Repayment | $0 | $0 | $0 | $0 | $0 | $0 | $0 | $0 | $0 | $0 | $0 | $0 | |
| Long-term Liabilities Principal Repayment | $0 | $0 | $0 | $0 | $1,233 | $1,233 | $1,233 | $1,233 | $1,233 | $1,233 | $1,233 | $1,233 | |
| Purchase Other Current Assets | $0 | $0 | $0 | $0 | $0 | $0 | $0 | $0 | $0 | $0 | $0 | $0 | |
| Purchase Long-term Assets | $0 | $0 | $0 | $0 | $0 | $0 | $0 | $0 | $0 | $0 | $0 | $0 | |
| Dividends | $0 | $0 | $0 | $0 | $0 | $0 | $0 | $0 | $0 | $0 | $0 | $0 | |
| Subtotal Cash Spent | $21,563 | $22,250 | $42,057 | $39,247 | $48,607 | $45,802 | $54,085 | $59,008 | $59,194 | $64,683 | $61,766 | $69,769 | |
| Net Cash Flow | ($21,563) | ($14,750) | ($33,807) | $13,253 | $4,143 | ($3,302) | ($8,835) | ($5,008) | $3,431 | $1,692 | $10,734 | $2,981 | |
| Cash Balance | $50,137 | $35,387 | $1,580 | $14,833 | $18,976 | $15,674 | $6,839 | $1,831 | $5,262 | $6,954 | $17,687 | $20,668 | |
| Pro Forma Balance Sheet | |||||||||||||
| Month 1 | Month 2 | Month 3 | Month 4 | Month 5 | Month 6 | Month 7 | Month 8 | Month 9 | Month 10 | Month 11 | Month 12 | ||
| Assets | Starting Balances | ||||||||||||
| Current Assets | |||||||||||||
| Cash | $71,700 | $50,137 | $35,387 | $1,580 | $14,833 | $18,976 | $15,674 | $6,839 | $1,831 | $5,262 | $6,954 | $17,687 | $20,668 |
| Accounts Receivable | $0 | $0 | $22,500 | $44,250 | $51,750 | $59,000 | $66,500 | $81,250 | $92,250 | $99,625 | $103,250 | $110,750 | $118,000 |
| Inventory | $10,000 | $10,000 | $13,200 | $13,200 | $16,500 | $16,500 | $19,800 | $23,100 | $24,200 | $27,500 | $27,500 | $30,800 | $30,800 |
| Other Current Assets | $12,000 | $12,000 | $12,000 | $12,000 | $12,000 | $12,000 | $12,000 | $12,000 | $12,000 | $12,000 | $12,000 | $12,000 | $12,000 |
| Total Current Assets | $93,700 | $72,137 | $83,087 | $71,030 | $95,083 | $106,476 | $113,974 | $123,189 | $130,281 | $144,387 | $149,704 | $171,237 | $181,468 |
| Long-term Assets | |||||||||||||
| Long-term Assets | $80,000 | $80,000 | $80,000 | $80,000 | $80,000 | $80,000 | $80,000 | $80,000 | $80,000 | $80,000 | $80,000 | $80,000 | $80,000 |
| Accumulated Depreciation | $0 | $1,000 | $2,000 | $3,000 | $4,000 | $5,000 | $6,000 | $7,000 | $8,000 | $9,000 | $10,000 | $11,000 | $12,000 |
| Total Long-term Assets | $80,000 | $79,000 | $78,000 | $77,000 | $76,000 | $75,000 | $74,000 | $73,000 | $72,000 | $71,000 | $70,000 | $69,000 | $68,000 |
| Total Assets | $173,700 | $151,137 | $161,087 | $148,030 | $171,083 | $181,476 | $187,974 | $196,189 | $202,281 | $215,387 | $219,704 | $240,237 | $249,468 |
| Liabilities and Capital | Month 1 | Month 2 | Month 3 | Month 4 | Month 5 | Month 6 | Month 7 | Month 8 | Month 9 | Month 10 | Month 11 | Month 12 | |
| Current Liabilities | |||||||||||||
| Accounts Payable | $0 | $0 | $19,913 | $16,820 | $25,053 | $21,969 | $30,082 | $35,005 | $34,998 | $40,597 | $37,401 | $45,514 | $42,317 |
| Current Borrowing | $0 | $0 | $0 | $0 | $0 | $0 | $0 | $0 | $0 | $0 | $0 | $0 | $0 |
| Other Current Liabilities | $0 | $0 | $0 | $0 | $0 | $0 | $0 | $0 | $0 | $0 | $0 | $0 | $0 |
| Subtotal Current Liabilities | $0 | $0 | $19,913 | $16,820 | $25,053 | $21,969 | $30,082 | $35,005 | $34,998 | $40,597 | $37,401 | $45,514 | $42,317 |
| Long-term Liabilities | $100,000 | $100,000 | $100,000 | $100,000 | $120,000 | $138,767 | $137,534 | $136,301 | $135,068 | $133,835 | $132,602 | $131,369 | $130,136 |
| Total Liabilities | $100,000 | $100,000 | $119,913 | $116,820 | $145,053 | $160,736 | $167,616 | $171,306 | $170,066 | $174,432 | $170,003 | $176,883 | $172,453 |
| Paid-in Capital | $150,000 | $150,000 | $150,000 | $150,000 | $150,000 | $150,000 | $150,000 | $150,000 | $150,000 | $150,000 | $150,000 | $150,000 | $150,000 |
| Retained Earnings | ($76,300) | ($76,300) | ($76,300) | ($76,300) | ($76,300) | ($76,300) | ($76,300) | ($76,300) | ($76,300) | ($76,300) | ($76,300) | ($76,300) | ($76,300) |
| Earnings | $0 | ($22,563) | ($32,527) | ($42,490) | ($47,670) | ($52,959) | ($53,342) | ($48,817) | ($41,485) | ($32,745) | ($23,999) | ($10,345) | $3,316 |
| Total Capital | $73,700 | $51,137 | $41,173 | $31,210 | $26,030 | $20,741 | $20,358 | $24,883 | $32,215 | $40,955 | $49,701 | $63,355 | $77,016 |
| Total Liabilities and Capital | $173,700 | $151,137 | $161,087 | $148,030 | $171,083 | $181,476 | $187,974 | $196,189 | $202,281 | $215,387 | $219,704 | $240,237 | $249,468 |
| Net Worth | $73,700 | $51,137 | $41,173 | $31,210 | $26,030 | $20,741 | $20,358 | $24,883 | $32,215 | $40,955 | $49,701 | $63,355 | $77,016 |


