
CompuDate
Executive Summary
CompuDate is a new company that offers Denver area singles computer-based matchmaking services. CompuDate has purchased the assets of Date MatchMaker and is a sole proprietorship owned by Suzie Butterfly.
The Market
CompuDate will target two distinct market segments, 20-35 year olds, and 36-60 year olds. CompuDate’s services must appear hip and cool in order to be popular with the younger age group which has a 9% annual growth rate and 54,000 potential customers. CompuDate’s services must appear to be effective to appeal to the older age group which has a 11% growth rate and 64,000 possible customers. Having two distinct large groups that CompuDate can market its services to indicates an exciting market opportunity.
Keys to Success
CompuDate has identified three keys to success which will be closely monitored. The first is to know the market. CompuDate is compiling extensive market research to provide it with accurate information regarding its target market. The second is to pick right matches. If CompuDate does not pick the right people, the business will not progress. The last is to ensure sustainable profits. CompuDate will be run with a long-term vision.
Management
CompuDate will be lead by a seasoned manager, Suzie Butterfly. Suzie’s first job was with Yahoo! working as a project manager for their search engine department. This position provided Suzie with invaluable skills for managing a variety of different projects. After three years Suzie moved over to the Yahoo! Personals division where she got direct experience for the matchmaking industry which gave Suzie the insight and confidence in developing her own company to compete within this industry.
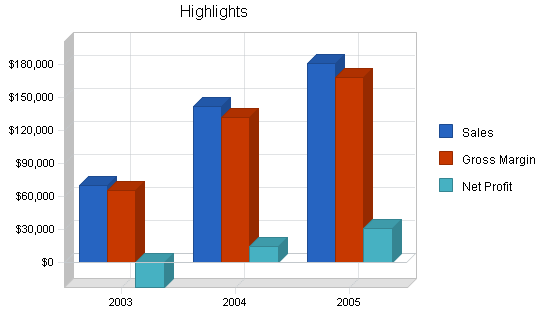
CompuDate has conservatively forecasted sales for year two, rising in year three. CompuDate will obtain pleasant profit margins for years two and three respectively. CompuDate is an exciting opportunity for a local company to leverage professional computer matchmaking software with seasoned industry management into a sustainable company.
1.1 Keys to Success
- Know our market.
- Pick the right dates (matches).
- Ensure sustainable profits.
1.2 Objectives
- Become Denver’s premier dating service.
- Achieve a 45% success rate in placing clients in long-term relationships.
- Realize the efficiencies and accuracies gained with computer-assisted matchmaking services.
1.3 Mission
It is CompuDate’s mission to provide the finest matchmaking services. This will be achieved through reasonable pricing, outstanding customer service, and the most predictive matchmaking services available.
Company Summary
CompuDate is a new company that has purchased the assets of an existing company called Date MatchMaker. Date MatchMaker is a traditional matchmaking service that existed for seven years but never made much money for a variety of reasons. CompuDate will use Date MatchMaker’s existing client files to quickly build an active client base.
The old company was sold because the former owner had a diminished desire to continue with the business. Receiving income from the business became less and less important, in part due to revenue from other sources. Additionally, the business was just not fun anymore. The previous owner (name omitted) therefore decided to sell the business and move on to other activities that he derived enjoyment out of. The business was purchased for $25,000. The purchase price was not directly related to the value of the business. Because the former owner did not have financial constraints, they were interested in getting some cash out of the business, in this case fairly quickly, but did not need to arrive at the exact value that the business was worth. This type of transaction is atypical, generally the business is valued at a multitude of factors including future revenue.
2.1 Company Ownership
CompuDate is a Colorado based “C” corporation owned by Suzie Butterfly.
2.2 Company History
CompuDate is the name of a new computer-based matchmaker service that has purchased the assets of Date MatchMaker. Date MatchMaker was an existing matchmaking service that existed for many years but was never really profitable. CompuDate decided that for a small amount of money it could purchase the assets of the former company and make a go of it. By far the most valuable asset was the customer list. The former company was unsuccessful because it was not good at matchmaking, consequently, it has an existing client base that is still in need of matchmaker services. This makes its customer list valuable for CompuDate.
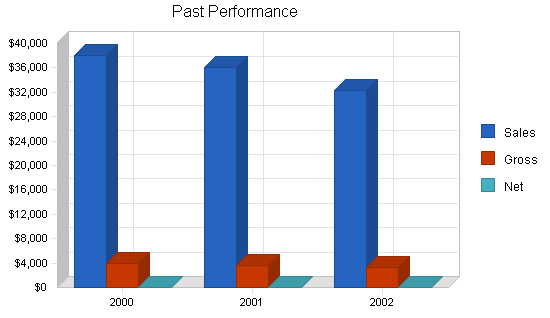
| Past Performance | |||
| 2000 | 2001 | 2002 | |
| Sales | $37,990 | $35,998 | $32,332 |
| Gross Margin | $4,001 | $3,566 | $3,321 |
| Gross Margin % | 10.53% | 9.91% | 10.27% |
| Operating Expenses | $0 | $0 | $0 |
| Balance Sheet | |||
| 2000 | 2001 | 2002 | |
| Current Assets | |||
| Cash | $19,008 | $16,554 | $14,554 |
| Other Current Assets | $2,000 | $2,000 | $2,000 |
| Total Current Assets | $21,008 | $18,554 | $16,554 |
| Long-term Assets | |||
| Long-term Assets | $0 | $0 | $0 |
| Accumulated Depreciation | $0 | $0 | $0 |
| Total Long-term Assets | $0 | $0 | $0 |
| Total Assets | $21,008 | $18,554 | $16,554 |
| Current Liabilities | |||
| Accounts Payable | $10,000 | $8,000 | $6,000 |
| Current Borrowing | $0 | $0 | $0 |
| Other Current Liabilities (interest free) | $0 | $0 | $0 |
| Total Current Liabilities | $10,000 | $8,000 | $6,000 |
| Long-term Liabilities | $0 | $0 | $0 |
| Total Liabilities | $10,000 | $8,000 | $6,000 |
| Paid-in Capital | $0 | $0 | $0 |
| Retained Earnings | $11,008 | $10,554 | $10,554 |
| Earnings | $0 | $0 | $0 |
| Total Capital | $11,008 | $10,554 | $10,554 |
| Total Capital and Liabilities | $21,008 | $18,554 | $16,554 |
| Other Inputs | |||
| Payment Days | 0 | 0 | 0 |
Services
CompuDate offers computer based matchmaking services. Customers fill out a comprehensive questionnaire/survey and the computer, by making logical connections with people’s characteristics and likes and dislikes, makes an estimate as to who might be a good match for this person. The value of the computer is that once a relevant survey has been developed the computer can quickly and accurately make comparisons between applicants and is accurate in its predictive ability, at least from the level of the information provided by the applicants, choose a good date for the person. The following information is some of the information captured by the survey (please note that this is not an exhaustive list):
- Activities enjoyed
- Interests
- Sports
- Hobbies
- Age
- Education
- Religious preferences
- Occupation
Market Analysis Summary
CompuDate has identified two distinct market segments. These segments are identified by age, 20-35 year olds and 36-60 year olds. Recognizing that each group has different goals in a matchmaking service and respond differently to marketing messages, CompuDate will target each group distinctly. In terms of potential customers, the elder group contains more potential customers.
CompuDate is competing against three styles of competitors. The first style of online personal classified such as Yahoo! Personals. The second group is similar to the first however it is not Internet-based, it relies on newspaper ads as the medium form. The last type of competitor is the traditional matchmaker services like the Date MatchMaker that relies on an agency to capture information regarding the applicants and then makes the matches on their own.
4.1 Market Segmentation
CompuDate has segmented their market into two distinct segments. These segments are identified by their age. Demographic and assorted details include:
20-35 year olds:
- Incomes of $35,000- $85,000.
- 53% have at least some college education.
- 23% have a graduate degree.
- Enjoy spending time with friends.
- Have friends but have difficulty in meeting interesting single people.
- Would prefer not to meet people in bar environments, the typical place people of this age group meet others.
36-60 year olds:
- Incomes of $55,000- $100,000.
- 65% of the people have a college degree.
- 41% have been married once.
- As they grow older they have had increased difficulty finding others their age.
- Have a tried a multitude of methods for meeting people, generally unsuccessful.
- Take the position that it cannot hurt to try new methods of meeting people.

| Market Analysis | |||||||
| 2003 | 2004 | 2005 | 2006 | 2007 | |||
| Potential Customers | Growth | CAGR | |||||
| 20-35 year olds | 9% | 54,996 | 59,946 | 65,341 | 71,222 | 77,632 | 9.00% |
| 36-60 year olds | 11% | 64,009 | 71,050 | 78,866 | 87,541 | 97,171 | 11.00% |
| Total | 10.09% | 119,005 | 130,996 | 144,207 | 158,763 | 174,803 | 10.09% |
4.2 Target Market Segment Strategy
Recognizing that the two groups are quite distinct, CompuDate will adopt a different strategy for reaching each. The philosophy realizes that the younger age group is somewhat nervous in using a dating service. For a multitude of reasons, there is the common thought that people of this age group should have no problem meeting people. CompuDate must appear to be the “hip” new thing, it needs to give off the appearance as being a cool thing to try, not some last resort for singles. Conversely, for the older crowd, it really matters less that this appears to be a hip option, this option must give off the impression that it is effective in finding someone’s match. Additionally, each group has different goals that they hope to get out of this service. The younger crowd is looking more for someone to spend time with, a short-term commitment type relationship. The older crowd, facing the realities of companionship are looking for a more long-term relationship.

4.3 Service Business Analysis
The matchmaking industry had been fairly stagnant for a number of years, but within the last three years, with the proliferation of online dating services such as Yahoo! Personals, the entire industry has gotten a new breath of life. More and more people are considering dating services as a viable and exciting option. It is not totally clear as to why the online services would have such a positive impact on the entire industry as opposed to just their segment. Industry experts believe that the online services served as a way of legitimizing the industry as a whole as an effective way of meeting quality people.
4.3.1 Competition and Buying Patterns
- Online services: The competitors in this segment are kiss.com and Yahoo! Personals. These services took the business model of the paper-based system and moved it online to reach a broader audience and generate economies of scale.
- Newspaper-based personals: These competitors have a personal classified system where people write a little ad about themselves and/or who they are looking for and people respond accordingly.
- Traditional matchmaker services: This would be CompuDate’s closest competitor, however they do not use a computer for the predictive choices. Questionnaires are filled out and the workers of the company then determine what matches to make.
Strategy and Implementation Summary
CompuDate’s strategy will be the emphasis on its matchmaking system that is more predictive than other systems by analyzing a host of different variables to come up with the most likely candidate. Other systems rely too much on shallow variables such as appearance. While appearance is important, when it is the primary variable, the matchmaking is often temporary. In order to develop a stronger long-term relationship, the other variables must be taken into account. Focus groups indicate that although most people primarily gravitate toward aesthetic considerations, they do so recognizing that this is less than ideal. For whatever reason, when the variables are not longer chosen by the individual themselves but by a service, there is a sense of trust or comfort because it is based on a host of things beyond appearance. Oddly, if people could recognize this and act on their own volition, they would be more predictive themselves in choosing the right people. But as we all know, someone might know what is right but not be able to act appropriately.
5.1 Competitive Edge
CompuDate’s competitive edge is its sophisticated computer analysis program that is quite accurate, in choosing matches for people once the requisite information is entered. Having the right information to make the analysis is imperative in coming up with the right choice. Without the right information to analyze, there is no way to expect the computer to make the right match. This competitive edge is a sustainable competitive advantage because of the proprietary programming that was involved to allow the system to make the appropriate analysis. It is believed that this proprietary technology will give CompuDate better results than its competitors.
5.2 Marketing Strategy
As mentioned before, it is imperative that CompuDate market itself distinctively to the two different market segments. For the younger segment the service must be viewed as the hip choice. CompuDate will use advertisements to increase awareness of CompuDate’s offered services. These ads will give off the impression that cool people use CompuDate, that it is not a last resort for singles, but a fun, helpful service to link up with like-minded people. The magazines that will be used for the advertisements will be hip, cool magazines, the trendy rags.
To appeal to the older crowd, CompuDate must come off as a logically rationed, effective system for choosing mates. CompuDate will emphasize the accuracy of their computer system. It will highlight the detailed information that is collected from the applicants, needed to make an informed choice. It will also be vocal about its success rate which is benchmarked at 45% for long-term relationships, well above the industry average.
5.3 Sales Strategy
CompuDate’s sales strategy will be based on capturing a large number of first time users of this service. This is the goal because CompuDate is confident that it will be much easier (and less expensive) to grow the user base from existing clients than to build it from people that have no connection to CompuDate. This belief is held for two reasons, customers that try CompuDate will be impressed by the effectiveness, regardless if their first experience is a long-term relationship or not, they will see how the computer chooses the matches and that there is an underlying commonality between the choices. Additionally, if CompuDate is as effective as they believe it will be, the current customers will be quite vocal in telling their friends about CompuDate and that will be a strong source of referrals. Incentives for first time customers will at times be given out, applying this previously mentioned philosophy.
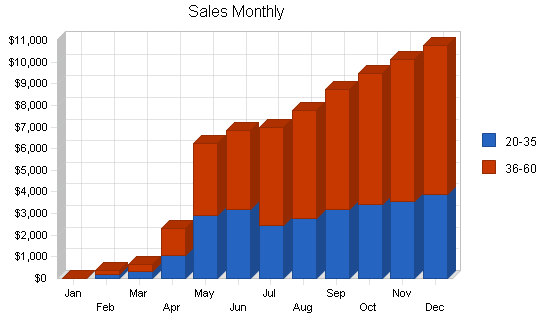
5.3.1 Sales Forecast
Although CompuDate will be purchasing the assets from a pre-existing company, it believes that the first few months of operation will be relatively slow. This will be a function of the need to generate awareness about CompuDate and the fact that this takes time. Profitability will be reached by month 10 with splendiferous sales by year three.
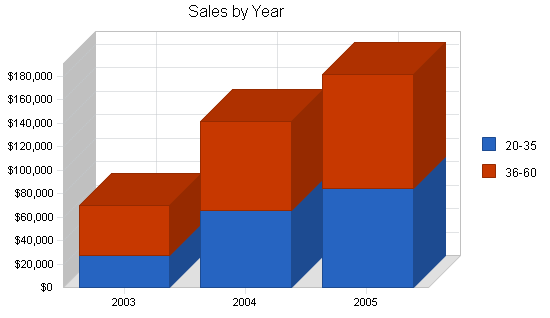
| Sales Forecast | |||
| 2003 | 2004 | 2005 | |
| Sales | |||
| 20-35 | $26,924 | $65,907 | $84,379 |
| 36-60 | $43,363 | $75,755 | $96,987 |
| Total Sales | $70,287 | $141,662 | $181,366 |
| Direct Cost of Sales | 2003 | 2004 | 2005 |
| 20-35 | $1,885 | $4,613 | $5,907 |
| 36-60 | $3,035 | $5,303 | $6,789 |
| Subtotal Direct Cost of Sales | $4,920 | $9,916 | $12,696 |
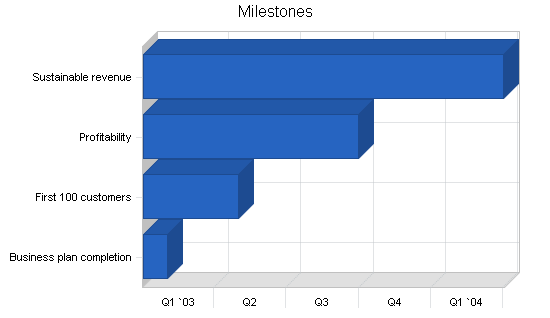
5.4 Milestones
- Business plan completion
- First 100 customers
- Profitability
- Sustainable revenue
| Milestones | |||||
| Milestone | Start Date | End Date | Budget | Manager | Department |
| Business plan completion | 1/1/2003 | 2/1/2003 | $200 | Suzie | Operations |
| First 100 customers | 1/1/2003 | 5/1/2003 | $0 | Suzie | Sales |
| Profitability | 1/1/2003 | 10/1/2003 | $0 | Suzie | Accounting |
| Sustainable revenue | 1/1/2003 | 4/1/2004 | $0 | Suzie | Operations |
| Totals | $200 | ||||
Web Plan Summary
Although CompuDate will be actively using computers for the choosing the matches, its use of computers for the website will fairly limited. The website will be used primarily for informational purposes. Users will not have the option of signing up or filling out the survey online, that all must be done in person at CompuDate’s offices.
6.1 Website Marketing Strategy
CompuDate will rely on two methods of generating increased traffic of visitors to its website. The first method is simply the inclusion of the Web address on all forms of literature that CompuDate may hand out. Having the address on these printed forms will certainly encourage more people to check out the website. The second method is the submission of the website and keywords to popular search engines. This is useful because as users type in CompuDate’s name or a related keyword the CompuDate site will come up.
6.2 Development Requirements
CompuDate will utilize a knowledgeable Internet development consultant to complete the site.
Management Summary
Suzie Butterfly received her Bachelor of Arts from Colorado College. Upon graduation she moved out to the West Coast where she went to work at Yahoo! as employee number 234.
Initially she went to work in their search engine division as a project manager. Suzie spent three years in this department, increasing sales by 333%.
After the third year Suzie was looking for a change and moved over to Yahoo! Personals in its infancy. Suzie was a natural here, intuitively knowing how to develop the site to provide the greatest value to individuals.
After two years with Yahoo! personals she was beginning to get burnt out. She wanted to take some time off and then start her own business, being her own boss.
Feeling comfortable financially (a result of stock options exercised), Suzie left Yahoo! and traveled for eight months. Upon returning Suzie settled in Denver hoping to start her own matchmaking business.
Having spent a while in Yahoo! Personals, she saw the market opportunity and thought that she could make a go of it on her own. Upon her return she began writing a business plan to verify what she believed intuitively, that this could be a profitable (and enjoyable) venture.
7.1 Personnel Plan
The personnel plan is forecasted to have Suzie working exclusively for the first several months, after which she will hire a part-time worker to help with administrative duties.
She will employ a consultant to develop and maintain the website. Suzie will be responsible for operational activities, marketing activities, and some of the accounting. In terms of the operational activities, she will be responsible for vendors relations, customer service, and business development. Suzie will also undertake the marketing activities.
In addition to the marketing activities mentioned in section 5.2, Suzie will make a point to participate in guerrilla marketing which is a grass roots style of marketing where she will be out mingling with perspective customers, “talking up” the services that CompuDate has to offer.
Suzie will also set up the accounting system on QuickBooks Pro. While she will do some of the accounting, much of the general data entry or bookkeeping with be accomplished by the part-time employee.
The employee will be responsible for a wide range of odds and ends activities such as the bookkeeping, customer support, and much of the clerical activities. The leveraging of the part-time employee and consulting assistance will be based on the philosophy that Suzie should only be participating in value-added activities and that she should have a lower paid employee taking care of responsibilities that do not require Suzie’s skills or attention to detail.
| Personnel Plan | |||
| 2003 | 2004 | 2005 | |
| Suzie | $30,000 | $40,000 | $50,000 |
| Part time employee | $21,000 | $36,000 | $36,000 |
| Total People | 3 | 3 | 3 |
| Total Payroll | $51,000 | $76,000 | $86,000 |
Financial Plan
The following sections will outline important financial information.
8.1 Important Assumptions
The following table details important financial assumptions.
| General Assumptions | |||
| 2003 | 2004 | 2005 | |
| Plan Month | 1 | 2 | 3 |
| Current Interest Rate | 10.00% | 10.00% | 10.00% |
| Long-term Interest Rate | 10.00% | 10.00% | 10.00% |
| Tax Rate | 30.00% | 30.00% | 30.00% |
| Other | 0 | 0 | 0 |
8.2 Break-even Analysis
The Break-even Analysis indicates what is needed in monthly revenue to reach the break-even point.

| Break-even Analysis | |
| Monthly Revenue Break-even | $7,236 |
| Assumptions: | |
| Average Percent Variable Cost | 7% |
| Estimated Monthly Fixed Cost | $6,729 |
8.3 Projected Profit and Loss
The following table and charts present the Projected Profit and Loss.


| Pro Forma Profit and Loss | |||
| 2003 | 2004 | 2005 | |
| Sales | $70,287 | $141,662 | $181,366 |
| Direct Cost of Sales | $4,920 | $9,916 | $12,696 |
| Other Costs of Sales | $0 | $0 | $0 |
| Total Cost of Sales | $4,920 | $9,916 | $12,696 |
| Gross Margin | $65,367 | $131,746 | $168,670 |
| Gross Margin % | 93.00% | 93.00% | 93.00% |
| Expenses | |||
| Payroll | $51,000 | $76,000 | $86,000 |
| Sales and Marketing and Other Expenses | $3,600 | $4,000 | $4,500 |
| Depreciation | $0 | $0 | $0 |
| Rent | $6,600 | $6,600 | $6,600 |
| Utilities | $2,400 | $2,400 | $2,400 |
| Insurance | $1,500 | $1,500 | $1,500 |
| Payroll Taxes | $7,650 | $11,400 | $12,900 |
| Website development/maintenance | $8,000 | $2,000 | $3,000 |
| Total Operating Expenses | $80,750 | $103,900 | $116,900 |
| Profit Before Interest and Taxes | ($15,383) | $27,846 | $51,770 |
| EBITDA | ($15,383) | $27,846 | $51,770 |
| Interest Expense | $7,000 | $7,000 | $7,000 |
| Taxes Incurred | $0 | $6,254 | $13,431 |
| Net Profit | ($22,383) | $14,592 | $31,339 |
| Net Profit/Sales | -31.85% | 10.30% | 17.28% |
8.4 Projected Cash Flow
The following table and chart will indicate Projected Cash Flow. Please note that during the month of January there was a cash infusion. This was an investment that Suzie made into the business. Please also note that there was an increase of long-term liabilities. This can be broken down into the purchase of the existing business and needed start-up equipment.

| Pro Forma Cash Flow | |||
| 2003 | 2004 | 2005 | |
| Cash Received | |||
| Cash from Operations | |||
| Cash Sales | $70,287 | $141,662 | $181,366 |
| Subtotal Cash from Operations | $70,287 | $141,662 | $181,366 |
| Additional Cash Received | |||
| Sales Tax, VAT, HST/GST Received | $0 | $0 | $0 |
| New Current Borrowing | $0 | $0 | $0 |
| New Other Liabilities (interest-free) | $0 | $0 | $0 |
| New Long-term Liabilities | $70,000 | $0 | $0 |
| Sales of Other Current Assets | $0 | $0 | $0 |
| Sales of Long-term Assets | $0 | $0 | $0 |
| New Investment Received | $0 | $0 | $0 |
| Subtotal Cash Received | $140,287 | $141,662 | $181,366 |
| Expenditures | 2003 | 2004 | 2005 |
| Expenditures from Operations | |||
| Cash Spending | $51,000 | $76,000 | $86,000 |
| Bill Payments | $44,445 | $50,097 | $62,962 |
| Subtotal Spent on Operations | $95,445 | $126,097 | $148,962 |
| Additional Cash Spent | |||
| Sales Tax, VAT, HST/GST Paid Out | $0 | $0 | $0 |
| Principal Repayment of Current Borrowing | $0 | $0 | $0 |
| Other Liabilities Principal Repayment | $0 | $0 | $0 |
| Long-term Liabilities Principal Repayment | $0 | $0 | $0 |
| Purchase Other Current Assets | $0 | $0 | $0 |
| Purchase Long-term Assets | $40,000 | $0 | $0 |
| Dividends | $0 | $0 | $0 |
| Subtotal Cash Spent | $135,445 | $126,097 | $148,962 |
| Net Cash Flow | $4,842 | $15,564 | $32,404 |
| Cash Balance | $19,396 | $34,960 | $67,364 |
8.5 Projected Balance Sheet
The following table will indicate the Projected Balance Sheet.
| Pro Forma Balance Sheet | |||
| 2003 | 2004 | 2005 | |
| Assets | |||
| Current Assets | |||
| Cash | $19,396 | $34,960 | $67,364 |
| Other Current Assets | $2,000 | $2,000 | $2,000 |
| Total Current Assets | $21,396 | $36,960 | $69,364 |
| Long-term Assets | |||
| Long-term Assets | $40,000 | $40,000 | $40,000 |
| Accumulated Depreciation | $0 | $0 | $0 |
| Total Long-term Assets | $40,000 | $40,000 | $40,000 |
| Total Assets | $61,396 | $76,960 | $109,364 |
| Liabilities and Capital | 2003 | 2004 | 2005 |
| Current Liabilities | |||
| Accounts Payable | $3,225 | $4,198 | $5,262 |
| Current Borrowing | $0 | $0 | $0 |
| Other Current Liabilities | $0 | $0 | $0 |
| Subtotal Current Liabilities | $3,225 | $4,198 | $5,262 |
| Long-term Liabilities | $70,000 | $70,000 | $70,000 |
| Total Liabilities | $73,225 | $74,198 | $75,262 |
| Paid-in Capital | $0 | $0 | $0 |
| Retained Earnings | $10,554 | ($11,829) | $2,763 |
| Earnings | ($22,383) | $14,592 | $31,339 |
| Total Capital | ($11,829) | $2,763 | $34,102 |
| Total Liabilities and Capital | $61,396 | $76,960 | $109,364 |
| Net Worth | ($11,829) | $2,763 | $34,102 |
8.6 Business Ratios
The following table details common business ratios of this business as well as the Personal Services Industry, NAICS code 812990. Please note that the variance of current assets of this company and the industry can be explained that the bulk of CompuDate’s value is in its software and that it is not in need of many other assets.
| Ratio Analysis | ||||
| 2003 | 2004 | 2005 | Industry Profile | |
| Sales Growth | 117.39% | 101.55% | 28.03% | 9.31% |
| Percent of Total Assets | ||||
| Other Current Assets | 3.26% | 2.60% | 1.83% | 51.05% |
| Total Current Assets | 34.85% | 48.03% | 63.43% | 68.55% |
| Long-term Assets | 65.15% | 51.97% | 36.57% | 31.45% |
| Total Assets | 100.00% | 100.00% | 100.00% | 100.00% |
| Current Liabilities | 5.25% | 5.45% | 4.81% | 27.03% |
| Long-term Liabilities | 114.01% | 90.96% | 64.01% | 35.17% |
| Total Liabilities | 119.27% | 96.41% | 68.82% | 62.20% |
| Net Worth | -19.27% | 3.59% | 31.18% | 37.80% |
| Percent of Sales | ||||
| Sales | 100.00% | 100.00% | 100.00% | 100.00% |
| Gross Margin | 93.00% | 93.00% | 93.00% | 49.13% |
| Selling, General & Administrative Expenses | 124.85% | 82.70% | 75.72% | 25.78% |
| Advertising Expenses | 0.00% | 0.00% | 0.00% | 1.18% |
| Profit Before Interest and Taxes | -21.89% | 19.66% | 28.54% | 4.34% |
| Main Ratios | ||||
| Current | 6.63 | 8.81 | 13.18 | 1.85 |
| Quick | 6.63 | 8.81 | 13.18 | 1.42 |
| Total Debt to Total Assets | 119.27% | 96.41% | 68.82% | 66.03% |
| Pre-tax Return on Net Worth | 189.22% | 754.48% | 131.28% | 6.63% |
| Pre-tax Return on Assets | -36.46% | 27.09% | 40.94% | 19.52% |
| Additional Ratios | 2003 | 2004 | 2005 | |
| Net Profit Margin | -31.85% | 10.30% | 17.28% | n.a |
| Return on Equity | 0.00% | 528.14% | 91.90% | n.a |
| Activity Ratios | ||||
| Accounts Payable Turnover | 12.92 | 12.17 | 12.17 | n.a |
| Payment Days | 31 | 27 | 27 | n.a |
| Total Asset Turnover | 1.14 | 1.84 | 1.66 | n.a |
| Debt Ratios | ||||
| Debt to Net Worth | 0.00 | 26.86 | 2.21 | n.a |
| Current Liab. to Liab. | 0.04 | 0.06 | 0.07 | n.a |
| Liquidity Ratios | ||||
| Net Working Capital | $18,171 | $32,763 | $64,102 | n.a |
| Interest Coverage | -2.20 | 3.98 | 7.40 | n.a |
| Additional Ratios | ||||
| Assets to Sales | 0.87 | 0.54 | 0.60 | n.a |
| Current Debt/Total Assets | 5% | 5% | 5% | n.a |
| Acid Test | 6.63 | 8.81 | 13.18 | n.a |
| Sales/Net Worth | 0.00 | 51.27 | 5.32 | n.a |
| Dividend Payout | 0.00 | 0.00 | 0.00 | n.a |
Appendix
| Sales Forecast | |||||||||||||
| Jan | Feb | Mar | Apr | May | Jun | Jul | Aug | Sep | Oct | Nov | Dec | ||
| Sales | |||||||||||||
| 20-35 | 0% | $0 | $174 | $308 | $1,072 | $2,893 | $3,189 | $2,432 | $2,788 | $3,212 | $3,434 | $3,545 | $3,878 |
| 36-60 | 0% | $0 | $200 | $354 | $1,232 | $3,325 | $3,665 | $4,556 | $4,989 | $5,545 | $6,054 | $6,565 | $6,878 |
| Total Sales | $0 | $374 | $662 | $2,304 | $6,218 | $6,854 | $6,988 | $7,777 | $8,757 | $9,488 | $10,110 | $10,756 | |
| Direct Cost of Sales | Jan | Feb | Mar | Apr | May | Jun | Jul | Aug | Sep | Oct | Nov | Dec | |
| 20-35 | $0 | $12 | $22 | $75 | $202 | $223 | $170 | $195 | $225 | $240 | $248 | $271 | |
| 36-60 | $0 | $14 | $25 | $86 | $233 | $257 | $319 | $349 | $388 | $424 | $460 | $481 | |
| Subtotal Direct Cost of Sales | $0 | $26 | $46 | $161 | $435 | $480 | $489 | $544 | $613 | $664 | $708 | $753 | |
| Personnel Plan | |||||||||||||
| Jan | Feb | Mar | Apr | May | Jun | Jul | Aug | Sep | Oct | Nov | Dec | ||
| Suzie | 0% | $2,500 | $2,500 | $2,500 | $2,500 | $2,500 | $2,500 | $2,500 | $2,500 | $2,500 | $2,500 | $2,500 | $2,500 |
| Part time employee | 0% | $0 | $0 | $0 | $1,500 | $1,500 | $1,500 | $1,500 | $3,000 | $3,000 | $3,000 | $3,000 | $3,000 |
| Total People | 1 | 1 | 1 | 2 | 2 | 2 | 2 | 3 | 3 | 3 | 3 | 3 | |
| Total Payroll | $2,500 | $2,500 | $2,500 | $4,000 | $4,000 | $4,000 | $4,000 | $5,500 | $5,500 | $5,500 | $5,500 | $5,500 | |
| General Assumptions | |||||||||||||
| Jan | Feb | Mar | Apr | May | Jun | Jul | Aug | Sep | Oct | Nov | Dec | ||
| Plan Month | 1 | 2 | 3 | 4 | 5 | 6 | 7 | 8 | 9 | 10 | 11 | 12 | |
| Current Interest Rate | 10.00% | 10.00% | 10.00% | 10.00% | 10.00% | 10.00% | 10.00% | 10.00% | 10.00% | 10.00% | 10.00% | 10.00% | |
| Long-term Interest Rate | 10.00% | 10.00% | 10.00% | 10.00% | 10.00% | 10.00% | 10.00% | 10.00% | 10.00% | 10.00% | 10.00% | 10.00% | |
| Tax Rate | 30.00% | 30.00% | 30.00% | 30.00% | 30.00% | 30.00% | 30.00% | 30.00% | 30.00% | 30.00% | 30.00% | 30.00% | |
| Other | 0 | 0 | 0 | 0 | 0 | 0 | 0 | 0 | 0 | 0 | 0 | 0 | |
| Pro Forma Profit and Loss | |||||||||||||
| Jan | Feb | Mar | Apr | May | Jun | Jul | Aug | Sep | Oct | Nov | Dec | ||
| Sales | $0 | $374 | $662 | $2,304 | $6,218 | $6,854 | $6,988 | $7,777 | $8,757 | $9,488 | $10,110 | $10,756 | |
| Direct Cost of Sales | $0 | $26 | $46 | $161 | $435 | $480 | $489 | $544 | $613 | $664 | $708 | $753 | |
| Other Costs of Sales | $0 | $0 | $0 | $0 | $0 | $0 | $0 | $0 | $0 | $0 | $0 | $0 | |
| Total Cost of Sales | $0 | $26 | $46 | $161 | $435 | $480 | $489 | $544 | $613 | $664 | $708 | $753 | |
| Gross Margin | $0 | $348 | $616 | $2,143 | $5,783 | $6,374 | $6,499 | $7,233 | $8,144 | $8,824 | $9,402 | $10,003 | |
| Gross Margin % | 0.00% | 93.00% | 93.00% | 93.00% | 93.00% | 93.00% | 93.00% | 93.00% | 93.00% | 93.00% | 93.00% | 93.00% | |
| Expenses | |||||||||||||
| Payroll | $2,500 | $2,500 | $2,500 | $4,000 | $4,000 | $4,000 | $4,000 | $5,500 | $5,500 | $5,500 | $5,500 | $5,500 | |
| Sales and Marketing and Other Expenses | $300 | $300 | $300 | $300 | $300 | $300 | $300 | $300 | $300 | $300 | $300 | $300 | |
| Depreciation | $0 | $0 | $0 | $0 | $0 | $0 | $0 | $0 | $0 | $0 | $0 | $0 | |
| Rent | $550 | $550 | $550 | $550 | $550 | $550 | $550 | $550 | $550 | $550 | $550 | $550 | |
| Utilities | $200 | $200 | $200 | $200 | $200 | $200 | $200 | $200 | $200 | $200 | $200 | $200 | |
| Insurance | $125 | $125 | $125 | $125 | $125 | $125 | $125 | $125 | $125 | $125 | $125 | $125 | |
| Payroll Taxes | 15% | $375 | $375 | $375 | $600 | $600 | $600 | $600 | $825 | $825 | $825 | $825 | $825 |
| Website development/maintenance | $4,000 | $3,000 | $0 | $0 | $0 | $500 | $0 | $0 | $0 | $0 | $500 | $0 | |
| Total Operating Expenses | $8,050 | $7,050 | $4,050 | $5,775 | $5,775 | $6,275 | $5,775 | $7,500 | $7,500 | $7,500 | $8,000 | $7,500 | |
| Profit Before Interest and Taxes | ($8,050) | ($6,702) | ($3,434) | ($3,632) | $8 | $99 | $724 | ($267) | $644 | $1,324 | $1,402 | $2,503 | |
| EBITDA | ($8,050) | ($6,702) | ($3,434) | ($3,632) | $8 | $99 | $724 | ($267) | $644 | $1,324 | $1,402 | $2,503 | |
| Interest Expense | $583 | $583 | $583 | $583 | $583 | $583 | $583 | $583 | $583 | $583 | $583 | $583 | |
| Taxes Incurred | $0 | $0 | $0 | $0 | $0 | $0 | $0 | $0 | $0 | $0 | $0 | $0 | |
| Net Profit | ($8,633) | ($7,286) | ($4,018) | ($4,216) | ($576) | ($485) | $141 | ($851) | $61 | $741 | $819 | $1,920 | |
| Net Profit/Sales | 0.00% | -1948.00% | -606.92% | -182.99% | -9.26% | -7.07% | 2.01% | -10.94% | 0.69% | 7.80% | 8.10% | 17.85% | |
| Pro Forma Cash Flow | |||||||||||||
| Jan | Feb | Mar | Apr | May | Jun | Jul | Aug | Sep | Oct | Nov | Dec | ||
| Cash Received | |||||||||||||
| Cash from Operations | |||||||||||||
| Cash Sales | $0 | $374 | $662 | $2,304 | $6,218 | $6,854 | $6,988 | $7,777 | $8,757 | $9,488 | $10,110 | $10,756 | |
| Subtotal Cash from Operations | $0 | $374 | $662 | $2,304 | $6,218 | $6,854 | $6,988 | $7,777 | $8,757 | $9,488 | $10,110 | $10,756 | |
| Additional Cash Received | |||||||||||||
| Sales Tax, VAT, HST/GST Received | 0.00% | $0 | $0 | $0 | $0 | $0 | $0 | $0 | $0 | $0 | $0 | $0 | $0 |
| New Current Borrowing | $0 | $0 | $0 | $0 | $0 | $0 | $0 | $0 | $0 | $0 | $0 | $0 | |
| New Other Liabilities (interest-free) | $0 | $0 | $0 | $0 | $0 | $0 | $0 | $0 | $0 | $0 | $0 | $0 | |
| New Long-term Liabilities | $70,000 | $0 | $0 | $0 | $0 | $0 | $0 | $0 | $0 | $0 | $0 | $0 | |
| Sales of Other Current Assets | $0 | $0 | $0 | $0 | $0 | $0 | $0 | $0 | $0 | $0 | $0 | $0 | |
| Sales of Long-term Assets | $0 | $0 | $0 | $0 | $0 | $0 | $0 | $0 | $0 | $0 | $0 | $0 | |
| New Investment Received | $0 | $0 | $0 | $0 | $0 | $0 | $0 | $0 | $0 | $0 | $0 | $0 | |
| Subtotal Cash Received | $70,000 | $374 | $662 | $2,304 | $6,218 | $6,854 | $6,988 | $7,777 | $8,757 | $9,488 | $10,110 | $10,756 | |
| Expenditures | Jan | Feb | Mar | Apr | May | Jun | Jul | Aug | Sep | Oct | Nov | Dec | |
| Expenditures from Operations | |||||||||||||
| Cash Spending | $2,500 | $2,500 | $2,500 | $4,000 | $4,000 | $4,000 | $4,000 | $5,500 | $5,500 | $5,500 | $5,500 | $5,500 | |
| Bill Payments | $6,204 | $6,101 | $5,060 | $2,191 | $2,529 | $2,812 | $3,322 | $2,857 | $3,130 | $3,198 | $3,266 | $3,776 | |
| Subtotal Spent on Operations | $8,704 | $8,601 | $7,560 | $6,191 | $6,529 | $6,812 | $7,322 | $8,357 | $8,630 | $8,698 | $8,766 | $9,276 | |
| Additional Cash Spent | |||||||||||||
| Sales Tax, VAT, HST/GST Paid Out | $0 | $0 | $0 | $0 | $0 | $0 | $0 | $0 | $0 | $0 | $0 | $0 | |
| Principal Repayment of Current Borrowing | $0 | $0 | $0 | $0 | $0 | $0 | $0 | $0 | $0 | $0 | $0 | $0 | |
| Other Liabilities Principal Repayment | $0 | $0 | $0 | $0 | $0 | $0 | $0 | $0 | $0 | $0 | $0 | $0 | |
| Long-term Liabilities Principal Repayment | $0 | $0 | $0 | $0 | $0 | $0 | $0 | $0 | $0 | $0 | $0 | $0 | |
| Purchase Other Current Assets | $0 | $0 | $0 | $0 | $0 | $0 | $0 | $0 | $0 | $0 | $0 | $0 | |
| Purchase Long-term Assets | $40,000 | $0 | $0 | $0 | $0 | $0 | $0 | $0 | $0 | $0 | $0 | $0 | |
| Dividends | $0 | $0 | $0 | $0 | $0 | $0 | $0 | $0 | $0 | $0 | $0 | $0 | |
| Subtotal Cash Spent | $48,704 | $8,601 | $7,560 | $6,191 | $6,529 | $6,812 | $7,322 | $8,357 | $8,630 | $8,698 | $8,766 | $9,276 | |
| Net Cash Flow | $21,296 | ($8,227) | ($6,898) | ($3,887) | ($311) | $42 | ($334) | ($580) | $127 | $790 | $1,344 | $1,480 | |
| Cash Balance | $35,850 | $27,623 | $20,724 | $16,837 | $16,526 | $16,568 | $16,234 | $15,655 | $15,782 | $16,572 | $17,916 | $19,396 | |
| Pro Forma Balance Sheet | |||||||||||||
| Jan | Feb | Mar | Apr | May | Jun | Jul | Aug | Sep | Oct | Nov | Dec | ||
| Assets | Starting Balances | ||||||||||||
| Current Assets | |||||||||||||
| Cash | $14,554 | $35,850 | $27,623 | $20,724 | $16,837 | $16,526 | $16,568 | $16,234 | $15,655 | $15,782 | $16,572 | $17,916 | $19,396 |
| Other Current Assets | $2,000 | $2,000 | $2,000 | $2,000 | $2,000 | $2,000 | $2,000 | $2,000 | $2,000 | $2,000 | $2,000 | $2,000 | $2,000 |
| Total Current Assets | $16,554 | $37,850 | $29,623 | $22,724 | $18,837 | $18,526 | $18,568 | $18,234 | $17,655 | $17,782 | $18,572 | $19,916 | $21,396 |
| Long-term Assets | |||||||||||||
| Long-term Assets | $0 | $40,000 | $40,000 | $40,000 | $40,000 | $40,000 | $40,000 | $40,000 | $40,000 | $40,000 | $40,000 | $40,000 | $40,000 |
| Accumulated Depreciation | $0 | $0 | $0 | $0 | $0 | $0 | $0 | $0 | $0 | $0 | $0 | $0 | $0 |
| Total Long-term Assets | $0 | $40,000 | $40,000 | $40,000 | $40,000 | $40,000 | $40,000 | $40,000 | $40,000 | $40,000 | $40,000 | $40,000 | $40,000 |
| Total Assets | $16,554 | $77,850 | $69,623 | $62,724 | $58,837 | $58,526 | $58,568 | $58,234 | $57,655 | $57,782 | $58,572 | $59,916 | $61,396 |
| Liabilities and Capital | Jan | Feb | Mar | Apr | May | Jun | Jul | Aug | Sep | Oct | Nov | Dec | |
| Current Liabilities | |||||||||||||
| Accounts Payable | $6,000 | $5,929 | $4,988 | $2,107 | $2,436 | $2,700 | $3,227 | $2,753 | $3,023 | $3,090 | $3,139 | $3,665 | $3,225 |
| Current Borrowing | $0 | $0 | $0 | $0 | $0 | $0 | $0 | $0 | $0 | $0 | $0 | $0 | $0 |
| Other Current Liabilities | $0 | $0 | $0 | $0 | $0 | $0 | $0 | $0 | $0 | $0 | $0 | $0 | $0 |
| Subtotal Current Liabilities | $6,000 | $5,929 | $4,988 | $2,107 | $2,436 | $2,700 | $3,227 | $2,753 | $3,023 | $3,090 | $3,139 | $3,665 | $3,225 |
| Long-term Liabilities | $0 | $70,000 | $70,000 | $70,000 | $70,000 | $70,000 | $70,000 | $70,000 | $70,000 | $70,000 | $70,000 | $70,000 | $70,000 |
| Total Liabilities | $6,000 | $75,929 | $74,988 | $72,107 | $72,436 | $72,700 | $73,227 | $72,753 | $73,023 | $73,090 | $73,139 | $73,665 | $73,225 |
| Paid-in Capital | $0 | $0 | $0 | $0 | $0 | $0 | $0 | $0 | $0 | $0 | $0 | $0 | $0 |
| Retained Earnings | $10,554 | $10,554 | $10,554 | $10,554 | $10,554 | $10,554 | $10,554 | $10,554 | $10,554 | $10,554 | $10,554 | $10,554 | $10,554 |
| Earnings | $0 | ($8,633) | ($15,919) | ($19,937) | ($24,152) | ($24,728) | ($25,213) | ($25,072) | ($25,923) | ($25,862) | ($25,122) | ($24,303) | ($22,383) |
| Total Capital | $10,554 | $1,921 | ($5,365) | ($9,383) | ($13,598) | ($14,174) | ($14,659) | ($14,518) | ($15,369) | ($15,308) | ($14,568) | ($13,749) | ($11,829) |
| Total Liabilities and Capital | $16,554 | $77,850 | $69,623 | $62,724 | $58,837 | $58,526 | $58,568 | $58,234 | $57,655 | $57,782 | $58,572 | $59,916 | $61,396 |
| Net Worth | $10,554 | $1,921 | ($5,365) | ($9,383) | ($13,598) | ($14,174) | ($14,659) | ($14,518) | ($15,369) | ($15,308) | ($14,568) | ($13,749) | ($11,829) |

