
TTR Data Recovery
Executive Summary
Data recovery is an often overlooked option when data loss has occurred. TTR Data Recovery Technologies has the expert technicians, knowledgeable customer support staff, and the laboratory facility to solve most disaster recovery crisis quickly, efficiently, and cost-effectively.
It is estimated that, last year, companies lost data valued at $2 billion dollars through mechanical or electrical failure, virus activity, system malfunctions, accidental erasure or water, fire or smoke damage. TTR Data Recovery Technologies can recover mission critical data when all other conventional methods and experts have failed.
TTR Data Recovery Technologies, depending on the extent of the damage, will get the data back to life in 24 to 48 hours. For time-sensitive data loss situations, a direct modem-to-modem transfer or high-speed T1 FTP data transfer will be available by way of the Internet.
TTR Data Recovery Technologies has proprietary recovery technology that is not operation system dependant. From DOS to Novell to Macintosh to UNIX, the company has the technology and expertise to retrieve critical data. TTR Data Recovery Technologies’ engineers have a commitment to innovation, and have developed in-house software and hardware solutions to retrieve the maximum amount of data.
Dan Whitaker, co-owner of TTR Data Recovery Technologies, has been a professional in the field of data recovery for fifteen years. He has recovered data for Fortune 500 companies, governments, military, and a number of the country’s leading educational and research institutions.
1.1 Objectives
- Establish TTR Data Recovery as the national leader in critical data retrieval.
- Increase the number of Value Added Resellers (VARs) offering recovery services through TTR Data Recovery by 20% over the next two years.
1.2 Keys to Success
The keys to success in TTR Data Recovery Technologies are:
- Offering innovative solutions to data retrieval.
- Reliable and timely solutions. Get the data back to the company in two days at the latest.
- A reliable administration that is ready to serve customers, prepare accurate billing, follow-up on orders and other documentation, and maintain a close watch on expenses and collection of accounts receivable.

Company Summary
TTR Data Recovery Technologies is a new company offering recovery solutions for data loss on computers, servers, and any operating media. The company will focus on three target customers:
- Value added resellers (VAR);
- Company IT units;
- Public institution IT units.
Dan Whitaker is creating TTR Data Recovery Technologies with fifteen years of experience in the field. His insight and management skill will be instrumental in establishing the company as an industry giant.
TTR Data Recovery Technologies has proprietary recovery technology that is not operation system dependant. From DOS to Novell to Macintosh to UNIX, the company has the technology and expertise to retrieve critical data.
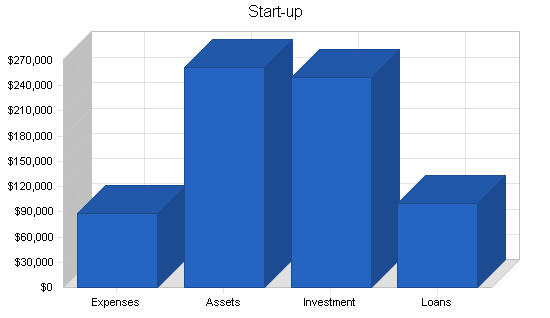
2.1 Start-up Summary
The start-up cost of TTR Data Recovery Technologies will consist primarily of computer and data restoration equipment. Dan Whitaker will invest $100,000. A silent partner will invest $150,000. Dan will also secure a $100,000 loan.
The $80,000 in equipment listed in the start-up table is for clean room equipment (air filtering system equipment), data retrieval equipment for hard drives to store recovered data and hardware fixtures to examine and clean hard drives.
| Start-up | |
| Requirements | |
| Start-up Expenses | |
| Legal | $1,000 |
| Stationery etc. | $800 |
| Brochures | $2,000 |
| Insurance | $1,000 |
| Rent | $3,000 |
| Expensed Equipment | $80,000 |
| Total Start-up Expenses | $87,800 |
| Start-up Assets | |
| Cash Required | $162,200 |
| Other Current Assets | $0 |
| Long-term Assets | $100,000 |
| Total Assets | $262,200 |
| Total Requirements | $350,000 |
| Start-up Funding | |
| Start-up Expenses to Fund | $87,800 |
| Start-up Assets to Fund | $262,200 |
| Total Funding Required | $350,000 |
| Assets | |
| Non-cash Assets from Start-up | $100,000 |
| Cash Requirements from Start-up | $162,200 |
| Additional Cash Raised | $0 |
| Cash Balance on Starting Date | $162,200 |
| Total Assets | $262,200 |
| Liabilities and Capital | |
| Liabilities | |
| Current Borrowing | $0 |
| Long-term Liabilities | $100,000 |
| Accounts Payable (Outstanding Bills) | $0 |
| Other Current Liabilities (interest-free) | $0 |
| Total Liabilities | $100,000 |
| Capital | |
| Planned Investment | |
| Dan Whitaker | $100,000 |
| Silent Partner | $150,000 |
| Additional Investment Requirement | $0 |
| Total Planned Investment | $250,000 |
| Loss at Start-up (Start-up Expenses) | ($87,800) |
| Total Capital | $162,200 |
| Total Capital and Liabilities | $262,200 |
| Total Funding | $350,000 |
2.2 Company Ownership
Dan Whitaker, co-owner of TTR Data Recovery Technologies, has been a professional in the field of data recovery for latest fifteen years. The company will be set up as a Limited Partnership. Dan Whitaker will share ownership with a silent partner.
Services
TTR Data Technologies recovers a client’s data from tape backups, hard drives, optical media, removable media and anything in between, getting data when all others fail. Remote file structure repair services are also offered.
Depending on the extent of the damage, TTR Data Recovery Technologies will get the data back to life in 24 to 48 hours. For time-sensitive data loss situations, a direct modem-to-modem transfer or high-speed T1 FTP data transfer is available by way of the Internet.
TTR Data Recovery Technologies has proprietary recovery technology that is not operation system dependant. From DOS to Novell to Macintosh to UNIX, the company has the technology and expertise to retrieve critical data.
In-house software and hardware solutions have been developed by TTR Data Recovery Technologies’ engineers to retrieve the maximum amount of data from damaged data storage mediums.
Market Analysis Summary
Data recovery is a $150 million specialty industry that is growing by 10% each year. As more and more companies realize that there are solutions to data recovery that can save millions of dollars, the industry will grow even faster.
An important element in the growth of the industry is the how often most companies need recovery services. Recent surveys indicate that recovery services are required, on average, two to five times a year. Consequently, most companies don’t invest in personnel with data recovery expertise.
In a number of respects, recovery services are important to a company only after data has been destroyed. This offers an opportunity and a disadvantage to firms like TTR Data Recovery Technologies.
When companies contact TTR, they want the problem solved yesterday. When TTR contacts the company concerning future failures, companies are hesitant to invest in preventative actions. This will change in the future. The marketing goal of TTR Data Recovery Technologies is to successfully sell preventative recovery programs to companies.
4.1 Market Segmentation
ERR Data Recovery Technologies will focus on three customer groups:
- Value Added Resellers (VAR): This group is the critical supplier of products and services to almost every industry. Data recovery services can quickly become a strong profit center for VARs serving their markets. The VAR would sell the service to the customer and TTR Data Recovery Technologies would perform the work.
- Company IT Units: These units manage the company servers and networking systems. Clearly, when data is lost, it is their job to retrieve it quickly. TTR Data Recovery Technologies would be an invaluable resource when recovering data.
- Public Institution IT Units: These units manage the research and educational institutions’ servers and networking systems. Years of research or institution data can be lost. Typically, these institution don’t have the expertise in-house to solve these problems.

| Market Analysis | |||||||
| Year 1 | Year 2 | Year 3 | Year 4 | Year 5 | |||
| Potential Customers | Growth | CAGR | |||||
| Value Added Resellers | 20% | 20,000 | 24,000 | 28,800 | 34,560 | 41,472 | 20.00% |
| Company IT Units | 10% | 100,000 | 110,000 | 121,000 | 133,100 | 146,410 | 10.00% |
| Public IT Units | 10% | 30,000 | 33,000 | 36,300 | 39,930 | 43,923 | 10.00% |
| Total | 11.50% | 150,000 | 167,000 | 186,100 | 207,590 | 231,805 | 11.50% |
Strategy and Implementation Summary
TTR Data Recovery Technologies will aggressively pursue developing a VARs program to open the market for data recovery. In addition, the company will cultivate relationships with company and public IT units by providing a free diagnostic software program that will assist in assessing damage to a media.

5.1 Competitive Edge
Dan Whitaker is the competitive edge of TTR Data Recovery Technologies. Dan has worked for both Rogue Computer Services and CBL Technologies over the past fifteen years. In his last position with CBL Technologies, Dan managed the growth of the Data Recovery Unit. He generated sales in excess of $3 million annually. His strength is his customer relation skills and he has been successful in expanding the range of services offered by the company.
The staff of TTR Data Recovery Technologies are impressive also:
- Al Siano: Seven years of experience in data recovery. Area of expertise: mechanical failure, head crash, media damage, controller malfunction, actuator failure, and damaged motor.
- Linda Stevens: Eight years of experience in data recovery. Area of expertise: user error, accidental deletions, reformatting, repartition, virus infection, directory corruption, and lost/forgotten password.
- Roger Williams: Five years of experience in data recovery. Area of expertise: natural disaster, fire, flood, hurricane/tornado, earthquake, and power spike.
TTR Data Recovery Technologies’ facility has a Class 100 Cleanroom in order to make delicate repairs, with no margin of error for the smallest of particles. This pristine facility maintains fewer than 100 circulating air contaminant particles per million (10,000X purer than the everyday environment), ensuring a regulated atmosphere for performing sensitive open drive surgery. In addition, the staff wears special suits, hair caps, face masks, boots and latex gloves.
5.2 Sales Strategy
TTR Data Recovery Technologies will have three distinct sales approaches:
- For VARs: We will offer VARs a flat service fee. Each VAR can then set their own price for the service to their customer.
- IT Units: We will offer a free diagnostic software program that will assist in assessing damage to a media. We will also offer a 15% discount for recovery services.
5.2.1 Sales Forecast
For the first month there will be no sales, as the company will be establishing its operations. We anticipate that sales will grow quickly during the second and third month of operation.
The following is the sales forecast for three years.

| Sales Forecast | |||
| Year 1 | Year 2 | Year 3 | |
| Sales | |||
| VARs | $220,000 | $260,000 | $300,000 |
| IT Units | $148,000 | $188,000 | $228,000 |
| Total Sales | $368,000 | $448,000 | $528,000 |
| Direct Cost of Sales | Year 1 | Year 2 | Year 3 |
| VARs | $0 | $0 | $0 |
| IT Units | $0 | $0 | $0 |
| Subtotal Direct Cost of Sales | $0 | $0 | $0 |
Management Summary
Dan Whitaker will manage the day to day operations of TTR Data Recovery Technologies, as well as serve a a member of the data recovery team. In addition to the recovery team, John Marks has been added to the staff as sales manager.
John has been sales manager at Rogue Computer Services for seven years. During that times sales for the company has grown between 9% and 12% each year. Last year, Rogue Computer Services exceeded $10 million in sales of product and services.
TTR Data Recovery Technologies will also have one customer service/clerical staff member.
6.1 Personnel Plan
The personnel of TTR Data Recovery Technologies are as follows:
- Manager;
- Customer service/clerical (1);
- Data recovery staff (3);
- Sales manager.
| Personnel Plan | |||
| Year 1 | Year 2 | Year 3 | |
| Manager | $36,000 | $40,000 | $44,000 |
| Customer Service/Clerical (1) | $24,000 | $26,000 | $28,000 |
| Data Recovery Staff (3) | $120,000 | $130,000 | $140,000 |
| Sales Manager | $36,000 | $38,000 | $40,000 |
| Other | $0 | $0 | $0 |
| Total People | 6 | 6 | 6 |
| Total Payroll | $216,000 | $234,000 | $252,000 |
Financial Plan
The following is the financial plan for TTR Data Recovery Technologies.
| General Assumptions | |||
| Year 1 | Year 2 | Year 3 | |
| Plan Month | 1 | 2 | 3 |
| Current Interest Rate | 10.00% | 10.00% | 10.00% |
| Long-term Interest Rate | 10.00% | 10.00% | 10.00% |
| Tax Rate | 30.00% | 30.00% | 30.00% |
| Other | 0 | 0 | 0 |
7.1 Break-even Analysis
The monthly break-even point is shown below.

| Break-even Analysis | |
| Monthly Revenue Break-even | $26,440 |
| Assumptions: | |
| Average Percent Variable Cost | 0% |
| Estimated Monthly Fixed Cost | $26,440 |
7.2 Projected Profit and Loss
The following table and chart will highlight projected profit and loss for the next three years.


| Pro Forma Profit and Loss | |||
| Year 1 | Year 2 | Year 3 | |
| Sales | $368,000 | $448,000 | $528,000 |
| Direct Cost of Sales | $0 | $0 | $0 |
| Other Production Expenses | $0 | $0 | $0 |
| Total Cost of Sales | $0 | $0 | $0 |
| Gross Margin | $368,000 | $448,000 | $528,000 |
| Gross Margin % | 100.00% | 100.00% | 100.00% |
| Expenses | |||
| Payroll | $216,000 | $234,000 | $252,000 |
| Sales and Marketing and Other Expenses | $18,000 | $36,000 | $46,000 |
| Depreciation | $2,880 | $2,880 | $2,880 |
| Leased Equipment | $0 | $0 | $0 |
| Utilities | $6,000 | $6,000 | $6,000 |
| Insurance | $6,000 | $6,000 | $6,000 |
| Rent | $36,000 | $36,000 | $36,000 |
| Payroll Taxes | $32,400 | $35,100 | $37,800 |
| Other | $0 | $0 | $0 |
| Total Operating Expenses | $317,280 | $355,980 | $386,680 |
| Profit Before Interest and Taxes | $50,720 | $92,020 | $141,320 |
| EBITDA | $53,600 | $94,900 | $144,200 |
| Interest Expense | $9,233 | $7,876 | $6,460 |
| Taxes Incurred | $12,446 | $25,243 | $40,458 |
| Net Profit | $29,041 | $58,901 | $94,402 |
| Net Profit/Sales | 7.89% | 13.15% | 17.88% |
7.3 Projected Cash Flow
The following table and chart highlight the projected cash flow for three years.

| Pro Forma Cash Flow | |||
| Year 1 | Year 2 | Year 3 | |
| Cash Received | |||
| Cash from Operations | |||
| Cash Sales | $92,000 | $112,000 | $132,000 |
| Cash from Receivables | $219,200 | $323,652 | $383,652 |
| Subtotal Cash from Operations | $311,200 | $435,652 | $515,652 |
| Additional Cash Received | |||
| Sales Tax, VAT, HST/GST Received | $0 | $0 | $0 |
| New Current Borrowing | $0 | $0 | $0 |
| New Other Liabilities (interest-free) | $0 | $0 | $0 |
| New Long-term Liabilities | $0 | $0 | $0 |
| Sales of Other Current Assets | $0 | $0 | $0 |
| Sales of Long-term Assets | $0 | $0 | $0 |
| New Investment Received | $0 | $0 | $0 |
| Subtotal Cash Received | $311,200 | $435,652 | $515,652 |
| Expenditures | Year 1 | Year 2 | Year 3 |
| Expenditures from Operations | |||
| Cash Spending | $216,000 | $234,000 | $252,000 |
| Bill Payments | $108,026 | $151,761 | $176,540 |
| Subtotal Spent on Operations | $324,026 | $385,761 | $428,540 |
| Additional Cash Spent | |||
| Sales Tax, VAT, HST/GST Paid Out | $0 | $0 | $0 |
| Principal Repayment of Current Borrowing | $0 | $0 | $0 |
| Other Liabilities Principal Repayment | $0 | $0 | $0 |
| Long-term Liabilities Principal Repayment | $14,160 | $14,160 | $14,160 |
| Purchase Other Current Assets | $0 | $0 | $0 |
| Purchase Long-term Assets | $0 | $0 | $0 |
| Dividends | $0 | $0 | $0 |
| Subtotal Cash Spent | $338,186 | $399,921 | $442,700 |
| Net Cash Flow | ($26,986) | $35,731 | $72,952 |
| Cash Balance | $135,214 | $170,945 | $243,897 |
7.4 Projected Balance Sheet
The following table highlights the projected balance sheet for three years.
| Pro Forma Balance Sheet | |||
| Year 1 | Year 2 | Year 3 | |
| Assets | |||
| Current Assets | |||
| Cash | $135,214 | $170,945 | $243,897 |
| Accounts Receivable | $56,800 | $69,148 | $81,496 |
| Other Current Assets | $0 | $0 | $0 |
| Total Current Assets | $192,014 | $240,093 | $325,393 |
| Long-term Assets | |||
| Long-term Assets | $100,000 | $100,000 | $100,000 |
| Accumulated Depreciation | $2,880 | $5,760 | $8,640 |
| Total Long-term Assets | $97,120 | $94,240 | $91,360 |
| Total Assets | $289,134 | $334,333 | $416,753 |
| Liabilities and Capital | Year 1 | Year 2 | Year 3 |
| Current Liabilities | |||
| Accounts Payable | $12,053 | $12,511 | $14,689 |
| Current Borrowing | $0 | $0 | $0 |
| Other Current Liabilities | $0 | $0 | $0 |
| Subtotal Current Liabilities | $12,053 | $12,511 | $14,689 |
| Long-term Liabilities | $85,840 | $71,680 | $57,520 |
| Total Liabilities | $97,893 | $84,191 | $72,209 |
| Paid-in Capital | $250,000 | $250,000 | $250,000 |
| Retained Earnings | ($87,800) | ($58,759) | $142 |
| Earnings | $29,041 | $58,901 | $94,402 |
| Total Capital | $191,241 | $250,142 | $344,544 |
| Total Liabilities and Capital | $289,134 | $334,333 | $416,753 |
| Net Worth | $191,241 | $250,142 | $344,544 |
7.5 Business Ratios
Business ratios for the years of this plan are shown below. Industry profile ratios based on the Standard Industrial Classification (SIC) code 7379, Computer Related Services, are shown for comparison.
| Ratio Analysis | ||||
| Year 1 | Year 2 | Year 3 | Industry Profile | |
| Sales Growth | 0.00% | 21.74% | 17.86% | 7.20% |
| Percent of Total Assets | ||||
| Accounts Receivable | 19.64% | 20.68% | 19.55% | 21.70% |
| Other Current Assets | 0.00% | 0.00% | 0.00% | 46.70% |
| Total Current Assets | 66.41% | 71.81% | 78.08% | 71.90% |
| Long-term Assets | 33.59% | 28.19% | 21.92% | 28.10% |
| Total Assets | 100.00% | 100.00% | 100.00% | 100.00% |
| Current Liabilities | 4.17% | 3.74% | 3.52% | 51.40% |
| Long-term Liabilities | 29.69% | 21.44% | 13.80% | 19.10% |
| Total Liabilities | 33.86% | 25.18% | 17.33% | 70.50% |
| Net Worth | 66.14% | 74.82% | 82.67% | 29.50% |
| Percent of Sales | ||||
| Sales | 100.00% | 100.00% | 100.00% | 100.00% |
| Gross Margin | 100.00% | 100.00% | 100.00% | 0.00% |
| Selling, General & Administrative Expenses | 92.11% | 86.85% | 82.12% | 80.70% |
| Advertising Expenses | 3.26% | 6.70% | 7.58% | 1.20% |
| Profit Before Interest and Taxes | 13.78% | 20.54% | 26.77% | 1.70% |
| Main Ratios | ||||
| Current | 15.93 | 19.19 | 22.15 | 1.27 |
| Quick | 15.93 | 19.19 | 22.15 | 1.01 |
| Total Debt to Total Assets | 33.86% | 25.18% | 17.33% | 70.50% |
| Pre-tax Return on Net Worth | 21.69% | 33.64% | 39.14% | 3.50% |
| Pre-tax Return on Assets | 14.35% | 25.17% | 32.36% | 11.80% |
| Additional Ratios | Year 1 | Year 2 | Year 3 | |
| Net Profit Margin | 7.89% | 13.15% | 17.88% | n.a |
| Return on Equity | 15.19% | 23.55% | 27.40% | n.a |
| Activity Ratios | ||||
| Accounts Receivable Turnover | 4.86 | 4.86 | 4.86 | n.a |
| Collection Days | 57 | 68 | 69 | n.a |
| Accounts Payable Turnover | 9.96 | 12.17 | 12.17 | n.a |
| Payment Days | 27 | 29 | 28 | n.a |
| Total Asset Turnover | 1.27 | 1.34 | 1.27 | n.a |
| Debt Ratios | ||||
| Debt to Net Worth | 0.51 | 0.34 | 0.21 | n.a |
| Current Liab. to Liab. | 0.12 | 0.15 | 0.20 | n.a |
| Liquidity Ratios | ||||
| Net Working Capital | $179,961 | $227,582 | $310,704 | n.a |
| Interest Coverage | 5.49 | 11.68 | 21.88 | n.a |
| Additional Ratios | ||||
| Assets to Sales | 0.79 | 0.75 | 0.79 | n.a |
| Current Debt/Total Assets | 4% | 4% | 4% | n.a |
| Acid Test | 11.22 | 13.66 | 16.60 | n.a |
| Sales/Net Worth | 1.92 | 1.79 | 1.53 | n.a |
| Dividend Payout | 0.00 | 0.00 | 0.00 | n.a |
Appendix
| Sales Forecast | |||||||||||||
| Month 1 | Month 2 | Month 3 | Month 4 | Month 5 | Month 6 | Month 7 | Month 8 | Month 9 | Month 10 | Month 11 | Month 12 | ||
| Sales | |||||||||||||
| VARs | 0% | $0 | $10,000 | $10,000 | $12,000 | $16,000 | $18,000 | $25,000 | $29,000 | $33,000 | $25,000 | $20,000 | $22,000 |
| IT Units | 0% | $0 | $5,000 | $4,000 | $6,000 | $8,000 | $11,000 | $16,000 | $22,000 | $25,000 | $16,000 | $18,000 | $17,000 |
| Total Sales | $0 | $15,000 | $14,000 | $18,000 | $24,000 | $29,000 | $41,000 | $51,000 | $58,000 | $41,000 | $38,000 | $39,000 | |
| Direct Cost of Sales | Month 1 | Month 2 | Month 3 | Month 4 | Month 5 | Month 6 | Month 7 | Month 8 | Month 9 | Month 10 | Month 11 | Month 12 | |
| VARs | $0 | $0 | $0 | $0 | $0 | $0 | $0 | $0 | $0 | $0 | $0 | $0 | |
| IT Units | $0 | $0 | $0 | $0 | $0 | $0 | $0 | $0 | $0 | $0 | $0 | $0 | |
| Subtotal Direct Cost of Sales | $0 | $0 | $0 | $0 | $0 | $0 | $0 | $0 | $0 | $0 | $0 | $0 | |
| Personnel Plan | |||||||||||||
| Month 1 | Month 2 | Month 3 | Month 4 | Month 5 | Month 6 | Month 7 | Month 8 | Month 9 | Month 10 | Month 11 | Month 12 | ||
| Manager | 0% | $3,000 | $3,000 | $3,000 | $3,000 | $3,000 | $3,000 | $3,000 | $3,000 | $3,000 | $3,000 | $3,000 | $3,000 |
| Customer Service/Clerical (1) | 0% | $2,000 | $2,000 | $2,000 | $2,000 | $2,000 | $2,000 | $2,000 | $2,000 | $2,000 | $2,000 | $2,000 | $2,000 |
| Data Recovery Staff (3) | 0% | $10,000 | $10,000 | $10,000 | $10,000 | $10,000 | $10,000 | $10,000 | $10,000 | $10,000 | $10,000 | $10,000 | $10,000 |
| Sales Manager | 0% | $3,000 | $3,000 | $3,000 | $3,000 | $3,000 | $3,000 | $3,000 | $3,000 | $3,000 | $3,000 | $3,000 | $3,000 |
| Other | 0% | $0 | $0 | $0 | $0 | $0 | $0 | $0 | $0 | $0 | $0 | $0 | $0 |
| Total People | 6 | 6 | 6 | 6 | 6 | 6 | 6 | 6 | 6 | 6 | 6 | 6 | |
| Total Payroll | $18,000 | $18,000 | $18,000 | $18,000 | $18,000 | $18,000 | $18,000 | $18,000 | $18,000 | $18,000 | $18,000 | $18,000 | |
| General Assumptions | |||||||||||||
| Month 1 | Month 2 | Month 3 | Month 4 | Month 5 | Month 6 | Month 7 | Month 8 | Month 9 | Month 10 | Month 11 | Month 12 | ||
| Plan Month | 1 | 2 | 3 | 4 | 5 | 6 | 7 | 8 | 9 | 10 | 11 | 12 | |
| Current Interest Rate | 10.00% | 10.00% | 10.00% | 10.00% | 10.00% | 10.00% | 10.00% | 10.00% | 10.00% | 10.00% | 10.00% | 10.00% | |
| Long-term Interest Rate | 10.00% | 10.00% | 10.00% | 10.00% | 10.00% | 10.00% | 10.00% | 10.00% | 10.00% | 10.00% | 10.00% | 10.00% | |
| Tax Rate | 30.00% | 30.00% | 30.00% | 30.00% | 30.00% | 30.00% | 30.00% | 30.00% | 30.00% | 30.00% | 30.00% | 30.00% | |
| Other | 0 | 0 | 0 | 0 | 0 | 0 | 0 | 0 | 0 | 0 | 0 | 0 | |
| Pro Forma Profit and Loss | |||||||||||||
| Month 1 | Month 2 | Month 3 | Month 4 | Month 5 | Month 6 | Month 7 | Month 8 | Month 9 | Month 10 | Month 11 | Month 12 | ||
| Sales | $0 | $15,000 | $14,000 | $18,000 | $24,000 | $29,000 | $41,000 | $51,000 | $58,000 | $41,000 | $38,000 | $39,000 | |
| Direct Cost of Sales | $0 | $0 | $0 | $0 | $0 | $0 | $0 | $0 | $0 | $0 | $0 | $0 | |
| Other Production Expenses | $0 | $0 | $0 | $0 | $0 | $0 | $0 | $0 | $0 | $0 | $0 | $0 | |
| Total Cost of Sales | $0 | $0 | $0 | $0 | $0 | $0 | $0 | $0 | $0 | $0 | $0 | $0 | |
| Gross Margin | $0 | $15,000 | $14,000 | $18,000 | $24,000 | $29,000 | $41,000 | $51,000 | $58,000 | $41,000 | $38,000 | $39,000 | |
| Gross Margin % | 0.00% | 100.00% | 100.00% | 100.00% | 100.00% | 100.00% | 100.00% | 100.00% | 100.00% | 100.00% | 100.00% | 100.00% | |
| Expenses | |||||||||||||
| Payroll | $18,000 | $18,000 | $18,000 | $18,000 | $18,000 | $18,000 | $18,000 | $18,000 | $18,000 | $18,000 | $18,000 | $18,000 | |
| Sales and Marketing and Other Expenses | $1,500 | $1,500 | $1,500 | $1,500 | $1,500 | $1,500 | $1,500 | $1,500 | $1,500 | $1,500 | $1,500 | $1,500 | |
| Depreciation | $240 | $240 | $240 | $240 | $240 | $240 | $240 | $240 | $240 | $240 | $240 | $240 | |
| Leased Equipment | $0 | $0 | $0 | $0 | $0 | $0 | $0 | $0 | $0 | $0 | $0 | $0 | |
| Utilities | $500 | $500 | $500 | $500 | $500 | $500 | $500 | $500 | $500 | $500 | $500 | $500 | |
| Insurance | $500 | $500 | $500 | $500 | $500 | $500 | $500 | $500 | $500 | $500 | $500 | $500 | |
| Rent | $3,000 | $3,000 | $3,000 | $3,000 | $3,000 | $3,000 | $3,000 | $3,000 | $3,000 | $3,000 | $3,000 | $3,000 | |
| Payroll Taxes | 15% | $2,700 | $2,700 | $2,700 | $2,700 | $2,700 | $2,700 | $2,700 | $2,700 | $2,700 | $2,700 | $2,700 | $2,700 |
| Other | $0 | $0 | $0 | $0 | $0 | $0 | $0 | $0 | $0 | $0 | $0 | $0 | |
| Total Operating Expenses | $26,440 | $26,440 | $26,440 | $26,440 | $26,440 | $26,440 | $26,440 | $26,440 | $26,440 | $26,440 | $26,440 | $26,440 | |
| Profit Before Interest and Taxes | ($26,440) | ($11,440) | ($12,440) | ($8,440) | ($2,440) | $2,560 | $14,560 | $24,560 | $31,560 | $14,560 | $11,560 | $12,560 | |
| EBITDA | ($26,200) | ($11,200) | ($12,200) | ($8,200) | ($2,200) | $2,800 | $14,800 | $24,800 | $31,800 | $14,800 | $11,800 | $12,800 | |
| Interest Expense | $824 | $814 | $804 | $794 | $784 | $774 | $765 | $755 | $745 | $735 | $725 | $715 | |
| Taxes Incurred | ($8,179) | ($3,676) | ($3,973) | ($2,770) | ($967) | $536 | $4,139 | $7,142 | $9,245 | $4,148 | $3,250 | $3,553 | |
| Net Profit | ($19,084) | ($8,578) | ($9,271) | ($6,464) | ($2,257) | $1,250 | $9,657 | $16,664 | $21,571 | $9,678 | $7,584 | $8,291 | |
| Net Profit/Sales | 0.00% | -57.18% | -66.22% | -35.91% | -9.40% | 4.31% | 23.55% | 32.67% | 37.19% | 23.60% | 19.96% | 21.26% | |
| Pro Forma Cash Flow | |||||||||||||
| Month 1 | Month 2 | Month 3 | Month 4 | Month 5 | Month 6 | Month 7 | Month 8 | Month 9 | Month 10 | Month 11 | Month 12 | ||
| Cash Received | |||||||||||||
| Cash from Operations | |||||||||||||
| Cash Sales | $0 | $3,750 | $3,500 | $4,500 | $6,000 | $7,250 | $10,250 | $12,750 | $14,500 | $10,250 | $9,500 | $9,750 | |
| Cash from Receivables | $0 | $0 | $375 | $11,225 | $10,600 | $13,650 | $18,125 | $22,050 | $31,000 | $38,425 | $43,075 | $30,675 | |
| Subtotal Cash from Operations | $0 | $3,750 | $3,875 | $15,725 | $16,600 | $20,900 | $28,375 | $34,800 | $45,500 | $48,675 | $52,575 | $40,425 | |
| Additional Cash Received | |||||||||||||
| Sales Tax, VAT, HST/GST Received | 0.00% | $0 | $0 | $0 | $0 | $0 | $0 | $0 | $0 | $0 | $0 | $0 | $0 |
| New Current Borrowing | $0 | $0 | $0 | $0 | $0 | $0 | $0 | $0 | $0 | $0 | $0 | $0 | |
| New Other Liabilities (interest-free) | $0 | $0 | $0 | $0 | $0 | $0 | $0 | $0 | $0 | $0 | $0 | $0 | |
| New Long-term Liabilities | $0 | $0 | $0 | $0 | $0 | $0 | $0 | $0 | $0 | $0 | $0 | $0 | |
| Sales of Other Current Assets | $0 | $0 | $0 | $0 | $0 | $0 | $0 | $0 | $0 | $0 | $0 | $0 | |
| Sales of Long-term Assets | $0 | $0 | $0 | $0 | $0 | $0 | $0 | $0 | $0 | $0 | $0 | $0 | |
| New Investment Received | $0 | $0 | $0 | $0 | $0 | $0 | $0 | $0 | $0 | $0 | $0 | $0 | |
| Subtotal Cash Received | $0 | $3,750 | $3,875 | $15,725 | $16,600 | $20,900 | $28,375 | $34,800 | $45,500 | $48,675 | $52,575 | $40,425 | |
| Expenditures | Month 1 | Month 2 | Month 3 | Month 4 | Month 5 | Month 6 | Month 7 | Month 8 | Month 9 | Month 10 | Month 11 | Month 12 | |
| Expenditures from Operations | |||||||||||||
| Cash Spending | $18,000 | $18,000 | $18,000 | $18,000 | $18,000 | $18,000 | $18,000 | $18,000 | $18,000 | $18,000 | $18,000 | $18,000 | |
| Bill Payments | $28 | $994 | $5,327 | $5,070 | $6,284 | $8,067 | $9,630 | $13,203 | $16,166 | $18,019 | $13,052 | $12,185 | |
| Subtotal Spent on Operations | $18,028 | $18,994 | $23,327 | $23,070 | $24,284 | $26,067 | $27,630 | $31,203 | $34,166 | $36,019 | $31,052 | $30,185 | |
| Additional Cash Spent | |||||||||||||
| Sales Tax, VAT, HST/GST Paid Out | $0 | $0 | $0 | $0 | $0 | $0 | $0 | $0 | $0 | $0 | $0 | $0 | |
| Principal Repayment of Current Borrowing | $0 | $0 | $0 | $0 | $0 | $0 | $0 | $0 | $0 | $0 | $0 | $0 | |
| Other Liabilities Principal Repayment | $0 | $0 | $0 | $0 | $0 | $0 | $0 | $0 | $0 | $0 | $0 | $0 | |
| Long-term Liabilities Principal Repayment | $1,180 | $1,180 | $1,180 | $1,180 | $1,180 | $1,180 | $1,180 | $1,180 | $1,180 | $1,180 | $1,180 | $1,180 | |
| Purchase Other Current Assets | $0 | $0 | $0 | $0 | $0 | $0 | $0 | $0 | $0 | $0 | $0 | $0 | |
| Purchase Long-term Assets | $0 | $0 | $0 | $0 | $0 | $0 | $0 | $0 | $0 | $0 | $0 | $0 | |
| Dividends | $0 | $0 | $0 | $0 | $0 | $0 | $0 | $0 | $0 | $0 | $0 | $0 | |
| Subtotal Cash Spent | $19,208 | $20,174 | $24,507 | $24,250 | $25,464 | $27,247 | $28,810 | $32,383 | $35,346 | $37,199 | $32,232 | $31,365 | |
| Net Cash Flow | ($19,208) | ($16,424) | ($20,632) | ($8,525) | ($8,864) | ($6,347) | ($435) | $2,417 | $10,154 | $11,476 | $20,343 | $9,060 | |
| Cash Balance | $142,992 | $126,568 | $105,935 | $97,410 | $88,546 | $82,200 | $81,765 | $84,182 | $94,336 | $105,812 | $126,154 | $135,214 | |
| Pro Forma Balance Sheet | |||||||||||||
| Month 1 | Month 2 | Month 3 | Month 4 | Month 5 | Month 6 | Month 7 | Month 8 | Month 9 | Month 10 | Month 11 | Month 12 | ||
| Assets | Starting Balances | ||||||||||||
| Current Assets | |||||||||||||
| Cash | $162,200 | $142,992 | $126,568 | $105,935 | $97,410 | $88,546 | $82,200 | $81,765 | $84,182 | $94,336 | $105,812 | $126,154 | $135,214 |
| Accounts Receivable | $0 | $0 | $11,250 | $21,375 | $23,650 | $31,050 | $39,150 | $51,775 | $67,975 | $80,475 | $72,800 | $58,225 | $56,800 |
| Other Current Assets | $0 | $0 | $0 | $0 | $0 | $0 | $0 | $0 | $0 | $0 | $0 | $0 | $0 |
| Total Current Assets | $162,200 | $142,992 | $137,818 | $127,310 | $121,060 | $119,596 | $121,350 | $133,540 | $152,157 | $174,811 | $178,612 | $184,379 | $192,014 |
| Long-term Assets | |||||||||||||
| Long-term Assets | $100,000 | $100,000 | $100,000 | $100,000 | $100,000 | $100,000 | $100,000 | $100,000 | $100,000 | $100,000 | $100,000 | $100,000 | $100,000 |
| Accumulated Depreciation | $0 | $240 | $480 | $720 | $960 | $1,200 | $1,440 | $1,680 | $1,920 | $2,160 | $2,400 | $2,640 | $2,880 |
| Total Long-term Assets | $100,000 | $99,760 | $99,520 | $99,280 | $99,040 | $98,800 | $98,560 | $98,320 | $98,080 | $97,840 | $97,600 | $97,360 | $97,120 |
| Total Assets | $262,200 | $242,752 | $237,338 | $226,590 | $220,100 | $218,396 | $219,910 | $231,860 | $250,237 | $272,651 | $276,212 | $281,739 | $289,134 |
| Liabilities and Capital | Month 1 | Month 2 | Month 3 | Month 4 | Month 5 | Month 6 | Month 7 | Month 8 | Month 9 | Month 10 | Month 11 | Month 12 | |
| Current Liabilities | |||||||||||||
| Accounts Payable | $0 | $816 | $5,160 | $4,863 | $6,016 | $7,750 | $9,193 | $12,666 | $15,560 | $17,583 | $12,646 | $11,770 | $12,053 |
| Current Borrowing | $0 | $0 | $0 | $0 | $0 | $0 | $0 | $0 | $0 | $0 | $0 | $0 | $0 |
| Other Current Liabilities | $0 | $0 | $0 | $0 | $0 | $0 | $0 | $0 | $0 | $0 | $0 | $0 | $0 |
| Subtotal Current Liabilities | $0 | $816 | $5,160 | $4,863 | $6,016 | $7,750 | $9,193 | $12,666 | $15,560 | $17,583 | $12,646 | $11,770 | $12,053 |
| Long-term Liabilities | $100,000 | $98,820 | $97,640 | $96,460 | $95,280 | $94,100 | $92,920 | $91,740 | $90,560 | $89,380 | $88,200 | $87,020 | $85,840 |
| Total Liabilities | $100,000 | $99,636 | $102,800 | $101,323 | $101,296 | $101,850 | $102,113 | $104,406 | $106,120 | $106,963 | $100,846 | $98,790 | $97,893 |
| Paid-in Capital | $250,000 | $250,000 | $250,000 | $250,000 | $250,000 | $250,000 | $250,000 | $250,000 | $250,000 | $250,000 | $250,000 | $250,000 | $250,000 |
| Retained Earnings | ($87,800) | ($87,800) | ($87,800) | ($87,800) | ($87,800) | ($87,800) | ($87,800) | ($87,800) | ($87,800) | ($87,800) | ($87,800) | ($87,800) | ($87,800) |
| Earnings | $0 | ($19,084) | ($27,662) | ($36,933) | ($43,397) | ($45,653) | ($44,403) | ($34,747) | ($18,083) | $3,488 | $13,165 | $20,750 | $29,041 |
| Total Capital | $162,200 | $143,116 | $134,538 | $125,267 | $118,804 | $116,547 | $117,797 | $127,453 | $144,117 | $165,688 | $175,365 | $182,950 | $191,241 |
| Total Liabilities and Capital | $262,200 | $242,752 | $237,338 | $226,590 | $220,100 | $218,396 | $219,910 | $231,860 | $250,237 | $272,651 | $276,212 | $281,739 | $289,134 |
| Net Worth | $162,200 | $143,116 | $134,538 | $125,267 | $118,803 | $116,547 | $117,797 | $127,453 | $144,117 | $165,688 | $175,365 | $182,950 | $191,241 |


