
U&Me Dance
Executive Summary
Dancing is a historical tradition. Ballroom dancing has been alive at social functions for centuries, and Swing and Latin are the Waltz and Foxtrot of days gone by. In recent years, social dance has proved it’s long lasting presence in our lives. It is in our media, our music and day to day social functions. It isn’t usually taught parent-to-child so people are seeking schools where they can learn. With Dancesport being considered as a medal sport in the next Olympics, more people will be exposed to Social and Ballroom dance.
U&ME Dance is dedicated to bringing quality and affordable dance instruction to Bellingham. There is a very active and dedicated ballroom dance community already located in Bellingham. However, there has never been an actual dance studio, where these people can expand their knowledge of dance and enjoy being with other people of like interests. It is our plan to incorporate the existing dance community into our studio to begin with a strong base of supporters. From there we will be able to spread the word that dancing is a fun and exciting way to spend time. There are many benefits to dancing that will attract people from many backgrounds and interests.
Toni Simler and Mary Evans, a mother/daughter team, are the founders and owners of U&ME Dance. They have both been very involved in ballroom and social dancing since 1995. Mary has worked in dance studios in the Seattle area, where she was a dance instructor and supervisor. In the last three years, she taught private dance instruction as an independent contractor. Toni recently retired from Lucent Technologies, where she worked for thirty years as a manager in customer service, business management and contract management. She and her husband have been students of dance, taking lessons for many years. They continue to dance socially. Together, Toni and Mary will provide a strong team to make U&ME Dance a successful venture.

1.1 Objectives
The following are goals and objectives of U&ME Dance for Year 1 through Year 3 :
- Create a dance studio with a warm, supportive atmosphere, which is based on satisfying customers.
- Provide a social and entertainment forum for people with diverse interests, backgrounds and ages.
- Provide dance training for students at all levels of dance, from beginner to advanced.
- Provide continual training, benefits and incentives for staff to encourage a long-term commitment of employees.
- Increase sales to reach $300K by end of Year 1 and maintain an annual growth of 15% per year.
1.2 Mission
U&ME Dance offers a place where people can learn to dance, meet new people, have fun and feel comfortable. We offer a varied dance program with price options for all levels of interest, with greater emphasis on group classes and small package sessions to reach dance skill objectives. Our instructors have access to continual training with some of the area’s top professional coaches. This provides our students with up-to-date steps and technique and access to the latest dance trends. U&ME Dance welcomes a diversity of people and maintains a non-smoking and alcohol free environment.
Company Summary
U&ME Dance, soon to be located in Bellingham, Washington, will provide the community with a comfortable, friendly environment in which to learn the art of partnership dancing. U&ME Dance will offer private dance instruction, group classes, social dance parties and rental facilities for local events.
Ballroom dance, as a sport, as well as an art, has become increasingly popular worldwide. As a result, the studio can expect to attract a wide cross section of customers from Bellingham and Whatcom County. U&Me Dance will appeal to people of all ages, abilities and backgrounds, looking for creative self expression, exercise and/or social opportunities through dance.
2.1 Start-up Summary
U&ME Dance’s start-up costs are based on an assumption that it will lease space at the Majestic. This space is ready for occupancy but will need a few minor renovations. The renovations include building out an office on the main floor and a caterer kitchen.
The other category includes items such as memberships to the Chamber of Commerce, Visitor and Convention Bureau, and anything else that we may have forgotten or underestimated.
The current assets include the deposit of $12,000. Long-term assets include items which will need to be purchased for the business. See the attached table for more details.
We are not currently requesting a loan, but may need to for operating costs if the sales forecast is less that anticipated. The owners are investing $50,000 initially.

| Start-up | |
| Requirements | |
| Start-up Expenses | |
| Legal | $1,000 |
| Accountant | $300 |
| Office Supplies, Stationary | $500 |
| Brochures | $250 |
| Grand Opening | $5,000 |
| Signage | $500 |
| Other | $2,000 |
| Total Start-up Expenses | $9,550 |
| Start-up Assets | |
| Cash Required | $10,750 |
| Other Current Assets | $12,000 |
| Long-term Assets | $17,700 |
| Total Assets | $40,450 |
| Total Requirements | $50,000 |
| Start-up Funding | |
| Start-up Expenses to Fund | $9,550 |
| Start-up Assets to Fund | $40,450 |
| Total Funding Required | $50,000 |
| Assets | |
| Non-cash Assets from Start-up | $29,700 |
| Cash Requirements from Start-up | $10,750 |
| Additional Cash Raised | $0 |
| Cash Balance on Starting Date | $10,750 |
| Total Assets | $40,450 |
| Liabilities and Capital | |
| Liabilities | |
| Current Borrowing | $0 |
| Long-term Liabilities | $0 |
| Accounts Payable (Outstanding Bills) | $0 |
| Other Current Liabilities (interest-free) | $0 |
| Total Liabilities | $0 |
| Capital | |
| Planned Investment | |
| Owner Loan/Investment | $50,000 |
| Other | $0 |
| Additional Investment Requirement | $0 |
| Total Planned Investment | $50,000 |
| Loss at Start-up (Start-up Expenses) | ($9,550) |
| Total Capital | $40,450 |
| Total Capital and Liabilities | $40,450 |
| Total Funding | $50,000 |
2.2 Company Ownership
U&ME Dance is a Limited Liability Company owned and operated by Mary Evans and Toni Simler.
Services
U&ME Dance is dedicated to bringing the fun and challenge of dancing to Bellingham and Whatcom County at an affordable cost. We will offer private and group dance instruction for social through competitive level dancers. U&ME Dance will also provide a place for dancers to use the skills they have learned, by having weekly dance parties and seasonal/holiday dances.
U&ME Dance will offer its students a variety of instructional choices. By offering them several options, we can best serve their individual needs and financial limitations.
Private Lessons offer students the best value for their investment. With a private lesson, the students will work one-on-one with an instructor, receiving personalized instruction and immediate correction. Through experiencing the physical sensation of connected movement, the student is able to confidently replicate that movement in order to provide a pleasant and comfortable experience to other partners. In learning the best methods, one-on-one, both beginning and advanced students will find they progress faster and more easily, as they enjoy the sensation of partner dancing.
Group Classes are both an introduction to the experience of dancing with different partners, and a chance for the students to become familiar with a variety of step patterns. Rotation of partners, throughout the class allows dancers to practice steps with different partners. This format promotes comfort in dancing with several partners, as well as the comraderie that goes along with sharing a learned experience. Group lessons will be available every week in the traditional styles and latest club trends. Classes will be offered at every level, from basic beginner through advanced competitive styling. In addition, specialty classes will be offered for children and teens.
Practice Dances will be held once a week to allow students an opportunity to practice the dances learned, in an environment with other students learning the same thing. Instructors will circulate on the dance floor, assisting with questions or demonstration of steps, as well as to dance with students.

Facility Rental will be another service offering. The Majestic is currently a very popular place in Bellingham for weddings, receptions, musical events, etc. We hope to expand the use of the building by including additional options of use (church services on Sunday, exercise/yoga classes in the morning).
In addition to these main staples, U&ME Dance will go out into the community to offer specialty dancing to schools, nursing homes and anyone wanting a specialized program. U&ME Dance is very closely linked to the dance studios in the Seattle area and as such, can offer exchange programs, which will give our students additional opportunities.
Market Analysis Summary
Ballroom Dancing is a multi-billion dollar industry that will only continue to grow, especially now that the International Olympic Committee (IOC) has awarded provisional recognition to Ballroom Dancing and Dancesport. According to a recent press release by WGBH-Television, more than one million people enroll in ballroom dance classes each year. Since 1985, the number of amateur ballroom dancers has increased by 25% each year.
The timeless popularity of social dancing, combined with the growing interest in the trendy dances, has proven to be a winning combination around the world. We are confident it will produce the same results in Bellingham.
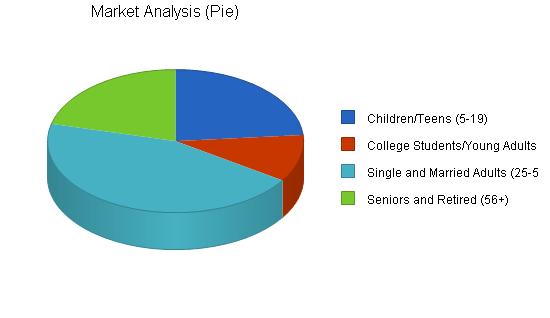
4.1 Market Segmentation
According to the information published by the Bellingham/Whatcom Chamber of Commerce, Whatcom County had a total population of 166,814 for the year 2000 and is estimated to grow approximately 5% per year to 212,000 by the year 2010. The city of Bellingham had a total population of 68,890 in the year 2001. This figure has grown 30%, since 1990. Bellingham is surrounded by the smaller towns of Ferndale, Blaine, Lynden, Sumas, Everson, and Nooksak.
U&ME Dance feels that the population of Bellingham, as well as these smaller towns, are all potential customers. We have divided these potential customers into the following groups:
- Children/Teens (19 yrs. and under): There are 36,965 children and teens in Whatcom County, according to the 2000 census information. Our plan is to have special classes designed specifically for the younger people.
- College Students/Young Adults (20-24 yrs): There are 16,776 people who fall in this category, according to the Whatcom County 2000 census information.
- Single and Married Adults (25-55 yrs): This will include single and married couples. The Whatcom County 2000 census information showed there were 69,865 people in this age group.
- Seniors/Retired (56+ yrs): The people in this group will be a combination of retired and working people. The Whatcom County 2000 census information showed 32,998 people in this age group.
| Market Analysis | |||||||
| Year 1 | Year 2 | Year 3 | Year 4 | Year 5 | |||
| Potential Customers | Growth | CAGR | |||||
| Children/Teens (5-19) | 5% | 36,965 | 38,813 | 40,754 | 42,792 | 44,932 | 5.00% |
| College Students/Young Adults (20-24) | 5% | 16,776 | 17,615 | 18,496 | 19,421 | 20,392 | 5.00% |
| Single and Married Adults (25-55) | 5% | 69,865 | 73,358 | 77,026 | 80,877 | 84,921 | 5.00% |
| Seniors and Retired (56+) | 5% | 32,998 | 34,648 | 36,380 | 38,199 | 40,109 | 5.00% |
| Total | 5.00% | 156,604 | 164,434 | 172,656 | 181,289 | 190,354 | 5.00% |
4.2 Target Market Segment Strategy
As indicated in the previous table and illustration, our market is limitless. Everyone who has the ability to walk can learn to dance. It is our job to present dance to these people and introduce and develop interest in the community for ballroom and social dance.
For children and teens it is important to show the fun in dance. We can introduce Ballroom Dance through Junior and Senior High School dance and drill teams. The United States Amateur Ballroom Dance Association (USABDA) has made generous efforts across the country to develop dance in younger generations. There is a USABDA chapter in Bellingham, which will assist in getting dance introduced to this age group. We will also look to affiliate our studio with the local Jazz and Ballet studios for mutual advertising benefits.
Colleges across the country have been adding Ballroom dance classes to their curriculum and have been closely involved in Dancesport competitions whose sell-out crowds rival those of football and basketball games. Western Washington University does not currently have a Ballroom Dance curriculum, however, there is a swing club, Western Washington University Swing Kids. We would like to start by including the swing kids in our studio events and assisting their efforts to spread the popularity of swing. We hope to work with the University to offer classes to their students for credit.
Single and married adults between the ages of 25 and 55 have traditionally been the biggest supporters of the ballroom dance studio community. This group is generally looking for new things to try and do. For singles we offer another way to meet people, and date. We will also have special wedding packages, which offer the new couple options for learning their first dance. For married couples dance is something new to learn together and provides a great social outlet. By working with the local clubs, we can be sure there are places for people to use the dance they are learning and in turn spread dance further into the community.
Retired people and seniors (ages 55 and up) represent a small section of our market. However these people usually turn into long-term dancers. Dance is a wonderful hobby, and low impact exercise that benefits the mind, the body, and social aspects of life. For this age group learning to dance is done for reasons such as something they have always wanted to do, something they used to do and would like to do again, for use on vacations, or an exercise to keep their bodies healthy. We plan to offer our services to local nursing homes, as well as to those who come in to the studio for lessons.
4.3 Service Business Analysis
The ballroom dance industry has experienced substantial growth at the rate of 25% each year since 1985. There are two key factors for the rise in demand for dance instruction and places to partnership dance:
- In order to gain recognition by the IOC as a sport, the International DanceSport Federation (IDSF) signed an 11 year agreement with a major sports promoter, International Management Group (IMG/TWI), which began in 1998. IMG/TWI are IDSF’s commercial representatives, handling all television, sponsorship, and implementing its medium and long-term marketing strategies worldwide. The industry, as a whole, has benefited directly through the increase in public interest this campaign has achieved.
- The popularity of trendy dances like Lindy Hop, Argentine Tango, and Salsa have also made an impact on the number of people wanting to learn how to dance.
The popularity of partnership dancing has grown immensely in the last decade. Those who are familiar with dance are well aware of how fun and addicting an evening of dancing can be. Those who have not yet experienced the thrill of moving gracefully around the dance floor with a partner, need a convenient, relaxed atmosphere, where they can feel comfortable learning and utilizing current popular dances. U&ME Dance seeks to provide its customers with affordable quality instruction in a fun and supportive environment.
4.3.1 Competition and Buying Patterns
There are currently no other ballroom or social dance studios in Bellingham or Whatcom County. However, there are a few independent dance teachers, who teach classes at Whatcom Community College, at local bars, or rent floor space. There is also a local group, Dance Connection, that holds dances on Friday nights at the local Eagles Hall. This group does not have a studio and its main purpose is to find places for people to dance and enjoy themselves. The founder and administrator of Dance Connection has recently moved out of town and asked U&ME Dance to take over the newsletter, and Friday night dances effective in July 2002.
This leaves the independent teachers as our only competition. U&ME Dance plans to work in concert with these instructors and will offer a place for teachers to rent space to continue teaching on their own, and a place to go out dancing. Our affordable pricing, elegant facility and quality instruction will be a much needed bonus to Bellingham.
Strategy and Implementation Summary
U&ME Dance marketing strategy will target people who wish to get more for their investment in dancing. A large variety of dance lesson packages and programs will be offered in an effort to make dancing affordable to any budget. Teachers will be highly skilled and professional, keeping with the image of the studio. The ballroom will be an elegant place to come, where customer service is number one. Marketing venues will include placement advertisement, direct mail, Internet Web page and include partnerships with community businesses.
U&ME Dance sales strategy will be based on a consultative style where the customers and teachers work together to identify and plan a course of action to satisfy the customer. Teachers will participate in continuous consultative sales training and receive regular sales coaching where the identification of customer buying criteria will be paramount. Sales closes will be based on demonstration of satisfying the customer criteria.
5.1 Competitive Edge
As previously mentioned, there is currently no other ballroom or social dance studio in Bellingham or Whatcom County. This automatically gives U&ME Dance a competitive edge on the market. However, we do not plan to sit back and think that people will come to us if we wait. Because Bellingham is not used to having a dance studio, this gives us the challenge of introducing the benefits of having a dance studio. One advantage to us, is that there is a strong dance community, including a local chapter of United States Amateur Ballroom Dance Association (USABDA) in the area.
We plan to keep our prices in line with the lower cost of living expenses of the Bellingham area. We will offer a wide variety of very competitive packages. Our teachers will be trained in the latest trends and with up-to-date styling of today’s dances. We plan to partner with many of the studios in the Seattle area so that we can keep up with the trends of the big city and offer more variety to our students.
5.2 Marketing Strategy
Our marketing plan will be very simple. Satisfy our customers and provide them with the desire to continue dancing. A happy customer will not only keep coming back, but they will tell other people about U&ME Dance. We will offer discount awards as an incentive to people who provide us with referrals.
We will market fun! What better product could we possibly have than that?! Our biggest challenge will be getting people who have never been in a dance studio before to come and try us out. Many people have never considered taking dance lessons before. Our marketing message will emphasize the opportunity to meet people, to enhance the quality of leisure time, to gain health benefits and gain life-long skills that will give them respect from their peers.
We will advertise in the yellow pages, local newspapers, flyers, coupons, discount books, radio, and signs around town.
5.3 Sales Strategy
One of our marketing strategies is to advertise discount specials or introductory offers. These are designed to introduce people to the different dances our studio offers, and the dances our customers want to learn. Our instructors will work with the customer on these specials to discover what it is they are looking for in dance, and to outline a course that suits the customer’s wants and needs. When a course outline is agreed upon by customer and instructor they will meet with a manager for a brief consultation to make sure the customer is satisfied with the lesson outline and that the course will meet the expectations of the customer. The customer will then sign up for the lessons by contract and commit to a series of appointments; the studio also commits to these appointments.
We will offer a variety of courses, all mixed with combinations of private lessons, group lessons, and practice parties. Our course outlines will follow industry standards of recognized progression in dance, referred to as program dancing. The different levels of dance are recognized as Social Foundation, Bronze, Silver, and Gold, which is consistent with the dance industry. Although our instructors will be designing course outlines according to the specific needs of our customers, there are basic packages that we can offer in these different levels. Also, because of the size and amount of time required for those levels after Social Foundation, we have divided them into Bronze I, and Bronze II, Silver I, and Silver II, and Gold or our Showcase Level.
U&ME Dance also offers the ability for customers to take group class packages. These may be more affordable, and although take longer for advancement, might be more preferable to some of our customers.
In addition U&ME Dance offers something unique from other dance studios, which is a membership card.
There are three different memberships offered:
- The Basic, which allows unlimited admission to dance parties as well as discounts to special events.
- The Gold, which allows limited access to group classes, unlimited admission to dance parties, five party guest passes, and discounts on special events.
- The Platinum, which allows unlimited access to group classes, unlimited admission to parties, ten party guest passes, and discounts to special events. These memberships will last one year.
U&ME Dance will offer discounts for larger dance packages. All payments for dance lessons will be collected at time of purchase. Customers may be given 30 days to pay with a down payment of 50%. We will accept payment in the form of cash, check, or credit card.
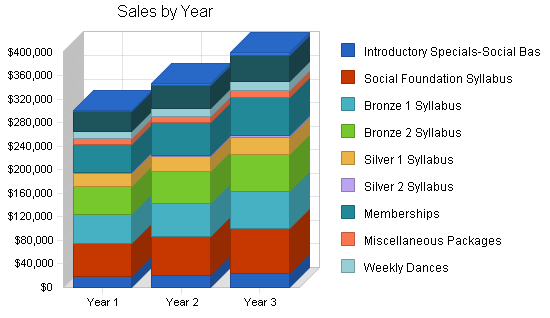
5.3.1 Sales Forecast
This sales forecast is an estimation on the number of customers we acquire while open, and an average cost of lesson outlines. The Social Basics Introductory special is averaged at $50, but this may vary depending on the special running that month. The special is not an accurate count for the cost of lessons, and is used primarily to bring people who may be interested to our studio so that they may continue with more lessons. We are forecasting that we will sell 20 Introductory packages in our first month, and 30 each month there after, as this is what we can handle with the hours we have available.
The Social Foundation average package price is $720. It is an average price based on the assumption that students would buy a package containing 12 private lessons and 12 group lessons. We offer a 20% for paying in cash, and have therefore shown $600 for our package price to show the discount. We are forecasting to sell a social foundation dance package to 25% of the people who come to take the introductory special.
Bronze I is priced at $1,200, and is based on the assumption that students would buy this package with 19 privates and 25 groups. We offer a 20% discount to people who pay cash for their lesson, and show this in our forecast by making this package show at $1,000. We are forecasting to sell a bronze dance package to 50% of the people who bought the social foundation package.
Bronze II is priced at $1,440, and based on the assumption that students would buy a package containing 24 privates and 24 groups. We offer a 20% discount for paying in cash, and show this in our forecast by showing this package price at $1,200. We do not expect to sell any Bronze II packages the first couple of months. Starting on the third month we are forecasting to sell 50% of those that were in Bronze I.
Silver I and Silver II $1,620. These are both based on the assumption that the student buys a package of 27 privates and 27 groups. We offer a 20% discount for students who pay in cash, and have shown this in our forecast with our package being $1,350. Starting in the fifth month we are forecasting to sell at least two Silver I dance package per month. We have estimated that we will not sell any Silver II packages until the end of the first year of business.
We have kept our estimates low, knowing that we are not only a new business but a new type of business in this community, trying to break through with our marketing. Therefore, we are showing a 25% closing ratio for new students. That is saying that 25% of the customers who come in for the introductory special will buy the next level of dance, Social Foundation package. We then show a 50% closing ratio for existing student, 50% of Social Foundation customers will move on to Bronze I, etc. Mary’s previous sales results were 70% (out of every ten potential customers she sold a dance package to seven).
Memberships were forecasted to show that people would buy the Gold at $600 each. We forecast to sell an average of five memberships per month, with that average increasing to 10 during the peak months of November-February.
Miscellaneous sales include series group classes and kids group classes averaged at 10 people per class.
Weekly dances will be held each Friday night. We will charge $5.00 per person plus $3.00 if they come for the pre-dance lesson.
The Majestic is currently reported as bringing in about $30 to $40K per year in space rentals. We will continue to rent out this space and increase the advertising.
Other category includes one time privates lessons, special services (i.e. DJ service, lesson packages for special events, wedding packages, etc.).

| Sales Forecast | |||
| Year 1 | Year 2 | Year 3 | |
| Sales | |||
| Introductory Specials-Social Basics | $18,000 | $20,700 | $23,805 |
| Social Foundation Syllabus | $57,600 | $66,240 | $76,176 |
| Bronze 1 Syllabus | $48,000 | $55,200 | $63,480 |
| Bronze 2 Syllabus | $48,000 | $55,200 | $63,480 |
| Silver 1 Syllabus | $21,600 | $24,840 | $28,566 |
| Silver 2 Syllabus | $2,700 | $3,105 | $3,571 |
| Memberships | $48,000 | $55,200 | $63,480 |
| Miscellaneous Packages | $9,330 | $10,730 | $12,339 |
| Weekly Dances | $12,000 | $13,800 | $15,870 |
| Space Rental | $33,860 | $38,939 | $44,780 |
| Other | $2,900 | $3,335 | $3,835 |
| Total Sales | $301,990 | $347,289 | $399,382 |
| Direct Cost of Sales | Year 1 | Year 2 | Year 3 |
| Introductory Specials-Social Basics | $0 | $0 | $0 |
| Social Foundation Syllabus | $9,792 | $11,261 | $12,950 |
| Bronze 1 Syllabus | $8,160 | $9,384 | $10,792 |
| Bronze 2 Syllabus | $8,160 | $9,384 | $10,792 |
| Silver 1 Syllabus | $3,672 | $4,223 | $4,856 |
| Silver 2 Syllabus | $460 | $528 | $607 |
| Memberships | $0 | $0 | $0 |
| Miscellaneous Packages | $0 | $0 | $0 |
| Weekly Dances | $0 | $0 | $0 |
| Space Rental | $0 | $0 | $0 |
| Other | $0 | $0 | $0 |
| Subtotal Direct Cost of Sales | $30,244 | $34,780 | $39,997 |
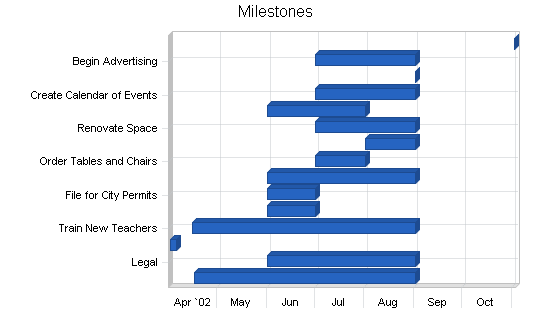
5.4 Milestones
The following milestones reflect an approximate timeframe and cost for beginning and completing actions that will be needed to get U&ME Dance up and running. Our goal is to open our doors to customers and begin teaching dance by September 1st, 2002. We realize this date is subject to the timeframe for renovation completion, permits, etc. and may need to be adjusted.
| Milestones | |||||
| Milestone | Start Date | End Date | Budget | Manager | Department |
| Meet with SBDC | 4/16/2002 | 9/1/2002 | $0 | Both | Marketing |
| Legal | 6/1/2002 | 9/1/2002 | $750 | Both | Marketing |
| Develop Web Site | 4/1/2002 | 4/5/2002 | $90 | Mary Evans | Marketing |
| Train New Teachers | 4/15/2002 | 9/1/2002 | $0 | Mary Evans | Marketing |
| File for State Business License | 6/1/2002 | 7/1/2002 | $0 | Toni Simler | Marketing |
| File for City Permits | 6/1/2002 | 7/1/2002 | $0 | Toni Simler | Marketing |
| Negotiate Lease | 6/1/2002 | 9/1/2002 | $0 | Both | Marketing |
| Order Tables and Chairs | 7/1/2002 | 8/1/2002 | $3,750 | Both | Web |
| Purchase Sound System | 8/1/2002 | 9/1/2002 | $2,000 | Both | Web |
| Renovate Space | 7/1/2002 | 9/1/2002 | $0 | Both | Department |
| Acquire Insurance | 6/1/2002 | 8/1/2002 | $2,000 | Toni Simler | Department |
| Create Calendar of Events | 7/1/2002 | 9/1/2002 | $100 | Mary Evans | Department |
| Open Doors for Business | 9/1/2002 | 9/1/2002 | $0 | Both | Department |
| Begin Advertising | 7/1/2002 | 9/1/2002 | $2,000 | Toni Simler | Department |
| Grand Opening | 11/2/2002 | 11/2/2002 | $3,000 | Both | Department |
| Totals | $13,690 | ||||
Web Plan Summary
U&ME Dance has a Web page, www.uandmedance.com, that is designed to provide a convenient way for people to discover our studio. For marketing purposes the Web page will be linked to other dance Web sites and, since it has dance in the title, it will show up on different search engines. Our students will be able to use the Web site to look up group class schedules, upcoming events, studio news, and lesson prices. Students and prospective students will also be able to contact teachers via e-mail. Teachers will have the Web site on their business cards, and it will appear on our ads to offer people a chance to look at the space, meet the teachers and check prices, and ask questions before they enter the studio.
6.1 Website Marketing Strategy
We plan to link our Web site with some prominent Seattle area dance Web sites as well as the city Web sites, and local recreational sites. We will also link with some national Web sites in order to increase the possibility of people reaching us on the Web. By having the word dance in our title we should show up easily on different search engines, which will increase our potential to be seen by our own market.
Our Web site has been designed to offer looks into our prices, lesson outlines and definitions, our staff and pictures of the studio. We will provide pages that explore upcoming events at the studio as well as community dance events. We will keep people posted on the national news of dance as well as local. We will always have a current calendar of events for the convenience of our students. We will also have a showboard to show off different pictures of events from our studio.
U&ME Dance will also have a link page for other studios in Washington and national, places to dance, and national dance organizations.
6.2 Development Requirements
We have created and maintained our Web page ourselves. We will continue to do so in the future.
Management Summary
U&ME Dance will be a very small company with the two owners, Mary Evans and Toni Simler, responsible for managing and directing all activities.
Mary Evans, owner and dance director, will primarily be responsible for the following:
- Teaching advanced students.
- Hiring, training and supervision of new instructors.
- Scheduling and planning the dance group lessons and special events.
- Creating dance lesson programs and packages.
- Studio events.
Mary Evans brings with her seven years of experience as a dance instructor, as well as certification as a dance instructor from the National Dance Teachers Council of America (NDTCA). She has knowledge of the operation of dance studios from her training with previous studio managers, and experience of management herself. She also brings with her, knowledge of the dance industry, the champions, the styles, and experience with previous students. Her six years of teaching have brought her many connections that can benefit U&ME Dance.
Toni Simler, Owner and Business Director, will primarily be responsible for the following:
- Teach social foundation/bronze students
- Managing the accounting/financial aspect of the company
- Bookkeeping/payroll
- Design and develop advertising and marketing strategies
- Contract negotiation/vendor relations
Toni brings thirty years of working in corporate business, where she was most recently a business manager, contract manager and call center manager for Lucent Technologies and AT&T. Most of her career in telecommunications centered around customer service. She will be able to put this knowledge and experience to good use at U&ME Dance. In addition, Toni with her husband have been dance students since 1995. She knows firsthand how it feels to be a student and brings with her the knowledge she learned while taking dance lessons for five years.
7.1 Personnel Plan
A teacher training class began in April to train two teachers. These teachers will be given the training for free with an understanding that they are neither hired nor paid during this time. In exchange for this training, they will be offered a job, once U&ME Dance gets enough customers. Our goal is to have five part time/full time instructors by the end of 2002, which includes the two owners.
At some point in the future, we will see about hiring a receptionist.
| Personnel Plan | |||
| Year 1 | Year 2 | Year 3 | |
| Owners Salary/Distribution | $65,000 | $72,000 | $84,000 |
| Instructors Compensation | $33,150 | $40,000 | $40,000 |
| Other | $0 | $0 | $0 |
| Total People | 5 | 5 | 5 |
| Total Payroll | $98,150 | $112,000 | $124,000 |
Financial Plan
- We plan to use our own start-up cash to finance the business. The Majestic is a turn key building for this type of business, requiring very limited contract work for us to bring in. A kitchen space and office window are to be negotiated with the building owner. Our start-up requirements are business assets, teaching supplies, and advertising.
- We want to finance growth mainly through cash flow.
8.1 Important Assumptions
The financial plan depends on important assumptions, most of which are shown in the following table as annual assumptions. The monthly assumptions are included in the appendix. From the beginning, we recognize that collection of payments for dance lesson packages is critical, however, not a factor we can influence easily. Interest rates, tax rates, and personnel burden are based on conservative assumptions.
Three of the more important underlying assumptions are:
- We assume that people in Whatcom County and more importantly, Bellingham, will be interested in learning to dance and will give us a try.
- We assume that the area will continue to grow, as in the past, and at the projected rate of 5% per year.
- We assume that the Majestic will continue to be rented for events as in the past.
| General Assumptions | |||
| Year 1 | Year 2 | Year 3 | |
| Plan Month | 1 | 2 | 3 |
| Current Interest Rate | 10.00% | 10.00% | 10.00% |
| Long-term Interest Rate | 10.00% | 10.00% | 10.00% |
| Tax Rate | 30.00% | 30.00% | 30.00% |
| Other | 0 | 0 | 0 |
8.2 Break-even Analysis
We will need an average of thirty new students each month taking the introductory classes. Of these thirty students, we are anticipating that 25% will stay to take additional classes (i.e. Social Foundation, Bronze, etc.). We realize that we may have a slow start, until the word gets out about our business, and therefore, will take a few months to “ramp up” to thirty new students.

| Break-even Analysis | |
| Monthly Revenue Break-even | $22,393 |
| Assumptions: | |
| Average Percent Variable Cost | 10% |
| Estimated Monthly Fixed Cost | $20,150 |
8.3 Projected Profit and Loss
Our projected profit and loss is shown on the following table, with sales increasing at a rate of 15% year over year. If we are able to meet our sales forecast, we will begin making a profit almost immediately. Traditionally in the dance business the slower months are in the mid-summer. However, the facility rental is higher in the Summer and should, therefore, supplement the slower teaching months.
The detailed monthly projections are included in the appendix.


| Pro Forma Profit and Loss | |||
| Year 1 | Year 2 | Year 3 | |
| Sales | $301,990 | $347,289 | $399,382 |
| Direct Cost of Sales | $30,244 | $34,780 | $39,997 |
| Other Production Expenses | $0 | $0 | $0 |
| Total Cost of Sales | $30,244 | $34,780 | $39,997 |
| Gross Margin | $271,746 | $312,509 | $359,385 |
| Gross Margin % | 89.99% | 89.99% | 89.99% |
| Expenses | |||
| Payroll | $98,150 | $112,000 | $124,000 |
| Sales and Marketing and Other Expenses | $45,100 | $45,800 | $52,500 |
| Depreciation | $3,540 | $3,540 | $3,540 |
| Utilities | $9,000 | $10,000 | $11,000 |
| Telephone | $2,400 | $2,400 | $2,400 |
| Insurance | $1,800 | $1,800 | $1,800 |
| Rent | $72,000 | $72,000 | $74,712 |
| Payroll Taxes | $9,815 | $11,200 | $12,400 |
| Other | $0 | $0 | $0 |
| Total Operating Expenses | $241,805 | $258,740 | $282,352 |
| Profit Before Interest and Taxes | $29,941 | $53,769 | $77,033 |
| EBITDA | $33,481 | $57,309 | $80,573 |
| Interest Expense | ($550) | ($1,700) | ($2,900) |
| Taxes Incurred | $9,147 | $16,641 | $23,980 |
| Net Profit | $21,344 | $38,828 | $55,953 |
| Net Profit/Sales | 7.07% | 11.18% | 14.01% |
8.4 Projected Cash Flow
Cash flow projections are critical to our success. The annual cash flow figures are included here and the more important detailed monthly numbers are included in the appendix. The business will generate more than enough cash flow to cover all of its expenses. The monthly cash flow is shown in the following chart, with one bar representing the cash flow per month, and the other the monthly cash balance.

| Pro Forma Cash Flow | |||
| Year 1 | Year 2 | Year 3 | |
| Cash Received | |||
| Cash from Operations | |||
| Cash Sales | $301,990 | $347,289 | $399,382 |
| Subtotal Cash from Operations | $301,990 | $347,289 | $399,382 |
| Additional Cash Received | |||
| Sales Tax, VAT, HST/GST Received | $0 | $0 | $0 |
| New Current Borrowing | $0 | $0 | $0 |
| New Other Liabilities (interest-free) | $0 | $0 | $0 |
| New Long-term Liabilities | $0 | $0 | $0 |
| Sales of Other Current Assets | $0 | $0 | $0 |
| Sales of Long-term Assets | $0 | $0 | $0 |
| New Investment Received | $0 | $0 | $0 |
| Subtotal Cash Received | $301,990 | $347,289 | $399,382 |
| Expenditures | Year 1 | Year 2 | Year 3 |
| Expenditures from Operations | |||
| Cash Spending | $98,150 | $112,000 | $124,000 |
| Bill Payments | $163,661 | $192,360 | $214,001 |
| Subtotal Spent on Operations | $261,811 | $304,360 | $338,001 |
| Additional Cash Spent | |||
| Sales Tax, VAT, HST/GST Paid Out | $0 | $0 | $0 |
| Principal Repayment of Current Borrowing | $0 | $0 | $0 |
| Other Liabilities Principal Repayment | $0 | $0 | $0 |
| Long-term Liabilities Principal Repayment | $11,000 | $12,000 | $12,000 |
| Purchase Other Current Assets | $0 | $0 | $0 |
| Purchase Long-term Assets | $0 | $0 | $0 |
| Dividends | $0 | $0 | $0 |
| Subtotal Cash Spent | $272,811 | $316,360 | $350,001 |
| Net Cash Flow | $29,179 | $30,929 | $49,381 |
| Cash Balance | $39,929 | $70,858 | $120,239 |
8.5 Projected Balance Sheet
The balance sheet in the following table shows managed but sufficient growth of net worth, and a sufficiently healthy financial position. The monthly estimates are included in the appendix.
| Pro Forma Balance Sheet | |||
| Year 1 | Year 2 | Year 3 | |
| Assets | |||
| Current Assets | |||
| Cash | $39,929 | $70,858 | $120,239 |
| Other Current Assets | $12,000 | $12,000 | $12,000 |
| Total Current Assets | $51,929 | $82,858 | $132,239 |
| Long-term Assets | |||
| Long-term Assets | $17,700 | $17,700 | $17,700 |
| Accumulated Depreciation | $3,540 | $7,080 | $10,620 |
| Total Long-term Assets | $14,160 | $10,620 | $7,080 |
| Total Assets | $66,089 | $93,478 | $139,319 |
| Liabilities and Capital | Year 1 | Year 2 | Year 3 |
| Current Liabilities | |||
| Accounts Payable | $15,296 | $15,856 | $17,744 |
| Current Borrowing | $0 | $0 | $0 |
| Other Current Liabilities | $0 | $0 | $0 |
| Subtotal Current Liabilities | $15,296 | $15,856 | $17,744 |
| Long-term Liabilities | ($11,000) | ($23,000) | ($35,000) |
| Total Liabilities | $4,296 | ($7,144) | ($17,256) |
| Paid-in Capital | $50,000 | $50,000 | $50,000 |
| Retained Earnings | ($9,550) | $11,794 | $50,622 |
| Earnings | $21,344 | $38,828 | $55,953 |
| Total Capital | $61,794 | $100,622 | $156,575 |
| Total Liabilities and Capital | $66,089 | $93,478 | $139,319 |
| Net Worth | $61,794 | $100,622 | $156,575 |
8.6 Business Ratios
The following table outlines some of the more important ratios from the Fine Art Schools industry. The final column, Industry Profile, details specific ratios based on the industry as it is classified by the Standard Industry Classification (SIC) code, 7911.
| Ratio Analysis | ||||
| Year 1 | Year 2 | Year 3 | Industry Profile | |
| Sales Growth | 0.00% | 15.00% | 15.00% | 16.60% |
| Percent of Total Assets | ||||
| Other Current Assets | 18.16% | 12.84% | 8.61% | 33.90% |
| Total Current Assets | 78.57% | 88.64% | 94.92% | 43.80% |
| Long-term Assets | 21.43% | 11.36% | 5.08% | 56.20% |
| Total Assets | 100.00% | 100.00% | 100.00% | 100.00% |
| Current Liabilities | 23.14% | 16.96% | 12.74% | 36.40% |
| Long-term Liabilities | -16.64% | -24.60% | -25.12% | 22.60% |
| Total Liabilities | 6.50% | -7.64% | -12.39% | 59.00% |
| Net Worth | 93.50% | 107.64% | 112.39% | 41.00% |
| Percent of Sales | ||||
| Sales | 100.00% | 100.00% | 100.00% | 100.00% |
| Gross Margin | 89.99% | 89.99% | 89.99% | 0.00% |
| Selling, General & Administrative Expenses | 82.92% | 78.80% | 75.98% | 70.60% |
| Advertising Expenses | 7.95% | 6.91% | 7.51% | 3.60% |
| Profit Before Interest and Taxes | 9.91% | 15.48% | 19.29% | 3.90% |
| Main Ratios | ||||
| Current | 3.40 | 5.23 | 7.45 | 1.40 |
| Quick | 3.40 | 5.23 | 7.45 | 1.01 |
| Total Debt to Total Assets | 6.50% | -7.64% | -12.39% | 59.00% |
| Pre-tax Return on Net Worth | 49.34% | 55.13% | 51.05% | 3.70% |
| Pre-tax Return on Assets | 46.14% | 59.34% | 57.37% | 8.90% |
| Additional Ratios | Year 1 | Year 2 | Year 3 | |
| Net Profit Margin | 7.07% | 11.18% | 14.01% | n.a |
| Return on Equity | 34.54% | 38.59% | 35.74% | n.a |
| Activity Ratios | ||||
| Accounts Payable Turnover | 11.70 | 12.17 | 12.17 | n.a |
| Payment Days | 27 | 29 | 28 | n.a |
| Total Asset Turnover | 4.57 | 3.72 | 2.87 | n.a |
| Debt Ratios | ||||
| Debt to Net Worth | 0.07 | -0.07 | -0.11 | n.a |
| Current Liab. to Liab. | 3.56 | 0.00 | 0.00 | n.a |
| Liquidity Ratios | ||||
| Net Working Capital | $36,634 | $67,002 | $114,495 | n.a |
| Interest Coverage | 0.00 | 0.00 | 0.00 | n.a |
| Additional Ratios | ||||
| Assets to Sales | 0.22 | 0.27 | 0.35 | n.a |
| Current Debt/Total Assets | 23% | 17% | 13% | n.a |
| Acid Test | 3.40 | 5.23 | 7.45 | n.a |
| Sales/Net Worth | 4.89 | 3.45 | 2.55 | n.a |
| Dividend Payout | 0.00 | 0.00 | 0.00 | n.a |
Appendix
| Personnel Plan | |||||||||||||
| Month 1 | Month 2 | Month 3 | Month 4 | Month 5 | Month 6 | Month 7 | Month 8 | Month 9 | Month 10 | Month 11 | Month 12 | ||
| Owners Salary/Distribution | 0% | $2,000 | $3,000 | $6,000 | $6,000 | $6,000 | $6,000 | $6,000 | $6,000 | $6,000 | $6,000 | $6,000 | $6,000 |
| Instructors Compensation | 0% | $1,250 | $1,250 | $1,250 | $2,500 | $2,500 | $2,800 | $2,800 | $2,800 | $4,000 | $4,000 | $4,000 | $4,000 |
| Other | 0% | $0 | $0 | $0 | $0 | $0 | $0 | $0 | $0 | $0 | $0 | $0 | $0 |
| Total People | 5 | 5 | 5 | 5 | 5 | 5 | 5 | 5 | 5 | 5 | 5 | 5 | |
| Total Payroll | $3,250 | $4,250 | $7,250 | $8,500 | $8,500 | $8,800 | $8,800 | $8,800 | $10,000 | $10,000 | $10,000 | $10,000 | |
| General Assumptions | |||||||||||||
| Month 1 | Month 2 | Month 3 | Month 4 | Month 5 | Month 6 | Month 7 | Month 8 | Month 9 | Month 10 | Month 11 | Month 12 | ||
| Plan Month | 1 | 2 | 3 | 4 | 5 | 6 | 7 | 8 | 9 | 10 | 11 | 12 | |
| Current Interest Rate | 10.00% | 10.00% | 10.00% | 10.00% | 10.00% | 10.00% | 10.00% | 10.00% | 10.00% | 10.00% | 10.00% | 10.00% | |
| Long-term Interest Rate | 10.00% | 10.00% | 10.00% | 10.00% | 10.00% | 10.00% | 10.00% | 10.00% | 10.00% | 10.00% | 10.00% | 10.00% | |
| Tax Rate | 30.00% | 30.00% | 30.00% | 30.00% | 30.00% | 30.00% | 30.00% | 30.00% | 30.00% | 30.00% | 30.00% | 30.00% | |
| Other | 0 | 0 | 0 | 0 | 0 | 0 | 0 | 0 | 0 | 0 | 0 | 0 | |
| Pro Forma Profit and Loss | |||||||||||||
| Month 1 | Month 2 | Month 3 | Month 4 | Month 5 | Month 6 | Month 7 | Month 8 | Month 9 | Month 10 | Month 11 | Month 12 | ||
| Sales | $15,600 | $17,100 | $23,740 | $25,950 | $27,000 | $28,200 | $26,500 | $26,100 | $28,100 | $26,800 | $27,950 | $28,950 | |
| Direct Cost of Sales | $1,496 | $1,496 | $2,312 | $2,312 | $2,771 | $2,771 | $2,771 | $2,771 | $2,771 | $2,771 | $3,001 | $3,001 | |
| Other Production Expenses | $0 | $0 | $0 | $0 | $0 | $0 | $0 | $0 | $0 | $0 | $0 | $0 | |
| Total Cost of Sales | $1,496 | $1,496 | $2,312 | $2,312 | $2,771 | $2,771 | $2,771 | $2,771 | $2,771 | $2,771 | $3,001 | $3,001 | |
| Gross Margin | $14,104 | $15,604 | $21,428 | $23,638 | $24,229 | $25,429 | $23,729 | $23,329 | $25,329 | $24,029 | $24,949 | $25,949 | |
| Gross Margin % | 90.41% | 91.25% | 90.26% | 91.09% | 89.74% | 90.17% | 89.54% | 89.38% | 90.14% | 89.66% | 89.26% | 89.63% | |
| Expenses | |||||||||||||
| Payroll | $3,250 | $4,250 | $7,250 | $8,500 | $8,500 | $8,800 | $8,800 | $8,800 | $10,000 | $10,000 | $10,000 | $10,000 | |
| Sales and Marketing and Other Expenses | $3,500 | $3,600 | $3,600 | $5,600 | $3,600 | $3,600 | $3,600 | $3,600 | $3,600 | $3,600 | $3,600 | $3,600 | |
| Depreciation | $295 | $295 | $295 | $295 | $295 | $295 | $295 | $295 | $295 | $295 | $295 | $295 | |
| Utilities | $750 | $750 | $750 | $750 | $750 | $750 | $750 | $750 | $750 | $750 | $750 | $750 | |
| Telephone | $200 | $200 | $200 | $200 | $200 | $200 | $200 | $200 | $200 | $200 | $200 | $200 | |
| Insurance | $150 | $150 | $150 | $150 | $150 | $150 | $150 | $150 | $150 | $150 | $150 | $150 | |
| Rent | $6,000 | $6,000 | $6,000 | $6,000 | $6,000 | $6,000 | $6,000 | $6,000 | $6,000 | $6,000 | $6,000 | $6,000 | |
| Payroll Taxes | 10% | $325 | $425 | $725 | $850 | $850 | $880 | $880 | $880 | $1,000 | $1,000 | $1,000 | $1,000 |
| Other | $0 | $0 | $0 | $0 | $0 | $0 | $0 | $0 | $0 | $0 | $0 | $0 | |
| Total Operating Expenses | $14,470 | $15,670 | $18,970 | $22,345 | $20,345 | $20,675 | $20,675 | $20,675 | $21,995 | $21,995 | $21,995 | $21,995 | |
| Profit Before Interest and Taxes | ($366) | ($66) | $2,458 | $1,293 | $3,884 | $4,754 | $3,054 | $2,654 | $3,334 | $2,034 | $2,954 | $3,954 | |
| EBITDA | ($71) | $229 | $2,753 | $1,588 | $4,179 | $5,049 | $3,349 | $2,949 | $3,629 | $2,329 | $3,249 | $4,249 | |
| Interest Expense | $0 | ($8) | ($17) | ($25) | ($33) | ($42) | ($50) | ($58) | ($67) | ($75) | ($83) | ($92) | |
| Taxes Incurred | ($110) | ($17) | $742 | $395 | $1,175 | $1,439 | $931 | $814 | $1,020 | $633 | $911 | $1,214 | |
| Net Profit | ($256) | ($40) | $1,732 | $923 | $2,742 | $3,357 | $2,173 | $1,899 | $2,380 | $1,476 | $2,126 | $2,832 | |
| Net Profit/Sales | -1.64% | -0.24% | 7.30% | 3.56% | 10.16% | 11.90% | 8.20% | 7.27% | 8.47% | 5.51% | 7.61% | 9.78% | |
| Pro Forma Cash Flow | |||||||||||||
| Month 1 | Month 2 | Month 3 | Month 4 | Month 5 | Month 6 | Month 7 | Month 8 | Month 9 | Month 10 | Month 11 | Month 12 | ||
| Cash Received | |||||||||||||
| Cash from Operations | |||||||||||||
| Cash Sales | $15,600 | $17,100 | $23,740 | $25,950 | $27,000 | $28,200 | $26,500 | $26,100 | $28,100 | $26,800 | $27,950 | $28,950 | |
| Subtotal Cash from Operations | $15,600 | $17,100 | $23,740 | $25,950 | $27,000 | $28,200 | $26,500 | $26,100 | $28,100 | $26,800 | $27,950 | $28,950 | |
| Additional Cash Received | |||||||||||||
| Sales Tax, VAT, HST/GST Received | 0.00% | $0 | $0 | $0 | $0 | $0 | $0 | $0 | $0 | $0 | $0 | $0 | $0 |
| New Current Borrowing | $0 | $0 | $0 | $0 | $0 | $0 | $0 | $0 | $0 | $0 | $0 | $0 | |
| New Other Liabilities (interest-free) | $0 | $0 | $0 | $0 | $0 | $0 | $0 | $0 | $0 | $0 | $0 | $0 | |
| New Long-term Liabilities | $0 | $0 | $0 | $0 | $0 | $0 | $0 | $0 | $0 | $0 | $0 | $0 | |
| Sales of Other Current Assets | $0 | $0 | $0 | $0 | $0 | $0 | $0 | $0 | $0 | $0 | $0 | $0 | |
| Sales of Long-term Assets | $0 | $0 | $0 | $0 | $0 | $0 | $0 | $0 | $0 | $0 | $0 | $0 | |
| New Investment Received | $0 | $0 | $0 | $0 | $0 | $0 | $0 | $0 | $0 | $0 | $0 | $0 | |
| Subtotal Cash Received | $15,600 | $17,100 | $23,740 | $25,950 | $27,000 | $28,200 | $26,500 | $26,100 | $28,100 | $26,800 | $27,950 | $28,950 | |
| Expenditures | Month 1 | Month 2 | Month 3 | Month 4 | Month 5 | Month 6 | Month 7 | Month 8 | Month 9 | Month 10 | Month 11 | Month 12 | |
| Expenditures from Operations | |||||||||||||
| Cash Spending | $3,250 | $4,250 | $7,250 | $8,500 | $8,500 | $8,800 | $8,800 | $8,800 | $10,000 | $10,000 | $10,000 | $10,000 | |
| Bill Payments | $410 | $12,321 | $12,658 | $14,522 | $16,207 | $15,472 | $15,731 | $15,228 | $15,117 | $15,411 | $15,045 | $15,539 | |
| Subtotal Spent on Operations | $3,660 | $16,571 | $19,908 | $23,022 | $24,707 | $24,272 | $24,531 | $24,028 | $25,117 | $25,411 | $25,045 | $25,539 | |
| Additional Cash Spent | |||||||||||||
| Sales Tax, VAT, HST/GST Paid Out | $0 | $0 | $0 | $0 | $0 | $0 | $0 | $0 | $0 | $0 | $0 | $0 | |
| Principal Repayment of Current Borrowing | $0 | $0 | $0 | $0 | $0 | $0 | $0 | $0 | $0 | $0 | $0 | $0 | |
| Other Liabilities Principal Repayment | $0 | $0 | $0 | $0 | $0 | $0 | $0 | $0 | $0 | $0 | $0 | $0 | |
| Long-term Liabilities Principal Repayment | $0 | $1,000 | $1,000 | $1,000 | $1,000 | $1,000 | $1,000 | $1,000 | $1,000 | $1,000 | $1,000 | $1,000 | |
| Purchase Other Current Assets | $0 | $0 | $0 | $0 | $0 | $0 | $0 | $0 | $0 | $0 | $0 | $0 | |
| Purchase Long-term Assets | $0 | $0 | $0 | $0 | $0 | $0 | $0 | $0 | $0 | $0 | $0 | $0 | |
| Dividends | $0 | $0 | $0 | $0 | $0 | $0 | $0 | $0 | $0 | $0 | $0 | $0 | |
| Subtotal Cash Spent | $3,660 | $17,571 | $20,908 | $24,022 | $25,707 | $25,272 | $25,531 | $25,028 | $26,117 | $26,411 | $26,045 | $26,539 | |
| Net Cash Flow | $11,940 | ($471) | $2,832 | $1,928 | $1,293 | $2,928 | $969 | $1,072 | $1,983 | $389 | $1,905 | $2,411 | |
| Cash Balance | $22,690 | $22,219 | $25,051 | $26,980 | $28,273 | $31,200 | $32,170 | $33,242 | $35,225 | $35,613 | $37,518 | $39,929 | |
| Pro Forma Balance Sheet | |||||||||||||
| Month 1 | Month 2 | Month 3 | Month 4 | Month 5 | Month 6 | Month 7 | Month 8 | Month 9 | Month 10 | Month 11 | Month 12 | ||
| Assets | Starting Balances | ||||||||||||
| Current Assets | |||||||||||||
| Cash | $10,750 | $22,690 | $22,219 | $25,051 | $26,980 | $28,273 | $31,200 | $32,170 | $33,242 | $35,225 | $35,613 | $37,518 | $39,929 |
| Other Current Assets | $12,000 | $12,000 | $12,000 | $12,000 | $12,000 | $12,000 | $12,000 | $12,000 | $12,000 | $12,000 | $12,000 | $12,000 | $12,000 |
| Total Current Assets | $22,750 | $34,690 | $34,219 | $37,051 | $38,980 | $40,273 | $43,200 | $44,170 | $45,242 | $47,225 | $47,613 | $49,518 | $51,929 |
| Long-term Assets | |||||||||||||
| Long-term Assets | $17,700 | $17,700 | $17,700 | $17,700 | $17,700 | $17,700 | $17,700 | $17,700 | $17,700 | $17,700 | $17,700 | $17,700 | $17,700 |
| Accumulated Depreciation | $0 | $295 | $590 | $885 | $1,180 | $1,475 | $1,770 | $2,065 | $2,360 | $2,655 | $2,950 | $3,245 | $3,540 |
| Total Long-term Assets | $17,700 | $17,405 | $17,110 | $16,815 | $16,520 | $16,225 | $15,930 | $15,635 | $15,340 | $15,045 | $14,750 | $14,455 | $14,160 |
| Total Assets | $40,450 | $52,095 | $51,329 | $53,866 | $55,500 | $56,498 | $59,130 | $59,805 | $60,582 | $62,270 | $62,363 | $63,973 | $66,089 |
| Liabilities and Capital | Month 1 | Month 2 | Month 3 | Month 4 | Month 5 | Month 6 | Month 7 | Month 8 | Month 9 | Month 10 | Month 11 | Month 12 | |
| Current Liabilities | |||||||||||||
| Accounts Payable | $0 | $11,901 | $12,176 | $13,981 | $15,691 | $14,947 | $15,223 | $14,724 | $14,603 | $14,910 | $14,528 | $15,011 | $15,296 |
| Current Borrowing | $0 | $0 | $0 | $0 | $0 | $0 | $0 | $0 | $0 | $0 | $0 | $0 | $0 |
| Other Current Liabilities | $0 | $0 | $0 | $0 | $0 | $0 | $0 | $0 | $0 | $0 | $0 | $0 | $0 |
| Subtotal Current Liabilities | $0 | $11,901 | $12,176 | $13,981 | $15,691 | $14,947 | $15,223 | $14,724 | $14,603 | $14,910 | $14,528 | $15,011 | $15,296 |
| Long-term Liabilities | $0 | $0 | ($1,000) | ($2,000) | ($3,000) | ($4,000) | ($5,000) | ($6,000) | ($7,000) | ($8,000) | ($9,000) | ($10,000) | ($11,000) |
| Total Liabilities | $0 | $11,901 | $11,176 | $11,981 | $12,691 | $10,947 | $10,223 | $8,724 | $7,603 | $6,910 | $5,528 | $5,011 | $4,296 |
| Paid-in Capital | $50,000 | $50,000 | $50,000 | $50,000 | $50,000 | $50,000 | $50,000 | $50,000 | $50,000 | $50,000 | $50,000 | $50,000 | $50,000 |
| Retained Earnings | ($9,550) | ($9,550) | ($9,550) | ($9,550) | ($9,550) | ($9,550) | ($9,550) | ($9,550) | ($9,550) | ($9,550) | ($9,550) | ($9,550) | ($9,550) |
| Earnings | $0 | ($256) | ($297) | $1,436 | $2,358 | $5,100 | $8,457 | $10,630 | $12,529 | $14,909 | $16,386 | $18,512 | $21,344 |
| Total Capital | $40,450 | $40,194 | $40,153 | $41,886 | $42,808 | $45,550 | $48,907 | $51,080 | $52,979 | $55,359 | $56,836 | $58,962 | $61,794 |
| Total Liabilities and Capital | $40,450 | $52,095 | $51,329 | $53,866 | $55,500 | $56,498 | $59,130 | $59,805 | $60,582 | $62,270 | $62,363 | $63,973 | $66,089 |
| Net Worth | $40,450 | $40,194 | $40,153 | $41,886 | $42,808 | $45,550 | $48,907 | $51,080 | $52,979 | $55,359 | $56,836 | $58,962 | $61,794 |

