
Contemporary Ti Design
Executive Summary
Introduction
Contemporary Ti Design is a designer and manufacturer of unique titanium jewelry. Contemporary Ti Design makes many different designs in the form of earnings, pins, and pendants. All of the products are designed and manufactured by Steve Artificer. In order to grow and achieve the desired level of market penetration, the company has outlined the following marketing/production goals over the next three years:
- The utilization of Contemporary’s designs in at least 40 different galleries.
- Increase the number of designs offered by 8% per year.
The Company
Contemporary Ti Design, located in Hood River, OR, is a custom manufacturer of titanium jewelry. Contemporary Ti Design has a wide range of jewelry offerings, from pendants, to pins, to earnings. All of the pieces are made by Steve Artificer. The business will based out of his home. Steve sells the pieces direct through his website as well as through selected galleries and art shows. Steve plans to hire a sales representative by month eight to handle customer interaction.
The Market
The jewelry industry is highly fragmented with thousands and thousands of artisans competing for distribution contracts and fame. Some work and distribute locally, others have national distribution systems set up. Some artists will design products for larger companies to manufacture, others will design and make the pieces themselves. Competition for Contemporary Ti takes the following forms:
- Artists creating designs that are then manufactured on a large scale and distributed nationally.
- Companies that has their own designers in-house. In this case everything is done in-house, design, marketing and wholesaling.
- Artists such as Steve who design and make all of the pieces themselves, and then do the wholesaling or retailing themselves.
Contemporary Ti Design will be focusing on two distinct groups of customers. One is the end consumer, the other is galleries, to be used as a distribution channel. The end consumer will be interacting with Steve via his website as well as through personal contact at exhibitions/shows. The galleries (museum shops, jewelry stores) will also be met through the exhibitions and shows.
Financial Considerations
Contemporary Ti will be completely financed by equity capital provided by Steve Artificer. We will pass our break-even point within the first year. Conservative projections based on sales over the next three years yield an annual revenue of $75,000 by Year 3. The company expects its cash account to remain healthy.
1.1 Objectives
The objectives for the first three years of operation include:
- To create a jewelry manufacturing company whose primary goal is to exceed customer’s expectations.
- The utilization of Contemporary’s designs in at least 40 different galleries.
- To increase the number of designs offered by 8% per year.
- To develop a profitable/sustainable home-based company.
1.2 Mission
Contemporary Ti Design’s mission is to make innovative pieces of art in jewelry form out of titanium. We exist to attract and maintain customers. When we adhere to this maxim, everything else will fall in to place. Our services will exceed the expectations of our customers.
Company Summary
Contemporary Ti Design, located in Hood River, OR, is a custom manufacturer of titanium jewelry. Contemporary Ti Design has a wide range of jewelry offerings, from pendants, to pins, to approximately. All of the pieces are made by Steve Artificer. Steve sells the pieces direct through his website as well as through selected galleries and art shows.
The business will based out of Steve’s home.
If the company goes as planned, month nine will signal profitability and year three will see profit of $17,000.
2.1 Company Ownership
Contemporary Ti Design is a sole proprietorship, owned by Steve Artificer. The advantage of incorporation generally eliminating personal liability is of little concern.
2.2 Start-up Summary
Contemporary Ti Design’s start-up costs will include the following equipment for the home-based business:
- Legal fees.
- Website creation fees.
- Home office furniture including desk, file cabinet, chairs.
- Computer including printer, CD-RW.
- DSL hookup.
- Copier and fax machine.
- Extra land phone line.
- Cutting tools.
- Raw materials (titanium sheet and wire).
- Anodizing equipment.

| Start-up | |
| Requirements | |
| Start-up Expenses | |
| Legal | $500 |
| Stationery etc. | $150 |
| Website Development | $500 |
| DSL Set-up | $100 |
| Titanium Sheet | $200 |
| Other | $0 |
| Total Start-up Expenses | $1,450 |
| Start-up Assets | |
| Cash Required | $12,750 |
| Start-up Inventory | $0 |
| Other Current Assets | $0 |
| Long-term Assets | $2,800 |
| Total Assets | $15,550 |
| Total Requirements | $17,000 |
| Start-up Funding | |
| Start-up Expenses to Fund | $1,450 |
| Start-up Assets to Fund | $15,550 |
| Total Funding Required | $17,000 |
| Assets | |
| Non-cash Assets from Start-up | $2,800 |
| Cash Requirements from Start-up | $12,750 |
| Additional Cash Raised | $0 |
| Cash Balance on Starting Date | $12,750 |
| Total Assets | $15,550 |
| Liabilities and Capital | |
| Liabilities | |
| Current Borrowing | $0 |
| Long-term Liabilities | $0 |
| Accounts Payable (Outstanding Bills) | $0 |
| Other Current Liabilities (interest-free) | $0 |
| Total Liabilities | $0 |
| Capital | |
| Planned Investment | |
| Steve | $17,000 |
| Investor 2 | $0 |
| Other | $0 |
| Additional Investment Requirement | $0 |
| Total Planned Investment | $17,000 |
| Loss at Start-up (Start-up Expenses) | ($1,450) |
| Total Capital | $15,550 |
| Total Capital and Liabilities | $15,550 |
| Total Funding | $17,000 |
Products
Contemporary Ti Design manufactures titanium jewelry. The jewelry takes the form or pendants, approximately, and pins. All of the jewelry is made out of titanium. All of the products are designed and made by Steve.
Steve has chosen titanium because of its unique characteristics. It is stronger than steel, yet similar in weight to aluminum. It is inert and hypoallergenic.
Most of the jewelry is left unfinished. The grey of the titanium by itself looks quite nice. Some of the pieces are anodized. Anodizing adds a broad range colors to the titanium. Anodizing occurs by immersing the titanium in electrically charged water or hooking up the titanium to a electrical power source. When charged with electricity, a light film or oxide will form on the surface of the titanium and this produces color.
Contemporary Ti Design’s pieces are constructed out of titanium sheets. The material is cut using a saw blade. The interior of the pieces are cut by piercing a small hole through the interior and inserting a saw blade. All pieces are made from several pieces of titanium. The pieces are held together by rivets. Small holes are drilled through the different pieces and a small wire (rivet) is inserted through. The head and end of the rivet are tapped with a hammer and that enlarges the end holding the pieces together. In addition to the utility of the rivet, it is aesthetically pleasing in terms of the overall look of the piece.
Market Analysis Summary
Contemporary Ti Design will be focusing on two distinct groups of customers. One is the end consumer, the other is galleries, to be used as a distribution channel. The end consumer will be interacting with Steve via his website as well as through personal contact at exhibitions/shows. The galleries (museum shops, jewelry stores) will also be met through the exhibitions and shows. At these events a long term relationship will be entered into so that the shops become a retail distribution channel for Contemporary Ti Design. Additionally, Contemporary Ti Design will be traveling the country meeting with different galleries and setting up retailing relationships with them.
4.1 Market Segmentation
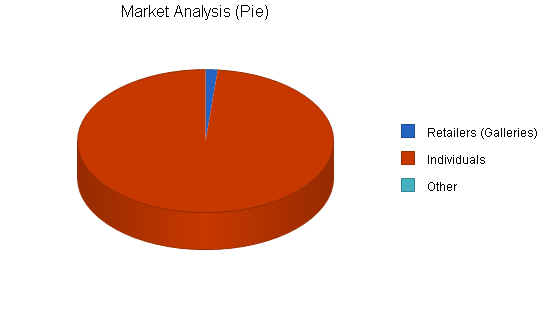
Contemporary Ti Design has two targeted groups of people, galleries and individuals:
- Galleries- These buyers are purchasing jewelry wholesale in quantity and reselling it to the public. Some of the galleries are private galleries, some are artisan jewelry shops, some are museum stores, like the Smithsonian Hirschorn Museum of Modern Art Store. The margins are not as good compared to sales to individuals and there is also the expense of setting up relationships with the galleries to sell the art pieces, but galleries move a large quantity of work. The galleries and stores that typically are interested in Contemporary’s work are more upscale and modern. They appeal to a crowd that favors progressive or industrial design.

- Individuals- These buyers are familiar with Contemporary Ti Design either from stumbling across the website, saw some examples of Steve’s work at a showing or art festival, word of mouth, or some other avenue. The individual would then view the different available pieces on the website and place the order via the Web, phone, fax, or mail. The margins for individual sales are greater because there is not a distribution layer involved, it is direct from Contemporary Ti Design to the end consumer. The individuals that are typically attracted to this type of art work are generally from cities and are fairly progressive. The reason for this is that the jewelry, while not flashy, is not all that conservative looking. They are intricate pieces, typically using organic shapes and industrial design. This is the reason that more progressive people will appreciate the Contemporary Ti Design pieces.
| Market Analysis | |||||||
| Year 1 | Year 2 | Year 3 | Year 4 | Year 5 | |||
| Potential Customers | Growth | CAGR | |||||
| Retailers (Galleries) | 7% | 2,525 | 2,702 | 2,891 | 3,093 | 3,310 | 7.00% |
| Individuals | 9% | 165,475 | 180,368 | 196,601 | 214,295 | 233,582 | 9.00% |
| Other | 0% | 0 | 0 | 0 | 0 | 0 | 0.00% |
| Total | 8.97% | 168,000 | 183,070 | 199,492 | 217,388 | 236,892 | 8.97% |
4.2 Target Market Segment Strategy
Contemporary Ti Design is targeting galleries and individuals because they are the most likely purchasers of the jewelry. Galleries typically purchase works of art from many different artisans. The galleries will first come into contact with Contemporary through examples of the work at an exhibition, or the retailer is contacted by Steve (or sales rep) and shown samples. If there is interest, the gallery will place an order for a few representative pieces. This is hopefully the beginning of a long-term relationship where the gallery will then reorder more pieces to replenish their stock as well as to hopefully broaden their product offering.
Contemporary’s target segment strategy for the individuals will also be based on exhibitions. The individual will see examples of Steve’s work and either purchase the product right then, or will be referred to the website where a complete product listing is available and all pieces are sold. Additionally, individuals will come across our website, either from a referral or a targeted Web search. The individual is able to make a purchase, or find out what galleries carry Contemporary’s pieces to view them in person.
4.3 Industry Analysis
The jewelry industry, or even broader the art industry, is quite large and diverse. There are countless different artisans making so many different pieces of work. There are artists from every state that manufacture products. Some sell to large department stores, some to galleries, some sell them only via a website, others will travel with the products and sell what they are carrying.
4.3.1 Competition and Buying Patterns
As previously stated, the jewelry industry is composed of thousand upon thousands of people. Some work and distribute locally, others have national distribution systems set up. Some artists will design products for larger companies to manufacture, others will design and make the pieces themselves. This business plan will have an abridged competition section. This is because of the very large and distributed nature of artisan jewelry design, the market is entirely too dispersed to have a complete catalog of the competition.
Competition does take the following forms:
- Artists creating designs that are then manufactured on a large scale and distributed nationally. The artists might be famous enough to have their own one-name studio that they create designs and the product is made and sold under the larger companies name. If the artist does not have national name recognition, the designers might belong to a firm that is hired to develop designs for a company who will manufacture and sell the product.
- A company that has their own designers in-house. In this case everything is done in-house, design, marketing and wholesaling. Another variation would be in-house designers, marketers and wholesalers with the manufacturing contracted out.
- Artists such as Steve who design and make all of the pieces themselves, and then do the wholesaling or retailing themselves.
The buying patterns of consumers fall into typically two types: gifts and impulse purchases. A gift purchase occurs when the buyer is looking for a gift for someone, sees the art piece, and then purchases it. In this case the plan is to make a purchase, it is just not known what or where that purchase will be made. The other buying pattern is an impulse purchase. Someone will be shopping, they are not in need of anything, will see the item and have to have it, buying it on the spot. One last pattern, that occurs less frequently is if someone was looking for an “accessory” that would match an outfit and happens to come across the piece of jewelry and buys it.
Strategy and Implementation Summary
Contemporary Ti Design is Steve Artificer’s design and manufacturing company. Contemporary’s competitive edge is Steve’s artistic skill. While Steve does not have a monopoly of artistic skill, his level of creativity and expertise is encountered very infrequently. Steve will be applying his competitive edge in the development of some wonderful pieces of art. These works will be sold initially by Steve through shows and exhibitions, as well as through strategic relationships with retail outlets. Toward the end of year one Steve will cease handling sales activity personally and hire an independent sale representative to handle exhibitions and retailers.
5.1 Competitive Edge
Contemporary Ti Design’s competitive edge is fairly simple. It is based on creative, unusual designs. While this strategy can be replicated, it is not easy. Creative, unusual designs require skill. While not everyone has artistic skill, Steve is certainly not the only one graced with this skill. Regardless, Steve is very skilled in what he does, and every piece that he manufactures incorporates an element of creative, unusual, eye catching design that stands out from most jewelry.
5.2 Sales Strategy
Contemporary Ti Design’s sales strategy will be targeted at getting a wide range of galleries to carry Steve’s products. This will be done with two methods. The first is attendance and display at different shows. The shows are typically craft shows, art shows or art festivals. Although final consumers attend these shows, buyers from galleries attend these shows to meet artists and form relationships with them. The other method of reaching the galleries is through the process of traveling to different galleries and speaking with the buyer or owner and showing them the pieces that Contemporary Ti Design designs. Lists can be purchased of different galleries in the country and Steve or a sales representative will travel and show off the “wares.”
To reach the consumer, one of the methods is the same, the shows. As stated in the previous paragraph, end consumers attend these shows and many different pieces will be sold. In addition to this method, a complete catalog of the collection can be viewed and purchased over the Web. While some people like to hold the actual piece before purchasing, the photos on the Web are quite detailed and people often feel comfortable ordering a piece directly from the website.
5.2.1 Sales Forecast
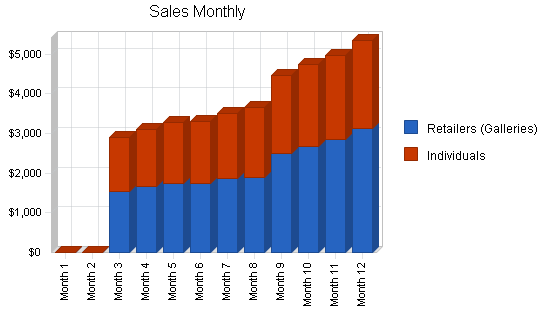
The first month will be spent setting up the work quarters and building up inventory. The second month will be spent traveling around visiting galleries trying to set up distribution channels. Month three will mark the first month of some sales activity. Steve will have been to several exhibits and sold products as well as pieces sold through the website. From month three on sales will increase incrementally. Steve will be on the road usually about a week per month traveling to different galleries and exhibits. This will occur till month eight. Month eight will mark the time when Steve will hire a sales representative to do the traveling to set up distributors and attend exhibitions to allow Steve to concentrate on his design and production. Month eight will mark a larger increase in the sales.
| Sales Forecast | |||
| Year 1 | Year 2 | Year 3 | |
| Sales | |||
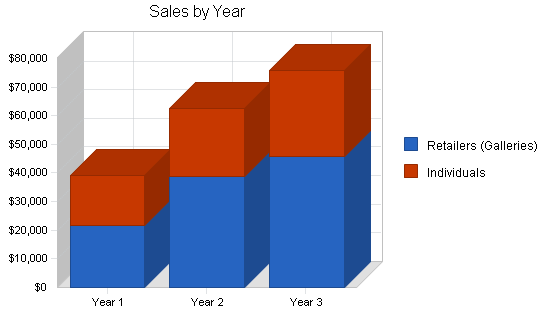
| Retailers (Galleries) | $21,593 | $38,874 | $45,785 |
| Individuals | $17,708 | $23,545 | $29,874 |
| Total Sales | $39,301 | $62,419 | $75,659 |
| Direct Cost of Sales | Year 1 | Year 2 | Year 3 |
| Retailers (Galleries) | $3,239 | $5,831 | $6,868 |
| Individuals | $2,656 | $3,532 | $4,481 |
| Subtotal Direct Cost of Sales | $5,895 | $9,363 | $11,349 |
5.3 Milestones
Contemporary Ti Design will have several milestones early on:
- Business plan completion. This will be done as a roadmap for the organization. While we do not need a business plan to raise capital, it will be an indispensable tool for the ongoing performance and improvement of the company.
- Set up office and work shop.
- Set up the first distribution channel.
- Steve begins design and manufacturing full time.

| Milestones | |||||
| Milestone | Start Date | End Date | Budget | Manager | Department |
| Business Plan Completion | 1/1/2001 | 2/1/2001 | $0 | ABC | Marketing |
| Set-up Office and Work Shop | 1/1/2001 | 2/1/2001 | $1,450 | ABC | Department |
| Set-up First Distribution Channel. | 2/1/2001 | 3/1/2001 | $600 | ABC | Department |
| Steve Begins Design and Manufacturing Full Time | 8/1/2001 | 8/1/2001 | $0 | ABC | Department |
| Totals | $2,050 | ||||
Management Summary
Contemporary Ti Design is owned and operated by Steve Artificer. It will be formed as a sole proprietorship. Steve was always an artistic child, even at a young age instead of playing sports such as baseball and kickball would make things. He would often find ordinary things lying around school and transform them into a piece of art. Most of his free time was spent crafting things, this is what he enjoyed.
Steve pursued his undergraduate degree from the Cleveland Institute of Art (CIA). At the CIA Steve studies graphic design. Steve worked throughout school at a local design firm that did a wide range of design work including company logos, furniture design, and product design.
Upon graduation Steve was unsure what direction in the art industry he wanted to pursue so he decided to pursue a Masters in product design from Iowa State University. While at Iowa Steve met E. Douglas Wunder, a designer who primarily used titanium. Steve worked with Douglas for two years, an event that sealed his fate. Steve realized that he needed to develop his own business, specifically a jewelry design and manufacturing studio, also specializing in titanium. Recognizing that location of the studio was not that important, Steve moved out to Hood River, OR with his wife because of the proximity to the mountains and opened shop up in the basement of his house.
6.1 Personnel Plan
Steve, for the first eight months will wear many different hats. He will be designer and manufacturer of the jewelry. He will also handle all ordering of the raw material and sales of the pieces. Steve will bring on board an independent sales representative to take over the sales and marketing of the pieces.
| Personnel Plan | |||
| Year 1 | Year 2 | Year 3 | |
| Steve | $24,000 | $24,000 | $24,000 |
| Independant Sales Representative | $3,500 | $8,400 | $8,400 |
| Total People | 2 | 2 | 2 |
| Total Payroll | $27,500 | $32,400 | $32,400 |
Financial Plan
The following sections will outline the important financial information.
7.1 Important Assumptions
The following table highlights some of the important financial assumptions for Contemporary Ti Design.
| General Assumptions | |||
| Year 1 | Year 2 | Year 3 | |
| Plan Month | 1 | 2 | 3 |
| Current Interest Rate | 10.00% | 10.00% | 10.00% |
| Long-term Interest Rate | 10.00% | 10.00% | 10.00% |
| Tax Rate | 25.42% | 25.00% | 25.42% |
| Other | 0 | 0 | 0 |
7.2 Break-even Analysis
The following table and chart show our Break-even Analysis.

| Break-even Analysis | |
| Monthly Revenue Break-even | $3,879 |
| Assumptions: | |
| Average Percent Variable Cost | 15% |
| Estimated Monthly Fixed Cost | $3,297 |
7.3 Projected Profit and Loss
The following table indicates projected profit and loss.


| Pro Forma Profit and Loss | |||
| Year 1 | Year 2 | Year 3 | |
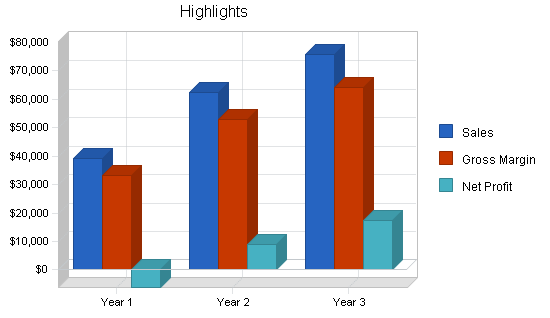
| Sales | $39,301 | $62,419 | $75,659 |
| Direct Cost of Sales | $5,895 | $9,363 | $11,349 |
| Other | $0 | $0 | $0 |
| Total Cost of Sales | $5,895 | $9,363 | $11,349 |
| Gross Margin | $33,406 | $53,056 | $64,310 |
| Gross Margin % | 85.00% | 85.00% | 85.00% |
| Expenses | |||
| Payroll | $27,500 | $32,400 | $32,400 |
| Sales and Marketing and Other Expenses | $5,200 | $1,200 | $1,200 |
| Depreciation | $936 | $936 | $928 |
| Leased Equipment | $0 | $0 | $0 |
| Utilities | $600 | $600 | $600 |
| Insurance | $1,200 | $1,200 | $1,200 |
| Rent | $0 | $0 | $0 |
| Payroll Taxes | $4,125 | $4,860 | $4,860 |
| Other | $0 | $0 | $0 |
| Total Operating Expenses | $39,561 | $41,196 | $41,188 |
| Profit Before Interest and Taxes | ($6,155) | $11,860 | $23,122 |
| EBITDA | ($5,219) | $12,796 | $24,050 |
| Interest Expense | $0 | $0 | $0 |
| Taxes Incurred | $0 | $2,965 | $5,877 |
| Net Profit | ($6,155) | $8,895 | $17,245 |
| Net Profit/Sales | -15.66% | 14.25% | 22.79% |
7.4 Projected Cash Flow
The following chart and table indicate projected cash flow.

| Pro Forma Cash Flow | |||
| Year 1 | Year 2 | Year 3 | |
| Cash Received | |||
| Cash from Operations | |||
| Cash Sales | $13,755 | $21,847 | $26,481 |
| Cash from Receivables | $18,949 | $36,692 | $46,956 |
| Subtotal Cash from Operations | $32,705 | $58,539 | $73,437 |
| Additional Cash Received | |||
| Sales Tax, VAT, HST/GST Received | $0 | $0 | $0 |
| New Current Borrowing | $0 | $0 | $0 |
| New Other Liabilities (interest-free) | $0 | $0 | $0 |
| New Long-term Liabilities | $0 | $0 | $0 |
| Sales of Other Current Assets | $0 | $0 | $0 |
| Sales of Long-term Assets | $0 | $0 | $0 |
| New Investment Received | $2,000 | $0 | $0 |
| Subtotal Cash Received | $34,705 | $58,539 | $73,437 |
| Expenditures | Year 1 | Year 2 | Year 3 |
| Expenditures from Operations | |||
| Cash Spending | $27,500 | $32,400 | $32,400 |
| Bill Payments | $16,525 | $20,725 | $25,078 |
| Subtotal Spent on Operations | $44,025 | $53,125 | $57,478 |
| Additional Cash Spent | |||
| Sales Tax, VAT, HST/GST Paid Out | $0 | $0 | $0 |
| Principal Repayment of Current Borrowing | $0 | $0 | $0 |
| Other Liabilities Principal Repayment | $0 | $0 | $0 |
| Long-term Liabilities Principal Repayment | $0 | $0 | $0 |
| Purchase Other Current Assets | $0 | $0 | $0 |
| Purchase Long-term Assets | $0 | $0 | $0 |
| Dividends | $0 | $0 | $0 |
| Subtotal Cash Spent | $44,025 | $53,125 | $57,478 |
| Net Cash Flow | ($9,321) | $5,414 | $15,959 |
| Cash Balance | $3,429 | $8,843 | $24,802 |
7.5 Projected Balance Sheet
The following table indicates the projected balance sheet.
| Pro Forma Balance Sheet | |||
| Year 1 | Year 2 | Year 3 | |
| Assets | |||
| Current Assets | |||
| Cash | $3,429 | $8,843 | $24,802 |
| Accounts Receivable | $6,596 | $10,477 | $12,699 |
| Inventory | $1,105 | $1,755 | $2,127 |
| Other Current Assets | $0 | $0 | $0 |
| Total Current Assets | $11,131 | $21,075 | $39,628 |
| Long-term Assets | |||
| Long-term Assets | $2,800 | $2,800 | $2,800 |
| Accumulated Depreciation | $936 | $1,872 | $2,800 |
| Total Long-term Assets | $1,864 | $928 | $0 |
| Total Assets | $12,995 | $22,003 | $39,628 |
| Liabilities and Capital | Year 1 | Year 2 | Year 3 |
| Current Liabilities | |||
| Accounts Payable | $1,600 | $1,713 | $2,092 |
| Current Borrowing | $0 | $0 | $0 |
| Other Current Liabilities | $0 | $0 | $0 |
| Subtotal Current Liabilities | $1,600 | $1,713 | $2,092 |
| Long-term Liabilities | $0 | $0 | $0 |
| Total Liabilities | $1,600 | $1,713 | $2,092 |
| Paid-in Capital | $19,000 | $19,000 | $19,000 |
| Retained Earnings | ($1,450) | ($7,605) | $1,290 |
| Earnings | ($6,155) | $8,895 | $17,245 |
| Total Capital | $11,395 | $20,290 | $37,535 |
| Total Liabilities and Capital | $12,995 | $22,003 | $39,628 |
| Net Worth | $11,395 | $20,290 | $37,535 |
Appendix
| Sales Forecast | |||||||||||||
| Month 1 | Month 2 | Month 3 | Month 4 | Month 5 | Month 6 | Month 7 | Month 8 | Month 9 | Month 10 | Month 11 | Month 12 | ||
| Sales | |||||||||||||
| Retailers (Galleries) | 0% | $0 | $0 | $1,547 | $1,654 | $1,745 | $1,732 | $1,874 | $1,888 | $2,487 | $2,687 | $2,854 | $3,125 |
| Individuals | 0% | $0 | $0 | $1,345 | $1,445 | $1,547 | $1,585 | $1,645 | $1,774 | $1,987 | $2,045 | $2,114 | $2,221 |
| Total Sales | $0 | $0 | $2,892 | $3,099 | $3,292 | $3,317 | $3,519 | $3,662 | $4,474 | $4,732 | $4,968 | $5,346 | |
| Direct Cost of Sales | Month 1 | Month 2 | Month 3 | Month 4 | Month 5 | Month 6 | Month 7 | Month 8 | Month 9 | Month 10 | Month 11 | Month 12 | |
| Retailers (Galleries) | $0 | $0 | $232 | $248 | $262 | $260 | $281 | $283 | $373 | $403 | $428 | $469 | |
| Individuals | $0 | $0 | $202 | $217 | $232 | $238 | $247 | $266 | $298 | $307 | $317 | $333 | |
| Subtotal Direct Cost of Sales | $0 | $0 | $434 | $465 | $494 | $498 | $528 | $549 | $671 | $710 | $745 | $802 | |
| Personnel Plan | |||||||||||||
| Month 1 | Month 2 | Month 3 | Month 4 | Month 5 | Month 6 | Month 7 | Month 8 | Month 9 | Month 10 | Month 11 | Month 12 | ||
| Steve | 0% | $2,000 | $2,000 | $2,000 | $2,000 | $2,000 | $2,000 | $2,000 | $2,000 | $2,000 | $2,000 | $2,000 | $2,000 |
| Independant Sales Representative | 0% | $0 | $0 | $0 | $0 | $0 | $0 | $0 | $700 | $700 | $700 | $700 | $700 |
| Total People | 1 | 1 | 1 | 1 | 1 | 1 | 1 | 2 | 2 | 2 | 2 | 2 | |
| Total Payroll | $2,000 | $2,000 | $2,000 | $2,000 | $2,000 | $2,000 | $2,000 | $2,700 | $2,700 | $2,700 | $2,700 | $2,700 | |
| General Assumptions | |||||||||||||
| Month 1 | Month 2 | Month 3 | Month 4 | Month 5 | Month 6 | Month 7 | Month 8 | Month 9 | Month 10 | Month 11 | Month 12 | ||
| Plan Month | 1 | 2 | 3 | 4 | 5 | 6 | 7 | 8 | 9 | 10 | 11 | 12 | |
| Current Interest Rate | 10.00% | 10.00% | 10.00% | 10.00% | 10.00% | 10.00% | 10.00% | 10.00% | 10.00% | 10.00% | 10.00% | 10.00% | |
| Long-term Interest Rate | 10.00% | 10.00% | 10.00% | 10.00% | 10.00% | 10.00% | 10.00% | 10.00% | 10.00% | 10.00% | 10.00% | 10.00% | |
| Tax Rate | 30.00% | 25.00% | 25.00% | 25.00% | 25.00% | 25.00% | 25.00% | 25.00% | 25.00% | 25.00% | 25.00% | 25.00% | |
| Other | 0 | 0 | 0 | 0 | 0 | 0 | 0 | 0 | 0 | 0 | 0 | 0 | |
| Pro Forma Profit and Loss | |||||||||||||
| Month 1 | Month 2 | Month 3 | Month 4 | Month 5 | Month 6 | Month 7 | Month 8 | Month 9 | Month 10 | Month 11 | Month 12 | ||
| Sales | $0 | $0 | $2,892 | $3,099 | $3,292 | $3,317 | $3,519 | $3,662 | $4,474 | $4,732 | $4,968 | $5,346 | |
| Direct Cost of Sales | $0 | $0 | $434 | $465 | $494 | $498 | $528 | $549 | $671 | $710 | $745 | $802 | |
| Other | $0 | $0 | $0 | $0 | $0 | $0 | $0 | $0 | $0 | $0 | $0 | $0 | |
| Total Cost of Sales | $0 | $0 | $434 | $465 | $494 | $498 | $528 | $549 | $671 | $710 | $745 | $802 | |
| Gross Margin | $0 | $0 | $2,458 | $2,634 | $2,798 | $2,819 | $2,991 | $3,113 | $3,803 | $4,022 | $4,223 | $4,544 | |
| Gross Margin % | 0.00% | 0.00% | 85.00% | 85.00% | 85.00% | 85.00% | 85.00% | 85.00% | 85.00% | 85.00% | 85.00% | 85.00% | |
| Expenses | |||||||||||||
| Payroll | $2,000 | $2,000 | $2,000 | $2,000 | $2,000 | $2,000 | $2,000 | $2,700 | $2,700 | $2,700 | $2,700 | $2,700 | |
| Sales and Marketing and Other Expenses | $600 | $600 | $600 | $600 | $600 | $600 | $600 | $600 | $100 | $100 | $100 | $100 | |
| Depreciation | $78 | $78 | $78 | $78 | $78 | $78 | $78 | $78 | $78 | $78 | $78 | $78 | |
| Leased Equipment | $0 | $0 | $0 | $0 | $0 | $0 | $0 | $0 | $0 | $0 | $0 | $0 | |
| Utilities | $50 | $50 | $50 | $50 | $50 | $50 | $50 | $50 | $50 | $50 | $50 | $50 | |
| Insurance | $100 | $100 | $100 | $100 | $100 | $100 | $100 | $100 | $100 | $100 | $100 | $100 | |
| Rent | $0 | $0 | $0 | $0 | $0 | $0 | $0 | $0 | $0 | $0 | $0 | $0 | |
| Payroll Taxes | 15% | $300 | $300 | $300 | $300 | $300 | $300 | $300 | $405 | $405 | $405 | $405 | $405 |
| Other | $0 | $0 | $0 | $0 | $0 | $0 | $0 | $0 | $0 | $0 | $0 | $0 | |
| Total Operating Expenses | $3,128 | $3,128 | $3,128 | $3,128 | $3,128 | $3,128 | $3,128 | $3,933 | $3,433 | $3,433 | $3,433 | $3,433 | |
| Profit Before Interest and Taxes | ($3,128) | ($3,128) | ($670) | ($494) | ($330) | ($309) | ($137) | ($820) | $370 | $589 | $790 | $1,111 | |
| EBITDA | ($3,050) | ($3,050) | ($592) | ($416) | ($252) | ($231) | ($59) | ($742) | $448 | $667 | $868 | $1,189 | |
| Interest Expense | $0 | $0 | $0 | $0 | $0 | $0 | $0 | $0 | $0 | $0 | $0 | $0 | |
| Taxes Incurred | $0 | $0 | $0 | $0 | $0 | $0 | $0 | $0 | $0 | $0 | $0 | $0 | |
| Net Profit | ($3,128) | ($3,128) | ($670) | ($494) | ($330) | ($309) | ($137) | ($820) | $370 | $589 | $790 | $1,111 | |
| Net Profit/Sales | 0.00% | 0.00% | -23.16% | -15.94% | -10.02% | -9.30% | -3.89% | -22.40% | 8.27% | 12.45% | 15.90% | 20.78% | |
| Pro Forma Cash Flow | |||||||||||||
| Month 1 | Month 2 | Month 3 | Month 4 | Month 5 | Month 6 | Month 7 | Month 8 | Month 9 | Month 10 | Month 11 | Month 12 | ||
| Cash Received | |||||||||||||
| Cash from Operations | |||||||||||||
| Cash Sales | $0 | $0 | $1,012 | $1,085 | $1,152 | $1,161 | $1,232 | $1,282 | $1,566 | $1,656 | $1,739 | $1,871 | |
| Cash from Receivables | $0 | $0 | $0 | $63 | $1,884 | $2,019 | $2,140 | $2,160 | $2,290 | $2,398 | $2,914 | $3,081 | |
| Subtotal Cash from Operations | $0 | $0 | $1,012 | $1,147 | $3,036 | $3,179 | $3,372 | $3,442 | $3,856 | $4,054 | $4,652 | $4,952 | |
| Additional Cash Received | |||||||||||||
| Sales Tax, VAT, HST/GST Received | 0.00% | $0 | $0 | $0 | $0 | $0 | $0 | $0 | $0 | $0 | $0 | $0 | $0 |
| New Current Borrowing | $0 | $0 | $0 | $0 | $0 | $0 | $0 | $0 | $0 | $0 | $0 | $0 | |
| New Other Liabilities (interest-free) | $0 | $0 | $0 | $0 | $0 | $0 | $0 | $0 | $0 | $0 | $0 | $0 | |
| New Long-term Liabilities | $0 | $0 | $0 | $0 | $0 | $0 | $0 | $0 | $0 | $0 | $0 | $0 | |
| Sales of Other Current Assets | $0 | $0 | $0 | $0 | $0 | $0 | $0 | $0 | $0 | $0 | $0 | $0 | |
| Sales of Long-term Assets | $0 | $0 | $0 | $0 | $0 | $0 | $0 | $0 | $0 | $0 | $0 | $0 | |
| New Investment Received | $0 | $0 | $0 | $0 | $0 | $0 | $0 | $0 | $2,000 | $0 | $0 | $0 | |
| Subtotal Cash Received | $0 | $0 | $1,012 | $1,147 | $3,036 | $3,179 | $3,372 | $3,442 | $5,856 | $4,054 | $4,652 | $4,952 | |
| Expenditures | Month 1 | Month 2 | Month 3 | Month 4 | Month 5 | Month 6 | Month 7 | Month 8 | Month 9 | Month 10 | Month 11 | Month 12 | |
| Expenditures from Operations | |||||||||||||
| Cash Spending | $2,000 | $2,000 | $2,000 | $2,000 | $2,000 | $2,000 | $2,000 | $2,700 | $2,700 | $2,700 | $2,700 | $2,700 | |
| Bill Payments | $35 | $1,050 | $1,083 | $2,050 | $2,017 | $1,083 | $2,017 | $1,087 | $2,138 | $1,655 | $1,622 | $688 | |
| Subtotal Spent on Operations | $2,035 | $3,050 | $3,083 | $4,050 | $4,017 | $3,083 | $4,017 | $3,787 | $4,838 | $4,355 | $4,322 | $3,388 | |
| Additional Cash Spent | |||||||||||||
| Sales Tax, VAT, HST/GST Paid Out | $0 | $0 | $0 | $0 | $0 | $0 | $0 | $0 | $0 | $0 | $0 | $0 | |
| Principal Repayment of Current Borrowing | $0 | $0 | $0 | $0 | $0 | $0 | $0 | $0 | $0 | $0 | $0 | $0 | |
| Other Liabilities Principal Repayment | $0 | $0 | $0 | $0 | $0 | $0 | $0 | $0 | $0 | $0 | $0 | $0 | |
| Long-term Liabilities Principal Repayment | $0 | $0 | $0 | $0 | $0 | $0 | $0 | $0 | $0 | $0 | $0 | $0 | |
| Purchase Other Current Assets | $0 | $0 | $0 | $0 | $0 | $0 | $0 | $0 | $0 | $0 | $0 | $0 | |
| Purchase Long-term Assets | $0 | $0 | $0 | $0 | $0 | $0 | $0 | $0 | $0 | $0 | $0 | $0 | |
| Dividends | $0 | $0 | $0 | $0 | $0 | $0 | $0 | $0 | $0 | $0 | $0 | $0 | |
| Subtotal Cash Spent | $2,035 | $3,050 | $3,083 | $4,050 | $4,017 | $3,083 | $4,017 | $3,787 | $4,838 | $4,355 | $4,322 | $3,388 | |
| Net Cash Flow | ($2,035) | ($3,050) | ($2,071) | ($2,903) | ($980) | $96 | ($645) | ($345) | $1,018 | ($301) | $331 | $1,564 | |
| Cash Balance | $10,715 | $7,665 | $5,594 | $2,691 | $1,711 | $1,807 | $1,162 | $818 | $1,836 | $1,535 | $1,866 | $3,429 | |
| Pro Forma Balance Sheet | |||||||||||||
| Month 1 | Month 2 | Month 3 | Month 4 | Month 5 | Month 6 | Month 7 | Month 8 | Month 9 | Month 10 | Month 11 | Month 12 | ||
| Assets | Starting Balances | ||||||||||||
| Current Assets | |||||||||||||
| Cash | $12,750 | $10,715 | $7,665 | $5,594 | $2,691 | $1,711 | $1,807 | $1,162 | $818 | $1,836 | $1,535 | $1,866 | $3,429 |
| Accounts Receivable | $0 | $0 | $0 | $1,880 | $3,831 | $4,087 | $4,225 | $4,372 | $4,591 | $5,209 | $5,887 | $6,202 | $6,596 |
| Inventory | $0 | $0 | $0 | $566 | $1,101 | $608 | $1,110 | $582 | $1,033 | $1,362 | $1,652 | $907 | $1,105 |
| Other Current Assets | $0 | $0 | $0 | $0 | $0 | $0 | $0 | $0 | $0 | $0 | $0 | $0 | $0 |
| Total Current Assets | $12,750 | $10,715 | $7,665 | $8,040 | $7,624 | $6,406 | $7,142 | $6,116 | $6,442 | $8,407 | $9,074 | $8,975 | $11,131 |
| Long-term Assets | |||||||||||||
| Long-term Assets | $2,800 | $2,800 | $2,800 | $2,800 | $2,800 | $2,800 | $2,800 | $2,800 | $2,800 | $2,800 | $2,800 | $2,800 | $2,800 |
| Accumulated Depreciation | $0 | $78 | $156 | $234 | $312 | $390 | $468 | $546 | $624 | $702 | $780 | $858 | $936 |
| Total Long-term Assets | $2,800 | $2,722 | $2,644 | $2,566 | $2,488 | $2,410 | $2,332 | $2,254 | $2,176 | $2,098 | $2,020 | $1,942 | $1,864 |
| Total Assets | $15,550 | $13,437 | $10,309 | $10,606 | $10,112 | $8,816 | $9,474 | $8,370 | $8,618 | $10,505 | $11,094 | $10,917 | $12,995 |
| Liabilities and Capital | Month 1 | Month 2 | Month 3 | Month 4 | Month 5 | Month 6 | Month 7 | Month 8 | Month 9 | Month 10 | Month 11 | Month 12 | |
| Current Liabilities | |||||||||||||
| Accounts Payable | $0 | $1,015 | $1,015 | $1,982 | $1,982 | $1,015 | $1,982 | $1,015 | $2,083 | $1,600 | $1,600 | $633 | $1,600 |
| Current Borrowing | $0 | $0 | $0 | $0 | $0 | $0 | $0 | $0 | $0 | $0 | $0 | $0 | $0 |
| Other Current Liabilities | $0 | $0 | $0 | $0 | $0 | $0 | $0 | $0 | $0 | $0 | $0 | $0 | $0 |
| Subtotal Current Liabilities | $0 | $1,015 | $1,015 | $1,982 | $1,982 | $1,015 | $1,982 | $1,015 | $2,083 | $1,600 | $1,600 | $633 | $1,600 |
| Long-term Liabilities | $0 | $0 | $0 | $0 | $0 | $0 | $0 | $0 | $0 | $0 | $0 | $0 | $0 |
| Total Liabilities | $0 | $1,015 | $1,015 | $1,982 | $1,982 | $1,015 | $1,982 | $1,015 | $2,083 | $1,600 | $1,600 | $633 | $1,600 |
| Paid-in Capital | $17,000 | $17,000 | $17,000 | $17,000 | $17,000 | $17,000 | $17,000 | $17,000 | $17,000 | $19,000 | $19,000 | $19,000 | $19,000 |
| Retained Earnings | ($1,450) | ($1,450) | ($1,450) | ($1,450) | ($1,450) | ($1,450) | ($1,450) | ($1,450) | ($1,450) | ($1,450) | ($1,450) | ($1,450) | ($1,450) |
| Earnings | $0 | ($3,128) | ($6,256) | ($6,926) | ($7,420) | ($7,749) | ($8,058) | ($8,195) | ($9,015) | ($8,645) | ($8,056) | ($7,266) | ($6,155) |
| Total Capital | $15,550 | $12,422 | $9,294 | $8,624 | $8,130 | $7,801 | $7,492 | $7,355 | $6,535 | $8,905 | $9,494 | $10,284 | $11,395 |
| Total Liabilities and Capital | $15,550 | $13,437 | $10,309 | $10,606 | $10,112 | $8,816 | $9,474 | $8,370 | $8,618 | $10,505 | $11,094 | $10,917 | $12,995 |
| Net Worth | $15,550 | $12,422 | $9,294 | $8,624 | $8,130 | $7,801 | $7,492 | $7,355 | $6,535 | $8,905 | $9,494 | $10,284 | $11,395 |


