
Sew Distinct
Executive Summary
Sew Distinct is a sole proprietorship, owned by Sally Stitch. I sell original, high-quality custom quilts to discerning customers who give them as gifts or keep them as heirloom artworks. I do the customer response, design, piecing, and machine quilting; hand-quilted works are quilted by two independent local hand-quilters with roughly 20 years of experience, with whom I have negotiated per-piece prices. Sew Distinct quilts are manufactured in the owner’s home, and sold directly to my customers in northwest MyState, as well as over my website. I have several years of experience as a quilter. My strength is transforming even the vaguest ideas and descriptions from a customer into beautiful and meaningful quilt designs which both giver and recipient appreciate.
Sew Distinct works to provide custom, individually designed, warm and snuggly quilt art to customers who value originality but don’t have the time or skills to create such pieces on their own. By working with my customers in the design phase, I give them the satisfaction of having input into their gift or artwork, without the intense investment of their own time and labor that would be necessary to produce such a quilt themselves. The result is a personalized, usable, beautiful quilt which will be appreciated for generations to come.
I have been making quilts on commission as a hobby for three years now, and cannot keep up with the demand from new customers when doing this part-time. Starting I will open Sew Distinct as a full-time venture operated out of my home. My goals are to be able to pay myself and my independently contracted hand-quilters a decent wage for doing the work we love, and to repay a small start-up loan within two years of opening the business.
I will minimize the financial risks by requiring payment at the time of commission. For the customer, this means that they can take as long as they want to work with me on a design, but once we have agreed on the design, they must pay me in full for the quilt before I will begin creating it. This arrangement has been the one which works best for both sides in the past.
Most of the value of the quilts comes from the labor of designing and creating them, rather than from the materials (fabric, thread, etc.) of which they are composed. My start-up requirements are therefore fairly small (under $5,000):
- $1,000 of inventory (a basic fabric library)
- $1,000 for a second sewing machine
- $1,600 cash reserve
- $350 for website development
- $600 of various supplies, legal fees, etc.
I will invest $2,500 to start the business, and need another $2,050 for initial inventory of fabric and equipment. Based on current prices for my quilts, and the time needed to complete each one, I am forecasting sales of $45,700 in the first year. I expect to begin breaking even in the third month.

1.1 Mission
At Sew Distinct, I know that my customers value originality and high-quality work as much as they value their time. Using only a small portion of their time to provide me with the important information about their desires in commissioning a quilt, I will provide them with high-quality, custom-designed quilt art which can proudly be given as a gift, kept as an heirloom, and displayed prominently as a piece of artwork in a home or office.
1.2 Keys to Success
The keys to success for Sew Distinct are:
- Effectively establishing my reputation as an exceptional business: nationally I am unique in creating truly custom-designed quilts which do not rely on standard geometric quilt designs.
- Catering to my customers’ need to feel unique by emphasizing the personal nature of the customization process, which puts the customer, and his or her personality and feelings, at the center of the product.
- Quickly (5-10 weeks) turning out these finished custom quilts, both locally and through my website, for a price premium which enhances the prestige of the customized product.
- Maintaining originality of design and quality of skills to turn bulk, inexpensive fabrics and materials into high-end artworks which can bring high prices.
1.3 Objectives
- Create and sell 6 original, custom quilts per month, at prices which cover owner’s labor.
- Use contacts in local artisan groups and in my customer base to create successful word-of-mouth advertising.
- Establish a website to provide more information and to initiate non-local sales.
- Pay back initial investment with 10% interest in two years.
Company Summary
Sew Distinct is a sole proprietorship, owned by Sally Stitch. I sell original, high-quality custom quilts to discerning customers who give them as gifts or keep them as heirloom artworks. Sew Distinct also contracts with two local hand-quilters with roughly 20 years of experience, to do the quilting work on non-machine quilted pieces. Sew Distinct quilts are manufactured in the owner’s home, and sold directly to my customers in northwest MyState, as well as over my website. I have several years of experience as a quilter, and have an exceptional gift for transforming the vaguest ideas and descriptions into beautiful and meaningful quilt designs which both giver and recipient appreciate.
Sew Distinct works to provide custom, individually designed, warm and snuggly quilt art to customers who value originality but don’t have the time or skills to create such pieces on their own. By working with my customers in the design phase, I give them the satisfaction of having input into their gift or artwork, without the intense investment of their own time and labor that would be necessary to produce such a quilt. The result is a personalized, usable, beautiful quilt which will be appreciated for generations to come.
2.1 Start-up Summary
To begin my business, I will need a stock of materials, and time to begin the first commissions for the business, which are currently being negotiated with two interested buyers, who have offered to advertise my business through word of mouth with friends and family members. I plan to begin my official advertising campaign by placing brochures in likely locations around Sweetville and Nicetown, MyState and by creating my business website (see sample pages from website, attached).
Initial inventory consists of threads and a basic fabric library:
- between 1/4 and 1 yard each of 300 different cotton fabrics, covering hues and shades in all color groups
- 3-4 yards each of 25 different cotton backing and background fabrics
These fabrics will give me the necessary initial range to execute a wide variety of designs which rely on subtle color grading and variation for their effectiveness. The fabric library will be supplemented month by month, as designs are finalized and as particular fabrics need replacing, or new, more popular ones, become available.
Expenses include:
- a fabric board, at least 8’x8′, in order to lay out patterns vertically for display to clients and during the design process
- initial marketing materials (brochures and website)
- extra insurance to cover the value of the inventory and the sewing machines, as well as work in progress
I would also like to have a decent initial fund of cash in my business account, about $1,600, to cover unforeseen expenses such as repair of the sewing machine, or promising new advertising possibilities (like a local quilt convention) which could affect the cost of business independent of initial sales revenue.

The number in Other current assets is for a second sewing machine.
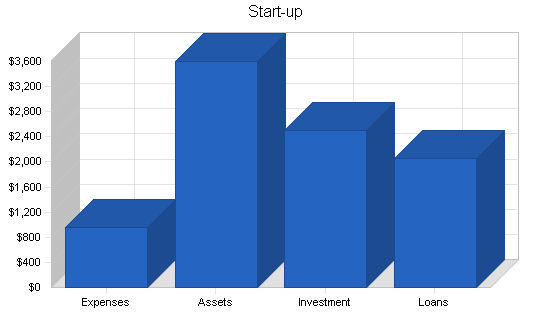
| Start-up Funding | |
| Start-up Expenses to Fund | $950 |
| Start-up Assets to Fund | $3,600 |
| Total Funding Required | $4,550 |
| Assets | |
| Non-cash Assets from Start-up | $2,000 |
| Cash Requirements from Start-up | $1,600 |
| Additional Cash Raised | $0 |
| Cash Balance on Starting Date | $1,600 |
| Total Assets | $3,600 |
| Liabilities and Capital | |
| Liabilities | |
| Current Borrowing | $2,050 |
| Long-term Liabilities | $0 |
| Accounts Payable (Outstanding Bills) | $0 |
| Other Current Liabilities (interest-free) | $0 |
| Total Liabilities | $2,050 |
| Capital | |
| Planned Investment | |
| Sally Stitch | $2,500 |
| Other | $0 |
| Additional Investment Requirement | $0 |
| Total Planned Investment | $2,500 |
| Loss at Start-up (Start-up Expenses) | ($950) |
| Total Capital | $1,550 |
| Total Capital and Liabilities | $3,600 |
| Total Funding | $4,550 |
| Start-up | |
| Requirements | |
| Start-up Expenses | |
| Legal | $50 |
| Fabric Board | $200 |
| Brochures | $50 |
| Insurance | $100 |
| Supplies: Rotary heads, pins, extra machine needles | $200 |
| Website Development | $350 |
| Total Start-up Expenses | $950 |
| Start-up Assets | |
| Cash Required | $1,600 |
| Start-up Inventory | $1,000 |
| Other Current Assets | $1,000 |
| Long-term Assets | $0 |
| Total Assets | $3,600 |
| Total Requirements | $4,550 |
2.2 Company Ownership
Sew Distinct is a sole proprietorship, owned by Sally Stitch.
2.3 Company Locations and Facilities
The company is located in the home of Sally Stitch. Some quilting work is done off-premises, in the home of the contracted hand-quilters. All locations are maintained smoke-free, since fabric items can easily absorb odors.
Products and Services
Sew Distinct manufactures all-cotton, high-quality, custom quilts with original designs. Through my design process, my customers work with me to provide the information, ideas, and sometimes even images (like photographs) that allow me turn their intentions into beautiful works of quilt art. When completed, my quilts are hand-delivered or shipped securely to my clients, or, if they prefer, to the intended recipient of the gift, along with instructions on the proper care and maintenance of their heirloom-quality quilt.
3.1 Product and Service Description
I make six different quilt options, which are differentiated by size into “Crib Quilts” (for babies and children), Queen-Size Quilts, and King-Sized Quilts, and by quilt type (machine quilted or hand quilted). Use of hand-dyed fabrics, larger sizes, and special requests or processes (including photo transfer, etc.) will require additional charges and completion time.
Crib Quilts
| Quilting Type: | Price | Time |
| Machine | $600 | 3-4 weeks |
| Hand | $750 | 4-5 weeks |
Queen-Sized Quilts
| Quilting Type: | Price | Time |
| Machine | $1,000 | 6-7 weeks |
| Hand | $1,350-1,500 | 8-9 weeks |
King-Sized Quilts
| Quilting Type: | Price | Time |
| Machine | $1,500 | 7-8 weeks |
| Hand | $1,750-2,000 | 9-10 weeks |
Price and time variables are determined mostly by the intricacy of the image and quilting designs requested, and reflect additional labor costs. Time to finish does not include shipping time, which will be determined (and paid for) by the client. Since these are custom artworks, I will encourage my local clients to view the finished quilt themselves before sending it to a recipient, and may even provide delivery services for local clients.
For customers ordering over the Web, I will make arrangements to ship via their preferred shipper, but will recommend insured delivery with signature and confirmation via UPS and Fed-Ex, since the quilts are irreplaceable. When I ship, rather than deliver, I will provide the primary wrapping of the quilt, first in un-dyed cotton, then in waterproof plastic wrappers within a larger, padded box, to ensure safe arrival in the quilt’s original condition. I WILL NOT ship any quilt without delivery confirmation or insurance, as each quilt represents roughly 1/6 of my monthly earnings.
3.2 Competitive Comparison
There are only a handful of other businesses offering custom-designed quilts, and my competitive advantage stems from my design expertise. Many businesses which claim to offer “custom quilts” are really just offering customers a choice between several pre-determined original designs. I, on the other hand, can help a customer generate ideas, even take basic information about the color of a child’s room and his favorite book and create a completely new design which is tailored to the customer’s taste. And, most importantly, my design features emphasize my client’s ideas and feelings, and my skills, by creating quilted pictures, rather than the traditional, geometric quilt designs other businesses offer. My real challenge is simply to get my name out there, because I am offering services far more complete than most other quilt makers.
My closest competitors are local pre-manufactured quilt retailers, other quilt-selling websites, and the do-it-yourself quilting market. However, none of these competitors offers the combination of factors which define my niche. Retailers, both local and national via websites, offering finished quilts allow the customer only to choose However pre-determined designs, with customization limited at most to color choices. The only other option for custom-designed quilts, offered through quilting classes and books, requires an enormous investment of time on the part of the customer.
Indirect competitors include other personalized services and gift options, from season tickets at a baseball game to other art media, including sculpture, paintings, and drawings. My challenge is both to enable customers to see personalized quilts as an appropriate choice, and then to demonstrate the superior quality of my quilts.
Sew Distinct fills a unique niche, offering the status and personalization available with a fully custom quilt, without a major investment of the customer’s time. I am therefore targeting those busy professionals (often called the Bourgeoise Bohemians) who see prestige in gifts and purchased artwork not solely in its expense, but by the extent to which it reflects their values: handmade or unique, rather than mass-produced; consisting of all-natural materials, rather than synthetics; made by (and thus funding and supporting) an identifiable small-scale artisan rather than a large corporation; and reflecting sincere feelings of love and caring, rather than commercialized, standardized emotions. (More information on my target market can be found in the Market Analysis section, below.)
3.3 Sales Literature
At the end of this plan are sample brochures such as those I will distribute at local arts and quilting retailers. These brochures contain pictures of some previous quilts, as well as customer comments on the high quality of my workmanship and willingness to customize my designs.
Each brochure also includes the URL for my website. Sample pages from the website have been printed out and attached to the plan as well.
3.4 Fulfillment
I buy most of my fabrics from the local division of a national fabric chain, to keep down costs. Since most of the design value comes from the combination of fabrics, my ideal fabric supply provides a broad range of styles, colors, and textures available in small (1/4 yard) to very large (entire roll) amounts. The local fabric store in this larger chain meets this need, and their low prices ($3-8/yard) for fabric ensures a good return on the fabric expense.
Occasionally, customers may want a particular theme or style in the fabric choices, so I also maintain the option of shopping from other local fabric retailers, and of charging a premium for specialty or special-order fabrics (locally hand-dyed artisan cottons and silks, brand-name fabrics from Disney, Mary Engelbreit, etc.). I am an experienced fabric dyer, and have a small library of hand-dyed fabrics which I will contribute to the business, and expand as necessary. Many of the artisan fabrics are available through craftspeople here in Sweetville, while the national ones are most available online.
3.5 Technology
My business as a whole is a relatively low-tech establishment in terms of manufacturing, since I stress the value of individually designed and hand-crafted quilts. However, my use of a website will attract more technologically-savvy customers, and I anticipate possibilities for design which incorporate photos and other images which are emailed to me by the customer, enabling their direct input into the finished design.
Trends Tracking:
I will use a database to track my orders and to spot trends in customer requests. For example, I may find that Web customers more often request customized text embroidery on a quilt, while my local customers want to choose individual fabrics from my collection. Keeping track of these trends will enable me to tailor my marketing approaches to different customer groups.
3.6 Future Products and Services
My products are driven directly by customer demand. Whatever they request, within reason, I will give them. So, each design, each quilt is the direct result of suggestions or requests from the customer, and future products will reflect any changes in customer preferences.
In the future, once my business is established, I may take some design time to create a series of stock elements which can be combined in different ways to provide less expensive options for customers who want customization, but cannot afford to fully commission their own quilt.
Eventually, I would like to employ other local craftspeople to do the piecing and quilting of the artworks, so that I can focus on design and customer interaction. However, this is a long-term goal (5-10 years away), and will depend on increasing demands for my products which require additional labor.
Market Analysis Summary
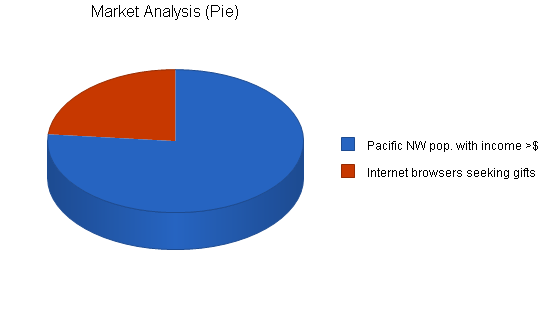
Quilts are not only decorative; they can be cherished gifts and investments in artwork. Sew Distinct will target two separate groups – gift buyers, particularly people buying quilts for new children and grandchildren, and art buyers, who are looking for a piece of usable art which they can keep and pass on to later generations or sell in the future as an antique. Because such high quality quilts are more labor and time intensive to make, they are more expensive than ordinary crib or bed coverlets. The market most interested in my products will, therefore, be people with an above average level of disposable income, who value quality workmanship and original – even custom – design work in the gifts and decorations they choose to purchase. The Pacific Northwest has a high percentage of such consumers who support a number of craftsmen and women, but very few of these crafts involve high quality textile work other than clothing. This is a market niche that can and should be tapped.
Local Sales:
Art World News noted in a September, 2000 article on Seattle’s art galleries that the Pacific Northwest high-end art and gift buying population, in particular, places a high value on supporting local artists. According to the 2000 census, the Pacific Northwest has almost 1 and a half million residents with incomes over $50,000, including 326,142 residents with incomes over $100,000 per year, who would easily be able to afford my products. Within the Pacific Northwest, the vast majority of high-income residents are clustered in urban areas such as the Nicetown and Seattle metropolitan areas, and larger college cities like Sweetville. As these also tend to contain more liberal populations who express interest in issues such as art, I am focusing my initial local marketing on the Sweetville and Nicetown metro areas, rather than traveling to more rural towns.
Internet Sales:
A recent study by the Pew Center reported that nationally, 43% of all Internet users had household incomes of at least $50,000. This means that almost half of the people with access to my website are in the target demographic of wealthy surfers who would be able to afford one of my products. In the Pacific Northwest, an internet-savvy area, only 38% of all Internet users had such high incomes, meaning that my marketing strategy locally needs to focus on areas where I can guarantee I will be contacting a high percentage of my Bourgeoise Bohemian customers.
A Wordtracker search on “gifts” reveals that approximately 8,000 people per month are looking for “gifts,” “personalized gifts,” “unique gift ideas,” and “baby gifts.” By including the right keywords in my website, and promoting the idea of custom quilts as a personalized gift idea, I can make my services more visible to these potential customers.
The following table is a conservative estimate of the numbers of potential customers in my two market approaches – local, wealthy Pacific Northwest clients and Internet clients.
The first row shows the number of Pacific Northwest residents with an income greater than $100,000, who would be easily able to afford my products, and be more likely to seek out personalized, high-end gifts and artwork. While I do not believe that only such wealthy clients will purchase my products, I am planning very conservatively here. The second row shows the number of Internet users searching for “gifts,” “unique “gifts,” and so on, at two popular search engines. This population, at least 25% of which is likely to have an income greater than $75,000 per year, is seeking products like ours. A further analysis of these groups follows below.
4.1 Market Segmentation
My market, aside from geographical divisions (ie., Pacific Northwest versus Internet customers), is generally divisible into two main categories: people who are buying gifts for others, and those who are buying a quilt as a “gift” to themselves or an investment in heirloom-quality quilt art.
I hope that many of my customers, having purchased one quilt from me, will come back to me for more unique gifts; I expect that my long-term customers will thus move back and forth customers the two categories. Customers will generally encounter me with only one of the two agendas in mind, and I have developed different strategies to appeal to these different needs.
Gift Buyers:
Potential customers seeking to buy a gift are looking for something that speaks of their own taste, but more than that, of their intimate knowledge of, and thoughtfulness toward, the gift recipient. For my customers, Sew Distinct becomes the magic medium by which their caring feelings towards the recipient are made manifest in a tactile, tangible object, which can then be passed on to a friend or family member who will cherish it (and the giver) forever. The key to this transformation is the design process. My customers give me as much or as little information about themselves and the gift recipient as they wish – the more detail, the better the quilt can reflect the unique personalities, wishes, and love of both people. I have created basic forms and questions for all my prospective customers to consider, but in-person consultations, supplemented by email and telephone conversations with the designer for my website customers, will be the selling point. My customers are getting personalized services, and they will feel pampered and catered to.
Art Buyers:
These customers are buying my quilts to display in their homes and offices, to declare to their guests, their clients, and their colleagues that they value high-quality, original art with a hand-made feel. These clients may send me photographs of the locations in which they would like to hang their quilts, and consult with me about their taste in subjects, colors, and styles. My design services for art-buyers are more akin to interior designing than to gift-making, as I will try to make quilts that both co-ordinate with, and yet stand out from, their surroundings. These quilts require the same sort of consulting as gift quilts, but with a focus on the buyer only, and not a recipient. These quilts may depict aspects of the buyer’s hobbies or occupation. They may incorporate meaningful elements from the buyer’s family history or professional journeys. They may depict treasured pets or family members, living or passed. These customers are commissioning artworks that will beautifully represent some aspect of their lives of which they are proud.
| Market Analysis | |||||||
| Year 1 | Year 2 | Year 3 | Year 4 | Year 5 | |||
| Potential Customers | Growth | CAGR | |||||
| Pacific NW pop. with income >$100,000/year | 3% | 326,142 | 335,926 | 346,004 | 356,384 | 367,076 | 3.00% |
| Internet browsers seeking gifts | 5% | 100,000 | 105,000 | 110,250 | 115,763 | 121,551 | 5.00% |
| Total | 3.48% | 426,142 | 440,926 | 456,254 | 472,147 | 488,627 | 3.48% |
4.2 Target Market Segment Strategy
By focusing on gift-givers and art-buyers within the Bourgeoise Bohemian market, I am remedying a major paradox these clients face, and taking advantage of my unique market niche.
- These customers value high-quality, non-mass produced goods, but don’t have the time to make them.
- I specialize in individualized original designs for people who can afford to pay for high-end quilts.
Both segments require some level of input into the design phase of the product in order to obtain the kind of personalized feel they are looking for, and my expertise in translating their ideas and feelings into images fits this need perfectly. In addition, the personalization services add value to the product far beyond the high quality of my workmanship by making my customers – and the quilt recipients – feel special and unique. Market research into Bo-bo trends identifies this need to feel unique as a highly motivating factor in buying choices.
Because these two different segments of the customer base may approach their initial searches via different routes, I am locating brochures and advertisements (locally) in three places:
- general upscale or high-end consumer areas like organic grocery stores, local symphony pamphlets, and upscale day care facilities
- gift-centered retail centers such as artisan co-ops, holiday markets, and upscale shopping centers
- art-centered retail centers such as antique stores and art galleries
To target both segments on my website, I will include searchable keywords such as “personalized gifts,” “baby gifts,” “custom artwork,” and “gift ideas.”
4.2.1 Market Needs
“Do you believe that spending $15,000 on a media center is vulgar, but that spending $15,000 on a slate shower stall is a sign that you are at one with the Zen-like rhythms of nature?” In his book on the new counterculture-as-mainstream elite, David Brooks describes a typical grocery store catering to discriminating Bourgeoise Bohemians: “The visitor to Fresh Fields is confronted with a big sign that says ‘Organic Items today: 130.’ This is like a barometer of virtue. If you came in on a day when only 60 items were organic, you’d feel cheated. But when the number hits the three figures, you can walk through the aisles with moral confidence.” In Sweetville and Nicetown, this scene takes place daily in stores like Oasis, Market of Choice, and Trader Joe’s.
These sorts of consumers abound in the Pacific Northwest, and as Brooks points out, their wealth and status are based on education, brains, and merit, rather than on inherited wealth. This new elite values high-quality, time-intensive products that are visibly non-mass-produced, and this value is understood as a moral, not just political, calculation. While such consumers have numerous options for high-end foods, bath products, furniture, and so on, they do not have a great deal of free time, because their wealth and their lifestyles involve the full-time work of all adult members of the family (preferably in some socially-conscious or technologically advanced field).
I am offering these kinds of consumers access to individually crafted, locally made, unique, high-quality quilt art. In buying my product, my customers get the kind of personalized gift they want, and can pay someone else to invest the time needed to make the item, since their own time is already full. Quilts, in particular, speak to their ideas about tradition and slow, time-intensive labors of love that these customers may associate with their own mothers and grandmothers, and which the women in particular may feel guilty for not being involved in themselves. For a price premium, I will make an original, usable work of art that they can be proud to give to their discriminating friends and families, from its all-cotton fabric and batting to the brochure which describes my small, local artisan business.
4.2.2 Market Trends
Quilting used to be seen as an old-fashioned, rather fuddy-duddy kind of endeavor. Recent exposure to issues in the historical aspects of quilting as a forum for women’s expression has begun transforming this thinking, and quilting is on the way to being recognized as a valuable (and occasionally subversive) form of mostly-female art. This kind of countercultural interpretation will, of course, appeal to my market segment.
In addition, Bo-bo’s such as those I am targeting are beginning more and more to identify their socially-conscious consumerism as rooted in local buying, which is an advantage when selling in the Pacific Northwest market. I anticipate that some of my local customers will initially encounter me online at my website when searching for locally made gift products, and will only then come to visit me in person.
4.2.3 Market Growth
With the increasing use of technology in everyday business endeavors, there is expected to be an ongoing growth in the number of good-paying jobs utilizing creative and critical thinking skills, the characteristics that define my target market (the bourgeoise bohemians). I also expect that as the economy continues to recover, high-income consumers will feel more and more confident about placing some of their disposable income into more decorative and luxury items, such as the custom quilts I am offering. Since the income of many of the urban elite residents of the Pacific bourgeoise bohemians is tied directly or indirectly to the technology sector, improvements in revenue among high-tech industries in the next 5 years will increase my market segment, as well as their comfort level concerning large purchases. Art-buying in the Pacific Northwest, in particular, seems tied to the fates of technology firms, according to Seattle art gallery owners. When stock goes up, the young, high-tech employees there seem more willing to invest in items like artwork, rather than hanging onto their cash in case of hard times.
4.3 Service Business Analysis
Sew Distinct is part of the handicrafts industry, in which product manufacturers work directly with individual consumers to create custom goods from a set of pre-determined materials (in this case, fabric, thread, and batting). I will not distribute through retailers, since that would not allow for the custom design process that is the heart of my business, but I will network with handicrafts retailers to enhance advertising (for example, joining local artisan co-ops). As a business offering custom-designed, high-end, usable artworks, I am competing not only with other quilt makers, but with all other artisans producing high-quality gift items. The advantages my product offers over my competitors include the personalized design process, and the nature of the product itself – would you rather give a gift the recipient can wear or look at, or one that she can snuggle up under and feel as warm as when she hugged you to thank you for the gift? Sew Distinct quilts are tangible, huggable love.
4.3.1 Competition and Buying Patterns
The market segments I am targeting are clearly defined above, in the Market Analysis sections. Such customers shop for items such as mine primarily by word of mouth, although they do buy from galleries and are influenced by ads in magazines with a upscale, socially-responsible edge.
Strategy and Implementation Summary
I hope that many of my customers, having purchased one quilt from me, will come back to me for more unique gifts; I expect that my long-term customers will thus move back and forth between the two categories. Customers will generally encounter me with only one of the two agendas in mind, and I have developed different strategies to appeal to these different needs.
5.1 Value Proposition
At Sew Distinct, I understand that you are busy, but that your limited time doesn’t reflect your unlimited love and caring for your friends and family. I have the time and the skills to turn your ideas and feelings into a snuggly, warm, and beautiful quilt that you will be proud to give as a gift or display on your wall, an artwork which can be appreciated for generations to come. My prices are high because they reflect the many hours of work I spend designing, piecing, and quilting your original work of art. Buying a quilt from me is an investment – in your relationships with your gift recipient, in the value of the artwork, and in your own preferences and personal style.
5.2 Competitive Edge
Sew Distinct fills a unique niche, offering the status and personalization available with a fully custom quilt, without a major investment of the customer’s time. I am therefore targeting those busy professionals (the so-called Bourgeoise Bohemians) who see prestige in gifts and purchased artwork not solely in its expense, but by the extent to which it reflects their values. My quilts are:
- handmade or unique, rather than mass-produced;
- consisting of all-natural materials, rather than synthetics;
- made by (and thus funding and supporting) an identifiable small-scale artisan rather than a large corporation;
- and reflecting sincere feelings of love and caring, rather than commercialized, standardized emotions.
5.3 Marketing Strategy
My marketing strategy relies on word of mouth, an inexpensive, attractive, and fully accessible display space (my website), and a small amount of ad placement.
5.3.1 Promotion Strategy
My promotion strategy is threefold:
- to locate brochures and ads about my product in areas where my customers normally shop: high-end organic grocers, artisan co-ops, local bookstores, and the like.
- to spread word-of-mouth among friends and family working in the kinds of high-tech and high-income, socially-conscious jobs that my customers inhabit
- to create and promote a website, linked to other quilting sites, to Pacific-area quilting promotions, and to sites about local crafts
In addition to these direct promotions, I have arranged for a selection of my quilts to be sold at a local artisan’s fair, where information about the possibility of buying a custom quilt will be prominently displayed.
5.3.2 Pricing Strategy
My pricing is high not only to compensate for the labor involved in creating the product, but to establish my custom gifts as a luxury good, with all the status considerations that involves. My customers are paying for the product, but they are also paying for the prestige of being able to commission an original work of art.
5.4 Sales Strategy
My sales strategies will focus on the personalization process by responding to all potential customers’ inquiries in person in the medium they most prefer – emails will be responded to by email or phone, phone calls will be returned by phone calls and by face-to-face visits. I have a large collection of existing quilt designs to show potential clients, so that they can see the quality of the work offered. Ideally, these consultations will take place in the owner’s home, where my customers can browse through the fabric library to get inspirations, and can form a personal connection to the owner/designer, and imagine the contract as the beginning of a creative partnership.
5.4.1 Sales Forecast
In addition to the relatively minor direct costs of fabric, thread, notions, etc., used up in each quilt, I have another direct cost for hand-quilted pieces which is paid directly to the independently contracted hand quilters. For each hand-quilted crib quilt, the quilter receives $150; for each queen-sized, she receives $350; and for each king-sized, $400. These additional non-inventory direct costs are listed in the Profit and Loss table.
Based on current prices for my quilts, and the time needed to complete each one, I am forecasting sales of $45,700 in the first year.

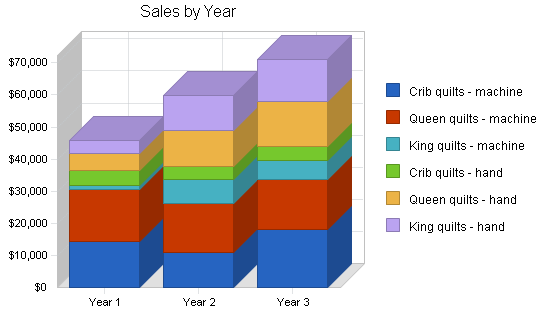
| Sales Forecast | |||
| Year 1 | Year 2 | Year 3 | |
| Unit Sales | |||
| Crib quilts – machine | 24 | 18 | 30 |
| Queen quilts – machine | 16 | 15 | 15 |
| King quilts – machine | 1 | 5 | 4 |
| Crib quilts – hand | 6 | 5 | 6 |
| Queen quilts – hand | 4 | 8 | 10 |
| King quilts – hand | 2 | 6 | 7 |
| Total Unit Sales | 53 | 57 | 72 |
| Unit Prices | Year 1 | Year 2 | Year 3 |
| Crib quilts – machine | $600.00 | $605.00 | $605.00 |
| Queen quilts – machine | $1,000.00 | $1,025.00 | $1,025.00 |
| King quilts – machine | $1,500.00 | $1,505.00 | $1,505.00 |
| Crib quilts – hand | $750.00 | $755.00 | $755.00 |
| Queen quilts – hand | $1,375.00 | $1,405.00 | $1,405.00 |
| King quilts – hand | $1,900.00 | $1,855.00 | $1,855.00 |
| Sales | |||
| Crib quilts – machine | $14,400 | $10,890 | $18,150 |
| Queen quilts – machine | $16,000 | $15,375 | $15,375 |
| King quilts – machine | $1,500 | $7,525 | $6,020 |
| Crib quilts – hand | $4,500 | $3,775 | $4,530 |
| Queen quilts – hand | $5,500 | $11,240 | $14,050 |
| King quilts – hand | $3,800 | $11,130 | $12,985 |
| Total Sales | $45,700 | $59,935 | $71,110 |
| Direct Unit Costs | Year 1 | Year 2 | Year 3 |
| Crib quilts – machine | $40.00 | $40.00 | $40.00 |
| Queen quilts – machine | $80.00 | $100.00 | $100.00 |
| King quilts – machine | $100.00 | $100.00 | $100.00 |
| Crib quilts – hand | $40.00 | $40.00 | $40.00 |
| Queen quilts – hand | $80.00 | $80.00 | $80.00 |
| King quilts – hand | $100.00 | $100.00 | $100.00 |
| Direct Cost of Sales | |||
| Crib quilts – machine | $960 | $720 | $1,200 |
| Queen quilts – machine | $1,280 | $1,500 | $1,500 |
| King quilts – machine | $100 | $500 | $400 |
| Crib quilts – hand | $240 | $200 | $240 |
| Queen quilts – hand | $320 | $640 | $800 |
| King quilts – hand | $200 | $600 | $700 |
| Subtotal Direct Cost of Sales | $3,100 | $4,160 | $4,840 |
Web Plan Summary
Sew Distinct’s website will primarily showcase the range of styles the owner has used in the past. In addition to the gallery, the website will offer information on pricing, the design process and expected customer participation.
The owner has some experience designing websites, but will be quite busy getting other aspects of the business ready for opening. I have hired a colleague with extensive website design experience to create the preliminary setup, based on layouts I have specified. The site will be hosted by a hosting provider with whom I am familiar, who allows relatively inexpensive upgrades in space and features, should I want to expand the site in the future. Since the purpose of the site is mainly marketing related, and no actual sales are transacted there, the focus will be on providing useful information to potential clients, sharing stories and images of past quilts, and offering tips and encouragement to other creative and art quilters out in cyberspace. The website will also include a list of upcoming appearances and lectures by the owner.
6.1 Website Marketing Strategy
The website URL will be included on all my brochures and business cards. I will give a couple of cards to every client along with their completed quilt, with the request that they pass on them on to friends and relatives who might be interested in my quilts, if they were satisfied with their own. This has worked so well in the past that the current website (a one-page bare-bones site) already gets over 10 hits a week.
6.2 Development Requirements
The development requirements for the website are external – for $350, my colleague will design, create, upload, and launch a revised website for Sew Distinct. He will use Dreamweaver to create the site, and estimates that time from initial design to launch will take about three weeks, since I have already approved the layout and map.
Personnel Plan
The company has only one full-time worker – the owner. Sew Distinct will also contract with two independent quilters to do quilting work on the hand-quilted pieces. The portion of the quilt price paid out to the hand-quilters is listed in the Profit and Loss table, under Direct Cost of Sales.
The owner has several years of experience at marketing, designing, and producing custom quilts for others. She has been working part-time at this business for the last three years; over the last year, demand has increased to the point where she can no longer do quilts simply as a hobby without saying “no” to 3/4 of the commission requests. She will use her contacts and word-of-mouth advertising to turn this into a full-time business.
One of the best contacts she currently has is with two local hand-quilters, through the local quilting association. Both have done contracted work for her before and are very interested in taking on a more demanding schedule of commissions. The commissions listed in the Sales Forecast ($150 for a crib quilt, $350 for a queen, $400 for a king) have been worked out already with the contracted quilters. One of these women is retired, and one is a housewife whose children have just left for college. Both make use of advanced hand-quilting techniques and are very skilled; they have experience with a range of styles, fabrics, and thread types.
My pay will cover living expenses and the cost of adding me to my husband’s health insurance policy. Since any illness on my part means an immediate drop in income from the business, it is important for me to aggressively maintain my health.
Financial Plan
Sew Distinct will begin commissions in January, 2006, with the first quilts to be completed within 3-6 weeks after commission.
8.1 Important Assumptions
I anticipate a steady and increasing interest in quilt commissions, based on the trends I have seen in the last several years. The financial plan is built on the tax and interest rates shown below.
| General Assumptions | |||
| Year 1 | Year 2 | Year 3 | |
| Plan Month | 1 | 2 | 3 |
| Current Interest Rate | 10.00% | 10.00% | 10.00% |
| Long-term Interest Rate | 10.00% | 10.00% | 10.00% |
| Tax Rate | 30.00% | 30.00% | 30.00% |
| Other | 0 | 0 | 0 |
8.2 Key Financial Indicators
I expect a steady but slow rise in sales over the next three years, up to the maximum capacity of 6 quilts per month. As the business and its reputation grows, I will be able to direct clients toward the best quilt for them more efficiently, and streamline the design and production processes.

8.3 Break-even Analysis
The break-even analysis shows the projected break-even point for Sew Distinct, taking into account all variable and fixed costs, including fees paid to the contracted quilters. I will pass the break-even point in the third month, and be profitable thereafter.

| Break-even Analysis | |
| Monthly Units Break-even | 3 |
| Monthly Revenue Break-even | $2,613 |
| Assumptions: | |
| Average Per-Unit Revenue | $862.26 |
| Average Per-Unit Variable Cost | $116.98 |
| Estimated Monthly Fixed Cost | $2,259 |
8.4 Projected Profit and Loss
The Profit and Loss for Sew Distinct is encouraging. In addition to paying good wages and fees to the owner and the contracted hand quilters, the business will be able to pay for the necessary insurance, taxes, loan interest, and a small marketing budget, and still make a modest profit.
The projected marketing and promotion expenses are low, because the owner already has an established reputation and clientele, from her part-time forays into quilting in the last few years. The marketing budget includes items like advertisements in local papers and magazines, church and synagogue directories (a great source for customers seeking gifts!) and yellow page ads, as well as brochures in likely local venues.


| Pro Forma Profit and Loss | |||
| Year 1 | Year 2 | Year 3 | |
| Sales | $45,700 | $59,935 | $71,110 |
| Direct Cost of Sales | $3,100 | $4,160 | $4,840 |
| Contracted Hand-Quilter | $3,100 | $5,950 | $7,200 |
| Total Cost of Sales | $6,200 | $10,110 | $12,040 |
| Gross Margin | $39,500 | $49,825 | $59,070 |
| Gross Margin % | 86.43% | 83.13% | 83.07% |
| Expenses | |||
| Payroll | $24,000 | $28,000 | $30,000 |
| Sales and Marketing and Other Expenses | $425 | $400 | $600 |
| Depreciation | $0 | $0 | $0 |
| Mortgage % for quilting room | $1,800 | $1,800 | $1,800 |
| Website hosting and maintenance | $180 | $190 | $200 |
| Insurance | $200 | $300 | $300 |
| Payroll Taxes | $0 | $0 | $0 |
| Travel to conventions and quilting events | $500 | $2,000 | $2,000 |
| Total Operating Expenses | $27,105 | $32,690 | $34,900 |
| Profit Before Interest and Taxes | $12,395 | $17,135 | $24,170 |
| EBITDA | $12,395 | $17,135 | $24,170 |
| Interest Expense | $150 | $48 | $0 |
| Taxes Incurred | $3,674 | $5,126 | $7,251 |
| Net Profit | $8,572 | $11,961 | $16,919 |
| Net Profit/Sales | 18.76% | 19.96% | 23.79% |
8.5 Projected Cash Flow
The Cash Flow table and chart show my projected cash position. The table also shows the planned repayment of the start-up loan.

| Pro Forma Cash Flow | |||
| Year 1 | Year 2 | Year 3 | |
| Cash Received | |||
| Cash from Operations | |||
| Cash Sales | $45,700 | $59,935 | $71,110 |
| Subtotal Cash from Operations | $45,700 | $59,935 | $71,110 |
| Additional Cash Received | |||
| Sales Tax, VAT, HST/GST Received | $0 | $0 | $0 |
| New Current Borrowing | $0 | $0 | $0 |
| New Other Liabilities (interest-free) | $0 | $0 | $0 |
| New Long-term Liabilities | $0 | $0 | $0 |
| Sales of Other Current Assets | $0 | $0 | $0 |
| Sales of Long-term Assets | $0 | $0 | $0 |
| New Investment Received | $0 | $0 | $0 |
| Subtotal Cash Received | $45,700 | $59,935 | $71,110 |
| Expenditures | Year 1 | Year 2 | Year 3 |
| Expenditures from Operations | |||
| Cash Spending | $24,000 | $28,000 | $30,000 |
| Bill Payments | $11,648 | $19,107 | $23,896 |
| Subtotal Spent on Operations | $35,648 | $47,107 | $53,896 |
| Additional Cash Spent | |||
| Sales Tax, VAT, HST/GST Paid Out | $0 | $0 | $0 |
| Principal Repayment of Current Borrowing | $1,100 | $950 | $0 |
| Other Liabilities Principal Repayment | $0 | $0 | $0 |
| Long-term Liabilities Principal Repayment | $0 | $0 | $0 |
| Purchase Other Current Assets | $0 | $0 | $0 |
| Purchase Long-term Assets | $0 | $0 | $0 |
| Dividends | $0 | $0 | $0 |
| Subtotal Cash Spent | $36,748 | $48,057 | $53,896 |
| Net Cash Flow | $8,952 | $11,878 | $17,214 |
| Cash Balance | $10,552 | $22,430 | $39,644 |
8.6 Projected Balance Sheet
The Projected Balance Sheet is quite solid. I do not project any real trouble meeting my debt obligations. As business progresses, I will build up my cash reserves so that I can take a vacation or sick time starting in the third year. I would also like to be able to pay my quilters bonuses for their 20th quilt completed, 30th quilt, and so on, although these numbers are not included in the financials of the plan – actual amount will depend on achieving the sales goals set forth, so I’m leaving myself some flexibility.
The ultimate goal is to create a suitable net worth to see myself into retirement within 20 years, since this is not the sort of business that can be sold to another person. Most of my assets are cash, and I expect this trend to continue in the future, given the nature of the business.
| Pro Forma Balance Sheet | |||
| Year 1 | Year 2 | Year 3 | |
| Assets | |||
| Current Assets | |||
| Cash | $10,552 | $22,430 | $39,644 |
| Inventory | $224 | $301 | $350 |
| Other Current Assets | $1,000 | $1,000 | $1,000 |
| Total Current Assets | $11,776 | $23,731 | $40,994 |
| Long-term Assets | |||
| Long-term Assets | $0 | $0 | $0 |
| Accumulated Depreciation | $0 | $0 | $0 |
| Total Long-term Assets | $0 | $0 | $0 |
| Total Assets | $11,776 | $23,731 | $40,994 |
| Liabilities and Capital | Year 1 | Year 2 | Year 3 |
| Current Liabilities | |||
| Accounts Payable | $704 | $1,648 | $1,992 |
| Current Borrowing | $950 | $0 | $0 |
| Other Current Liabilities | $0 | $0 | $0 |
| Subtotal Current Liabilities | $1,654 | $1,648 | $1,992 |
| Long-term Liabilities | $0 | $0 | $0 |
| Total Liabilities | $1,654 | $1,648 | $1,992 |
| Paid-in Capital | $2,500 | $2,500 | $2,500 |
| Retained Earnings | ($950) | $7,622 | $19,583 |
| Earnings | $8,572 | $11,961 | $16,919 |
| Total Capital | $10,122 | $22,083 | $39,002 |
| Total Liabilities and Capital | $11,776 | $23,731 | $40,994 |
| Net Worth | $10,122 | $22,083 | $39,002 |
8.7 Business Ratios
The following table outlines some of the more important ratios from the Quilting for Individuals industry. The final column, Industry Profile, details specific ratios based on the industry as it is classified by the Standard Industry Classification (SIC) code, 7299.0801. My ratios differ from the industry standard in several areas; this is largely because this closest industry type more accurately fits what my subcontracted quilters are doing, and does not represent businesses engaged in creating new gifts/works of art from scratch.
| Ratio Analysis | ||||
| Year 1 | Year 2 | Year 3 | Industry Profile | |
| Sales Growth | 0.00% | 31.15% | 18.65% | 2.83% |
| Percent of Total Assets | ||||
| Inventory | 1.90% | 1.27% | 0.85% | 5.59% |
| Other Current Assets | 8.49% | 4.21% | 2.44% | 41.81% |
| Total Current Assets | 100.00% | 100.00% | 100.00% | 64.21% |
| Long-term Assets | 0.00% | 0.00% | 0.00% | 35.79% |
| Total Assets | 100.00% | 100.00% | 100.00% | 100.00% |
| Current Liabilities | 14.05% | 6.94% | 4.86% | 25.69% |
| Long-term Liabilities | 0.00% | 0.00% | 0.00% | 21.65% |
| Total Liabilities | 14.05% | 6.94% | 4.86% | 47.34% |
| Net Worth | 85.95% | 93.06% | 95.14% | 52.66% |
| Percent of Sales | ||||
| Sales | 100.00% | 100.00% | 100.00% | 100.00% |
| Gross Margin | 86.43% | 83.13% | 83.07% | 100.00% |
| Selling, General & Administrative Expenses | 68.93% | 72.65% | 72.76% | 73.60% |
| Advertising Expenses | 0.00% | 0.00% | 0.00% | 1.25% |
| Profit Before Interest and Taxes | 27.12% | 28.59% | 33.99% | 3.49% |
| Main Ratios | ||||
| Current | 7.12 | 14.40 | 20.58 | 1.77 |
| Quick | 6.98 | 14.22 | 20.40 | 1.33 |
| Total Debt to Total Assets | 14.05% | 6.94% | 4.86% | 65.50% |
| Pre-tax Return on Net Worth | 120.98% | 77.38% | 61.97% | 4.61% |
| Pre-tax Return on Assets | 103.98% | 72.01% | 58.96% | 13.36% |
| Additional Ratios | Year 1 | Year 2 | Year 3 | |
| Net Profit Margin | 18.76% | 19.96% | 23.79% | n.a |
| Return on Equity | 84.69% | 54.17% | 43.38% | n.a |
| Activity Ratios | ||||
| Inventory Turnover | 7.37 | 15.86 | 14.88 | n.a |
| Accounts Payable Turnover | 17.54 | 12.17 | 12.17 | n.a |
| Payment Days | 27 | 21 | 27 | n.a |
| Total Asset Turnover | 3.88 | 2.53 | 1.73 | n.a |
| Debt Ratios | ||||
| Debt to Net Worth | 0.16 | 0.07 | 0.05 | n.a |
| Current Liab. to Liab. | 1.00 | 1.00 | 1.00 | n.a |
| Liquidity Ratios | ||||
| Net Working Capital | $10,122 | $22,083 | $39,002 | n.a |
| Interest Coverage | 82.63 | 360.74 | 0.00 | n.a |
| Additional Ratios | ||||
| Assets to Sales | 0.26 | 0.40 | 0.58 | n.a |
| Current Debt/Total Assets | 14% | 7% | 5% | n.a |
| Acid Test | 6.98 | 14.22 | 20.40 | n.a |
| Sales/Net Worth | 4.52 | 2.71 | 1.82 | n.a |
| Dividend Payout | 0.00 | 0.00 | 0.00 | n.a |
Appendix
| Sales Forecast | |||||||||||||
| Month 1 | Month 2 | Month 3 | Month 4 | Month 5 | Month 6 | Month 7 | Month 8 | Month 9 | Month 10 | Month 11 | Month 12 | ||
| Unit Sales | |||||||||||||
| Crib quilts – machine | 0% | 1 | 0 | 1 | 2 | 3 | 3 | 3 | 3 | 3 | 1 | 2 | 2 |
| Queen quilts – machine | 0% | 0 | 1 | 2 | 1 | 2 | 1 | 2 | 1 | 1 | 2 | 2 | 1 |
| King quilts – machine | 0% | 0 | 0 | 0 | 0 | 0 | 0 | 0 | 0 | 1 | 0 | 0 | 0 |
| Crib quilts – hand | 0% | 0 | 1 | 1 | 1 | 0 | 0 | 0 | 0 | 1 | 1 | 0 | 1 |
| Queen quilts – hand | 0% | 1 | 0 | 0 | 1 | 0 | 1 | 0 | 0 | 0 | 1 | 0 | 0 |
| King quilts – hand | 0% | 0 | 0 | 0 | 0 | 0 | 0 | 0 | 1 | 0 | 0 | 1 | 0 |
| Total Unit Sales | 2 | 2 | 4 | 5 | 5 | 5 | 5 | 5 | 6 | 5 | 5 | 4 | |
| Unit Prices | Month 1 | Month 2 | Month 3 | Month 4 | Month 5 | Month 6 | Month 7 | Month 8 | Month 9 | Month 10 | Month 11 | Month 12 | |
| Crib quilts – machine | $600.00 | $600.00 | $600.00 | $600.00 | $600.00 | $600.00 | $600.00 | $600.00 | $600.00 | $600.00 | $600.00 | $600.00 | |
| Queen quilts – machine | $1,000.00 | $1,000.00 | $1,000.00 | $1,000.00 | $1,000.00 | $1,000.00 | $1,000.00 | $1,000.00 | $1,000.00 | $1,000.00 | $1,000.00 | $1,000.00 | |
| King quilts – machine | $1,500.00 | $1,500.00 | $1,500.00 | $1,500.00 | $1,500.00 | $1,500.00 | $1,500.00 | $1,500.00 | $1,500.00 | $1,500.00 | $1,500.00 | $1,500.00 | |
| Crib quilts – hand | $750.00 | $750.00 | $750.00 | $750.00 | $750.00 | $750.00 | $750.00 | $750.00 | $750.00 | $750.00 | $750.00 | $750.00 | |
| Queen quilts – hand | $1,375.00 | $1,375.00 | $1,375.00 | $1,375.00 | $1,375.00 | $1,375.00 | $1,375.00 | $1,375.00 | $1,375.00 | $1,375.00 | $1,375.00 | $1,375.00 | |
| King quilts – hand | $1,900.00 | $1,900.00 | $1,900.00 | $1,900.00 | $1,900.00 | $1,900.00 | $1,900.00 | $1,900.00 | $1,900.00 | $1,900.00 | $1,900.00 | $1,900.00 | |
| Sales | |||||||||||||
| Crib quilts – machine | $600 | $0 | $600 | $1,200 | $1,800 | $1,800 | $1,800 | $1,800 | $1,800 | $600 | $1,200 | $1,200 | |
| Queen quilts – machine | $0 | $1,000 | $2,000 | $1,000 | $2,000 | $1,000 | $2,000 | $1,000 | $1,000 | $2,000 | $2,000 | $1,000 | |
| King quilts – machine | $0 | $0 | $0 | $0 | $0 | $0 | $0 | $0 | $1,500 | $0 | $0 | $0 | |
| Crib quilts – hand | $0 | $750 | $750 | $750 | $0 | $0 | $0 | $0 | $750 | $750 | $0 | $750 | |
| Queen quilts – hand | $1,375 | $0 | $0 | $1,375 | $0 | $1,375 | $0 | $0 | $0 | $1,375 | $0 | $0 | |
| King quilts – hand | $0 | $0 | $0 | $0 | $0 | $0 | $0 | $1,900 | $0 | $0 | $1,900 | $0 | |
| Total Sales | $1,975 | $1,750 | $3,350 | $4,325 | $3,800 | $4,175 | $3,800 | $4,700 | $5,050 | $4,725 | $5,100 | $2,950 | |
| Direct Unit Costs | Month 1 | Month 2 | Month 3 | Month 4 | Month 5 | Month 6 | Month 7 | Month 8 | Month 9 | Month 10 | Month 11 | Month 12 | |
| Crib quilts – machine | 0.00% | $40.00 | $40.00 | $40.00 | $40.00 | $40.00 | $40.00 | $40.00 | $40.00 | $40.00 | $40.00 | $40.00 | $40.00 |
| Queen quilts – machine | 0.00% | $80.00 | $80.00 | $80.00 | $80.00 | $80.00 | $80.00 | $80.00 | $80.00 | $80.00 | $80.00 | $80.00 | $80.00 |
| King quilts – machine | 0.00% | $100.00 | $100.00 | $100.00 | $100.00 | $100.00 | $100.00 | $100.00 | $100.00 | $100.00 | $100.00 | $100.00 | $100.00 |
| Crib quilts – hand | 0.00% | $40.00 | $40.00 | $40.00 | $40.00 | $40.00 | $40.00 | $40.00 | $40.00 | $40.00 | $40.00 | $40.00 | $40.00 |
| Queen quilts – hand | 0.00% | $80.00 | $80.00 | $80.00 | $80.00 | $80.00 | $80.00 | $80.00 | $80.00 | $80.00 | $80.00 | $80.00 | $80.00 |
| King quilts – hand | 0.00% | $100.00 | $100.00 | $100.00 | $100.00 | $100.00 | $100.00 | $100.00 | $100.00 | $100.00 | $100.00 | $100.00 | $100.00 |
| Direct Cost of Sales | |||||||||||||
| Crib quilts – machine | $40 | $0 | $40 | $80 | $120 | $120 | $120 | $120 | $120 | $40 | $80 | $80 | |
| Queen quilts – machine | $0 | $80 | $160 | $80 | $160 | $80 | $160 | $80 | $80 | $160 | $160 | $80 | |
| King quilts – machine | $0 | $0 | $0 | $0 | $0 | $0 | $0 | $0 | $100 | $0 | $0 | $0 | |
| Crib quilts – hand | $0 | $40 | $40 | $40 | $0 | $0 | $0 | $0 | $40 | $40 | $0 | $40 | |
| Queen quilts – hand | $80 | $0 | $0 | $80 | $0 | $80 | $0 | $0 | $0 | $80 | $0 | $0 | |
| King quilts – hand | $0 | $0 | $0 | $0 | $0 | $0 | $0 | $100 | $0 | $0 | $100 | $0 | |
| Subtotal Direct Cost of Sales | $120 | $120 | $240 | $280 | $280 | $280 | $280 | $300 | $340 | $320 | $340 | $200 | |
| Personnel Plan | |||||||||||||
| Month 1 | Month 2 | Month 3 | Month 4 | Month 5 | Month 6 | Month 7 | Month 8 | Month 9 | Month 10 | Month 11 | Month 12 | ||
| Owner | 0% | $2,000 | $2,000 | $2,000 | $2,000 | $2,000 | $2,000 | $2,000 | $2,000 | $2,000 | $2,000 | $2,000 | $2,000 |
| Other | 0% | $0 | $0 | $0 | $0 | $0 | $0 | $0 | $0 | $0 | $0 | $0 | $0 |
| Total People | 1 | 1 | 1 | 1 | 1 | 1 | 1 | 1 | 1 | 1 | 1 | 1 | |
| Total Payroll | $2,000 | $2,000 | $2,000 | $2,000 | $2,000 | $2,000 | $2,000 | $2,000 | $2,000 | $2,000 | $2,000 | $2,000 | |
| General Assumptions | |||||||||||||
| Month 1 | Month 2 | Month 3 | Month 4 | Month 5 | Month 6 | Month 7 | Month 8 | Month 9 | Month 10 | Month 11 | Month 12 | ||
| Plan Month | 1 | 2 | 3 | 4 | 5 | 6 | 7 | 8 | 9 | 10 | 11 | 12 | |
| Current Interest Rate | 10.00% | 10.00% | 10.00% | 10.00% | 10.00% | 10.00% | 10.00% | 10.00% | 10.00% | 10.00% | 10.00% | 10.00% | |
| Long-term Interest Rate | 10.00% | 10.00% | 10.00% | 10.00% | 10.00% | 10.00% | 10.00% | 10.00% | 10.00% | 10.00% | 10.00% | 10.00% | |
| Tax Rate | 30.00% | 30.00% | 30.00% | 30.00% | 30.00% | 30.00% | 30.00% | 30.00% | 30.00% | 30.00% | 30.00% | 30.00% | |
| Other | 0 | 0 | 0 | 0 | 0 | 0 | 0 | 0 | 0 | 0 | 0 | 0 | |
| Pro Forma Profit and Loss | |||||||||||||
| Month 1 | Month 2 | Month 3 | Month 4 | Month 5 | Month 6 | Month 7 | Month 8 | Month 9 | Month 10 | Month 11 | Month 12 | ||
| Sales | $1,975 | $1,750 | $3,350 | $4,325 | $3,800 | $4,175 | $3,800 | $4,700 | $5,050 | $4,725 | $5,100 | $2,950 | |
| Direct Cost of Sales | $120 | $120 | $240 | $280 | $280 | $280 | $280 | $300 | $340 | $320 | $340 | $200 | |
| Contracted Hand-Quilter | $350 | $150 | $150 | $500 | $0 | $350 | $0 | $400 | $150 | $500 | $400 | $150 | |
| Total Cost of Sales | $470 | $270 | $390 | $780 | $280 | $630 | $280 | $700 | $490 | $820 | $740 | $350 | |
| Gross Margin | $1,505 | $1,480 | $2,960 | $3,545 | $3,520 | $3,545 | $3,520 | $4,000 | $4,560 | $3,905 | $4,360 | $2,600 | |
| Gross Margin % | 76.20% | 84.57% | 88.36% | 81.97% | 92.63% | 84.91% | 92.63% | 85.11% | 90.30% | 82.65% | 85.49% | 88.14% | |
| Expenses | |||||||||||||
| Payroll | $2,000 | $2,000 | $2,000 | $2,000 | $2,000 | $2,000 | $2,000 | $2,000 | $2,000 | $2,000 | $2,000 | $2,000 | |
| Sales and Marketing and Other Expenses | $50 | $50 | $50 | $50 | $50 | $25 | $25 | $25 | $25 | $25 | $25 | $25 | |
| Depreciation | $0 | $0 | $0 | $0 | $0 | $0 | $0 | $0 | $0 | $0 | $0 | $0 | |
| Mortgage % for quilting room | $150 | $150 | $150 | $150 | $150 | $150 | $150 | $150 | $150 | $150 | $150 | $150 | |
| Website hosting and maintenance | $15 | $15 | $15 | $15 | $15 | $15 | $15 | $15 | $15 | $15 | $15 | $15 | |
| Insurance | $0 | $0 | $0 | $0 | $0 | $0 | $200 | $0 | $0 | $0 | $0 | $0 | |
| Payroll Taxes | 15% | $0 | $0 | $0 | $0 | $0 | $0 | $0 | $0 | $0 | $0 | $0 | $0 |
| Travel to conventions and quilting events | $0 | $0 | $0 | $0 | $0 | $0 | $200 | $0 | $0 | $0 | $0 | $300 | |
| Total Operating Expenses | $2,215 | $2,215 | $2,215 | $2,215 | $2,215 | $2,190 | $2,590 | $2,190 | $2,190 | $2,190 | $2,190 | $2,490 | |
| Profit Before Interest and Taxes | ($710) | ($735) | $745 | $1,330 | $1,305 | $1,355 | $930 | $1,810 | $2,370 | $1,715 | $2,170 | $110 | |
| EBITDA | ($710) | ($735) | $745 | $1,330 | $1,305 | $1,355 | $930 | $1,810 | $2,370 | $1,715 | $2,170 | $110 | |
| Interest Expense | $17 | $16 | $15 | $15 | $14 | $13 | $12 | $11 | $10 | $10 | $9 | $8 | |
| Taxes Incurred | ($218) | ($225) | $219 | $395 | $387 | $403 | $275 | $540 | $708 | $512 | $648 | $31 | |
| Net Profit | ($509) | ($526) | $511 | $921 | $904 | $939 | $643 | $1,259 | $1,652 | $1,194 | $1,513 | $71 | |
| Net Profit/Sales | -25.77% | -30.05% | 15.25% | 21.29% | 23.79% | 22.50% | 16.91% | 26.79% | 32.71% | 25.27% | 29.66% | 2.42% | |
| Pro Forma Cash Flow | |||||||||||||
| Month 1 | Month 2 | Month 3 | Month 4 | Month 5 | Month 6 | Month 7 | Month 8 | Month 9 | Month 10 | Month 11 | Month 12 | ||
| Cash Received | |||||||||||||
| Cash from Operations | |||||||||||||
| Cash Sales | $1,975 | $1,750 | $3,350 | $4,325 | $3,800 | $4,175 | $3,800 | $4,700 | $5,050 | $4,725 | $5,100 | $2,950 | |
| Subtotal Cash from Operations | $1,975 | $1,750 | $3,350 | $4,325 | $3,800 | $4,175 | $3,800 | $4,700 | $5,050 | $4,725 | $5,100 | $2,950 | |
| Additional Cash Received | |||||||||||||
| Sales Tax, VAT, HST/GST Received | 0.00% | $0 | $0 | $0 | $0 | $0 | $0 | $0 | $0 | $0 | $0 | $0 | $0 |
| New Current Borrowing | $0 | $0 | $0 | $0 | $0 | $0 | $0 | $0 | $0 | $0 | $0 | $0 | |
| New Other Liabilities (interest-free) | $0 | $0 | $0 | $0 | $0 | $0 | $0 | $0 | $0 | $0 | $0 | $0 | |
| New Long-term Liabilities | $0 | $0 | $0 | $0 | $0 | $0 | $0 | $0 | $0 | $0 | $0 | $0 | |
| Sales of Other Current Assets | $0 | $0 | $0 | $0 | $0 | $0 | $0 | $0 | $0 | $0 | $0 | $0 | |
| Sales of Long-term Assets | $0 | $0 | $0 | $0 | $0 | $0 | $0 | $0 | $0 | $0 | $0 | $0 | |
| New Investment Received | $0 | $0 | $0 | $0 | $0 | $0 | $0 | $0 | $0 | $0 | $0 | $0 | |
| Subtotal Cash Received | $1,975 | $1,750 | $3,350 | $4,325 | $3,800 | $4,175 | $3,800 | $4,700 | $5,050 | $4,725 | $5,100 | $2,950 | |
| Expenditures | Month 1 | Month 2 | Month 3 | Month 4 | Month 5 | Month 6 | Month 7 | Month 8 | Month 9 | Month 10 | Month 11 | Month 12 | |
| Expenditures from Operations | |||||||||||||
| Cash Spending | $2,000 | $2,000 | $2,000 | $2,000 | $2,000 | $2,000 | $2,000 | $2,000 | $2,000 | $2,000 | $2,000 | $2,000 | |
| Bill Payments | $12 | $357 | $171 | $619 | $1,182 | $907 | $1,233 | $1,168 | $1,462 | $1,445 | $1,513 | $1,580 | |
| Subtotal Spent on Operations | $2,012 | $2,357 | $2,171 | $2,619 | $3,182 | $2,907 | $3,233 | $3,168 | $3,462 | $3,445 | $3,513 | $3,580 | |
| Additional Cash Spent | |||||||||||||
| Sales Tax, VAT, HST/GST Paid Out | $0 | $0 | $0 | $0 | $0 | $0 | $0 | $0 | $0 | $0 | $0 | $0 | |
| Principal Repayment of Current Borrowing | $0 | $100 | $100 | $100 | $100 | $100 | $100 | $100 | $100 | $100 | $100 | $100 | |
| Other Liabilities Principal Repayment | $0 | $0 | $0 | $0 | $0 | $0 | $0 | $0 | $0 | $0 | $0 | $0 | |
| Long-term Liabilities Principal Repayment | $0 | $0 | $0 | $0 | $0 | $0 | $0 | $0 | $0 | $0 | $0 | $0 | |
| Purchase Other Current Assets | $0 | $0 | $0 | $0 | $0 | $0 | $0 | $0 | $0 | $0 | $0 | $0 | |
| Purchase Long-term Assets | $0 | $0 | $0 | $0 | $0 | $0 | $0 | $0 | $0 | $0 | $0 | $0 | |
| Dividends | $0 | $0 | $0 | $0 | $0 | $0 | $0 | $0 | $0 | $0 | $0 | $0 | |
| Subtotal Cash Spent | $2,012 | $2,457 | $2,271 | $2,719 | $3,282 | $3,007 | $3,333 | $3,268 | $3,562 | $3,545 | $3,613 | $3,680 | |
| Net Cash Flow | ($37) | ($707) | $1,079 | $1,606 | $518 | $1,168 | $467 | $1,432 | $1,488 | $1,180 | $1,487 | ($730) | |
| Cash Balance | $1,563 | $856 | $1,935 | $3,541 | $4,059 | $5,226 | $5,693 | $7,126 | $8,614 | $9,794 | $11,282 | $10,552 | |
| Pro Forma Balance Sheet | |||||||||||||
| Month 1 | Month 2 | Month 3 | Month 4 | Month 5 | Month 6 | Month 7 | Month 8 | Month 9 | Month 10 | Month 11 | Month 12 | ||
| Assets | Starting Balances | ||||||||||||
| Current Assets | |||||||||||||
| Cash | $1,600 | $1,563 | $856 | $1,935 | $3,541 | $4,059 | $5,226 | $5,693 | $7,126 | $8,614 | $9,794 | $11,282 | $10,552 |
| Inventory | $1,000 | $880 | $760 | $520 | $308 | $308 | $308 | $308 | $330 | $374 | $352 | $374 | $224 |
| Other Current Assets | $1,000 | $1,000 | $1,000 | $1,000 | $1,000 | $1,000 | $1,000 | $1,000 | $1,000 | $1,000 | $1,000 | $1,000 | $1,000 |
| Total Current Assets | $3,600 | $3,443 | $2,616 | $3,455 | $4,849 | $5,367 | $6,534 | $7,001 | $8,456 | $9,988 | $11,146 | $12,656 | $11,776 |
| Long-term Assets | |||||||||||||
| Long-term Assets | $0 | $0 | $0 | $0 | $0 | $0 | $0 | $0 | $0 | $0 | $0 | $0 | $0 |
| Accumulated Depreciation | $0 | $0 | $0 | $0 | $0 | $0 | $0 | $0 | $0 | $0 | $0 | $0 | $0 |
| Total Long-term Assets | $0 | $0 | $0 | $0 | $0 | $0 | $0 | $0 | $0 | $0 | $0 | $0 | $0 |
| Total Assets | $3,600 | $3,443 | $2,616 | $3,455 | $4,849 | $5,367 | $6,534 | $7,001 | $8,456 | $9,988 | $11,146 | $12,656 | $11,776 |
| Liabilities and Capital | Month 1 | Month 2 | Month 3 | Month 4 | Month 5 | Month 6 | Month 7 | Month 8 | Month 9 | Month 10 | Month 11 | Month 12 | |
| Current Liabilities | |||||||||||||
| Accounts Payable | $0 | $352 | $151 | $579 | $1,152 | $866 | $1,194 | $1,119 | $1,414 | $1,394 | $1,459 | $1,555 | $704 |
| Current Borrowing | $2,050 | $2,050 | $1,950 | $1,850 | $1,750 | $1,650 | $1,550 | $1,450 | $1,350 | $1,250 | $1,150 | $1,050 | $950 |
| Other Current Liabilities | $0 | $0 | $0 | $0 | $0 | $0 | $0 | $0 | $0 | $0 | $0 | $0 | $0 |
| Subtotal Current Liabilities | $2,050 | $2,402 | $2,101 | $2,429 | $2,902 | $2,516 | $2,744 | $2,569 | $2,764 | $2,644 | $2,609 | $2,605 | $1,654 |
| Long-term Liabilities | $0 | $0 | $0 | $0 | $0 | $0 | $0 | $0 | $0 | $0 | $0 | $0 | $0 |
| Total Liabilities | $2,050 | $2,402 | $2,101 | $2,429 | $2,902 | $2,516 | $2,744 | $2,569 | $2,764 | $2,644 | $2,609 | $2,605 | $1,654 |
| Paid-in Capital | $2,500 | $2,500 | $2,500 | $2,500 | $2,500 | $2,500 | $2,500 | $2,500 | $2,500 | $2,500 | $2,500 | $2,500 | $2,500 |
| Retained Earnings | ($950) | ($950) | ($950) | ($950) | ($950) | ($950) | ($950) | ($950) | ($950) | ($950) | ($950) | ($950) | ($950) |
| Earnings | $0 | ($509) | ($1,035) | ($524) | $397 | $1,301 | $2,240 | $2,883 | $4,142 | $5,793 | $6,987 | $8,500 | $8,572 |
| Total Capital | $1,550 | $1,041 | $515 | $1,026 | $1,947 | $2,851 | $3,790 | $4,433 | $5,692 | $7,343 | $8,537 | $10,050 | $10,122 |
| Total Liabilities and Capital | $3,600 | $3,443 | $2,616 | $3,455 | $4,849 | $5,367 | $6,534 | $7,001 | $8,456 | $9,988 | $11,146 | $12,656 | $11,776 |
| Net Worth | $1,550 | $1,041 | $515 | $1,026 | $1,947 | $2,851 | $3,790 | $4,433 | $5,692 | $7,343 | $8,537 | $10,050 | $10,122 |

