
Luna's Convenience Store
Executive Summary
Luna’s is a brand new convenience store based close to Aspen Estates in the town of Jenniville. Aspen Estates is a new housing estates which is aimed at high income individuals and young couples. This presents a great opportunity for the store. Typical household incomes in this area are $85,000 to $100,000. In addition, it is the only food store with two miles of the housing estate.
It is a start-up company owned by Thomas and Heidi Renner. Thomas and Heidi make a perfect business partnership. Heidi has fifteen years of experience in the retail food industry and Thomas is a certified public accountant. He will deal with the financial side of the business and Heidi will deal with day to day operations.
Luna’s will offer a range of fresh, organic produce, staples, packaged foods, drinks (alcoholic and nonalcoholic), prepackaged fresh meals and pastries, newspapers, pet foods, medicines, health and beauty items, etc. In addition, Luna’s will rent a small section of the store to a cafe. The cafe will have seating for approximately 20 people and will provide breakfast, lunch, coffee, tea, cold drinks and pastries.
Luna’s competitive edge is its location, its focus on customer service and the experience and knowledge of the owners.

1.1 Mission
The mission of Luna’s Convenience Store is to provide packaged foods, fresh foods, fast food, soft drinks, beer, cigarettes, groceries, and selected nonfood items to residents of the Aspen Estates and surrounding neighborhoods. The store will provide fair priced items to its customers and provide a healthy profit for its owners.
1.2 Objectives
1. To make Luna’s the preferred convenience store for the residents of the newly built Aspen Estates and surrounding neighborhoods.
2. To break-even by the end of the first year.
3. To achieve a net profit of 5% by year three.
1.3 Keys to Success
Keys to success:
1. The convince Aspen Estates residents that Luna’s is “their” convenience.store
2. To turn over inventory an average of 15 – 20 times per year.
3. To provide a broad supply of groceries, food and necessary household items.
Company Summary
Luna’s Convenience Store is a start-up venture. The store will occupy a leased property which is located on the Main Street in Jenniville approximately 30 yards from the main entrance of Aspen Estates. The new building contains five other store fronts, that were built at the same time as the apartments. On the same strip there will be a coffee shop, a gourmet chocolate shop, a gift shop and a bookstore. Luna’s is owned by Thomas and Heidi Renner.
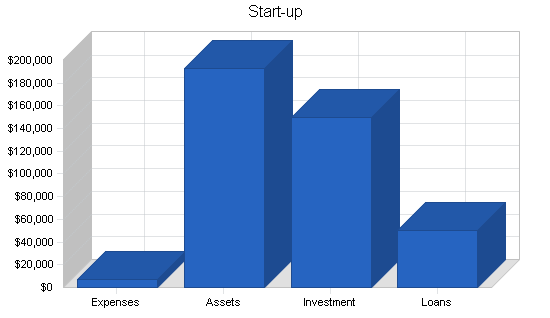
2.1 Start-up Summary
Funding for the enterprise will come from a combination of owner investment and bank funding. The main cost of start-up will be inventory. It is estimated that the initial inventory purchase will be $100,000. In addition, $30,000 will have to be spent on fixtures and fittings for the store. Since it is a brand new building, there will be no maintenance needed before move-in.
| Start-up | |
| Requirements | |
| Start-up Expenses | |
| Legal | $500 |
| Stationery etc. | $100 |
| Consultants | $500 |
| Insurance | $1,000 |
| Rent | $3,000 |
| Expensed Equipment | $1,300 |
| Other | $500 |
| Total Start-up Expenses | $6,900 |
| Start-up Assets | |
| Cash Required | $58,100 |
| Start-up Inventory | $100,000 |
| Other Current Assets | $5,000 |
| Long-term Assets | $30,000 |
| Total Assets | $193,100 |
| Total Requirements | $200,000 |
| Start-up Funding | |
| Start-up Expenses to Fund | $6,900 |
| Start-up Assets to Fund | $193,100 |
| Total Funding Required | $200,000 |
| Assets | |
| Non-cash Assets from Start-up | $135,000 |
| Cash Requirements from Start-up | $58,100 |
| Additional Cash Raised | $0 |
| Cash Balance on Starting Date | $58,100 |
| Total Assets | $193,100 |
| Liabilities and Capital | |
| Liabilities | |
| Current Borrowing | $50,000 |
| Long-term Liabilities | $0 |
| Accounts Payable (Outstanding Bills) | $0 |
| Other Current Liabilities (interest-free) | $0 |
| Total Liabilities | $50,000 |
| Capital | |
| Planned Investment | |
| Investor 1 | $150,000 |
| Other | $0 |
| Additional Investment Requirement | $0 |
| Total Planned Investment | $150,000 |
| Loss at Start-up (Start-up Expenses) | ($6,900) |
| Total Capital | $143,100 |
| Total Capital and Liabilities | $193,100 |
| Total Funding | $200,000 |
2.2 Company Ownership
The company is incorporated in Delaware and is owned by Thomas Renner and his wife Heidi. Funds for start-up will come from the Renner’s own savings, and a $50,000 bank loan.
Before starting the company Heidi Renner worked as a manager of a local supermarket, and has over 15 years of experience in this industry at management levels. Thomas is a certified CPA and ran his own practice for ten years before launching the concept of Luna’s.
Products
Market Analysis Summary
The Aspen Estates is a newly built apartment complex in the western suburbs of Jenniville. Construction is scheduled to continue for the next eight months, however 350 condominiums and townhouses are already complete and approximately another 175 are scheduled for completion in the next eight months.
All of the residences are for sale, not rent, so it is expected that the household income of the residents of Aspen Estates will be higher than the national average. Household income is estimated at $85,000 – $100,000. Many of the residents are workers at seven large technology companies that are located within a 20 mile radius of the Estates. These workers tend to be young, 25 – 45, married or living with a partner.
4.1 Market Segmentation
The “Yuppies” are young upwardly mobile individuals aged between 23 and 33. Their household income is between $55,000 and $80,000, they have very active busy lives and are conscious of their health. They are single or living with a partner.
The “Young Parents” are couples with young families aged 27 – 37. They were Yuppies with a focus on entertainment and fun, but now their main focus is their one to two children. They have less spare time than they used to, so convenience is important to them.
The “Healthy Middles” have the highest income $90,000 to $120,000. Much of their time is still spent taking care of their children, but their children are old enough to spend the occasional evening alone if their parents want a night out.
The “Healthy Middles” is the smallest market in the Aspen Estates, but potentially the most lucrative for Luna’s. This group has an expected growth rate of 5% per year, beyond the influx of new home owners as the Estate residences are filled up over the next eight to 18 months. The Yuppies are the next most lucrative group. Although they have smaller household incomes than the “Young Parent” group, they have greater disposable income, since they have no children.
The following Market Analysis table includes residents of the Aspen Estates and the surrounding neighborhoods.

| Market Analysis | |||||||
| Year 1 | Year 2 | Year 3 | Year 4 | Year 5 | |||
| Potential Customers | Growth | CAGR | |||||
| Yuppies | 5% | 750 | 788 | 827 | 868 | 911 | 4.98% |
| Young Parents | 5% | 880 | 924 | 970 | 1,019 | 1,070 | 5.01% |
| Healthy Middles | 5% | 500 | 525 | 551 | 579 | 608 | 5.01% |
| Total | 5.00% | 2,130 | 2,237 | 2,348 | 2,466 | 2,589 | 5.00% |
4.2 Industry Analysis
- The convenience store industry is highly fragmented, though larger players, such as 7-11, dominate since they are based in very high traffic areas and have the money during the early eighties to grow quickly.
- Gross profits are typically 20 – 22%, with net profits
4.2.1 Competition and Buying Patterns
Convenience stores are small retail outlets, generally 2,000 to 3,000 square feet. Their product lines usually consist of staple groceries, beer, cigarettes, software drinks, dairy products, gasoline and some nonfood items. These stores not only sell products but convenience as well. They are generally located on busy streets, with easy-access parking outside the front door. The stores are often open 24 hours a day seven days a week.

The typical customer at a convenience store is a blue collar male between the age of 18 and 34. Beer and cigarettes together represent about 1/3 of merchandise sales. However, Luna’s is targeting the “Yuppies,” as the professional market grows.
4.3 Target Market Segment Strategy
The market segments identified in the previous section are the key groups that live closest to Luna’s. These groups have been chosen because of their geographical location as well as their income levels and lifestyles. Since the most attractive group have young children, the store will have a large candy area, as well as other products that parents need regularly for babies and young children, for example diapers and baby food.
Strategy and Implementation Summary
Luna’s uses a strategy of impressive customer service. Luna’s will not have a typical convenience store feel. It will provide higher-end food and hard goods than are typically found in convenience stores. The store’s competitive edge is its prominent location, in a high income neighborhood.
Strategic Assumptions:
- Superior customer service will attract customers to come into the store more often.
- Every customer can be upsold to more products that they came in for.
- Marketing to high end individuals will lead to higher average sales per customer.
5.1 Competitive Edge
Luna’s competitive edge is its location and its position as first to market. Luna’s is located within walking distance of every residence on Aspen Estates. Currently there are no other stores offering similar products within a 2 mile radius of the Estates. As new residents move into Aspen Estates, they will naturally chose Luna’s Convenience store as their first choice, because it is closest to their homes. They will quickly become aware that Luna’s offers high quality organic and healthy products as well as a typical convenience store fare and it will become their preferred store for small grocery and household purchases.
5.2 Marketing Strategy
Luna’s is fortunate to have access to marketing research information that was developed by the developers of Aspen Estates, so the company has knowledge of a large portion of its potential market. These relatively high income group presents a prime opportunity for Luna’s. Knowing about the needs of this group will help Luna’s purchase goods that are most desired by their key target markets. The convenient location of the store will mean that Luna’s will have to do little above the line advertising.
5.3 Sales Strategy
Luna’s will aim to provide a typical convenience store fare as well as items that they will purchase on impulse and that will increase the average sale per customer. The sales staff will be focused on customer service and always ask customers if they have found everything that they need.
5.3.1 Sales Forecast
The average customer ticket is expected to be $5.50 cents. This is greater than the industry average of $3.75, due to the demographics of the surrounding neighborhoods and the focus on branded goods and organic, healthy foods.


| Sales Forecast | |||
| Year 1 | Year 2 | Year 3 | |
| Sales | |||
| Fresh Foods, Dairy and Drinks | $48,109 | $60,136 | $69,156 |
| Packaged Foods | $108,893 | $143,739 | $169,612 |
| Hard Goods | $43,378 | $54,223 | $65,067 |
| Beer, Wine and Cigarettes | $140,762 | $185,806 | $224,825 |
| Rental Income | $12,000 | $12,600 | $13,230 |
| Prepackaged Meals | $21,239 | $26,336 | $30,286 |
| Total Sales | $374,380 | $482,839 | $572,176 |
| Direct Cost of Sales | Year 1 | Year 2 | Year 3 |
| Fresh Foods | $24,054 | $30,068 | $34,578 |
| Packaged Foods | $14,867 | $18,435 | $21,200 |
| Hard Goods | $187,190 | $241,419 | $286,088 |
| Drinks (inc. beer and wine) | $0 | $0 | $0 |
| Prepackaged Meals | $7,216 | $9,020 | $10,373 |
| Subtotal Direct Cost of Sales | $233,328 | $298,943 | $352,240 |
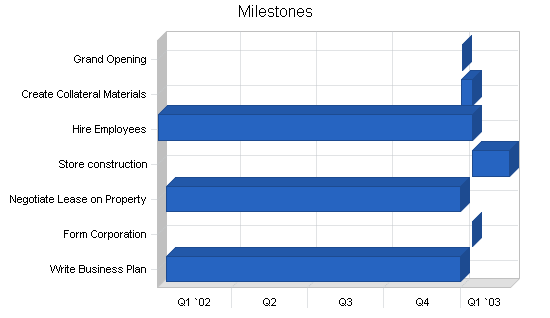
5.4 Milestones
The accompanying table lists important program milestones, with dates and managers in charge, and budgets for each. The milestone schedule indicates the tasks that Thomas and Heidi will have to complete in order to have a successful start up.
| Milestones | |||||
| Milestone | Start Date | End Date | Budget | Manager | Department |
| Write Business Plan | 1/12/2002 | 12/31/2002 | $0 | Thomas/Heidi | Management |
| Form Corporation | 1/15/2003 | 1/15/2003 | $0 | Thomas | Management |
| Negotiate Lease on Property | 1/12/2002 | 12/31/2002 | $0 | Thomas | Management |
| Store construction | 1/15/2003 | 2/28/2003 | $0 | Contractors | – |
| Hire Employees | 1/2/2002 | 1/15/2003 | $0 | Heidi | Management |
| Create Collateral Materials | 1/1/2003 | 1/15/2003 | $500 | Outside Agency | Consultant |
| Grand Opening | 1/3/2003 | 1/3/2003 | $0 | Heidi/Thomas | Management |
| Totals | $500 | ||||
Management Summary
Thomas and Heidi Renner are the owners and managers of Luna’s Convenience Store. They are a well qualified team to take on the role of managing the store. For the past fifteen years Heidi has worked in a management position at the local Safeway store. She has an extensive knowledge of the retail food industry and is passionate about the business. She understands inventory management and has had to deal with many employee issues, so will be able to handle any problem situation. In addition her position at Safeway gave her exposure to a large number of food vendors in the area and she has good relationships with this group.
Thomas brings another aspect to the business. As a certified CPA he has dealt with the financial aspects of hundreds of small businesses. He has seen why they fail and why they succeed.
6.1 Personnel Plan
The following table illustrates the planned personnel over the next three years. The industry typically has a high turnover rate, however, Luna’s will aim to avoid this by paying higher than typical minimum wage, employing older individuals than school and college age people, and focusing on making their employees as happy as their customers.
| Personnel Plan | |||
| Year 1 | Year 2 | Year 3 | |
| Heidi Renner | $30,000 | $34,000 | $38,000 |
| Thomas Renner | $18,000 | $22,000 | $24,000 |
| Cashiers | $43,200 | $45,000 | $48,000 |
| Other | $0 | $0 | $0 |
| Total People | 0 | 0 | 0 |
| Total Payroll | $91,200 | $101,000 | $110,000 |
Financial Plan
- Growth will be moderate, cash flows steady.
- Marketing will be minimal, since Luna’s will rely on convenient location and will not buy any advertising.
- The company will use tight inventory controls to manage costs.
- The company will gain higher grow margins than industry averages, since it is targeting women and professionals.
7.1 Important Assumptions
Luna’s does not sell anything on credit. The personnel burden is very low because Luna’s will employee only part time staff in addition to the owners salaries. Benefits are not paid to part-timers.
| General Assumptions | |||
| Year 1 | Year 2 | Year 3 | |
| Plan Month | 1 | 2 | 3 |
| Current Interest Rate | 10.00% | 10.00% | 10.00% |
| Long-term Interest Rate | 10.00% | 10.00% | 10.00% |
| Tax Rate | 30.00% | 30.00% | 30.00% |
| Other | 0 | 0 | 0 |
7.2 Break-even Analysis
The following table and chart show the Break-even Analysis for Luna’s.

| Break-even Analysis | |
| Monthly Revenue Break-even | $33,735 |
| Assumptions: | |
| Average Percent Variable Cost | 62% |
| Estimated Monthly Fixed Cost | $12,710 |
7.3 Projected Profit and Loss
The following table and charts show the Projected Profit and Loss and Gross Margin for Luna’s.


| Pro Forma Profit and Loss | |||
| Year 1 | Year 2 | Year 3 | |
| Sales | $374,380 | $482,839 | $572,176 |
| Direct Cost of Sales | $233,328 | $298,943 | $352,240 |
| Other Costs of Goods | $0 | $0 | $0 |
| Total Cost of Sales | $233,328 | $298,943 | $352,240 |
| Gross Margin | $141,052 | $183,896 | $219,936 |
| Gross Margin % | 37.68% | 38.09% | 38.44% |
| Expenses | |||
| Payroll | $91,200 | $101,000 | $110,000 |
| Sales and Marketing and Other Expenses | $2,400 | $2,400 | $2,400 |
| Depreciation | $6,000 | $6,000 | $6,000 |
| Rent | $36,000 | $36,000 | $36,000 |
| Utilities | $6,000 | $7,000 | $8,000 |
| Insurance | $1,800 | $1,900 | $2,000 |
| Payroll Taxes | $9,120 | $10,100 | $11,000 |
| Other | $0 | $0 | $0 |
| Total Operating Expenses | $152,520 | $164,400 | $175,400 |
| Profit Before Interest and Taxes | ($11,468) | $19,496 | $44,536 |
| EBITDA | ($5,468) | $25,496 | $50,536 |
| Interest Expense | $4,805 | $4,460 | $4,100 |
| Taxes Incurred | $0 | $4,511 | $12,131 |
| Net Profit | ($16,273) | $10,525 | $28,305 |
| Net Profit/Sales | -4.35% | 2.18% | 4.95% |
7.4 Projected Cash Flow
The following table shows the cash flow totals for three years. As you can see by the table and chart, the cash flow remains healthy.

| Pro Forma Cash Flow | |||
| Year 1 | Year 2 | Year 3 | |
| Cash Received | |||
| Cash from Operations | |||
| Cash Sales | $374,380 | $482,839 | $572,176 |
| Subtotal Cash from Operations | $374,380 | $482,839 | $572,176 |
| Additional Cash Received | |||
| Sales Tax, VAT, HST/GST Received | $0 | $0 | $0 |
| New Current Borrowing | $0 | $0 | $0 |
| New Other Liabilities (interest-free) | $0 | $0 | $0 |
| New Long-term Liabilities | $0 | $0 | $0 |
| Sales of Other Current Assets | $0 | $0 | $0 |
| Sales of Long-term Assets | $0 | $0 | $0 |
| New Investment Received | $0 | $0 | $0 |
| Subtotal Cash Received | $374,380 | $482,839 | $572,176 |
| Expenditures | Year 1 | Year 2 | Year 3 |
| Expenditures from Operations | |||
| Cash Spending | $91,200 | $101,000 | $110,000 |
| Bill Payments | $191,178 | $365,820 | $427,957 |
| Subtotal Spent on Operations | $282,378 | $466,820 | $537,957 |
| Additional Cash Spent | |||
| Sales Tax, VAT, HST/GST Paid Out | $0 | $0 | $0 |
| Principal Repayment of Current Borrowing | $3,600 | $3,600 | $3,600 |
| Other Liabilities Principal Repayment | $0 | $0 | $0 |
| Long-term Liabilities Principal Repayment | $0 | $0 | $0 |
| Purchase Other Current Assets | $0 | $0 | $0 |
| Purchase Long-term Assets | $30,000 | $0 | $0 |
| Dividends | $0 | $0 | $0 |
| Subtotal Cash Spent | $315,978 | $470,420 | $541,557 |
| Net Cash Flow | $58,402 | $12,419 | $30,619 |
| Cash Balance | $116,502 | $128,921 | $159,540 |
7.5 Projected Balance Sheet
The following table is the Projected Balance Sheet.
| Pro Forma Balance Sheet | |||
| Year 1 | Year 2 | Year 3 | |
| Assets | |||
| Current Assets | |||
| Cash | $116,502 | $128,921 | $159,540 |
| Inventory | $22,460 | $28,777 | $33,907 |
| Other Current Assets | $5,000 | $5,000 | $5,000 |
| Total Current Assets | $143,962 | $162,698 | $198,447 |
| Long-term Assets | |||
| Long-term Assets | $60,000 | $60,000 | $60,000 |
| Accumulated Depreciation | $6,000 | $12,000 | $18,000 |
| Total Long-term Assets | $54,000 | $48,000 | $42,000 |
| Total Assets | $197,962 | $210,698 | $240,447 |
| Liabilities and Capital | Year 1 | Year 2 | Year 3 |
| Current Liabilities | |||
| Accounts Payable | $24,735 | $30,545 | $35,589 |
| Current Borrowing | $46,400 | $42,800 | $39,200 |
| Other Current Liabilities | $0 | $0 | $0 |
| Subtotal Current Liabilities | $71,135 | $73,345 | $74,789 |
| Long-term Liabilities | $0 | $0 | $0 |
| Total Liabilities | $71,135 | $73,345 | $74,789 |
| Paid-in Capital | $150,000 | $150,000 | $150,000 |
| Retained Earnings | ($6,900) | ($23,173) | ($12,647) |
| Earnings | ($16,273) | $10,525 | $28,305 |
| Total Capital | $126,827 | $137,353 | $165,658 |
| Total Liabilities and Capital | $197,962 | $210,698 | $240,447 |
| Net Worth | $126,827 | $137,353 | $165,658 |
7.6 Business Ratios
Business ratios for the years of this plan are shown below. Industry profile ratios based on the Standard Industrial Classification (SIC) code 5411, [Convenience Stores, Independent], are shown for comparison.
| Ratio Analysis | ||||
| Year 1 | Year 2 | Year 3 | Industry Profile | |
| Sales Growth | 0.00% | 28.97% | 18.50% | 2.27% |
| Percent of Total Assets | ||||
| Inventory | 11.35% | 13.66% | 14.10% | 22.18% |
| Other Current Assets | 2.53% | 2.37% | 2.08% | 26.81% |
| Total Current Assets | 72.72% | 77.22% | 82.53% | 56.12% |
| Long-term Assets | 27.28% | 22.78% | 17.47% | 43.88% |
| Total Assets | 100.00% | 100.00% | 100.00% | 100.00% |
| Current Liabilities | 35.93% | 34.81% | 31.10% | 26.39% |
| Long-term Liabilities | 0.00% | 0.00% | 0.00% | 24.87% |
| Total Liabilities | 35.93% | 34.81% | 31.10% | 51.26% |
| Net Worth | 64.07% | 65.19% | 68.90% | 48.74% |
| Percent of Sales | ||||
| Sales | 100.00% | 100.00% | 100.00% | 100.00% |
| Gross Margin | 37.68% | 38.09% | 38.44% | 23.55% |
| Selling, General & Administrative Expenses | 42.02% | 35.91% | 33.49% | 16.21% |
| Advertising Expenses | 0.00% | 0.00% | 0.00% | 0.85% |
| Profit Before Interest and Taxes | -3.06% | 4.04% | 7.78% | 1.02% |
| Main Ratios | ||||
| Current | 2.02 | 2.22 | 2.65 | 1.68 |
| Quick | 1.71 | 1.83 | 2.20 | 0.71 |
| Total Debt to Total Assets | 35.93% | 34.81% | 31.10% | 57.28% |
| Pre-tax Return on Net Worth | -12.83% | 10.95% | 24.41% | 4.63% |
| Pre-tax Return on Assets | -8.22% | 7.14% | 16.82% | 10.83% |
| Additional Ratios | Year 1 | Year 2 | Year 3 | |
| Net Profit Margin | -4.35% | 2.18% | 4.95% | n.a |
| Return on Equity | -12.83% | 7.66% | 17.09% | n.a |
| Activity Ratios | ||||
| Inventory Turnover | 6.59 | 11.67 | 11.24 | n.a |
| Accounts Payable Turnover | 8.73 | 12.17 | 12.17 | n.a |
| Payment Days | 27 | 27 | 28 | n.a |
| Total Asset Turnover | 1.89 | 2.29 | 2.38 | n.a |
| Debt Ratios | ||||
| Debt to Net Worth | 0.56 | 0.53 | 0.45 | n.a |
| Current Liab. to Liab. | 1.00 | 1.00 | 1.00 | n.a |
| Liquidity Ratios | ||||
| Net Working Capital | $72,827 | $89,353 | $123,658 | n.a |
| Interest Coverage | -2.39 | 4.37 | 10.86 | n.a |
| Additional Ratios | ||||
| Assets to Sales | 0.53 | 0.44 | 0.42 | n.a |
| Current Debt/Total Assets | 36% | 35% | 31% | n.a |
| Acid Test | 1.71 | 1.83 | 2.20 | n.a |
| Sales/Net Worth | 2.95 | 3.52 | 3.45 | n.a |
| Dividend Payout | 0.00 | 0.00 | 0.00 | n.a |
Appendix
| Sales Forecast | |||||||||||||
| Month 1 | Month 2 | Month 3 | Month 4 | Month 5 | Month 6 | Month 7 | Month 8 | Month 9 | Month 10 | Month 11 | Month 12 | ||
| Sales | |||||||||||||
| Fresh Foods, Dairy and Drinks | 0% | $2,750 | $3,524 | $3,978 | $4,206 | $4,718 | $5,227 | $4,693 | $4,011 | $3,829 | $3,640 | $3,685 | $3,848 |
| Packaged Foods | 0% | $5,789 | $8,438 | $9,177 | $9,508 | $10,378 | $10,653 | $10,332 | $9,369 | $9,351 | $9,020 | $8,448 | $8,430 |
| Hard Goods | 0% | $2,700 | $2,819 | $2,946 | $3,802 | $4,077 | $3,786 | $3,551 | $3,730 | $3,921 | $3,125 | $4,344 | $4,578 |
| Beer, Wine and Cigarettes | 0% | $8,750 | $9,088 | $9,442 | $13,450 | $14,288 | $13,216 | $11,046 | $11,498 | $11,973 | $12,471 | $12,995 | $12,545 |
| Rental Income | 0% | $1,000 | $1,000 | $1,000 | $1,000 | $1,000 | $1,000 | $1,000 | $1,000 | $1,000 | $1,000 | $1,000 | $1,000 |
| Prepackaged Meals | 0% | $942 | $1,071 | $1,188 | $1,821 | $2,282 | $2,184 | $1,784 | $1,824 | $1,832 | $1,856 | $2,192 | $2,264 |
| Total Sales | $21,931 | $25,940 | $27,731 | $33,786 | $36,742 | $36,066 | $32,406 | $31,432 | $31,906 | $31,112 | $32,664 | $32,665 | |
| Direct Cost of Sales | Month 1 | Month 2 | Month 3 | Month 4 | Month 5 | Month 6 | Month 7 | Month 8 | Month 9 | Month 10 | Month 11 | Month 12 | |
| Fresh Foods | $1,375 | $1,762 | $1,989 | $2,103 | $2,359 | $2,614 | $2,346 | $2,006 | $1,914 | $1,820 | $1,842 | $1,924 | |
| Packaged Foods | $659 | $749 | $831 | $1,275 | $1,597 | $1,529 | $1,249 | $1,277 | $1,282 | $1,299 | $1,534 | $1,585 | |
| Hard Goods | $10,965 | $12,970 | $13,866 | $16,893 | $18,371 | $18,033 | $16,203 | $15,716 | $15,953 | $15,556 | $16,332 | $16,333 | |
| Drinks (inc. beer and wine) | $0 | $0 | $0 | $0 | $0 | $0 | $0 | $0 | $0 | $0 | $0 | $0 | |
| Prepackaged Meals | $413 | $529 | $597 | $631 | $708 | $784 | $704 | $602 | $574 | $546 | $553 | $577 | |
| Subtotal Direct Cost of Sales | $13,412 | $16,010 | $17,283 | $20,902 | $23,035 | $22,959 | $20,502 | $19,600 | $19,724 | $19,221 | $20,261 | $20,419 | |
| Personnel Plan | |||||||||||||
| Month 1 | Month 2 | Month 3 | Month 4 | Month 5 | Month 6 | Month 7 | Month 8 | Month 9 | Month 10 | Month 11 | Month 12 | ||
| Heidi Renner | 0% | $2,500 | $2,500 | $2,500 | $2,500 | $2,500 | $2,500 | $2,500 | $2,500 | $2,500 | $2,500 | $2,500 | $2,500 |
| Thomas Renner | 0% | $1,500 | $1,500 | $1,500 | $1,500 | $1,500 | $1,500 | $1,500 | $1,500 | $1,500 | $1,500 | $1,500 | $1,500 |
| Cashiers | 0% | $3,600 | $3,600 | $3,600 | $3,600 | $3,600 | $3,600 | $3,600 | $3,600 | $3,600 | $3,600 | $3,600 | $3,600 |
| Other | 0% | $0 | $0 | $0 | $0 | $0 | $0 | $0 | $0 | $0 | $0 | $0 | $0 |
| Total People | 0 | 0 | 0 | 0 | 0 | 0 | 0 | 0 | 0 | 0 | 0 | 0 | |
| Total Payroll | $7,600 | $7,600 | $7,600 | $7,600 | $7,600 | $7,600 | $7,600 | $7,600 | $7,600 | $7,600 | $7,600 | $7,600 | |
| General Assumptions | |||||||||||||
| Month 1 | Month 2 | Month 3 | Month 4 | Month 5 | Month 6 | Month 7 | Month 8 | Month 9 | Month 10 | Month 11 | Month 12 | ||
| Plan Month | 1 | 2 | 3 | 4 | 5 | 6 | 7 | 8 | 9 | 10 | 11 | 12 | |
| Current Interest Rate | 10.00% | 10.00% | 10.00% | 10.00% | 10.00% | 10.00% | 10.00% | 10.00% | 10.00% | 10.00% | 10.00% | 10.00% | |
| Long-term Interest Rate | 10.00% | 10.00% | 10.00% | 10.00% | 10.00% | 10.00% | 10.00% | 10.00% | 10.00% | 10.00% | 10.00% | 10.00% | |
| Tax Rate | 30.00% | 30.00% | 30.00% | 30.00% | 30.00% | 30.00% | 30.00% | 30.00% | 30.00% | 30.00% | 30.00% | 30.00% | |
| Other | 0 | 0 | 0 | 0 | 0 | 0 | 0 | 0 | 0 | 0 | 0 | 0 | |
| Pro Forma Profit and Loss | |||||||||||||
| Month 1 | Month 2 | Month 3 | Month 4 | Month 5 | Month 6 | Month 7 | Month 8 | Month 9 | Month 10 | Month 11 | Month 12 | ||
| Sales | $21,931 | $25,940 | $27,731 | $33,786 | $36,742 | $36,066 | $32,406 | $31,432 | $31,906 | $31,112 | $32,664 | $32,665 | |
| Direct Cost of Sales | $13,412 | $16,010 | $17,283 | $20,902 | $23,035 | $22,959 | $20,502 | $19,600 | $19,724 | $19,221 | $20,261 | $20,419 | |
| Other Costs of Goods | $0 | $0 | $0 | $0 | $0 | $0 | $0 | $0 | $0 | $0 | $0 | $0 | |
| Total Cost of Sales | $13,412 | $16,010 | $17,283 | $20,902 | $23,035 | $22,959 | $20,502 | $19,600 | $19,724 | $19,221 | $20,261 | $20,419 | |
| Gross Margin | $8,519 | $9,930 | $10,448 | $12,885 | $13,707 | $13,106 | $11,904 | $11,832 | $12,182 | $11,891 | $12,402 | $12,247 | |
| Gross Margin % | 38.84% | 38.28% | 37.68% | 38.14% | 37.31% | 36.34% | 36.73% | 37.64% | 38.18% | 38.22% | 37.97% | 37.49% | |
| Expenses | |||||||||||||
| Payroll | $7,600 | $7,600 | $7,600 | $7,600 | $7,600 | $7,600 | $7,600 | $7,600 | $7,600 | $7,600 | $7,600 | $7,600 | |
| Sales and Marketing and Other Expenses | $200 | $200 | $200 | $200 | $200 | $200 | $200 | $200 | $200 | $200 | $200 | $200 | |
| Depreciation | $500 | $500 | $500 | $500 | $500 | $500 | $500 | $500 | $500 | $500 | $500 | $500 | |
| Rent | $3,000 | $3,000 | $3,000 | $3,000 | $3,000 | $3,000 | $3,000 | $3,000 | $3,000 | $3,000 | $3,000 | $3,000 | |
| Utilities | $500 | $500 | $500 | $500 | $500 | $500 | $500 | $500 | $500 | $500 | $500 | $500 | |
| Insurance | $150 | $150 | $150 | $150 | $150 | $150 | $150 | $150 | $150 | $150 | $150 | $150 | |
| Payroll Taxes | 10% | $760 | $760 | $760 | $760 | $760 | $760 | $760 | $760 | $760 | $760 | $760 | $760 |
| Other | $0 | $0 | $0 | $0 | $0 | $0 | $0 | $0 | $0 | $0 | $0 | $0 | |
| Total Operating Expenses | $12,710 | $12,710 | $12,710 | $12,710 | $12,710 | $12,710 | $12,710 | $12,710 | $12,710 | $12,710 | $12,710 | $12,710 | |
| Profit Before Interest and Taxes | ($4,191) | ($2,780) | ($2,262) | $175 | $997 | $396 | ($806) | ($878) | ($528) | ($819) | ($308) | ($464) | |
| EBITDA | ($3,691) | ($2,280) | ($1,762) | $675 | $1,497 | $896 | ($306) | ($378) | ($28) | ($319) | $192 | $37 | |
| Interest Expense | $414 | $412 | $409 | $407 | $404 | $402 | $399 | $397 | $394 | $392 | $389 | $387 | |
| Taxes Incurred | $0 | $0 | $0 | $0 | $0 | $0 | $0 | $0 | $0 | $0 | $0 | $0 | |
| Net Profit | ($4,606) | ($3,192) | ($2,671) | ($232) | $593 | ($5) | ($1,205) | ($1,275) | ($922) | ($1,211) | ($697) | ($850) | |
| Net Profit/Sales | -21.00% | -12.31% | -9.63% | -0.69% | 1.61% | -0.01% | -3.72% | -4.06% | -2.89% | -3.89% | -2.13% | -2.60% | |
| Pro Forma Cash Flow | |||||||||||||
| Month 1 | Month 2 | Month 3 | Month 4 | Month 5 | Month 6 | Month 7 | Month 8 | Month 9 | Month 10 | Month 11 | Month 12 | ||
| Cash Received | |||||||||||||
| Cash from Operations | |||||||||||||
| Cash Sales | $21,931 | $25,940 | $27,731 | $33,786 | $36,742 | $36,066 | $32,406 | $31,432 | $31,906 | $31,112 | $32,664 | $32,665 | |
| Subtotal Cash from Operations | $21,931 | $25,940 | $27,731 | $33,786 | $36,742 | $36,066 | $32,406 | $31,432 | $31,906 | $31,112 | $32,664 | $32,665 | |
| Additional Cash Received | |||||||||||||
| Sales Tax, VAT, HST/GST Received | 0.00% | $0 | $0 | $0 | $0 | $0 | $0 | $0 | $0 | $0 | $0 | $0 | $0 |
| New Current Borrowing | $0 | $0 | $0 | $0 | $0 | $0 | $0 | $0 | $0 | $0 | $0 | $0 | |
| New Other Liabilities (interest-free) | $0 | $0 | $0 | $0 | $0 | $0 | $0 | $0 | $0 | $0 | $0 | $0 | |
| New Long-term Liabilities | $0 | $0 | $0 | $0 | $0 | $0 | $0 | $0 | $0 | $0 | $0 | $0 | |
| Sales of Other Current Assets | $0 | $0 | $0 | $0 | $0 | $0 | $0 | $0 | $0 | $0 | $0 | $0 | |
| Sales of Long-term Assets | $0 | $0 | $0 | $0 | $0 | $0 | $0 | $0 | $0 | $0 | $0 | $0 | |
| New Investment Received | $0 | $0 | $0 | $0 | $0 | $0 | $0 | $0 | $0 | $0 | $0 | $0 | |
| Subtotal Cash Received | $21,931 | $25,940 | $27,731 | $33,786 | $36,742 | $36,066 | $32,406 | $31,432 | $31,906 | $31,112 | $32,664 | $32,665 | |
| Expenditures | Month 1 | Month 2 | Month 3 | Month 4 | Month 5 | Month 6 | Month 7 | Month 8 | Month 9 | Month 10 | Month 11 | Month 12 | |
| Expenditures from Operations | |||||||||||||
| Cash Spending | $7,600 | $7,600 | $7,600 | $7,600 | $7,600 | $7,600 | $7,600 | $7,600 | $7,600 | $7,600 | $7,600 | $7,600 | |
| Bill Payments | $167 | $5,024 | $5,022 | $5,019 | $5,549 | $21,223 | $27,719 | $22,835 | $23,656 | $24,825 | $23,761 | $26,378 | |
| Subtotal Spent on Operations | $7,767 | $12,624 | $12,622 | $12,619 | $13,149 | $28,823 | $35,319 | $30,435 | $31,256 | $32,425 | $31,361 | $33,978 | |
| Additional Cash Spent | |||||||||||||
| Sales Tax, VAT, HST/GST Paid Out | $0 | $0 | $0 | $0 | $0 | $0 | $0 | $0 | $0 | $0 | $0 | $0 | |
| Principal Repayment of Current Borrowing | $300 | $300 | $300 | $300 | $300 | $300 | $300 | $300 | $300 | $300 | $300 | $300 | |
| Other Liabilities Principal Repayment | $0 | $0 | $0 | $0 | $0 | $0 | $0 | $0 | $0 | $0 | $0 | $0 | |
| Long-term Liabilities Principal Repayment | $0 | $0 | $0 | $0 | $0 | $0 | $0 | $0 | $0 | $0 | $0 | $0 | |
| Purchase Other Current Assets | $0 | $0 | $0 | $0 | $0 | $0 | $0 | $0 | $0 | $0 | $0 | $0 | |
| Purchase Long-term Assets | $30,000 | $0 | $0 | $0 | $0 | $0 | $0 | $0 | $0 | $0 | $0 | $0 | |
| Dividends | $0 | $0 | $0 | $0 | $0 | $0 | $0 | $0 | $0 | $0 | $0 | $0 | |
| Subtotal Cash Spent | $38,067 | $12,924 | $12,922 | $12,919 | $13,449 | $29,123 | $35,619 | $30,735 | $31,556 | $32,725 | $31,661 | $34,278 | |
| Net Cash Flow | ($16,137) | $13,016 | $14,810 | $20,867 | $23,293 | $6,943 | ($3,213) | $697 | $349 | ($1,613) | $1,003 | ($1,613) | |
| Cash Balance | $41,963 | $54,979 | $69,788 | $90,656 | $113,949 | $120,891 | $117,678 | $118,375 | $118,724 | $117,112 | $118,115 | $116,502 | |
| Pro Forma Balance Sheet | |||||||||||||
| Month 1 | Month 2 | Month 3 | Month 4 | Month 5 | Month 6 | Month 7 | Month 8 | Month 9 | Month 10 | Month 11 | Month 12 | ||
| Assets | Starting Balances | ||||||||||||
| Current Assets | |||||||||||||
| Cash | $58,100 | $41,963 | $54,979 | $69,788 | $90,656 | $113,949 | $120,891 | $117,678 | $118,375 | $118,724 | $117,112 | $118,115 | $116,502 |
| Inventory | $100,000 | $86,588 | $70,578 | $53,295 | $32,393 | $25,338 | $25,255 | $22,552 | $21,560 | $21,696 | $21,143 | $22,288 | $22,460 |
| Other Current Assets | $5,000 | $5,000 | $5,000 | $5,000 | $5,000 | $5,000 | $5,000 | $5,000 | $5,000 | $5,000 | $5,000 | $5,000 | $5,000 |
| Total Current Assets | $163,100 | $133,551 | $130,557 | $128,083 | $128,049 | $144,287 | $151,146 | $145,230 | $144,935 | $145,421 | $143,255 | $145,402 | $143,962 |
| Long-term Assets | |||||||||||||
| Long-term Assets | $30,000 | $60,000 | $60,000 | $60,000 | $60,000 | $60,000 | $60,000 | $60,000 | $60,000 | $60,000 | $60,000 | $60,000 | $60,000 |
| Accumulated Depreciation | $0 | $500 | $1,000 | $1,500 | $2,000 | $2,500 | $3,000 | $3,500 | $4,000 | $4,500 | $5,000 | $5,500 | $6,000 |
| Total Long-term Assets | $30,000 | $59,500 | $59,000 | $58,500 | $58,000 | $57,500 | $57,000 | $56,500 | $56,000 | $55,500 | $55,000 | $54,500 | $54,000 |
| Total Assets | $193,100 | $193,051 | $189,557 | $186,583 | $186,049 | $201,787 | $208,146 | $201,730 | $200,935 | $200,921 | $198,255 | $199,902 | $197,962 |
| Liabilities and Capital | Month 1 | Month 2 | Month 3 | Month 4 | Month 5 | Month 6 | Month 7 | Month 8 | Month 9 | Month 10 | Month 11 | Month 12 | |
| Current Liabilities | |||||||||||||
| Accounts Payable | $0 | $4,857 | $4,854 | $4,852 | $4,849 | $20,294 | $26,959 | $22,048 | $22,828 | $24,036 | $22,881 | $25,525 | $24,735 |
| Current Borrowing | $50,000 | $49,700 | $49,400 | $49,100 | $48,800 | $48,500 | $48,200 | $47,900 | $47,600 | $47,300 | $47,000 | $46,700 | $46,400 |
| Other Current Liabilities | $0 | $0 | $0 | $0 | $0 | $0 | $0 | $0 | $0 | $0 | $0 | $0 | $0 |
| Subtotal Current Liabilities | $50,000 | $54,557 | $54,254 | $53,952 | $53,649 | $68,794 | $75,159 | $69,948 | $70,428 | $71,336 | $69,881 | $72,225 | $71,135 |
| Long-term Liabilities | $0 | $0 | $0 | $0 | $0 | $0 | $0 | $0 | $0 | $0 | $0 | $0 | $0 |
| Total Liabilities | $50,000 | $54,557 | $54,254 | $53,952 | $53,649 | $68,794 | $75,159 | $69,948 | $70,428 | $71,336 | $69,881 | $72,225 | $71,135 |
| Paid-in Capital | $150,000 | $150,000 | $150,000 | $150,000 | $150,000 | $150,000 | $150,000 | $150,000 | $150,000 | $150,000 | $150,000 | $150,000 | $150,000 |
| Retained Earnings | ($6,900) | ($6,900) | ($6,900) | ($6,900) | ($6,900) | ($6,900) | ($6,900) | ($6,900) | ($6,900) | ($6,900) | ($6,900) | ($6,900) | ($6,900) |
| Earnings | $0 | ($4,606) | ($7,797) | ($10,468) | ($10,700) | ($10,107) | ($10,112) | ($11,318) | ($12,592) | ($13,515) | ($14,726) | ($15,422) | ($16,273) |
| Total Capital | $143,100 | $138,494 | $135,303 | $132,632 | $132,400 | $132,993 | $132,988 | $131,782 | $130,508 | $129,585 | $128,374 | $127,678 | $126,827 |
| Total Liabilities and Capital | $193,100 | $193,051 | $189,557 | $186,583 | $186,049 | $201,787 | $208,146 | $201,730 | $200,935 | $200,921 | $198,255 | $199,902 | $197,962 |
| Net Worth | $143,100 | $138,494 | $135,303 | $132,632 | $132,400 | $132,993 | $132,988 | $131,782 | $130,508 | $129,585 | $128,374 | $127,678 | $126,827 |

