
HodgePodge Sealcoating Company
Executive Summary
HodgePodge Sealcoating Company is a service provider that offers crack filling and sealcoating to residential customers. Sealcoating protects asphalt driveways by filling the cracks and coating the surface of the driveway, protecting it against the elements. HodgePodge will leverage their industry-benchmarked customer service to rapidly gain market share.
Although HodgePodge is a seasonal business (cold temperatures and rain do not allow the coating to cure properly) spanning eight months, they will maintain an office/garage year round because they were able to find a low rent facility in an industrial district. Even while only operating seasonally, HodgePodge will reach profitability by month seven and will achieve respectable profits by the end of year three.

1.1 Objectives
The objectives for the first three years of operation include:
- To create a service-based company whose primary goal is to exceed customer’s expectations.
- To increase the number of clients by 20% per year through superior service.
- To develop a sustainable start-up business, surviving off its own cash flow.
1.2 Keys to Success
The keys to success will be to provide a reasonably priced sealcoating job that exceeds customer’s objective expectations. Objective is used as a modifier as the sealcoating business is not known for outstanding customer service.
1.3 Mission
HodgePodge Sealcoating Company’s mission is to provide customers with the finest level of service available in the industry. We exist to attract and maintain customers. When we adhere to this maxim, everything else will fall into place. Our services will exceed the expectations of our customers.
Company Summary
HodgePodge Sealcoating Company, soon to be based in Washington, PA, is a sealcoating company that serves the residential market. HodgePodge will based out of a garage with a room attached to serve as the storage facility and office. The truck will be stored in this facility as well as the raw materials. Attached to this space is small room that will serve as the office.
HodgePodge is a seasonal business as a sealcoat cannot be applied when it is too cold or if it is wet. The garage/office set up is located in an industrial area which will lower the rental cost enough so it is not a burden to hold on to the office during the off-season.
2.1 Company Ownership
HodgePodge is a sole proprietorship owned and operated by Dan Slopster.
2.2 Start-up Summary
HodgePodge will incur the following start-up costs:
- Computer system with CD-RW, printer, Microsoft Office, QuickBooks Pro, and Internet connection.
- Desk, chair, file cabinet and cellular phone.
- Pickup truck and gasoline leaf blower.
- Sealcoating mixer and hot crack filler mixer.
- Squeegees for sealcoat and crack filler application.
- Containers for raw ingredient storage and sand (for filling cracks larger than 1/8th inch in depth).
- Work clothing and water container.
Some items are considered assets to be used for more than a year, and will be labeled long-term assets and will be depreciated using G.A.A.P. approved straight-line depreciation method.
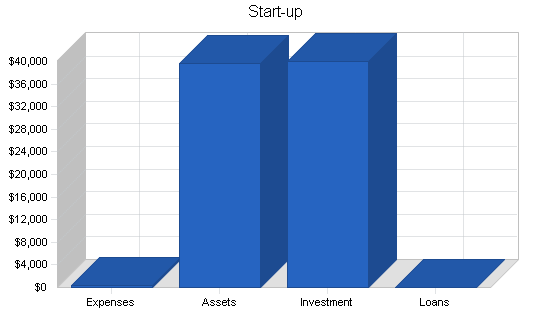
| Start-up | |
| Requirements | |
| Start-up Expenses | |
| Legal | $200 |
| Stationery etc. | $200 |
| Brochures | $0 |
| Consultants | $0 |
| Insurance | $0 |
| Rent | $0 |
| Research and Development | $0 |
| Expensed Equipment | $0 |
| Other | $0 |
| Total Start-up Expenses | $400 |
| Start-up Assets | |
| Cash Required | $28,800 |
| Other Current Assets | $0 |
| Long-term Assets | $10,800 |
| Total Assets | $39,600 |
| Total Requirements | $40,000 |
| Start-up Funding | |
| Start-up Expenses to Fund | $400 |
| Start-up Assets to Fund | $39,600 |
| Total Funding Required | $40,000 |
| Assets | |
| Non-cash Assets from Start-up | $10,800 |
| Cash Requirements from Start-up | $28,800 |
| Additional Cash Raised | $0 |
| Cash Balance on Starting Date | $28,800 |
| Total Assets | $39,600 |
| Liabilities and Capital | |
| Liabilities | |
| Current Borrowing | $0 |
| Long-term Liabilities | $0 |
| Accounts Payable (Outstanding Bills) | $0 |
| Other Current Liabilities (interest-free) | $0 |
| Total Liabilities | $0 |
| Capital | |
| Planned Investment | |
| Dan | $40,000 |
| Investor 2 | $0 |
| Other | $0 |
| Additional Investment Requirement | $0 |
| Total Planned Investment | $40,000 |
| Loss at Start-up (Start-up Expenses) | ($400) |
| Total Capital | $39,600 |
| Total Capital and Liabilities | $39,600 |
| Total Funding | $40,000 |
Services
HodgePodge provides residential sealcoating and crack filling. Sealcoating is the process of spreading a thin layer of an asphalt-based product that coats the surface of an asphalt driveway, filling in small cracks and sealing the surface against the elements. Part of the sealcoating process is applying crack filler first, a rubberized liquid that fills the gaps that are created in the driveway. If the crack is more than 1/8th inch in depth, sand must be added to fill up the empty space.
Before the driveway is ready to be sealcoated it must first be cleared of all debris. This will help adhesion of the sealcoat. Once the driveway is clear of debris, the cracks are filled. Next the sealcoat goes on and the driveway must then dry for 24 hours before use.
The typical cost for sealcoating a driveway ranges from $200-$300 depending on size and condition of the driveway.
Market Analysis Summary
HodgePodge has identified two distinct segments of the population that are consumers of a sealcoating service. HodgePodge will have one marketing campaign that will reach both populations.
4.1 Market Segmentation
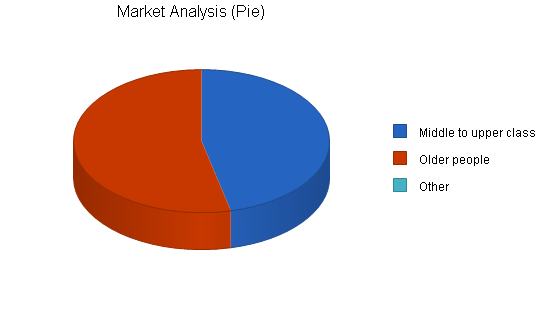
HodgePodge’s market can be segmented into two groups:
- People with disposable income who can afford to pay someone. This group typically has a household income over $50,000 and pay many service providers to maintain their home (i.e. lawn care).
- Older people that believe they are not physically capable of doing it themselves, or choose not to. This group believes that sealcoating is too much exertion for them or way too messy, particularly at their age. This group also believes that sealcoating the driveway will greatly extend the life of the driveway.
| Market Analysis | |||||||
| Year 1 | Year 2 | Year 3 | Year 4 | Year 5 | |||
| Potential Customers | Growth | CAGR | |||||
| Middle to upper class | 9% | 18,545 | 20,214 | 22,033 | 24,016 | 26,177 | 9.00% |
| Older people | 8% | 21,455 | 23,171 | 25,025 | 27,027 | 29,189 | 8.00% |
| Other | 0% | 0 | 0 | 0 | 0 | 0 | 0.00% |
| Total | 8.47% | 40,000 | 43,385 | 47,058 | 51,043 | 55,366 | 8.47% |
4.2 Target Market Segment Strategy
HodgePodge’s strategy for reaching these people will be based on a series of advertisements in the local paper. Within the metro section of the paper there is an area where local service providers advertise. This section appears to be well received by the readership as people of the community often refer to this section when they are trying to find a service provider.
In addition to the advertisements, HodgePodge will also have a yellow pages advertisement. Lastly, HodgePodge will leverage word of mouth referrals. HodgePodge will create an economic incentive for current customers to make a referral for a new customer. While this will take a small amount away from profit margins, it will build a loyal customer base for successive years.
4.3 Service Business Analysis
The sealcoating business is made up of primarily independent contractors, larger paving companies, and a few franchises. In general the bulk of the business is from independent contractors.
4.3.1 Competition and Buying Patterns
The sealcoating industry is made up of independent contractors that do paving and sealcoating, as well as two sealcoat specific companies, Dura-Seal and Sealer King.
The buying patterns of consumers are typically based on price and and perceived customer service, with an emphasis on price. Price is emphasized is because there often is little to differentiate companies based on the actual product (because the customer is not aware of the seal coating materials until the job is done and even then it is very difficult for the consumer to perceive a difference) and in general the industry is not known for its stellar customer service.
Strategy and Implementation Summary
HodgePodge will be aggressively courting new customers by leveraging their competitive advantage of superior customer support. In an industry that is not known for their customer support, it is quite easy to stand out with good customer service. During the initial estimation phases, HodgePodge employees will be able to professionally respond to any questions that the customer may have. This meeting also gives HodgePodge the opportunity to provide the customer with a written pamphlet of information that explains information about HodgePodge the company, offers general information about sealcoating, the pros and cons of sealcoating as well as what expectations the consumer can reasonably have about a sealcoating service provider. This initial interaction will give HodgePodge an opportunity to show off its stellar customer service, which will turn the prospective person into a client.

5.1 Competitive Edge
HodgePodge’s competitive edge is outstanding customer service. This begins with the initial interaction when providing the customer with an estimate. The next chance to shine is the time when the company is on-site laying down the sealcoat. Upon finishing the job an employee will briefly speak (or leave written documentation if the customer is not home) with the customer detailing what was just done to their driveway, what needs to be done in regards to curing, what are some reasonable expectations in regards to the service and what to do if they have any problems or questions.
The employees will be specifically trained on how to interact with the customer so HodgePodge will feel comfortable in letting the employees who are laying down the sealcoating be HodgePodge’s representative with the customer.
5.2 Sales Strategy
HodgePodge’s sales strategy will be based on impressing the customer with excellent customer service when HodgePodge’s representative meets with the prospective customer. The sealcoating costs between all of the different competitors are going to be quite similar. Regardless, it is difficult to compete on price.
With this in mind, HodgePodge will compete on superior service. HodgePodge will give the customer detailed information about sealcoating, what the advantages and disadvantages are, and what are reasonable expectations consumers should have. HodgePodge will arm the prospective consumer with information to make a more educated choice. HodgePodge believes that by providing the customer with as much information about the service, they will choose HodgePodge’s because they appreciate HodgePodge attempt to benefit the consumer.
5.2.1 Sales Forecast
There will be no sales activity during the first month so this time will be used to set up the work area and the office. The next month will be used to line up initial customers as well hire and train employees. By the third month, HodgePodge will begin sealcoating driveways. Business should steadily grow through September when the season will begin to wind down. Profitability will be reached by month seven.


| Sales Forecast | |||
| Year 1 | Year 2 | Year 3 | |
| Sales | |||
| Middle to upper class | $30,129 | $85,474 | $92,454 |
| Older people | $29,551 | $83,254 | $90,145 |
| Total Sales | $59,680 | $168,728 | $182,599 |
| Direct Cost of Sales | Year 1 | Year 2 | Year 3 |
| Middle to upper class | $3,013 | $8,547 | $9,245 |
| Older people | $2,955 | $8,325 | $9,015 |
| Subtotal Direct Cost of Sales | $5,968 | $16,873 | $18,260 |
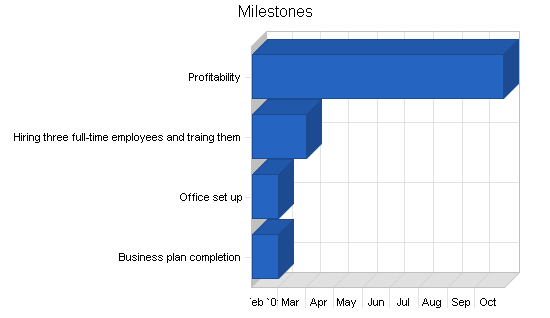
5.3 Milestones
HodgePodge will have several milestones early on:
- Business plan completion. This will be done as a roadmap for the organization. This will be an indispensable tool for the ongoing performance and improvement of the company.
- Office set up.
- Hiring three full-time employees and training them.
- Profitability.
| Milestones | |||||
| Milestone | Start Date | End Date | Budget | Manager | Department |
| Business plan completion | 2/1/2001 | 3/1/2001 | $0 | ABC | Marketing |
| Office set up | 2/1/2001 | 3/1/2001 | $0 | ABC | Department |
| Hiring three full-time employees and traing them | 2/1/2001 | 4/1/2001 | $0 | ABC | Department |
| Profitability | 2/1/2001 | 10/31/2001 | $0 | ABC | Department |
| Totals | $0 | ||||
Management Summary
HodgePodge is owned and operated by Dan Slopster. Dan was first introduced to sealcoating during his summer before leaving for college. Dan created his own small sealcoating company where he would walk around the neighborhood and sign up neighbors for sealcoating jobs. This occurred after sealcoating his parents driveway and recognizing that after you get into a rhythm, it was not that difficult. Dan would do everything himself, the soliciting of the job as well as all the work.
The next year Dan went off to college, pursuing his Bachelor of Arts at Washington and Jefferson College. When Dan came home during the summers, he usually had several old customers calling him asking him to do their driveway. Dan was generally more than happy as it was easy money for him. Ultimately, Dan graduated and went to work in the Human Resource department of Heinz which have their corporate offices in Pittsburgh. This was a good experience but working for someone for the rest of Dan’s life is not his cup of tea.
Dan left Heinz, moved down to Washington, PA and began contemplating what he could do as his own boss. After researching the market he realized that his old job as a sealcoater was an especially attractive industry because the industry in general had poor customer service. His research indicated a new company could be a success if it concentrated on satisfying the customer.
6.1 Personnel Plan
Dan will be working full time for HodgePodge. He will be doing the hiring, training, sales, and strategic development, as well as helping out with the actual driveway work for training proposes.
Three full-time employees will be hired by month three and they will be working with HodgePodge through the beginning of November when the sealcoating season will be coming to an end.
For the second season, three more people will be hired (an additional crew).
| Personnel Plan | |||
| Year 1 | Year 2 | Year 3 | |
| Dan | $36,000 | $36,000 | $36,000 |
| Employee 1 | $8,960 | $8,960 | $8,960 |
| Employee 2 | $8,960 | $8,960 | $8,960 |
| Employee 3 | $8,960 | $8,960 | $8,960 |
| Employee 4 | $0 | $8,960 | $8,960 |
| Employee 5 | $0 | $8,960 | $8,960 |
| Employee 6 | $0 | $8,960 | $8,960 |
| Total People | 1 | 7 | 7 |
| Total Payroll | $62,880 | $89,760 | $89,760 |
Financial Plan
The following sections will outline important financial information.
7.1 Important Assumptions
The following table details important financial assumptions.
| General Assumptions | |||
| Year 1 | Year 2 | Year 3 | |
| Plan Month | 1 | 2 | 3 |
| Current Interest Rate | 10.00% | 10.00% | 10.00% |
| Long-term Interest Rate | 10.00% | 10.00% | 10.00% |
| Tax Rate | 30.00% | 30.00% | 30.00% |
| Other | 0 | 0 | 0 |
7.2 Break-even Analysis
The Break-even Analysis indicates what will be needed in monthly revenue to reach the break-even point.

| Break-even Analysis | |
| Monthly Revenue Break-even | $7,571 |
| Assumptions: | |
| Average Percent Variable Cost | 10% |
| Estimated Monthly Fixed Cost | $6,814 |
7.3 Projected Profit and Loss
The following table will indicate projected profit and loss.


| Pro Forma Profit and Loss | |||
| Year 1 | Year 2 | Year 3 | |
| Sales | $59,680 | $168,728 | $182,599 |
| Direct Cost of Sales | $5,968 | $16,873 | $18,260 |
| Other Production Expenses | $0 | $0 | $0 |
| Total Cost of Sales | $5,968 | $16,873 | $18,260 |
| Gross Margin | $53,712 | $151,855 | $164,339 |
| Gross Margin % | 90.00% | 90.00% | 90.00% |
| Expenses | |||
| Payroll | $62,880 | $89,760 | $89,760 |
| Sales and Marketing and Other Expenses | $700 | $700 | $700 |
| Depreciation | $2,160 | $4,260 | $4,260 |
| Leased Equipment | $0 | $0 | $0 |
| Utilities | $600 | $600 | $600 |
| Insurance | $1,200 | $1,200 | $1,200 |
| Rent | $4,800 | $4,800 | $4,800 |
| Payroll Taxes | $9,432 | $13,464 | $13,464 |
| Other | $0 | $0 | $0 |
| Total Operating Expenses | $81,772 | $114,784 | $114,784 |
| Profit Before Interest and Taxes | ($28,060) | $37,071 | $49,555 |
| EBITDA | ($25,900) | $41,331 | $53,815 |
| Interest Expense | ($65) | ($180) | ($270) |
| Taxes Incurred | $0 | $11,175 | $14,948 |
| Net Profit | ($27,995) | $26,076 | $34,878 |
| Net Profit/Sales | -46.91% | 15.45% | 19.10% |
7.4 Projected Cash Flow
The following chart and table will indicate projected cash flow.

| Pro Forma Cash Flow | |||
| Year 1 | Year 2 | Year 3 | |
| Cash Received | |||
| Cash from Operations | |||
| Cash Sales | $59,680 | $168,728 | $182,599 |
| Subtotal Cash from Operations | $59,680 | $168,728 | $182,599 |
| Additional Cash Received | |||
| Sales Tax, VAT, HST/GST Received | $0 | $0 | $0 |
| New Current Borrowing | $0 | $0 | $0 |
| New Other Liabilities (interest-free) | $0 | $0 | $0 |
| New Long-term Liabilities | $0 | $0 | $0 |
| Sales of Other Current Assets | $0 | $0 | $0 |
| Sales of Long-term Assets | $0 | $0 | $0 |
| New Investment Received | $0 | $0 | $0 |
| Subtotal Cash Received | $59,680 | $168,728 | $182,599 |
| Expenditures | Year 1 | Year 2 | Year 3 |
| Expenditures from Operations | |||
| Cash Spending | $62,880 | $89,760 | $89,760 |
| Bill Payments | $21,678 | $45,592 | $53,285 |
| Subtotal Spent on Operations | $84,558 | $135,352 | $143,045 |
| Additional Cash Spent | |||
| Sales Tax, VAT, HST/GST Paid Out | $0 | $0 | $0 |
| Principal Repayment of Current Borrowing | $1,200 | $1,200 | $600 |
| Other Liabilities Principal Repayment | $0 | $0 | $0 |
| Long-term Liabilities Principal Repayment | $0 | $0 | $0 |
| Purchase Other Current Assets | $0 | $0 | $0 |
| Purchase Long-term Assets | $0 | $10,500 | $0 |
| Dividends | $0 | $0 | $0 |
| Subtotal Cash Spent | $85,758 | $147,052 | $143,645 |
| Net Cash Flow | ($26,078) | $21,676 | $38,954 |
| Cash Balance | $2,722 | $24,398 | $63,352 |
7.5 Projected Balance Sheet
The following table will indicate the projected balance sheet.
| Pro Forma Balance Sheet | |||
| Year 1 | Year 2 | Year 3 | |
| Assets | |||
| Current Assets | |||
| Cash | $2,722 | $24,398 | $63,352 |
| Other Current Assets | $0 | $0 | $0 |
| Total Current Assets | $2,722 | $24,398 | $63,352 |
| Long-term Assets | |||
| Long-term Assets | $10,800 | $21,300 | $21,300 |
| Accumulated Depreciation | $2,160 | $6,420 | $10,680 |
| Total Long-term Assets | $8,640 | $14,880 | $10,620 |
| Total Assets | $11,362 | $39,278 | $73,972 |
| Liabilities and Capital | Year 1 | Year 2 | Year 3 |
| Current Liabilities | |||
| Accounts Payable | $957 | $3,997 | $4,414 |
| Current Borrowing | ($1,200) | ($2,400) | ($3,000) |
| Other Current Liabilities | $0 | $0 | $0 |
| Subtotal Current Liabilities | ($243) | $1,597 | $1,414 |
| Long-term Liabilities | $0 | $0 | $0 |
| Total Liabilities | ($243) | $1,597 | $1,414 |
| Paid-in Capital | $40,000 | $40,000 | $40,000 |
| Retained Earnings | ($400) | ($28,395) | ($2,319) |
| Earnings | ($27,995) | $26,076 | $34,878 |
| Total Capital | $11,605 | $37,681 | $72,558 |
| Total Liabilities and Capital | $11,362 | $39,278 | $73,972 |
| Net Worth | $11,605 | $37,681 | $72,558 |
7.6 Business Ratios
Business ratios for the years of this plan are shown below. Industry profile ratios based on the Standard Industrial Classification (SIC) code 1771, Concrete work, are shown for comparison.
| Ratio Analysis | ||||
| Year 1 | Year 2 | Year 3 | Industry Profile | |
| Sales Growth | 0.00% | 182.72% | 8.22% | 7.50% |
| Percent of Total Assets | ||||
| Other Current Assets | 0.00% | 0.00% | 0.00% | 29.80% |
| Total Current Assets | 23.96% | 62.12% | 85.64% | 67.00% |
| Long-term Assets | 76.04% | 37.88% | 14.36% | 33.00% |
| Total Assets | 100.00% | 100.00% | 100.00% | 100.00% |
| Current Liabilities | -2.14% | 4.07% | 1.91% | 43.50% |
| Long-term Liabilities | 0.00% | 0.00% | 0.00% | 14.10% |
| Total Liabilities | -2.14% | 4.07% | 1.91% | 57.60% |
| Net Worth | 102.14% | 95.93% | 98.09% | 42.40% |
| Percent of Sales | ||||
| Sales | 100.00% | 100.00% | 100.00% | 100.00% |
| Gross Margin | 90.00% | 90.00% | 90.00% | 29.40% |
| Selling, General & Administrative Expenses | 141.12% | 74.62% | 71.00% | 15.50% |
| Advertising Expenses | 1.21% | 0.41% | 0.38% | 0.30% |
| Profit Before Interest and Taxes | -47.02% | 21.97% | 27.14% | 2.40% |
| Main Ratios | ||||
| Current | -11.20 | 15.28 | 44.81 | 1.55 |
| Quick | -11.20 | 15.28 | 44.81 | 1.17 |
| Total Debt to Total Assets | -2.14% | 4.07% | 1.91% | 57.60% |
| Pre-tax Return on Net Worth | -241.23% | 98.86% | 68.67% | 6.50% |
| Pre-tax Return on Assets | -246.39% | 94.84% | 67.36% | 15.40% |
| Additional Ratios | Year 1 | Year 2 | Year 3 | |
| Net Profit Margin | -46.91% | 15.45% | 19.10% | n.a |
| Return on Equity | -241.23% | 69.20% | 48.07% | n.a |
| Activity Ratios | ||||
| Accounts Payable Turnover | 23.65 | 12.17 | 12.17 | n.a |
| Payment Days | 27 | 19 | 29 | n.a |
| Total Asset Turnover | 5.25 | 4.30 | 2.47 | n.a |
| Debt Ratios | ||||
| Debt to Net Worth | -0.02 | 0.04 | 0.02 | n.a |
| Current Liab. to Liab. | 0.00 | 1.00 | 1.00 | n.a |
| Liquidity Ratios | ||||
| Net Working Capital | $2,965 | $22,801 | $61,938 | n.a |
| Interest Coverage | 0.00 | 0.00 | 0.00 | n.a |
| Additional Ratios | ||||
| Assets to Sales | 0.19 | 0.23 | 0.41 | n.a |
| Current Debt/Total Assets | -2% | 4% | 2% | n.a |
| Acid Test | 0.00 | 15.28 | 44.81 | n.a |
| Sales/Net Worth | 5.14 | 4.48 | 2.52 | n.a |
| Dividend Payout | 0.00 | 0.00 | 0.00 | n.a |
Appendix
| Sales Forecast | |||||||||||||
| Month 1 | Month 2 | Month 3 | Month 4 | Month 5 | Month 6 | Month 7 | Month 8 | Month 9 | Month 10 | Month 11 | Month 12 | ||
| Sales | |||||||||||||
| Middle to upper class | 0% | $0 | $0 | $1,456 | $2,564 | $3,545 | $4,785 | $5,265 | $6,500 | $6,014 | $0 | $0 | $0 |
| Older people | 0% | $0 | $0 | $1,345 | $2,478 | $3,654 | $4,875 | $6,000 | $5,325 | $5,874 | $0 | $0 | $0 |
| Total Sales | $0 | $0 | $2,801 | $5,042 | $7,199 | $9,660 | $11,265 | $11,825 | $11,888 | $0 | $0 | $0 | |
| Direct Cost of Sales | Month 1 | Month 2 | Month 3 | Month 4 | Month 5 | Month 6 | Month 7 | Month 8 | Month 9 | Month 10 | Month 11 | Month 12 | |
| Middle to upper class | $0 | $0 | $146 | $256 | $355 | $479 | $527 | $650 | $601 | $0 | $0 | $0 | |
| Older people | $0 | $0 | $135 | $248 | $365 | $488 | $600 | $533 | $587 | $0 | $0 | $0 | |
| Subtotal Direct Cost of Sales | $0 | $0 | $280 | $504 | $720 | $966 | $1,127 | $1,183 | $1,189 | $0 | $0 | $0 | |
| Personnel Plan | |||||||||||||
| Month 1 | Month 2 | Month 3 | Month 4 | Month 5 | Month 6 | Month 7 | Month 8 | Month 9 | Month 10 | Month 11 | Month 12 | ||
| Dan | 0% | $3,000 | $3,000 | $3,000 | $3,000 | $3,000 | $3,000 | $3,000 | $3,000 | $3,000 | $3,000 | $3,000 | $3,000 |
| Employee 1 | 0% | $0 | $0 | $1,280 | $1,280 | $1,280 | $1,280 | $1,280 | $1,280 | $1,280 | $0 | $0 | $0 |
| Employee 2 | 0% | $0 | $0 | $1,280 | $1,280 | $1,280 | $1,280 | $1,280 | $1,280 | $1,280 | $0 | $0 | $0 |
| Employee 3 | 0% | $0 | $0 | $1,280 | $1,280 | $1,280 | $1,280 | $1,280 | $1,280 | $1,280 | $0 | $0 | $0 |
| Employee 4 | 0% | $0 | $0 | $0 | $0 | $0 | $0 | $0 | $0 | $0 | $0 | $0 | $0 |
| Employee 5 | 0% | $0 | $0 | $0 | $0 | $0 | $0 | $0 | $0 | $0 | $0 | $0 | $0 |
| Employee 6 | 0% | $0 | $0 | $0 | $0 | $0 | $0 | $0 | $0 | $0 | $0 | $0 | $0 |
| Total People | 1 | 41 | 4 | 4 | 4 | 4 | 4 | 4 | 4 | 1 | 1 | 1 | |
| Total Payroll | $3,000 | $3,000 | $6,840 | $6,840 | $6,840 | $6,840 | $6,840 | $6,840 | $6,840 | $3,000 | $3,000 | $3,000 | |
| General Assumptions | |||||||||||||
| Month 1 | Month 2 | Month 3 | Month 4 | Month 5 | Month 6 | Month 7 | Month 8 | Month 9 | Month 10 | Month 11 | Month 12 | ||
| Plan Month | 1 | 2 | 3 | 4 | 5 | 6 | 7 | 8 | 9 | 10 | 11 | 12 | |
| Current Interest Rate | 10.00% | 10.00% | 10.00% | 10.00% | 10.00% | 10.00% | 10.00% | 10.00% | 10.00% | 10.00% | 10.00% | 10.00% | |
| Long-term Interest Rate | 10.00% | 10.00% | 10.00% | 10.00% | 10.00% | 10.00% | 10.00% | 10.00% | 10.00% | 10.00% | 10.00% | 10.00% | |
| Tax Rate | 30.00% | 30.00% | 30.00% | 30.00% | 30.00% | 30.00% | 30.00% | 30.00% | 30.00% | 30.00% | 30.00% | 30.00% | |
| Other | 0 | 0 | 0 | 0 | 0 | 0 | 0 | 0 | 0 | 0 | 0 | 0 | |
| Pro Forma Profit and Loss | |||||||||||||
| Month 1 | Month 2 | Month 3 | Month 4 | Month 5 | Month 6 | Month 7 | Month 8 | Month 9 | Month 10 | Month 11 | Month 12 | ||
| Sales | $0 | $0 | $2,801 | $5,042 | $7,199 | $9,660 | $11,265 | $11,825 | $11,888 | $0 | $0 | $0 | |
| Direct Cost of Sales | $0 | $0 | $280 | $504 | $720 | $966 | $1,127 | $1,183 | $1,189 | $0 | $0 | $0 | |
| Other Production Expenses | $0 | $0 | $0 | $0 | $0 | $0 | $0 | $0 | $0 | $0 | $0 | $0 | |
| Total Cost of Sales | $0 | $0 | $280 | $504 | $720 | $966 | $1,127 | $1,183 | $1,189 | $0 | $0 | $0 | |
| Gross Margin | $0 | $0 | $2,521 | $4,538 | $6,479 | $8,694 | $10,139 | $10,643 | $10,699 | $0 | $0 | $0 | |
| Gross Margin % | 0.00% | 0.00% | 90.00% | 90.00% | 90.00% | 90.00% | 90.00% | 90.00% | 90.00% | 0.00% | 0.00% | 0.00% | |
| Expenses | |||||||||||||
| Payroll | $3,000 | $3,000 | $6,840 | $6,840 | $6,840 | $6,840 | $6,840 | $6,840 | $6,840 | $3,000 | $3,000 | $3,000 | |
| Sales and Marketing and Other Expenses | $0 | $0 | $100 | $100 | $100 | $100 | $100 | $100 | $100 | $0 | $0 | $0 | |
| Depreciation | $180 | $180 | $180 | $180 | $180 | $180 | $180 | $180 | $180 | $180 | $180 | $180 | |
| Leased Equipment | $0 | $0 | $0 | $0 | $0 | $0 | $0 | $0 | $0 | $0 | $0 | $0 | |
| Utilities | $50 | $50 | $50 | $50 | $50 | $50 | $50 | $50 | $50 | $50 | $50 | $50 | |
| Insurance | $100 | $100 | $100 | $100 | $100 | $100 | $100 | $100 | $100 | $100 | $100 | $100 | |
| Rent | $400 | $400 | $400 | $400 | $400 | $400 | $400 | $400 | $400 | $400 | $400 | $400 | |
| Payroll Taxes | 15% | $450 | $450 | $1,026 | $1,026 | $1,026 | $1,026 | $1,026 | $1,026 | $1,026 | $450 | $450 | $450 |
| Other | $0 | $0 | $0 | $0 | $0 | $0 | $0 | $0 | $0 | $0 | $0 | $0 | |
| Total Operating Expenses | $4,180 | $4,180 | $8,696 | $8,696 | $8,696 | $8,696 | $8,696 | $8,696 | $8,696 | $4,180 | $4,180 | $4,180 | |
| Profit Before Interest and Taxes | ($4,180) | ($4,180) | ($6,175) | ($4,158) | ($2,217) | ($2) | $1,443 | $1,947 | $2,003 | ($4,180) | ($4,180) | ($4,180) | |
| EBITDA | ($4,000) | ($4,000) | ($5,995) | ($3,978) | ($2,037) | $178 | $1,623 | $2,127 | $2,183 | ($4,000) | ($4,000) | ($4,000) | |
| Interest Expense | ($1) | ($2) | ($3) | ($3) | ($4) | ($5) | ($6) | ($7) | ($8) | ($8) | ($9) | ($10) | |
| Taxes Incurred | $0 | $0 | $0 | $0 | $0 | $0 | $0 | $0 | $0 | $0 | $0 | $0 | |
| Net Profit | ($4,179) | ($4,178) | ($6,173) | ($4,155) | ($2,213) | $3 | $1,448 | $1,953 | $2,011 | ($4,172) | ($4,171) | ($4,170) | |
| Net Profit/Sales | 0.00% | 0.00% | -220.37% | -82.41% | -30.74% | 0.03% | 12.86% | 16.52% | 16.91% | 0.00% | 0.00% | 0.00% | |
| Pro Forma Cash Flow | |||||||||||||
| Month 1 | Month 2 | Month 3 | Month 4 | Month 5 | Month 6 | Month 7 | Month 8 | Month 9 | Month 10 | Month 11 | Month 12 | ||
| Cash Received | |||||||||||||
| Cash from Operations | |||||||||||||
| Cash Sales | $0 | $0 | $2,801 | $5,042 | $7,199 | $9,660 | $11,265 | $11,825 | $11,888 | $0 | $0 | $0 | |
| Subtotal Cash from Operations | $0 | $0 | $2,801 | $5,042 | $7,199 | $9,660 | $11,265 | $11,825 | $11,888 | $0 | $0 | $0 | |
| Additional Cash Received | |||||||||||||
| Sales Tax, VAT, HST/GST Received | 0.00% | $0 | $0 | $0 | $0 | $0 | $0 | $0 | $0 | $0 | $0 | $0 | $0 |
| New Current Borrowing | $0 | $0 | $0 | $0 | $0 | $0 | $0 | $0 | $0 | $0 | $0 | $0 | |
| New Other Liabilities (interest-free) | $0 | $0 | $0 | $0 | $0 | $0 | $0 | $0 | $0 | $0 | $0 | $0 | |
| New Long-term Liabilities | $0 | $0 | $0 | $0 | $0 | $0 | $0 | $0 | $0 | $0 | $0 | $0 | |
| Sales of Other Current Assets | $0 | $0 | $0 | $0 | $0 | $0 | $0 | $0 | $0 | $0 | $0 | $0 | |
| Sales of Long-term Assets | $0 | $0 | $0 | $0 | $0 | $0 | $0 | $0 | $0 | $0 | $0 | $0 | |
| New Investment Received | $0 | $0 | $0 | $0 | $0 | $0 | $0 | $0 | $0 | $0 | $0 | $0 | |
| Subtotal Cash Received | $0 | $0 | $2,801 | $5,042 | $7,199 | $9,660 | $11,265 | $11,825 | $11,888 | $0 | $0 | $0 | |
| Expenditures | Month 1 | Month 2 | Month 3 | Month 4 | Month 5 | Month 6 | Month 7 | Month 8 | Month 9 | Month 10 | Month 11 | Month 12 | |
| Expenditures from Operations | |||||||||||||
| Cash Spending | $3,000 | $3,000 | $6,840 | $6,840 | $6,840 | $6,840 | $6,840 | $6,840 | $6,840 | $3,000 | $3,000 | $3,000 | |
| Bill Payments | $33 | $999 | $1,030 | $1,961 | $2,184 | $2,400 | $2,642 | $2,799 | $2,852 | $2,795 | $992 | $991 | |
| Subtotal Spent on Operations | $3,033 | $3,999 | $7,870 | $8,801 | $9,024 | $9,240 | $9,482 | $9,639 | $9,692 | $5,795 | $3,992 | $3,991 | |
| Additional Cash Spent | |||||||||||||
| Sales Tax, VAT, HST/GST Paid Out | $0 | $0 | $0 | $0 | $0 | $0 | $0 | $0 | $0 | $0 | $0 | $0 | |
| Principal Repayment of Current Borrowing | $100 | $100 | $100 | $100 | $100 | $100 | $100 | $100 | $100 | $100 | $100 | $100 | |
| Other Liabilities Principal Repayment | $0 | $0 | $0 | $0 | $0 | $0 | $0 | $0 | $0 | $0 | $0 | $0 | |
| Long-term Liabilities Principal Repayment | $0 | $0 | $0 | $0 | $0 | $0 | $0 | $0 | $0 | $0 | $0 | $0 | |
| Purchase Other Current Assets | $0 | $0 | $0 | $0 | $0 | $0 | $0 | $0 | $0 | $0 | $0 | $0 | |
| Purchase Long-term Assets | $0 | $0 | $0 | $0 | $0 | $0 | $0 | $0 | $0 | $0 | $0 | $0 | |
| Dividends | $0 | $0 | $0 | $0 | $0 | $0 | $0 | $0 | $0 | $0 | $0 | $0 | |
| Subtotal Cash Spent | $3,133 | $4,099 | $7,970 | $8,901 | $9,124 | $9,340 | $9,582 | $9,739 | $9,792 | $5,895 | $4,092 | $4,091 | |
| Net Cash Flow | ($3,133) | ($4,099) | ($5,169) | ($3,859) | ($1,925) | $320 | $1,683 | $2,086 | $2,096 | ($5,895) | ($4,092) | ($4,091) | |
| Cash Balance | $25,667 | $21,568 | $16,398 | $12,539 | $10,614 | $10,934 | $12,617 | $14,704 | $16,800 | $10,904 | $6,813 | $2,722 | |
| Pro Forma Balance Sheet | |||||||||||||
| Month 1 | Month 2 | Month 3 | Month 4 | Month 5 | Month 6 | Month 7 | Month 8 | Month 9 | Month 10 | Month 11 | Month 12 | ||
| Assets | Starting Balances | ||||||||||||
| Current Assets | |||||||||||||
| Cash | $28,800 | $25,667 | $21,568 | $16,398 | $12,539 | $10,614 | $10,934 | $12,617 | $14,704 | $16,800 | $10,904 | $6,813 | $2,722 |
| Other Current Assets | $0 | $0 | $0 | $0 | $0 | $0 | $0 | $0 | $0 | $0 | $0 | $0 | $0 |
| Total Current Assets | $28,800 | $25,667 | $21,568 | $16,398 | $12,539 | $10,614 | $10,934 | $12,617 | $14,704 | $16,800 | $10,904 | $6,813 | $2,722 |
| Long-term Assets | |||||||||||||
| Long-term Assets | $10,800 | $10,800 | $10,800 | $10,800 | $10,800 | $10,800 | $10,800 | $10,800 | $10,800 | $10,800 | $10,800 | $10,800 | $10,800 |
| Accumulated Depreciation | $0 | $180 | $360 | $540 | $720 | $900 | $1,080 | $1,260 | $1,440 | $1,620 | $1,800 | $1,980 | $2,160 |
| Total Long-term Assets | $10,800 | $10,620 | $10,440 | $10,260 | $10,080 | $9,900 | $9,720 | $9,540 | $9,360 | $9,180 | $9,000 | $8,820 | $8,640 |
| Total Assets | $39,600 | $36,287 | $32,008 | $26,658 | $22,619 | $20,514 | $20,654 | $22,157 | $24,064 | $25,980 | $19,904 | $15,633 | $11,362 |
| Liabilities and Capital | Month 1 | Month 2 | Month 3 | Month 4 | Month 5 | Month 6 | Month 7 | Month 8 | Month 9 | Month 10 | Month 11 | Month 12 | |
| Current Liabilities | |||||||||||||
| Accounts Payable | $0 | $966 | $965 | $1,888 | $2,104 | $2,312 | $2,549 | $2,703 | $2,757 | $2,762 | $959 | $958 | $957 |
| Current Borrowing | $0 | ($100) | ($200) | ($300) | ($400) | ($500) | ($600) | ($700) | ($800) | ($900) | ($1,000) | ($1,100) | ($1,200) |
| Other Current Liabilities | $0 | $0 | $0 | $0 | $0 | $0 | $0 | $0 | $0 | $0 | $0 | $0 | $0 |
| Subtotal Current Liabilities | $0 | $866 | $765 | $1,588 | $1,704 | $1,812 | $1,949 | $2,003 | $1,957 | $1,862 | ($41) | ($142) | ($243) |
| Long-term Liabilities | $0 | $0 | $0 | $0 | $0 | $0 | $0 | $0 | $0 | $0 | $0 | $0 | $0 |
| Total Liabilities | $0 | $866 | $765 | $1,588 | $1,704 | $1,812 | $1,949 | $2,003 | $1,957 | $1,862 | ($41) | ($142) | ($243) |
| Paid-in Capital | $40,000 | $40,000 | $40,000 | $40,000 | $40,000 | $40,000 | $40,000 | $40,000 | $40,000 | $40,000 | $40,000 | $40,000 | $40,000 |
| Retained Earnings | ($400) | ($400) | ($400) | ($400) | ($400) | ($400) | ($400) | ($400) | ($400) | ($400) | ($400) | ($400) | ($400) |
| Earnings | $0 | ($4,179) | ($8,358) | ($14,530) | ($18,685) | ($20,898) | ($20,895) | ($19,446) | ($17,493) | ($15,483) | ($19,654) | ($23,825) | ($27,995) |
| Total Capital | $39,600 | $35,421 | $31,243 | $25,070 | $20,915 | $18,702 | $18,705 | $20,154 | $22,107 | $24,118 | $19,946 | $15,775 | $11,605 |
| Total Liabilities and Capital | $39,600 | $36,287 | $32,008 | $26,658 | $22,619 | $20,514 | $20,654 | $22,157 | $24,064 | $25,980 | $19,904 | $15,633 | $11,362 |
| Net Worth | $39,600 | $35,421 | $31,243 | $25,070 | $20,915 | $18,702 | $18,705 | $20,154 | $22,107 | $24,118 | $19,946 | $15,775 | $11,605 |


