
Fiberglass World, Inc.
Executive Summary
Fiberglass World, Inc. (Fiberglass World) is a start-up manufacturing company with patented products that will revolutionize the building industry. Fiberglass World is the exclusive manufacturer in the United States, and protected by a licensing agreement with the inventor of the Fiberglass Plate Products, Mr. John Thompson.
Fiberglass World is headed by Mr. Thompson, who has direct knowledge of the industry and extensive research experience. Mr. Thompson has been associated with the fiberglass industry for forty years, and has seen many developments in the aviation, marine, construction, and automotive manufacturing industries. There has been a need for new product innovation in the construction industry for a long time. This is what prompted him to develop an insulative fiberglass roof tile that can be manufactured in any color desired, and is price competitive. Using the same technology, he also developed the insulative fiberglass exterior panel. Both products have the molded, textured look of stucco.
Fiberglass World manufactures insulative fiberglass roof tiles and exterior insulative fiberglass structural wall panels. These products are called Fiberglass Plate Products (Fiberglass Plate). Both products are supported by two United States patents.

1.1 Mission
Fiberglass World strives to be the majority provider of this breakthrough product. We intend to accomplish this through a strict quality-control program, timely deliveries, and competitive pricing.
1.2 Keys to Success
- Fiberglass World has developed insulative fiberglass roof tiles and insulative fiberglass structural exterior panels.
- Fiberglass World is the exclusive manufacturer in the U.S. and is protected by a licensing agreement with the inventor who is the owner of the company.
- The company will control its production line to assure that quality is met.
Company Summary
Fiberglass World is a start-up manufacturing company with patented products that will revolutionize the building industry. It is the exclusive manufacturer in the U.S. and is protected by a licensing agreement with the inventor of the Fiberglass Plate products, Mr. John Thompson.
The company boasts many features which directly lead to it being the premier manufacturer of fiberglass materials in the United States. The following subtopics outline the some features of Fiberglass World: its locations, a description of what it will take to get the company up and running, and other elementary aspects of the company.
2.1 Company Ownership
Fiberglass World was founded in Tulsa, Oklahoma in September of 1999 by Mr. John Thompson. Fiberglass World is an Oklahoma C-Corporation, with principal offices located in Tulsa.
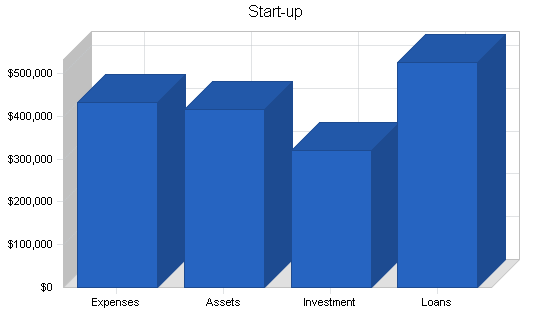
2.2 Start-up Summary
The company is seeking first round financing for the purpose of acquiring starting inventory of raw materials, purchasing land, building construction, utility hook-up and site improvement, machinery and equipment, working capital, legal and accounting costs, and miscellaneous start-up expenses. Additionally, the company will seek second round financing for fourth year, Phase II operations. Projected revenues will double during the 2000 to 2002 period.
| Start-up | |
| Requirements | |
| Start-up Expenses | |
| Legal | $50,000 |
| Building construction/Site improvement | $200,000 |
| Accounting | $20,000 |
| Insurance | $100,000 |
| Rent | $56,000 |
| Research and development | $0 |
| Utility hookup | $1,000 |
| Other | $5,000 |
| Total Start-up Expenses | $432,000 |
| Start-up Assets | |
| Cash Required | $35,000 |
| Start-up Inventory | $80,000 |
| Other Current Assets | $0 |
| Long-term Assets | $300,000 |
| Total Assets | $415,000 |
| Total Requirements | $847,000 |
| Start-up Funding | |
| Start-up Expenses to Fund | $432,000 |
| Start-up Assets to Fund | $415,000 |
| Total Funding Required | $847,000 |
| Assets | |
| Non-cash Assets from Start-up | $380,000 |
| Cash Requirements from Start-up | $35,000 |
| Additional Cash Raised | $0 |
| Cash Balance on Starting Date | $35,000 |
| Total Assets | $415,000 |
| Liabilities and Capital | |
| Liabilities | |
| Current Borrowing | $50,000 |
| Long-term Liabilities | $476,000 |
| Accounts Payable (Outstanding Bills) | $0 |
| Other Current Liabilities (interest-free) | $0 |
| Total Liabilities | $526,000 |
| Capital | |
| Planned Investment | |
| Mr John Thompson | $70,000 |
| Mrs. Kim Thompson | $38,000 |
| Other Investors | $213,000 |
| Additional Investment Requirement | $0 |
| Total Planned Investment | $321,000 |
| Loss at Start-up (Start-up Expenses) | ($432,000) |
| Total Capital | ($111,000) |
| Total Capital and Liabilities | $415,000 |
| Total Funding | $847,000 |
2.3 Company Locations and Facilities
The location of the first operating plant is planned for Tulsa, Oklahoma. This location was chosen because of its proximity to both road and rail transportation. The area has been designated by the state as an Enterprise Zone, thus offering us benefits and incentives to set up our operation.
Products
Fiberglass World has pioneered insulative fiberglass roof tiles and insulative fiberglass structural exterior panels. Both products have a molded texture look of stucco and are fire retardant. Fiberglass Plate will replace many systems now used in the construction industry. Fiberglass Plate fiberglass roof tiles and panels are lightweight and very energy efficient. The selling price of Fiberglass Plate fiberglass roof tiles and fiberglass exterior structural panels is competitive with any other top quality building material.
Fiberglass panels can be manufactured from 1/4″ to 3″ thick and can be marketed from $3.00 per square foot. Fiberglass Plate roof tiles are priced at $450.00 per square. A square equals a section of roofing 10 feet by 10 feet. This selling price includes the finishing pieces. Fiberglass Plate Products have the molded texture look of stucco and can be manufactured in any color; both are fire retardant and meet all construction codes, are insulative, and offer a finished product with any desired features.
3.1 Product Description
Product #1 – Fiberglass Plate insulative roof tile.
Advantages:
- Fiberglass Plate roof tiles can be manufactured in the traditional flat or curved style.
- Molded texture color impregnated gel coat used.
- Insulative core material used.
- Roof tiles weigh approximately 270 lb. per square.
- Any style can be manufactured for qualified projects.
- Multi-color tiles will be available.
- Fiberglass Plate roof tiles are fire retardant.
Product #2 – Fiberglass Plate insulative panels.
Advantages:
- The insulative panels will enhance the esthetics of your property for years to come.
- They can be ordered in any color.
- They will be manufactured in various sizes for qualified projects.
- The panels are energy efficient.
3.2 Competitive Comparison
Fiberglass World will primarily target the construction industry, and is looking to build alliances with industry leaders. Because of its exclusive status as the only company to manufacture these fiberglass products, the competition is constantly held at bay by Fiberglass World. We expect success; due to past marketing, we have evidence that Fiberglass World will be met with fervor in this lasting industry.
Market Analysis Summary
The industry of roofing, siding, and installation is a large one. Total annual sales in this industry amount to approximately $11 million and are projected to remain steady, if not increase. One reason for the prosperity of this industry is because there is such a large market. The company is primarily targeting the construction industry, where sales total $124,953 million annually.
Market Size Statistics
| Estimated number of U.S. establishments | 3,245 |
| Number of people employed in this industry | 35,179 |
| Total annual sales in the industry | $11 million |
| Average employees per establishment | 11 |
| Average sales per establishment | $5.6 million |
4.1 Market Segmentation
The roofing and siding industry is only a part of the overall construction industry, which includes contractors that perform almost any function of housing creation and alteration. Therefore, an accurate estimate of nationwide demand for Fiberglass World’s products would include the entire construction industry. This is broken up into the following segments:
Market size statistics–Single-family housing construction
General contractors primarily engaged in construction (including new work, additions, alterations, remodeling, and repair) of single-family houses.
| Estimated number of U.S. establishments | 218,2776 |
| Number of people employed in this industry | 831,158 |
| Total annual sales in this industry | $125 million |
| Average employees per establishment | 4 |
| Average sales per establishment | $.6 million |
This segment is comprised of companies that are involved in the smallest housing projects. However, the sheer size of the segment means that this will be the segment providing the majority of sales to Fiberglass World.

Market size statistics–Residential construction, nec
General contractors primarily engaged in construction (including new work additions, alterations, remodeling, and repair) of residential buildings other than single-family houses. This includes hotels, motels, apartments, and multi-family homes.
| Estimated number of U.S. establishments | 25,201 |
| Number of people employed in this industry | 114,523 |
| Total annual sales in this industry | $25 million |
| Average employees per establishment | 5 |
| Average sales per establishment | $1.1 million |
Market size statistics–Nonresidential construction, nec
General contractors primarily engaged in the construction (including new work additions, alterations, remodeling, and repair) of nonresidential buildings other than industrial buildings and warehouses. This includes commercial, institutional, religious, and amusement and recreational buildings.
| Estimated number of U.S. establishments | 44,505 |
| Number of people employed in this industry | 540,550 |
| Total annual sales in this industry | $205 million |
| Average employees per establishment | 12 |
| Average sales per establishment | $4.9 million |

| Market Analysis | |||||||
| Year 1 | Year 2 | Year 3 | Year 4 | Year 5 | |||
| Potential Customers | Growth | CAGR | |||||
| Single-family housing construction | 4% | 218,276 | 227,007 | 236,087 | 245,530 | 255,351 | 4.00% |
| Other residential construction | 3% | 25,201 | 25,957 | 26,736 | 27,538 | 28,364 | 3.00% |
| Non residential construction | 2% | 44,505 | 45,395 | 46,303 | 47,229 | 48,174 | 2.00% |
| Total | 3.61% | 287,982 | 298,359 | 309,126 | 320,297 | 331,889 | 3.61% |
4.2 Target Market Segment Strategy
The company is primarily targeting the construction industry, which are establishments primarily engaged in the wholesale distribution of roofing, siding (except wood), and insulation materials. Residential and commercial construction projects are at an all-time high and will continue to increase for years to come. It is important to realize that we have a very unique and much-needed product. The standard materials available are asphalt shingles, organic shingles, fibered cement shingles, metal roofing, clay tiles, concrete tiles, slate tiles, cedar shingles, recycled tile roofing, and solar shingles.
Our product is entirely new, and we are introducing it into this industry: fiberglass insulative architectural roof tiles, (Fiberglass Plate). The average costs of the above products vary. While Fiberglass Plate is more expensive, it also offers an insulation factor that all other products do not incorporate. This effectively reduces costs for separate insulation products.
4.3 Industry Analysis
Market Analysis by Specialty (8-digit SIC Code)
|
SIC Code |
SIC Description | No Bus. | % Total | Total Emps. | Total Sales | Avg. Emps. | Avg. Sales |
| 5033-0000 | Roofing, siding, and insulation | 1,012 | 31.2 | 11,012 | $3,058 | 11 | 5.8 |
| 5033-0100 | Roofing and siding materials | 731 | 22.5 | 8,326 | $3,834 | 12 | 8.2 |
| 5033-0101 | Asphalt felts and coating | 51 | 1.6 | 534 | $36.9 | 10 | 1.1 |
| 5033-0102 | Felts, tarred | 1 | 0 | 5 | $.9 | 5 | .9 |
| 5033-0103 | Roofing, asphalt and sheet metal | 402 | 12.4 | 4,648 | $1,655 | 12 | 7.5 |
| 5033-0104 | Shingles, except wood | 10 | 0.3 | 132 | $29 | 13 | 3.2 |
| 5033-0105 | Siding, except wood | 329 | 10.1 | 2,775 | $647 | 8 | 3.3 |
| 5033-0200 | Insulation materials | 379 | 11.7 | 2,789 | $814 | 8 | 3.0 |
| 5033-0201 | Fiberglass building materials | 104 | 3.2 | 2,656 | $118.5 | 27 | 2.2 |
| 5033-0202 | Insulation, thermal | 220 | 6.8 | 2,247 | $438 | 10 | 3.7 |
| 5033-0203 | Mineral wool insulation materials | 6 | 0.2 | 55 | $3 | 9 | .7 |
| Total/Average | 3,245 | 100 | 35,179 | $10,637 | 11 | 5.6 |
Note: Not all establishments have a specialty. Sales figures are in millions.
4.3.1 Competition and Buying Patterns
Fiberglass Plate Products will be marketed initially in the Southern region of the United States. This selling area will utilize our entire production capability. The construction industry is on the move and we intend to have our percentage of this long lasting industry. Our past marketing shows a place for Fiberglass Plate and also shows a tremendous demand for these products. Both products are in the completed development stage and are ready for manufacturing.
Strategy and Implementation Summary
The company’s overall strategy is based on a continuous improvement process of setting objectives, measuring results, and utilizing feedback to facilitate further growth and progress. The company plans to rapidly develop marketing alliances with industry leaders and pursue new sales of its services to residential and commercial builders. The market strategy is to capitalize on Fiberglass World’s alliances by securing city, parish, state, and government contracts.
5.1 Competitive Edge
Having both Fiberglass Plate installed offers the user an energy efficient system that will not fail. Fiberglass Plate Products are a true fiberglass system that meets the demands of today’s architectural designs and will continue to provide these desired features in the future. Fiberglass is a non-deteriorating material and all resins used are of the highest marine quality and are formulated to meet the required standard of Fiberglass Plate.
Fiberglass Plate roof tiles can be manufactured in the traditional design look of the curved Spanish terra cotta and the flat roof tile. Any design may be used incorporating the insulative core material. The exterior flat panels incorporating the molded look of stucco will be manufactured in various sizes.
Some of the outstanding features of Fiberglass Plate that have become necessary in the construction industry include:
- By conserving heat/cold within a structure, the panels are energy efficient.
- The panels are lightweight and easy to install.
- The product is cost effective because it services the insulative need as well.
- They will not corrode and therefore require little maintenance.
- Guaranteed to be 100% waterproof.
- All Fiberglass Plate products are fire retardant.
- The product is removed from the mold with a stucco look and texture.
- The insulative fiberglass exterior panels may be installed below grade.
The most important feature is the stability of Fiberglass Plate Products. In terms of manufacturing, Fiberglass Plate Products can be compared to a marine manufacturing process. All raw materials used meet the marine industry standard, and are built with the weight of water pressure in mind. The panels are durable, rugged, and meant to withstand many pounds of pressure.
Quality control is very important. Keeping this in mind, we will control our production lines to assure that quality is met. All orders will be produced in a time frame as specified by the production manager.
5.2 Sales Strategy
Our sales program is as follows:
- Create contacts with residential and commercial contractors.
- Contact developers of residential and commercial properties.
- Contact and training for new “company approved” warranty installer contractors for Fiberglass Plate Products.
- Special advertising efforts will be implemented on the Internet.
- Set up advertising for local and national programs.
- Participate at national and regional trade shows.
- Employment of company sales representatives.
- Contact major architectural firms.
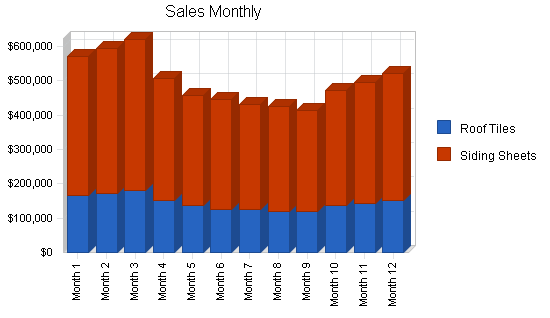
5.2.1 Sales Forecast
The following chart and table outline our sales forecast.

| Sales Forecast | |||
| Year 1 | Year 2 | Year 3 | |
| Sales | |||
| Roof Tiles | $1,728,000 | $5,184,000 | $5,184,000 |
| Siding Sheets | $4,224,000 | $8,449,000 | $8,449,000 |
| Total Sales | $5,952,000 | $13,633,000 | $13,633,000 |
| Direct Cost of Sales | Year 1 | Year 2 | Year 3 |
| Roof Tiles | $966,177 | $2,966,995 | $2,896,436 |
| Siding Sheets | $2,361,765 | $4,835,675 | $4,720,676 |
| Subtotal Direct Cost of Sales | $3,327,942 | $7,802,670 | $7,617,112 |
5.3 Strategic Alliances
The company plans to rapidly develop marketing alliances with industry leaders and pursue new sales of its services to residential and commercial builders.
5.4 Promotion
Fiberglass World advertises in the yellow pages, newspapers, radio, and billboards throughout the state. Fiberglass World will also gain considerable recognition through these additional promotional mediums:
- Caps and T-shirts.
- Signs
- Word of mouth.
- Incentives:
- As an extra incentive for customers and potential customers to remember Fiberglass World ‘s name, the company plans to distribute coffee mugs, T-shirts, pens, and other advertising specialties with the company logo.
- Brochures:
- The objective of a brochure is to portray Fiberglass World’s goals and products as an attractive functionality. It is also to show customers how to use the latest in technology as it relates to construction and building services.
- Investment in Advertising and Promotion:
- A fixed amount of sales revenues will go toward the state-wide Fiberglass World advertisement campaign. On an ongoing basis, Fiberglass World feels that it can budget advertising expenses at less than ten percent of revenues.
Management Summary
The company’s management is highly experienced and qualified, with seasoned investors. The company strives to hire qualified people who take pride in their work. The company’s management philosophy is based on responsibility and mutual respect. Fiberglass World maintains an environment and structure that encourages productivity and respect for customers and fellow employees.
The following subtopics outline both the management team, and its team of employees.
Fiberglass World’s management is highly experienced and qualified. Its key management team includes:
- Mr. John Thompson, president and CEO. Mr. Thompson is a building consultant and specializes in product development and marketing. During the past two decades, Mr. Thompson has been contracted to design and manufacture a wide range of fiberglass products, from fiberglass housing for water treatment to designing and manufacturing a planter system.
- Mrs. Kim Thompson, vice president. Mrs. Thompson has held several management positions with various companies in the real estate industry. She has also been involved in rental management and rental sales. She holds real estate salesman and broker licenses, and a community association manager’s license.
6.1 Personnel Plan
Fiberglass World is responsible to its employees, the men and women who work with the company throughout the state. At Fiberglass World everyone is considered as an individual, the company respects their dignity and recognizes their merit. Employees are encouraged to have a sense of security and pride in their jobs. Additionally, employees are free to make suggestions and complaints. The company affords equal opportunity for employment, development, and advancement for those qualified.
| Personnel Plan | |||
| Year 1 | Year 2 | Year 3 | |
| General Manager | $60,000 | $60,000 | $73,334 |
| Production Manager | $60,000 | $60,000 | $73,333 |
| Office Manager | $60,000 | $60,000 | $73,333 |
| Safety Manager | $60,000 | $60,000 | $60,000 |
| Distribution & Inventory manager | $60,000 | $60,000 | $60,000 |
| Sales and Marketing Coordinator | $0 | $40,000 | $60,000 |
| Product developer | $0 | $40,000 | $60,000 |
| Sales Rep | $0 | $0 | $35,000 |
| Finance & accounting analyst | $0 | $0 | $50,000 |
| Other | $0 | $0 | $0 |
| Total People | 0 | 0 | 0 |
| Total Payroll | $300,000 | $380,000 | $545,000 |
Financial Plan
Funding Requirements and Uses:
The company is seeking first round financing for the purpose of acquiring starting inventory of raw materials, purchasing land, building construction, utility hook-up and site improvement, machinery and equipment, working capital, legal and accounting, and miscellaneous start-up expenses. The company will require additional investment or loans for Phase II, set to begin during the fourth year of operation.
7.1 Important Assumptions
The following table outlines important assumptions for Fiberglass World.
| General Assumptions | |||
| Year 1 | Year 2 | Year 3 | |
| Plan Month | 1 | 2 | 3 |
| Current Interest Rate | 10.00% | 10.00% | 10.00% |
| Long-term Interest Rate | 10.00% | 10.00% | 10.00% |
| Tax Rate | 39.17% | 40.00% | 39.17% |
| Other | 0 | 0 | 0 |
7.2 Break-even Analysis

| Break-even Analysis | |
| Monthly Revenue Break-even | $275,977 |
| Assumptions: | |
| Average Percent Variable Cost | 56% |
| Estimated Monthly Fixed Cost | $121,670 |
7.3 Projected Profit and Loss
The following table presents year-end profit and loss projections for Fiberglass World. For a monthly analysis, please see the appendix at the end of the plan.


| Pro Forma Profit and Loss | |||
| Year 1 | Year 2 | Year 3 | |
| Sales | $5,952,000 | $13,633,000 | $13,633,000 |
| Direct Cost of Sales | $3,327,942 | $7,802,670 | $7,617,112 |
| Royalties | $0 | $0 | $2,044,800 |
| Total Cost of Sales | $3,327,942 | $7,802,670 | $9,661,912 |
| Gross Margin | $2,624,058 | $5,830,330 | $3,971,088 |
| Gross Margin % | 44.09% | 42.77% | 29.13% |
| Expenses | |||
| Payroll | $300,000 | $380,000 | $545,000 |
| Sales and Marketing and Other Expenses | $857,541 | $1,371,697 | $1,605,710 |
| Depreciation | $55,000 | $55,000 | $55,000 |
| Leased Equipment | $15,000 | $16,500 | $18,150 |
| Utilities | $50,000 | $157,000 | $180,550 |
| Insurance | $109,500 | $257,200 | $422,920 |
| Rent | $28,000 | $35,000 | $36,750 |
| Payroll Taxes | $45,000 | $57,000 | $81,750 |
| Other | $0 | $0 | $0 |
| Total Operating Expenses | $1,460,041 | $2,329,397 | $2,945,830 |
| Profit Before Interest and Taxes | $1,164,017 | $3,500,933 | $1,025,258 |
| EBITDA | $1,219,017 | $3,555,933 | $1,080,258 |
| Interest Expense | $53,413 | $68,990 | $82,250 |
| Taxes Incurred | $431,700 | $1,372,777 | $369,345 |
| Net Profit | $678,904 | $2,059,166 | $573,663 |
| Net Profit/Sales | 11.41% | 15.10% | 4.21% |
7.4 Projected Cash Flow
The cash flow projections for Fiberglass World are outlined in the following table and chart.

| Pro Forma Cash Flow | |||
| Year 1 | Year 2 | Year 3 | |
| Cash Received | |||
| Cash from Operations | |||
| Cash Sales | $5,952,000 | $13,633,000 | $13,633,000 |
| Cash from Receivables | $0 | $0 | $0 |
| Subtotal Cash from Operations | $5,952,000 | $13,633,000 | $13,633,000 |
| Additional Cash Received | |||
| Sales Tax, VAT, HST/GST Received | $0 | $0 | $0 |
| New Current Borrowing | $50,000 | $85,000 | $85,000 |
| New Other Liabilities (interest-free) | $0 | $0 | $0 |
| New Long-term Liabilities | $47,600 | $47,600 | $47,600 |
| Sales of Other Current Assets | $0 | $0 | $0 |
| Sales of Long-term Assets | $0 | $0 | $0 |
| New Investment Received | $0 | $0 | $0 |
| Subtotal Cash Received | $6,049,600 | $13,765,600 | $13,765,600 |
| Expenditures | Year 1 | Year 2 | Year 3 |
| Expenditures from Operations | |||
| Cash Spending | $300,000 | $380,000 | $545,000 |
| Bill Payments | $4,728,411 | $11,048,606 | $12,369,809 |
| Subtotal Spent on Operations | $5,028,411 | $11,428,606 | $12,914,809 |
| Additional Cash Spent | |||
| Sales Tax, VAT, HST/GST Paid Out | $0 | $0 | $0 |
| Principal Repayment of Current Borrowing | $0 | $0 | $0 |
| Other Liabilities Principal Repayment | $0 | $0 | $0 |
| Long-term Liabilities Principal Repayment | $0 | $0 | $0 |
| Purchase Other Current Assets | $0 | $0 | $0 |
| Purchase Long-term Assets | $0 | $0 | $0 |
| Dividends | $17,000 | $17,000 | $17,000 |
| Subtotal Cash Spent | $5,045,411 | $11,445,606 | $12,931,809 |
| Net Cash Flow | $1,004,189 | $2,319,994 | $833,791 |
| Cash Balance | $1,039,189 | $3,359,183 | $4,192,973 |
7.5 Projected Balance Sheet
The table below shows our projected balance sheet for three years. Monthly figures for the first year are included in the appendices.
| Pro Forma Balance Sheet | |||
| Year 1 | Year 2 | Year 3 | |
| Assets | |||
| Current Assets | |||
| Cash | $1,039,189 | $3,359,183 | $4,192,973 |
| Accounts Receivable | $0 | $0 | $0 |
| Inventory | $320,314 | $751,007 | $733,147 |
| Other Current Assets | $0 | $0 | $0 |
| Total Current Assets | $1,359,503 | $4,110,190 | $4,926,120 |
| Long-term Assets | |||
| Long-term Assets | $300,000 | $300,000 | $300,000 |
| Accumulated Depreciation | $55,000 | $110,000 | $165,000 |
| Total Long-term Assets | $245,000 | $190,000 | $135,000 |
| Total Assets | $1,604,503 | $4,300,190 | $5,061,120 |
| Liabilities and Capital | Year 1 | Year 2 | Year 3 |
| Current Liabilities | |||
| Accounts Payable | $429,999 | $950,920 | $1,022,587 |
| Current Borrowing | $100,000 | $185,000 | $270,000 |
| Other Current Liabilities | $0 | $0 | $0 |
| Subtotal Current Liabilities | $529,999 | $1,135,920 | $1,292,587 |
| Long-term Liabilities | $523,600 | $571,200 | $618,800 |
| Total Liabilities | $1,053,599 | $1,707,120 | $1,911,387 |
| Paid-in Capital | $321,000 | $321,000 | $321,000 |
| Retained Earnings | ($449,000) | $212,904 | $2,255,070 |
| Earnings | $678,904 | $2,059,166 | $573,663 |
| Total Capital | $550,904 | $2,593,070 | $3,149,733 |
| Total Liabilities and Capital | $1,604,503 | $4,300,190 | $5,061,120 |
| Net Worth | $550,904 | $2,593,070 | $3,149,733 |
7.6 Business Ratios
The following table outlines important ratios from the roofing, siding and insulation industry, as determined by the Standard Industry Classification (SIC) Index #5033, Roofing, Siding, and Insulation.
| Ratio Analysis | ||||
| Year 1 | Year 2 | Year 3 | Industry Profile | |
| Sales Growth | 0.00% | 129.05% | 0.00% | 14.50% |
| Percent of Total Assets | ||||
| Accounts Receivable | 0.00% | 0.00% | 0.00% | 29.10% |
| Inventory | 19.96% | 17.46% | 14.49% | 26.30% |
| Other Current Assets | 0.00% | 0.00% | 0.00% | 25.10% |
| Total Current Assets | 84.73% | 95.58% | 97.33% | 80.50% |
| Long-term Assets | 15.27% | 4.42% | 2.67% | 19.50% |
| Total Assets | 100.00% | 100.00% | 100.00% | 100.00% |
| Current Liabilities | 33.03% | 26.42% | 25.54% | 46.10% |
| Long-term Liabilities | 32.63% | 13.28% | 12.23% | 11.10% |
| Total Liabilities | 65.67% | 39.70% | 37.77% | 57.20% |
| Net Worth | 34.33% | 60.30% | 62.23% | 42.80% |
| Percent of Sales | ||||
| Sales | 100.00% | 100.00% | 100.00% | 100.00% |
| Gross Margin | 44.09% | 42.77% | 29.13% | 17.60% |
| Selling, General & Administrative Expenses | 32.89% | 27.66% | 24.98% | 9.60% |
| Advertising Expenses | 4.26% | 2.28% | 2.75% | 0.20% |
| Profit Before Interest and Taxes | 19.56% | 25.68% | 7.52% | 2.00% |
| Main Ratios | ||||
| Current | 2.57 | 3.62 | 3.81 | 1.58 |
| Quick | 1.96 | 2.96 | 3.24 | 0.86 |
| Total Debt to Total Assets | 65.67% | 39.70% | 37.77% | 57.20% |
| Pre-tax Return on Net Worth | 201.60% | 132.35% | 29.94% | 5.50% |
| Pre-tax Return on Assets | 69.22% | 79.81% | 18.63% | 12.80% |
| Additional Ratios | Year 1 | Year 2 | Year 3 | |
| Net Profit Margin | 11.41% | 15.10% | 4.21% | n.a |
| Return on Equity | 123.23% | 79.41% | 18.21% | n.a |
| Activity Ratios | ||||
| Accounts Receivable Turnover | 0.00 | 0.00 | 0.00 | n.a |
| Collection Days | 0 | 0 | 0 | n.a |
| Inventory Turnover | 10.91 | 14.57 | 10.26 | n.a |
| Accounts Payable Turnover | 12.00 | 12.17 | 12.17 | n.a |
| Payment Days | 27 | 22 | 29 | n.a |
| Total Asset Turnover | 3.71 | 3.17 | 2.69 | n.a |
| Debt Ratios | ||||
| Debt to Net Worth | 1.91 | 0.66 | 0.61 | n.a |
| Current Liab. to Liab. | 0.50 | 0.67 | 0.68 | n.a |
| Liquidity Ratios | ||||
| Net Working Capital | $829,504 | $2,974,270 | $3,633,533 | n.a |
| Interest Coverage | 21.79 | 50.75 | 12.47 | n.a |
| Additional Ratios | ||||
| Assets to Sales | 0.27 | 0.32 | 0.37 | n.a |
| Current Debt/Total Assets | 33% | 26% | 26% | n.a |
| Acid Test | 1.96 | 2.96 | 3.24 | n.a |
| Sales/Net Worth | 10.80 | 5.26 | 4.33 | n.a |
| Dividend Payout | 0.03 | 0.01 | 0.03 | n.a |
Appendix
| Sales Forecast | |||||||||||||
| Month 1 | Month 2 | Month 3 | Month 4 | Month 5 | Month 6 | Month 7 | Month 8 | Month 9 | Month 10 | Month 11 | Month 12 | ||
| Sales | |||||||||||||
| Roof Tiles | 0% | $165,600 | $172,800 | $180,000 | $151,200 | $137,143 | $124,695 | $125,217 | $119,003 | $120,000 | $137,142 | $144,000 | $151,200 |
| Siding Sheets | 0% | $404,800 | $422,400 | $440,000 | $354,409 | $320,046 | $320,000 | $306,087 | $306,087 | $293,333 | $335,238 | $352,000 | $369,600 |
| Total Sales | $570,400 | $595,200 | $620,000 | $505,609 | $457,189 | $444,695 | $431,304 | $425,090 | $413,333 | $472,380 | $496,000 | $520,800 | |
| Direct Cost of Sales | Month 1 | Month 2 | Month 3 | Month 4 | Month 5 | Month 6 | Month 7 | Month 8 | Month 9 | Month 10 | Month 11 | Month 12 | |
| Roof Tiles | $92,592 | $96,618 | $100,643 | $84,540 | $76,681 | $69,721 | $70,013 | $66,538 | $67,096 | $76,680 | $80,515 | $84,540 | |
| Siding Sheets | $226,336 | $236,177 | $246,017 | $198,161 | $178,947 | $178,922 | $171,142 | $171,142 | $164,011 | $187,442 | $196,814 | $206,654 | |
| Subtotal Direct Cost of Sales | $318,928 | $332,794 | $346,661 | $282,701 | $255,628 | $248,642 | $241,155 | $237,681 | $231,107 | $264,122 | $277,328 | $291,195 | |
| Personnel Plan | |||||||||||||
| Month 1 | Month 2 | Month 3 | Month 4 | Month 5 | Month 6 | Month 7 | Month 8 | Month 9 | Month 10 | Month 11 | Month 12 | ||
| General Manager | 0% | $5,000 | $5,000 | $5,000 | $5,000 | $5,000 | $5,000 | $5,000 | $5,000 | $5,000 | $5,000 | $5,000 | $5,000 |
| Production Manager | 0% | $5,000 | $5,000 | $5,000 | $5,000 | $5,000 | $5,000 | $5,000 | $5,000 | $5,000 | $5,000 | $5,000 | $5,000 |
| Office Manager | 0% | $5,000 | $5,000 | $5,000 | $5,000 | $5,000 | $5,000 | $5,000 | $5,000 | $5,000 | $5,000 | $5,000 | $5,000 |
| Safety Manager | 0% | $5,000 | $5,000 | $5,000 | $5,000 | $5,000 | $5,000 | $5,000 | $5,000 | $5,000 | $5,000 | $5,000 | $5,000 |
| Distribution & Inventory manager | 0% | $5,000 | $5,000 | $5,000 | $5,000 | $5,000 | $5,000 | $5,000 | $5,000 | $5,000 | $5,000 | $5,000 | $5,000 |
| Sales and Marketing Coordinator | 0% | $0 | $0 | $0 | $0 | $0 | $0 | $0 | $0 | $0 | $0 | $0 | $0 |
| Product developer | 0% | $0 | $0 | $0 | $0 | $0 | $0 | $0 | $0 | $0 | $0 | $0 | $0 |
| Sales Rep | 0% | $0 | $0 | $0 | $0 | $0 | $0 | $0 | $0 | $0 | $0 | $0 | $0 |
| Finance & accounting analyst | 0% | $0 | $0 | $0 | $0 | $0 | $0 | $0 | $0 | $0 | $0 | $0 | $0 |
| Other | 0% | $0 | $0 | $0 | $0 | $0 | $0 | $0 | $0 | $0 | $0 | $0 | $0 |
| Total People | 0 | 0 | 0 | 0 | 0 | 0 | 0 | 0 | 0 | 0 | 0 | 0 | |
| Total Payroll | $25,000 | $25,000 | $25,000 | $25,000 | $25,000 | $25,000 | $25,000 | $25,000 | $25,000 | $25,000 | $25,000 | $25,000 | |
| General Assumptions | |||||||||||||
| Month 1 | Month 2 | Month 3 | Month 4 | Month 5 | Month 6 | Month 7 | Month 8 | Month 9 | Month 10 | Month 11 | Month 12 | ||
| Plan Month | 1 | 2 | 3 | 4 | 5 | 6 | 7 | 8 | 9 | 10 | 11 | 12 | |
| Current Interest Rate | 10.00% | 10.00% | 10.00% | 10.00% | 10.00% | 10.00% | 10.00% | 10.00% | 10.00% | 10.00% | 10.00% | 10.00% | |
| Long-term Interest Rate | 10.00% | 10.00% | 10.00% | 10.00% | 10.00% | 10.00% | 10.00% | 10.00% | 10.00% | 10.00% | 10.00% | 10.00% | |
| Tax Rate | 30.00% | 40.00% | 40.00% | 40.00% | 40.00% | 40.00% | 40.00% | 40.00% | 40.00% | 40.00% | 40.00% | 40.00% | |
| Other | 0 | 0 | 0 | 0 | 0 | 0 | 0 | 0 | 0 | 0 | 0 | 0 | |
| Pro Forma Profit and Loss | |||||||||||||
| Month 1 | Month 2 | Month 3 | Month 4 | Month 5 | Month 6 | Month 7 | Month 8 | Month 9 | Month 10 | Month 11 | Month 12 | ||
| Sales | $570,400 | $595,200 | $620,000 | $505,609 | $457,189 | $444,695 | $431,304 | $425,090 | $413,333 | $472,380 | $496,000 | $520,800 | |
| Direct Cost of Sales | $318,928 | $332,794 | $346,661 | $282,701 | $255,628 | $248,642 | $241,155 | $237,681 | $231,107 | $264,122 | $277,328 | $291,195 | |
| Royalties | $0 | $0 | $0 | $0 | $0 | $0 | $0 | $0 | $0 | $0 | $0 | $0 | |
| Total Cost of Sales | $318,928 | $332,794 | $346,661 | $282,701 | $255,628 | $248,642 | $241,155 | $237,681 | $231,107 | $264,122 | $277,328 | $291,195 | |
| Gross Margin | $251,472 | $262,406 | $273,339 | $222,908 | $201,561 | $196,053 | $190,149 | $187,409 | $182,226 | $208,258 | $218,672 | $229,605 | |
| Gross Margin % | 44.09% | 44.09% | 44.09% | 44.09% | 44.09% | 44.09% | 44.09% | 44.09% | 44.09% | 44.09% | 44.09% | 44.09% | |
| Expenses | |||||||||||||
| Payroll | $25,000 | $25,000 | $25,000 | $25,000 | $25,000 | $25,000 | $25,000 | $25,000 | $25,000 | $25,000 | $25,000 | $25,000 | |
| Sales and Marketing and Other Expenses | $71,462 | $71,462 | $71,462 | $71,462 | $71,462 | $71,462 | $71,462 | $71,462 | $71,462 | $71,462 | $71,462 | $71,462 | |
| Depreciation | $4,583 | $4,583 | $4,583 | $4,583 | $4,583 | $4,583 | $4,583 | $4,583 | $4,583 | $4,583 | $4,583 | $4,583 | |
| Leased Equipment | $1,250 | $1,250 | $1,250 | $1,250 | $1,250 | $1,250 | $1,250 | $1,250 | $1,250 | $1,250 | $1,250 | $1,250 | |
| Utilities | $4,167 | $4,167 | $4,167 | $4,167 | $4,167 | $4,167 | $4,167 | $4,167 | $4,167 | $4,167 | $4,167 | $4,167 | |
| Insurance | $9,125 | $9,125 | $9,125 | $9,125 | $9,125 | $9,125 | $9,125 | $9,125 | $9,125 | $9,125 | $9,125 | $9,125 | |
| Rent | $2,333 | $2,333 | $2,333 | $2,333 | $2,333 | $2,333 | $2,333 | $2,333 | $2,333 | $2,333 | $2,333 | $2,333 | |
| Payroll Taxes | 15% | $3,750 | $3,750 | $3,750 | $3,750 | $3,750 | $3,750 | $3,750 | $3,750 | $3,750 | $3,750 | $3,750 | $3,750 |
| Other | $0 | $0 | $0 | $0 | $0 | $0 | $0 | $0 | $0 | $0 | $0 | $0 | |
| Total Operating Expenses | $121,670 | $121,670 | $121,670 | $121,670 | $121,670 | $121,670 | $121,670 | $121,670 | $121,670 | $121,670 | $121,670 | $121,670 | |
| Profit Before Interest and Taxes | $129,802 | $140,736 | $151,669 | $101,238 | $79,891 | $74,383 | $68,479 | $65,739 | $60,556 | $86,588 | $97,001 | $107,935 | |
| EBITDA | $134,385 | $145,319 | $156,253 | $105,821 | $84,474 | $78,966 | $73,062 | $70,323 | $65,139 | $91,171 | $101,585 | $112,518 | |
| Interest Expense | $4,383 | $4,383 | $4,383 | $4,383 | $4,383 | $4,383 | $4,383 | $4,383 | $4,383 | $4,383 | $4,383 | $5,197 | |
| Taxes Incurred | $37,626 | $54,541 | $58,914 | $38,742 | $30,203 | $28,000 | $25,638 | $24,542 | $22,469 | $32,882 | $37,047 | $41,095 | |
| Net Profit | $87,793 | $81,811 | $88,372 | $58,113 | $45,304 | $42,000 | $38,457 | $36,814 | $33,704 | $49,323 | $55,571 | $61,643 | |
| Net Profit/Sales | 15.39% | 13.75% | 14.25% | 11.49% | 9.91% | 9.44% | 8.92% | 8.66% | 8.15% | 10.44% | 11.20% | 11.84% | |
| Pro Forma Cash Flow | |||||||||||||
| Month 1 | Month 2 | Month 3 | Month 4 | Month 5 | Month 6 | Month 7 | Month 8 | Month 9 | Month 10 | Month 11 | Month 12 | ||
| Cash Received | |||||||||||||
| Cash from Operations | |||||||||||||
| Cash Sales | $570,400 | $595,200 | $620,000 | $505,609 | $457,189 | $444,695 | $431,304 | $425,090 | $413,333 | $472,380 | $496,000 | $520,800 | |
| Cash from Receivables | $0 | $0 | $0 | $0 | $0 | $0 | $0 | $0 | $0 | $0 | $0 | $0 | |
| Subtotal Cash from Operations | $570,400 | $595,200 | $620,000 | $505,609 | $457,189 | $444,695 | $431,304 | $425,090 | $413,333 | $472,380 | $496,000 | $520,800 | |
| Additional Cash Received | |||||||||||||
| Sales Tax, VAT, HST/GST Received | 0.00% | $0 | $0 | $0 | $0 | $0 | $0 | $0 | $0 | $0 | $0 | $0 | $0 |
| New Current Borrowing | $0 | $0 | $0 | $0 | $0 | $0 | $0 | $0 | $0 | $0 | $0 | $50,000 | |
| New Other Liabilities (interest-free) | $0 | $0 | $0 | $0 | $0 | $0 | $0 | $0 | $0 | $0 | $0 | $0 | |
| New Long-term Liabilities | $0 | $0 | $0 | $0 | $0 | $0 | $0 | $0 | $0 | $0 | $0 | $47,600 | |
| Sales of Other Current Assets | $0 | $0 | $0 | $0 | $0 | $0 | $0 | $0 | $0 | $0 | $0 | $0 | |
| Sales of Long-term Assets | $0 | $0 | $0 | $0 | $0 | $0 | $0 | $0 | $0 | $0 | $0 | $0 | |
| New Investment Received | $0 | $0 | $0 | $0 | $0 | $0 | $0 | $0 | $0 | $0 | $0 | $0 | |
| Subtotal Cash Received | $570,400 | $595,200 | $620,000 | $505,609 | $457,189 | $444,695 | $431,304 | $425,090 | $413,333 | $472,380 | $496,000 | $618,400 | |
| Expenditures | Month 1 | Month 2 | Month 3 | Month 4 | Month 5 | Month 6 | Month 7 | Month 8 | Month 9 | Month 10 | Month 11 | Month 12 | |
| Expenditures from Operations | |||||||||||||
| Cash Spending | $25,000 | $25,000 | $25,000 | $25,000 | $25,000 | $25,000 | $25,000 | $25,000 | $25,000 | $25,000 | $25,000 | $25,000 | |
| Bill Payments | $24,128 | $716,351 | $499,666 | $511,640 | $347,723 | $352,951 | $365,081 | $355,022 | $354,469 | $345,714 | $429,643 | $426,022 | |
| Subtotal Spent on Operations | $49,128 | $741,351 | $524,666 | $536,640 | $372,723 | $377,951 | $390,081 | $380,022 | $379,469 | $370,714 | $454,643 | $451,022 | |
| Additional Cash Spent | |||||||||||||
| Sales Tax, VAT, HST/GST Paid Out | $0 | $0 | $0 | $0 | $0 | $0 | $0 | $0 | $0 | $0 | $0 | $0 | |
| Principal Repayment of Current Borrowing | $0 | $0 | $0 | $0 | $0 | $0 | $0 | $0 | $0 | $0 | $0 | $0 | |
| Other Liabilities Principal Repayment | $0 | $0 | $0 | $0 | $0 | $0 | $0 | $0 | $0 | $0 | $0 | $0 | |
| Long-term Liabilities Principal Repayment | $0 | $0 | $0 | $0 | $0 | $0 | $0 | $0 | $0 | $0 | $0 | $0 | |
| Purchase Other Current Assets | $0 | $0 | $0 | $0 | $0 | $0 | $0 | $0 | $0 | $0 | $0 | $0 | |
| Purchase Long-term Assets | $0 | $0 | $0 | $0 | $0 | $0 | $0 | $0 | $0 | $0 | $0 | $0 | |
| Dividends | $0 | $0 | $0 | $0 | $0 | $0 | $0 | $0 | $0 | $0 | $0 | $17,000 | |
| Subtotal Cash Spent | $49,128 | $741,351 | $524,666 | $536,640 | $372,723 | $377,951 | $390,081 | $380,022 | $379,469 | $370,714 | $454,643 | $468,022 | |
| Net Cash Flow | $521,272 | ($146,151) | $95,334 | ($31,031) | $84,466 | $66,744 | $41,223 | $45,068 | $33,864 | $101,666 | $41,357 | $150,378 | |
| Cash Balance | $556,272 | $410,121 | $505,454 | $474,423 | $558,889 | $625,633 | $666,856 | $711,924 | $745,788 | $847,454 | $888,811 | $1,039,189 | |
| Pro Forma Balance Sheet | |||||||||||||
| Month 1 | Month 2 | Month 3 | Month 4 | Month 5 | Month 6 | Month 7 | Month 8 | Month 9 | Month 10 | Month 11 | Month 12 | ||
| Assets | Starting Balances | ||||||||||||
| Current Assets | |||||||||||||
| Cash | $35,000 | $556,272 | $410,121 | $505,454 | $474,423 | $558,889 | $625,633 | $666,856 | $711,924 | $745,788 | $847,454 | $888,811 | $1,039,189 |
| Accounts Receivable | $0 | $0 | $0 | $0 | $0 | $0 | $0 | $0 | $0 | $0 | $0 | $0 | $0 |
| Inventory | $80,000 | $350,821 | $366,074 | $381,327 | $310,971 | $281,191 | $273,507 | $265,271 | $261,449 | $254,218 | $290,534 | $305,061 | $320,314 |
| Other Current Assets | $0 | $0 | $0 | $0 | $0 | $0 | $0 | $0 | $0 | $0 | $0 | $0 | $0 |
| Total Current Assets | $115,000 | $907,092 | $776,194 | $886,781 | $785,395 | $840,080 | $899,140 | $932,127 | $973,373 | $1,000,005 | $1,137,988 | $1,193,872 | $1,359,503 |
| Long-term Assets | |||||||||||||
| Long-term Assets | $300,000 | $300,000 | $300,000 | $300,000 | $300,000 | $300,000 | $300,000 | $300,000 | $300,000 | $300,000 | $300,000 | $300,000 | $300,000 |
| Accumulated Depreciation | $0 | $4,583 | $9,167 | $13,750 | $18,333 | $22,917 | $27,500 | $32,083 | $36,667 | $41,250 | $45,833 | $50,417 | $55,000 |
| Total Long-term Assets | $300,000 | $295,417 | $290,833 | $286,250 | $281,667 | $277,083 | $272,500 | $267,917 | $263,333 | $258,750 | $254,167 | $249,583 | $245,000 |
| Total Assets | $415,000 | $1,202,509 | $1,067,028 | $1,173,031 | $1,067,061 | $1,117,163 | $1,171,640 | $1,200,043 | $1,236,706 | $1,258,755 | $1,392,154 | $1,443,455 | $1,604,503 |
| Liabilities and Capital | Month 1 | Month 2 | Month 3 | Month 4 | Month 5 | Month 6 | Month 7 | Month 8 | Month 9 | Month 10 | Month 11 | Month 12 | |
| Current Liabilities | |||||||||||||
| Accounts Payable | $0 | $699,716 | $482,423 | $500,055 | $335,972 | $340,770 | $353,247 | $343,193 | $343,042 | $331,388 | $415,464 | $411,194 | $429,999 |
| Current Borrowing | $50,000 | $50,000 | $50,000 | $50,000 | $50,000 | $50,000 | $50,000 | $50,000 | $50,000 | $50,000 | $50,000 | $50,000 | $100,000 |
| Other Current Liabilities | $0 | $0 | $0 | $0 | $0 | $0 | $0 | $0 | $0 | $0 | $0 | $0 | $0 |
| Subtotal Current Liabilities | $50,000 | $749,716 | $532,423 | $550,055 | $385,972 | $390,770 | $403,247 | $393,193 | $393,042 | $381,388 | $465,464 | $461,194 | $529,999 |
| Long-term Liabilities | $476,000 | $476,000 | $476,000 | $476,000 | $476,000 | $476,000 | $476,000 | $476,000 | $476,000 | $476,000 | $476,000 | $476,000 | $523,600 |
| Total Liabilities | $526,000 | $1,225,716 | $1,008,423 | $1,026,055 | $861,972 | $866,770 | $879,247 | $869,193 | $869,042 | $857,388 | $941,464 | $937,194 | $1,053,599 |
| Paid-in Capital | $321,000 | $321,000 | $321,000 | $321,000 | $321,000 | $321,000 | $321,000 | $321,000 | $321,000 | $321,000 | $321,000 | $321,000 | $321,000 |
| Retained Earnings | ($432,000) | ($432,000) | ($432,000) | ($432,000) | ($432,000) | ($432,000) | ($432,000) | ($432,000) | ($432,000) | ($432,000) | ($432,000) | ($432,000) | ($449,000) |
| Earnings | $0 | $87,793 | $169,605 | $257,976 | $316,089 | $361,393 | $403,393 | $441,850 | $478,664 | $512,367 | $561,690 | $617,261 | $678,904 |
| Total Capital | ($111,000) | ($23,207) | $58,605 | $146,976 | $205,089 | $250,393 | $292,393 | $330,850 | $367,664 | $401,367 | $450,690 | $506,261 | $550,904 |
| Total Liabilities and Capital | $415,000 | $1,202,509 | $1,067,028 | $1,173,031 | $1,067,061 | $1,117,163 | $1,171,640 | $1,200,043 | $1,236,706 | $1,258,755 | $1,392,154 | $1,443,455 | $1,604,503 |
| Net Worth | ($111,000) | ($23,207) | $58,605 | $146,976 | $205,089 | $250,393 | $292,393 | $330,850 | $367,664 | $401,367 | $450,690 | $506,261 | $550,904 |


