
Inspect A-bode
Executive Summary
Introduction
Inspect A-bode is a residential home inspection service serving Eugene, OR and the surrounding community. Inspect A-bode offers complete home inspections, as well as additional services including electromagnetic field testing, radon testing, and asbestos testing. This service will be offered to home buyers as well as sellers. The majority of sales will come from real estate agents who will have entered into strategic relationships with Inspect A-bode.
In order to reach projected profitability, the company’s two major goals are the utilization/reference of Inspect A-bode in at least five of the top 15 real estate brokers in the area, and to increase the number of clients sold by 20% per year.
The Company
The company will be a sole-proprietorship owned an operated my Mr. Chek Domisile. Mr. Domisile, has 12 years of industry experience. These years of experience will be leveraged to develop a competitive advantage, along with an unapproachable level of professionalism.
Selle Domisile, Chek’s wife will be a paid consultant. Selle has been a residential realtor for the last 10 years. She will be instrumental in using her existing relationships to drive referrals to Inspect A-bode. The company does not plan to hire any additional employees and will have all accounting and bookkeeping subcontracted.
Services
The company has a wide variety of inspection services. These include: foundation analysis for cracks, settlement, and moisture influx. Plumbing inspections that look for deterioration, leaks, and check for appropriate water pressure. The company’s electrical inspection looks for loose wires, shorts, shock/fire hazards, and proper functioning of Ground Fault Interrupt (GFI) receptacles. Interior inspections identify if the house has proper heating and insulation, ventilation, vapor barriers, dry rot, pest infestations and carbon dioxide hazards. Optional services will include electromagnetic field testing, radon testing, and asbestos testing.
The cost of the full service is $200-$400, depending on size of home, layout, and any areas such as a swimming pool requiring special attention.
The Market
The home inspection industry in Eugene is decent sized, about 20 different companies. Most companies are small outfits and offer a fairly standardized service. The items inspected are similar as well as the price.
Inspect A-bode will be focusing on two general groups of customers. The first group is real estate agents. The strategic relationships with the agents will include an economic incentive for them to give Inspect A-bode referrals.
Inspect A-bode will also target individual buyers and sellers. For different reasons, both of these groups have something to gain by having an inspection done on the home they are trying to sell/buy. Inspect A-bode will target these groups through focused advertisements providing visibility of Inspect A-bode.
The company will be launching an advertising campaign in publications that home buyers are typically reading, as well as in the Yellow Pages.
1.1 Objectives
Inspect A-bode’s objectives for the first three years of operation include:
- To create a service-based company whose #1 goal is exceeding customer’s expectations.
- The utilization/reference of Inspect A-bode in at least five of the top 15 real estate brokers as listed in the Eugene Chamber of Commerce book of lists.
- To increase the number of clients sold by 20% per year through superior performance.
- To develop a sustainable home business.

1.2 Mission
Inspect A-bode’s mission is to provide the customer with the highest quality home residential home inspections. When we adhere to this maxim, everything else will fall into place. Our services will exceed the expectations of our customers.
Company Summary
Inspect A-bode, soon to be located in Eugene, OR, will offer residential home inspections. Inspect A-bode will offer a comprehensive basic service that includes a wide range of inspections. Inspect A-bode also offers optional services that include electromagnetic field testing, radon testing, and asbestos testing.
Inspect A-bode will be developing strategic relationships with local realtors so that the majority of the homes inspected are from referrals from local real estate agents. The rest of the inspections will be from direct solicitation from home buyers and sellers.
The business will be based out of Chek Domisile’s home. Inspect A-bode will reach profitability by month six and will generate modest profits by year three.
2.1 Start-up Summary
Inspect A-bode’s start-up costs will include:
- Laptop computer, printer, Internet connection, CD-RW.
- Home inspection specific software.
- Fax machine, copier, pager, cell phone.
- Desk, chair and file cabinet.
- Three sets of coveralls for protective clothing.
- Flashlight.
- Binoculars for hard to see areas.
- Ladder.
- Combined receptacle and GFI tester.
- Tic tracer.
- Moisture meter.
- Gas detector.
- Inspection mirror.
- Screwdriver, pliers, awe probe, smoke detector tester.
- Pressure and temperature water gauges.
- Electromagnetic field tester.
- Asbestos tester.
Please note that all items that are assets to be used for longer than one year will be depreciated using the straight-line method according to GAAP.

| Start-up | |
| Requirements | |
| Start-up Expenses | |
| Legal | $500 |
| Stationery etc. | $100 |
| Brochures | $0 |
| Consultants | $1,500 |
| Insurance | $0 |
| Rent | $0 |
| Research and Development | $0 |
| Expensed Equipment | $0 |
| Other | $0 |
| Total Start-up Expenses | $2,100 |
| Start-up Assets | |
| Cash Required | $3,600 |
| Other Current Assets | $0 |
| Long-term Assets | $4,300 |
| Total Assets | $7,900 |
| Total Requirements | $10,000 |
| Start-up Funding | |
| Start-up Expenses to Fund | $2,100 |
| Start-up Assets to Fund | $7,900 |
| Total Funding Required | $10,000 |
| Assets | |
| Non-cash Assets from Start-up | $4,300 |
| Cash Requirements from Start-up | $3,600 |
| Additional Cash Raised | $2,500 |
| Cash Balance on Starting Date | $6,100 |
| Total Assets | $10,400 |
| Liabilities and Capital | |
| Liabilities | |
| Current Borrowing | $2,500 |
| Long-term Liabilities | $0 |
| Accounts Payable (Outstanding Bills) | $0 |
| Other Current Liabilities (interest-free) | $0 |
| Total Liabilities | $2,500 |
| Capital | |
| Planned Investment | |
| Chek | $10,000 |
| Investor 2 | $0 |
| Other | $0 |
| Additional Investment Requirement | $0 |
| Total Planned Investment | $10,000 |
| Loss at Start-up (Start-up Expenses) | ($2,100) |
| Total Capital | $7,900 |
| Total Capital and Liabilities | $10,400 |
| Total Funding | $12,500 |
2.2 Company Ownership
Inspect A-bode is a sole proprietorship, founded and owned by Chek Domisile.
Services
Inspect A-bode offers residential home inspections for both buyers and sellers. The majority of service calls will have been derived from strategic partnerships with realtors. Inspect A-bode’s standard inspection includes addressing:
- Site: Land contour, drainage, driveways, walkways, porches, decks, retaining walls, parking structures, and evidence of abandoned oil tanks.
- Foundation: Cracks, settlement, deterioration, moisture influx, and piers.
- Exterior: Siding, trim, entry doors, garage doors, windows, and chimneys.
- Structure: Framing of sub-floors, stairs, walls, ceilings, and roofs.
- Roofing: Roof coverings, flashings, skylights, gutters, downspouts, eaves, and soffits.
- Plumbing: Water pressure, piping, fixtures, faucets, drains, vents, and water heaters.
- Electrical: Service conductors, main and sub-panels, breakers and fuses, grounding, switches, receptacles, fixtures, fans, smoke detectors, GFI function, etc.
- Heating: Furnace or boiler, ducts, radiators, registers, wood stoves, and central air conditioning.
- Insulation: Attic, ceiling, wall and floor insulation, and vapor barriers.
- Ventilation: Attic, crawlspace, kitchen, bath and laundry ventilation.
- Interior: Walls, floors, ceilings, doors, woodwork, cabinets, bathroom finish, fireplaces, etc.
- Built-In Appliances: Ranges, ovens, microwaves, disposals, dishwashers, and trash compactors.
- Pest & Dry Rot: Inspection for termites, carpenter ants, beetles, wood rot, and rodent infestation.
- Carbon Monoxide: Measurement of furnace, water heater, and range output.
Optional services will include electromagnetic field testing ($45), radon testing ($200), and asbestos testing ($120).
A comprehensive written report (typically around 12 pages) will accompany the service. Inspect A-bode suggests all clients be present during the inspection to increase comprehension of the written report by the client. The cost of the full service is $200-$400, depending on size of home, layout, and any areas such as a swimming pool requiring special attention.
Market Analysis Summary
Inspect A-bode will be focusing on two general groups of customers. The first group is real estate agents. The strategic relationships with the agents will include an economic incentive for them to give Inspect A-bode referrals. The agents will provide Inspect A-bode with a steady flow of customers as it is in the agent’s best interests for the houses that they are trying to sell to have a complete inspection, ensuring satisfied customers.

Inspect A-bode will also target individual buyers and sellers. For different reasons, both of these groups have something to gain by having an inspection done on the home they are trying to sell/buy. Inspect A-bode will target these groups through focused advertisements providing visibility of Inspect A-bode.
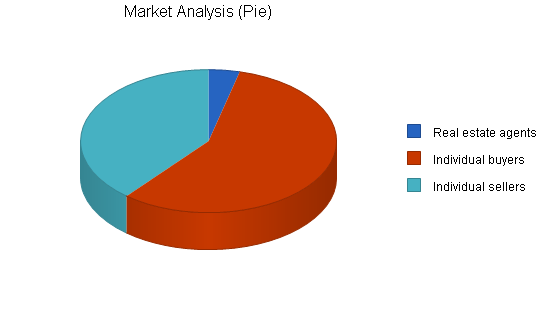
4.1 Market Segmentation
Inspect A-bode’s target can be broken down into three (not mutually exclusive) segments:
- Real estate agents: this group of customers are professional realtors in the area. They are targeted because they will recommend, or require, a home inspection before purchase. Requiring the inspection makes great business sense. It forces latent problems to become apparent, significantly reducing the chance of the customer being dissatisfied. By aligning Inspect A-bode with many different realtors, Inspect A-bode would in essence be spoon fed a constant stream of business. Not only would there be a flow of customers, but they would all be referrals so there would already be the beginning of a trust bond formed as their agent has personally vouched for Inspect A-bode. After the initial relationships are set up, the agents would be a relatively easy group to service or maintain.
- Individual buyers: this group is purchasing inspections to avoid the phenomenon of “caveat emptor” which in Latin means buyer beware. The house buyer is motivated to determine any problems with the house before they purchase it. The knowledge of what is wrong with it is useful because it will provide insight as to whether the asking price is fair and the information could be used as leverage to adjust the price if it wasn’t fair.
- Individual sellers: this group is a smaller segment relative to the other two, but they still will be a consumer of Inspect A-bode’s service. Having an inspection done on the house that they are trying to sell is useful in offering assurances to the buyer regarding the condition of the house.
| Market Analysis | |||||||
| Year 1 | Year 2 | Year 3 | Year 4 | Year 5 | |||
| Potential Customers | Growth | CAGR | |||||
| Real estate agents | 9% | 1,021 | 1,113 | 1,213 | 1,322 | 1,441 | 9.00% |
| Individual buyers | 10% | 15,002 | 16,502 | 18,152 | 19,967 | 21,964 | 10.00% |
| Individual sellers | 9% | 10,245 | 11,167 | 12,172 | 13,267 | 14,461 | 9.00% |
| Total | 9.57% | 26,268 | 28,782 | 31,537 | 34,556 | 37,866 | 9.57% |
4.2 Target Market Segment Strategy
Inspect A-bode intends to specifically target all three segments.
- Real Estate Agents: this group will be targeted through the development of strategic alliances with many different realtors. One angle at accomplishing this will be through networking relationships that Selle, Chek’s wife, has established through her ten years as a realtor. Selle is currently a realtor and will naturally suggest her clients use Inspect A-bode. Selle will be working with her colleagues to facilitate their usage of Inspect A-bode.
- Individual buyers: this group will be targeted through an advertising campaign in publications that home buyers are typically reading, as well as in the Yellow Pages. Individual buyers will emphasize that the buyers should be practicing due diligence regarding checking on the condition of their home before they buy.
- Individual sellers: this group would also be targeted through an advertising campaign reinforcing the idea that they will have an easier time selling their home if they have an objective report that details everything important about the condition of the house.
4.3 Service Business Analysis
The home inspection market in Eugene is decent size, about 20 different companies. Most companies are small outfits and offer a fairly standardized service. The items inspected are similar as well as the price, typically $200-$400. What differentiates the different companies is the level of experience and professionalism.
4.3.1 Competition and Buying Patterns
There are many different competitors in the home inspection market. At first glance, the service appears to be commodity like. Most people offer the same service offering, the same type of inspections, the same price, etc. However, the level of experience and professionalism of the service provider does indeed differentiate the companies.
The buying patterns regarding the home buyers seems to be based on referrals and advertisements. The home buyer will often ask someone in the industry if they can recommend a home inspector provider. If they do not know anyone to ask they will typically look in the number of local magazines for homes and find an advertisement in there. Lastly, they would also check the Yellow Pages.
Home sellers will either ask their realtor or they will look for some sort of advertisement.
The buying pattern for the realtors is that they typically will know of an inspector that they send their clients to. Because they are in the industry, they typically know people so they will generally not be looking at advertisements to make a decision as to who to recommend.
Strategy and Implementation Summary
Inspect A-bode will fully leverage its competitive edges (experience and professionalism) to turn prospective leads into customers. The customers will be so satisfied with the services that they will go on to tell their acquaintances about Inspect A-bode, in effect becoming a unpaid cheerleader for Inspect A-bode.
In addition to Inspect A-bode’s competitive advantages, they will have a 10 year veteran from the real estate agent industry as a paid consultant. The consultant, Selle Domisile, will develop a referral system for her colleagues in the real estate market, providing Inspect A-bode with a steady flow of customers.
5.1 Competitive Edge
Inspect A-bode’s competitive edge is based on experience and professionalism.
- Experience: Chek has 12 years of experience as a general contractor. Through these years in the industry, Chek has done almost everything in regards to home building and remodels. Having this first hand experience gives Chek a very discriminating eye when it comes to inspections. This makes his inspections that much more accurate because he has the knowledge and experience to make informed inspections. While others in the home inspection industry have a reasonable amount of experience, they are generally not as well trained as Chek. One reason for this is that there is the possibility for higher margins by actually doing the work instead of offering inspections. For Chek however, an injury a year ago has precluded him to continue as a general contractor, which in effect has allowed him to pursue this opportunity.
- Professionalism: loosely defined as exhibiting a courteous, conscientious, and generally businesslike manner; characterized by or conforming to the technical or ethical standards of a profession. Professionalism is an overriding goal and behavior for Chek. This comes across even in a simple conversation with Chek. People are utterly impressed when dealing with Chek and this is purposeful because they will tell people about him. Most people will agree contractors and home inspectors could use a dose of professionalism, allowing Chek to stand out even more from his colleagues.
5.2 Sales Strategy
Inspect A-bode’s primary sales strategy will be geared at setting up strategic relationships with local realtors. This will be done through networking on Selle’s behalf. Having spent so much time in the realty industry, Selle, Chek’s wife, will be contacting her colleagues and trying to set up partnerships. For every referral that is sent to Inspect A-bode, the agent will receive a commission. Creating a financial incentive is an effective way to modify someone’s behavior.
Chek will be relying on communicating his competitive advantages (experience and professionalism) when responding to prospect inquiries. The professionalism will be fairly easy to communicate as it will be obvious in general communication. The experience will be explained to the lead and will be detailed how experience translates to a better inspection.
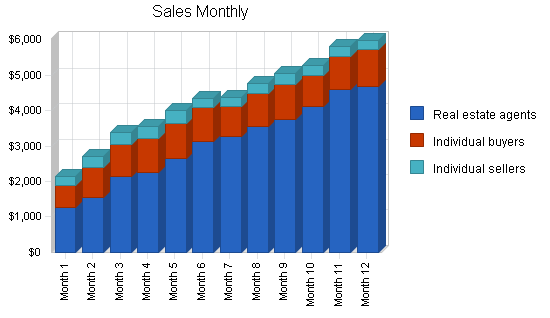
5.2.1 Sales Forecast
The first month will have no sales activity. Early in the month the home office will be set up, stationary produced, and the office will be organized. During the second half of the month Chek will be familiarizing himself with the new software and developing a template for the inspection report. The inspection report will be a template where Chek will fill in areas of information from the inspection. The purpose of the template is so that the report is uniform and consistent, and the time required to fill in the information from the report is reduced, saving time and allowing the report to be forwarded to the client quicker.
Also during the first month Selle will be setting up partnerships with other realtors to funnel business to Inspect A-bode. Having set up these relationships, the business will begin to build up during the second month. Business will grow steadily month to month. It is not expected to need a second employee until year two. By then business will have picked up and the employee will be used for back-end administrative details.
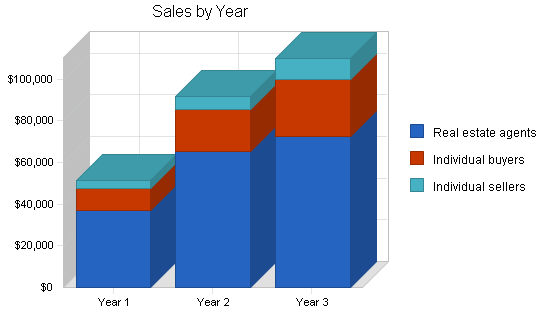
| Sales Forecast | |||
| Year 1 | Year 2 | Year 3 | |
| Sales | |||
| Real estate agents | $36,905 | $65,478 | $72,514 |
| Individual buyers | $10,854 | $19,854 | $27,458 |
| Individual sellers | $3,532 | $6,547 | $9,858 |
| Total Sales | $51,291 | $91,879 | $109,830 |
| Direct Cost of Sales | Year 1 | Year 2 | Year 3 |
| Real estate agents | $1,845 | $3,274 | $3,626 |
| Individual buyers | $543 | $993 | $1,373 |
| Individual sellers | $177 | $327 | $493 |
| Subtotal Direct Cost of Sales | $2,565 | $4,594 | $5,492 |
5.3 Milestones
- Business plan completion. This will be done as a roadmap for the organization. While we do not need a business plan to raise capital, it will be an indispensable tool for the ongoing performance and improvement of the company.
- Set up the office.
- Set up the realtor partnerships.
- Hiring a second employee.
| Milestones | |||||
| Milestone | Start Date | End Date | Budget | Manager | Department |
| Business plan completion | 1/1/2001 | 2/1/2001 | $0 | Chek | Marketing |
| Set up office | 1/1/2001 | 2/1/2001 | $0 | Chek | Department |
| Set up the realator partnerships | 1/1/2001 | 2/1/2001 | $0 | Selle | Department |
| Revenues of $50,000 | 1/1/2001 | 1/1/2002 | $0 | Chek | Department |
| Hiring a second employee | 1/1/2001 | 1/1/2002 | $0 | Chek | Department |
| Totals | $0 | ||||
Management Summary
Chek Domisile, the founder and owner of Inspect A-bode has come from the general contractor industry. Before his contracting days, Chek earned his Bachelors degree at the University of Oregon. Throughout the four years that Chek was in school he worked for a general contractor. This opportunity was a good source of money, it also was a good source of training. Chek enjoyed building things and he felt that he could get excellent training by working with the general contractor.
Upon graduation Chek worked for the same contractor for two more years at which time he longed to have his own company. So using all of the knowledge that he learned, he opened his own company. Chek started small. He would bid on project and the bulk of the work he would do himself. This lasted for twelve years. Chek was quite happy, doing what he enjoyed and working for himself. However, tragedy soon struck. A piece of wood fell on his hand and ended the use of two of his fingers. These fingers were needed in his job so Chek had to change professions.
It took several months before it dawned on him that he could work in a similar industry, and still work for himself. Inspect A-bode was born.
Selle Domisile, Chek’s wife will be a paid consultant. Selle has been a residential realtor for the last 10 years. She has been working for her own company and thoroughly enjoys it. Selle will be lining up partnership with local realtors. She will be instrumental in using her existing relationships to drive referrals to Inspect A-bode.
6.1 Personnel Plan
Chek will be working full time doing everything. He will be setting up and running the office, as well as doing the inspections. This will last for a year. By year two things will have gotten busy and he will use an assistant for back office help.
Selle will be a paid consultant and will be responsible for developing relationships with realtors.
| Personnel Plan | |||
| Year 1 | Year 2 | Year 3 | |
| Chek | $36,000 | $42,000 | $50,000 |
| Office assistant | $0 | $12,000 | $12,000 |
| Total People | 1 | 2 | 2 |
| Total Payroll | $36,000 | $54,000 | $62,000 |
Financial Plan
The following sections will outline important financial information.
7.1 Important Assumptions
The following table highlights some important financial assumptions.
| General Assumptions | |||
| Year 1 | Year 2 | Year 3 | |
| Plan Month | 1 | 2 | 3 |
| Current Interest Rate | 10.00% | 10.00% | 10.00% |
| Long-term Interest Rate | 10.00% | 10.00% | 10.00% |
| Tax Rate | 30.00% | 30.00% | 30.00% |
| Other | 0 | 0 | 0 |
7.2 Break-even Analysis
The Break-even Analysis indicates what is needed in monthly revenue.

| Break-even Analysis | |
| Monthly Revenue Break-even | $4,049 |
| Assumptions: | |
| Average Percent Variable Cost | 5% |
| Estimated Monthly Fixed Cost | $3,847 |
7.3 Projected Profit and Loss
The following table indicates projected profit and loss.


| Pro Forma Profit and Loss | |||
| Year 1 | Year 2 | Year 3 | |
| Sales | $51,291 | $91,879 | $109,830 |
| Direct Cost of Sales | $2,565 | $4,594 | $5,492 |
| Other Production Expenses | $0 | $0 | $0 |
| Total Cost of Sales | $2,565 | $4,594 | $5,492 |
| Gross Margin | $48,726 | $87,285 | $104,339 |
| Gross Margin % | 95.00% | 95.00% | 95.00% |
| Expenses | |||
| Payroll | $36,000 | $54,000 | $62,000 |
| Sales and Marketing and Other Expenses | $1,200 | $1,200 | $1,200 |
| Depreciation | $864 | $864 | $864 |
| Leased Equipment | $0 | $0 | $0 |
| Utilities | $0 | $0 | $0 |
| Insurance | $0 | $0 | $0 |
| License fees and association dues | $2,700 | $2,700 | $2,700 |
| Payroll Taxes | $5,400 | $8,100 | $9,300 |
| Other | $0 | $0 | $0 |
| Total Operating Expenses | $46,164 | $66,864 | $76,064 |
| Profit Before Interest and Taxes | $2,562 | $20,421 | $28,275 |
| EBITDA | $3,426 | $21,285 | $29,139 |
| Interest Expense | $250 | $250 | $250 |
| Taxes Incurred | $694 | $6,051 | $8,407 |
| Net Profit | $1,619 | $14,120 | $19,617 |
| Net Profit/Sales | 3.16% | 15.37% | 17.86% |
7.4 Projected Cash Flow
The following chart and table indicates projected cash flow.

| Pro Forma Cash Flow | |||
| Year 1 | Year 2 | Year 3 | |
| Cash Received | |||
| Cash from Operations | |||
| Cash Sales | $51,291 | $91,879 | $109,830 |
| Subtotal Cash from Operations | $51,291 | $91,879 | $109,830 |
| Additional Cash Received | |||
| Sales Tax, VAT, HST/GST Received | $0 | $0 | $0 |
| New Current Borrowing | $0 | $0 | $0 |
| New Other Liabilities (interest-free) | $0 | $0 | $0 |
| New Long-term Liabilities | $0 | $0 | $0 |
| Sales of Other Current Assets | $0 | $0 | $0 |
| Sales of Long-term Assets | $0 | $0 | $0 |
| New Investment Received | $0 | $0 | $0 |
| Subtotal Cash Received | $51,291 | $91,879 | $109,830 |
| Expenditures | Year 1 | Year 2 | Year 3 |
| Expenditures from Operations | |||
| Cash Spending | $36,000 | $54,000 | $62,000 |
| Bill Payments | $11,225 | $22,596 | $26,983 |
| Subtotal Spent on Operations | $47,225 | $76,596 | $88,983 |
| Additional Cash Spent | |||
| Sales Tax, VAT, HST/GST Paid Out | $0 | $0 | $0 |
| Principal Repayment of Current Borrowing | $0 | $0 | $0 |
| Other Liabilities Principal Repayment | $0 | $0 | $0 |
| Long-term Liabilities Principal Repayment | $0 | $0 | $0 |
| Purchase Other Current Assets | $0 | $0 | $0 |
| Purchase Long-term Assets | $0 | $0 | $0 |
| Dividends | $0 | $0 | $0 |
| Subtotal Cash Spent | $47,225 | $76,596 | $88,983 |
| Net Cash Flow | $4,066 | $15,283 | $20,847 |
| Cash Balance | $10,166 | $25,448 | $46,295 |
7.5 Projected Balance Sheet
The following table will indicate the projected balance sheet.
| Pro Forma Balance Sheet | |||
| Year 1 | Year 2 | Year 3 | |
| Assets | |||
| Current Assets | |||
| Cash | $10,166 | $25,448 | $46,295 |
| Other Current Assets | $0 | $0 | $0 |
| Total Current Assets | $10,166 | $25,448 | $46,295 |
| Long-term Assets | |||
| Long-term Assets | $4,300 | $4,300 | $4,300 |
| Accumulated Depreciation | $864 | $1,728 | $2,592 |
| Total Long-term Assets | $3,436 | $2,572 | $1,708 |
| Total Assets | $13,602 | $28,020 | $48,003 |
| Liabilities and Capital | Year 1 | Year 2 | Year 3 |
| Current Liabilities | |||
| Accounts Payable | $1,583 | $1,882 | $2,248 |
| Current Borrowing | $2,500 | $2,500 | $2,500 |
| Other Current Liabilities | $0 | $0 | $0 |
| Subtotal Current Liabilities | $4,083 | $4,382 | $4,748 |
| Long-term Liabilities | $0 | $0 | $0 |
| Total Liabilities | $4,083 | $4,382 | $4,748 |
| Paid-in Capital | $10,000 | $10,000 | $10,000 |
| Retained Earnings | ($2,100) | ($481) | $13,638 |
| Earnings | $1,619 | $14,120 | $19,617 |
| Total Capital | $9,519 | $23,638 | $43,256 |
| Total Liabilities and Capital | $13,602 | $28,020 | $48,003 |
| Net Worth | $9,519 | $23,638 | $43,256 |
7.6 Business Ratios
Business ratios for the years of this plan are shown below. Industry profile ratios based on the Standard Industrial Classification (SIC) code 7389, Building Inspection Services, are shown for comparison.
| Ratio Analysis | ||||
| Year 1 | Year 2 | Year 3 | Industry Profile | |
| Sales Growth | 0.00% | 79.13% | 19.54% | 10.93% |
| Percent of Total Assets | ||||
| Other Current Assets | 0.00% | 0.00% | 0.00% | 48.08% |
| Total Current Assets | 74.74% | 90.82% | 96.44% | 77.44% |
| Long-term Assets | 25.26% | 9.18% | 3.56% | 22.56% |
| Total Assets | 100.00% | 100.00% | 100.00% | 100.00% |
| Current Liabilities | 30.02% | 15.64% | 9.89% | 39.19% |
| Long-term Liabilities | 0.00% | 0.00% | 0.00% | 17.22% |
| Total Liabilities | 30.02% | 15.64% | 9.89% | 56.41% |
| Net Worth | 69.98% | 84.36% | 90.11% | 43.59% |
| Percent of Sales | ||||
| Sales | 100.00% | 100.00% | 100.00% | 100.00% |
| Gross Margin | 95.00% | 95.00% | 95.00% | 100.00% |
| Selling, General & Administrative Expenses | 91.50% | 79.44% | 76.98% | 74.57% |
| Advertising Expenses | 2.34% | 1.31% | 1.09% | 2.60% |
| Profit Before Interest and Taxes | 5.00% | 22.23% | 25.74% | 1.43% |
| Main Ratios | ||||
| Current | 2.49 | 5.81 | 9.75 | 1.48 |
| Quick | 2.49 | 5.81 | 9.75 | 1.17 |
| Total Debt to Total Assets | 30.02% | 15.64% | 9.89% | 64.55% |
| Pre-tax Return on Net Worth | 24.29% | 85.33% | 64.79% | 3.55% |
| Pre-tax Return on Assets | 17.00% | 71.99% | 58.38% | 10.01% |
| Additional Ratios | Year 1 | Year 2 | Year 3 | |
| Net Profit Margin | 3.16% | 15.37% | 17.86% | n.a |
| Return on Equity | 17.01% | 59.73% | 45.35% | n.a |
| Activity Ratios | ||||
| Accounts Payable Turnover | 8.09 | 12.17 | 12.17 | n.a |
| Payment Days | 27 | 28 | 28 | n.a |
| Total Asset Turnover | 3.77 | 3.28 | 2.29 | n.a |
| Debt Ratios | ||||
| Debt to Net Worth | 0.43 | 0.19 | 0.11 | n.a |
| Current Liab. to Liab. | 1.00 | 1.00 | 1.00 | n.a |
| Liquidity Ratios | ||||
| Net Working Capital | $6,083 | $21,066 | $41,548 | n.a |
| Interest Coverage | 10.25 | 81.68 | 113.10 | n.a |
| Additional Ratios | ||||
| Assets to Sales | 0.27 | 0.30 | 0.44 | n.a |
| Current Debt/Total Assets | 30% | 16% | 10% | n.a |
| Acid Test | 2.49 | 5.81 | 9.75 | n.a |
| Sales/Net Worth | 5.39 | 3.89 | 2.54 | n.a |
| Dividend Payout | 0.00 | 0.00 | 0.00 | n.a |
Appendix
| Sales Forecast | |||||||||||||
| Month 1 | Month 2 | Month 3 | Month 4 | Month 5 | Month 6 | Month 7 | Month 8 | Month 9 | Month 10 | Month 11 | Month 12 | ||
| Sales | |||||||||||||
| Real estate agents | 0% | $1,254 | $1,547 | $2,145 | $2,254 | $2,645 | $3,124 | $3,254 | $3,547 | $3,745 | $4,125 | $4,578 | $4,687 |
| Individual buyers | 0% | $625 | $845 | $902 | $945 | $994 | $954 | $854 | $921 | $982 | $854 | $954 | $1,024 |
| Individual sellers | 0% | $250 | $300 | $321 | $345 | $354 | $254 | $265 | $301 | $321 | $298 | $258 | $265 |
| Total Sales | $2,129 | $2,692 | $3,368 | $3,544 | $3,993 | $4,332 | $4,373 | $4,769 | $5,048 | $5,277 | $5,790 | $5,976 | |
| Direct Cost of Sales | Month 1 | Month 2 | Month 3 | Month 4 | Month 5 | Month 6 | Month 7 | Month 8 | Month 9 | Month 10 | Month 11 | Month 12 | |
| Real estate agents | $63 | $77 | $107 | $113 | $132 | $156 | $163 | $177 | $187 | $206 | $229 | $234 | |
| Individual buyers | $31 | $42 | $45 | $47 | $50 | $48 | $43 | $46 | $49 | $43 | $48 | $51 | |
| Individual sellers | $13 | $15 | $16 | $17 | $18 | $13 | $13 | $15 | $16 | $15 | $13 | $13 | |
| Subtotal Direct Cost of Sales | $106 | $135 | $168 | $177 | $200 | $217 | $219 | $238 | $252 | $264 | $290 | $299 | |
| Personnel Plan | |||||||||||||
| Month 1 | Month 2 | Month 3 | Month 4 | Month 5 | Month 6 | Month 7 | Month 8 | Month 9 | Month 10 | Month 11 | Month 12 | ||
| Chek | 0% | $3,000 | $3,000 | $3,000 | $3,000 | $3,000 | $3,000 | $3,000 | $3,000 | $3,000 | $3,000 | $3,000 | $3,000 |
| Office assistant | 0% | $0 | $0 | $0 | $0 | $0 | $0 | $0 | $0 | $0 | $0 | $0 | $0 |
| Total People | 1 | 1 | 1 | 1 | 1 | 1 | 1 | 1 | 1 | 1 | 1 | 1 | |
| Total Payroll | $3,000 | $3,000 | $3,000 | $3,000 | $3,000 | $3,000 | $3,000 | $3,000 | $3,000 | $3,000 | $3,000 | $3,000 | |
| General Assumptions | |||||||||||||
| Month 1 | Month 2 | Month 3 | Month 4 | Month 5 | Month 6 | Month 7 | Month 8 | Month 9 | Month 10 | Month 11 | Month 12 | ||
| Plan Month | 1 | 2 | 3 | 4 | 5 | 6 | 7 | 8 | 9 | 10 | 11 | 12 | |
| Current Interest Rate | 10.00% | 10.00% | 10.00% | 10.00% | 10.00% | 10.00% | 10.00% | 10.00% | 10.00% | 10.00% | 10.00% | 10.00% | |
| Long-term Interest Rate | 10.00% | 10.00% | 10.00% | 10.00% | 10.00% | 10.00% | 10.00% | 10.00% | 10.00% | 10.00% | 10.00% | 10.00% | |
| Tax Rate | 30.00% | 30.00% | 30.00% | 30.00% | 30.00% | 30.00% | 30.00% | 30.00% | 30.00% | 30.00% | 30.00% | 30.00% | |
| Other | 0 | 0 | 0 | 0 | 0 | 0 | 0 | 0 | 0 | 0 | 0 | 0 | |
| Pro Forma Profit and Loss | |||||||||||||
| Month 1 | Month 2 | Month 3 | Month 4 | Month 5 | Month 6 | Month 7 | Month 8 | Month 9 | Month 10 | Month 11 | Month 12 | ||
| Sales | $2,129 | $2,692 | $3,368 | $3,544 | $3,993 | $4,332 | $4,373 | $4,769 | $5,048 | $5,277 | $5,790 | $5,976 | |
| Direct Cost of Sales | $106 | $135 | $168 | $177 | $200 | $217 | $219 | $238 | $252 | $264 | $290 | $299 | |
| Other Production Expenses | $0 | $0 | $0 | $0 | $0 | $0 | $0 | $0 | $0 | $0 | $0 | $0 | |
| Total Cost of Sales | $106 | $135 | $168 | $177 | $200 | $217 | $219 | $238 | $252 | $264 | $290 | $299 | |
| Gross Margin | $2,023 | $2,557 | $3,200 | $3,367 | $3,793 | $4,115 | $4,154 | $4,531 | $4,796 | $5,013 | $5,501 | $5,677 | |
| Gross Margin % | 95.00% | 95.00% | 95.00% | 95.00% | 95.00% | 95.00% | 95.00% | 95.00% | 95.00% | 95.00% | 95.00% | 95.00% | |
| Expenses | |||||||||||||
| Payroll | $3,000 | $3,000 | $3,000 | $3,000 | $3,000 | $3,000 | $3,000 | $3,000 | $3,000 | $3,000 | $3,000 | $3,000 | |
| Sales and Marketing and Other Expenses | $100 | $100 | $100 | $100 | $100 | $100 | $100 | $100 | $100 | $100 | $100 | $100 | |
| Depreciation | $72 | $72 | $72 | $72 | $72 | $72 | $72 | $72 | $72 | $72 | $72 | $72 | |
| Leased Equipment | $0 | $0 | $0 | $0 | $0 | $0 | $0 | $0 | $0 | $0 | $0 | $0 | |
| Utilities | $0 | $0 | $0 | $0 | $0 | $0 | $0 | $0 | $0 | $0 | $0 | $0 | |
| Insurance | $0 | $0 | $0 | $0 | $0 | $0 | $0 | $0 | $0 | $0 | $0 | $0 | |
| License fees and association dues | $225 | $225 | $225 | $225 | $225 | $225 | $225 | $225 | $225 | $225 | $225 | $225 | |
| Payroll Taxes | 15% | $450 | $450 | $450 | $450 | $450 | $450 | $450 | $450 | $450 | $450 | $450 | $450 |
| Other | $0 | $0 | $0 | $0 | $0 | $0 | $0 | $0 | $0 | $0 | $0 | $0 | |
| Total Operating Expenses | $3,847 | $3,847 | $3,847 | $3,847 | $3,847 | $3,847 | $3,847 | $3,847 | $3,847 | $3,847 | $3,847 | $3,847 | |
| Profit Before Interest and Taxes | ($1,824) | ($1,290) | ($647) | ($480) | ($54) | $268 | $307 | $684 | $949 | $1,166 | $1,654 | $1,830 | |
| EBITDA | ($1,752) | ($1,218) | ($575) | ($408) | $18 | $340 | $379 | $756 | $1,021 | $1,238 | $1,726 | $1,902 | |
| Interest Expense | $21 | $21 | $21 | $21 | $21 | $21 | $21 | $21 | $21 | $21 | $21 | $21 | |
| Taxes Incurred | ($554) | ($393) | ($200) | ($150) | ($22) | $74 | $86 | $199 | $278 | $344 | $490 | $543 | |
| Net Profit | ($1,292) | ($917) | ($468) | ($351) | ($52) | $173 | $201 | $464 | $649 | $802 | $1,143 | $1,267 | |
| Net Profit/Sales | -60.67% | -34.08% | -13.89% | -9.90% | -1.31% | 4.00% | 4.59% | 9.73% | 12.87% | 15.19% | 19.74% | 21.19% | |
| Pro Forma Cash Flow | |||||||||||||
| Month 1 | Month 2 | Month 3 | Month 4 | Month 5 | Month 6 | Month 7 | Month 8 | Month 9 | Month 10 | Month 11 | Month 12 | ||
| Cash Received | |||||||||||||
| Cash from Operations | |||||||||||||
| Cash Sales | $2,129 | $2,692 | $3,368 | $3,544 | $3,993 | $4,332 | $4,373 | $4,769 | $5,048 | $5,277 | $5,790 | $5,976 | |
| Subtotal Cash from Operations | $2,129 | $2,692 | $3,368 | $3,544 | $3,993 | $4,332 | $4,373 | $4,769 | $5,048 | $5,277 | $5,790 | $5,976 | |
| Additional Cash Received | |||||||||||||
| Sales Tax, VAT, HST/GST Received | 0.00% | $0 | $0 | $0 | $0 | $0 | $0 | $0 | $0 | $0 | $0 | $0 | $0 |
| New Current Borrowing | $0 | $0 | $0 | $0 | $0 | $0 | $0 | $0 | $0 | $0 | $0 | $0 | |
| New Other Liabilities (interest-free) | $0 | $0 | $0 | $0 | $0 | $0 | $0 | $0 | $0 | $0 | $0 | $0 | |
| New Long-term Liabilities | $0 | $0 | $0 | $0 | $0 | $0 | $0 | $0 | $0 | $0 | $0 | $0 | |
| Sales of Other Current Assets | $0 | $0 | $0 | $0 | $0 | $0 | $0 | $0 | $0 | $0 | $0 | $0 | |
| Sales of Long-term Assets | $0 | $0 | $0 | $0 | $0 | $0 | $0 | $0 | $0 | $0 | $0 | $0 | |
| New Investment Received | $0 | $0 | $0 | $0 | $0 | $0 | $0 | $0 | $0 | $0 | $0 | $0 | |
| Subtotal Cash Received | $2,129 | $2,692 | $3,368 | $3,544 | $3,993 | $4,332 | $4,373 | $4,769 | $5,048 | $5,277 | $5,790 | $5,976 | |
| Expenditures | Month 1 | Month 2 | Month 3 | Month 4 | Month 5 | Month 6 | Month 7 | Month 8 | Month 9 | Month 10 | Month 11 | Month 12 | |
| Expenditures from Operations | |||||||||||||
| Cash Spending | $3,000 | $3,000 | $3,000 | $3,000 | $3,000 | $3,000 | $3,000 | $3,000 | $3,000 | $3,000 | $3,000 | $3,000 | |
| Bill Payments | $12 | $355 | $545 | $766 | $828 | $977 | $1,087 | $1,105 | $1,236 | $1,329 | $1,409 | $1,577 | |
| Subtotal Spent on Operations | $3,012 | $3,355 | $3,545 | $3,766 | $3,828 | $3,977 | $4,087 | $4,105 | $4,236 | $4,329 | $4,409 | $4,577 | |
| Additional Cash Spent | |||||||||||||
| Sales Tax, VAT, HST/GST Paid Out | $0 | $0 | $0 | $0 | $0 | $0 | $0 | $0 | $0 | $0 | $0 | $0 | |
| Principal Repayment of Current Borrowing | $0 | $0 | $0 | $0 | $0 | $0 | $0 | $0 | $0 | $0 | $0 | $0 | |
| Other Liabilities Principal Repayment | $0 | $0 | $0 | $0 | $0 | $0 | $0 | $0 | $0 | $0 | $0 | $0 | |
| Long-term Liabilities Principal Repayment | $0 | $0 | $0 | $0 | $0 | $0 | $0 | $0 | $0 | $0 | $0 | $0 | |
| Purchase Other Current Assets | $0 | $0 | $0 | $0 | $0 | $0 | $0 | $0 | $0 | $0 | $0 | $0 | |
| Purchase Long-term Assets | $0 | $0 | $0 | $0 | $0 | $0 | $0 | $0 | $0 | $0 | $0 | $0 | |
| Dividends | $0 | $0 | $0 | $0 | $0 | $0 | $0 | $0 | $0 | $0 | $0 | $0 | |
| Subtotal Cash Spent | $3,012 | $3,355 | $3,545 | $3,766 | $3,828 | $3,977 | $4,087 | $4,105 | $4,236 | $4,329 | $4,409 | $4,577 | |
| Net Cash Flow | ($883) | ($663) | ($177) | ($222) | $165 | $355 | $286 | $664 | $812 | $948 | $1,381 | $1,399 | |
| Cash Balance | $5,217 | $4,554 | $4,378 | $4,156 | $4,321 | $4,676 | $4,962 | $5,626 | $6,438 | $7,386 | $8,767 | $10,166 | |
| Pro Forma Balance Sheet | |||||||||||||
| Month 1 | Month 2 | Month 3 | Month 4 | Month 5 | Month 6 | Month 7 | Month 8 | Month 9 | Month 10 | Month 11 | Month 12 | ||
| Assets | Starting Balances | ||||||||||||
| Current Assets | |||||||||||||
| Cash | $6,100 | $5,217 | $4,554 | $4,378 | $4,156 | $4,321 | $4,676 | $4,962 | $5,626 | $6,438 | $7,386 | $8,767 | $10,166 |
| Other Current Assets | $0 | $0 | $0 | $0 | $0 | $0 | $0 | $0 | $0 | $0 | $0 | $0 | $0 |
| Total Current Assets | $6,100 | $5,217 | $4,554 | $4,378 | $4,156 | $4,321 | $4,676 | $4,962 | $5,626 | $6,438 | $7,386 | $8,767 | $10,166 |
| Long-term Assets | |||||||||||||
| Long-term Assets | $4,300 | $4,300 | $4,300 | $4,300 | $4,300 | $4,300 | $4,300 | $4,300 | $4,300 | $4,300 | $4,300 | $4,300 | $4,300 |
| Accumulated Depreciation | $0 | $72 | $144 | $216 | $288 | $360 | $432 | $504 | $576 | $648 | $720 | $792 | $864 |
| Total Long-term Assets | $4,300 | $4,228 | $4,156 | $4,084 | $4,012 | $3,940 | $3,868 | $3,796 | $3,724 | $3,652 | $3,580 | $3,508 | $3,436 |
| Total Assets | $10,400 | $9,445 | $8,710 | $8,462 | $8,168 | $8,261 | $8,544 | $8,758 | $9,350 | $10,090 | $10,966 | $12,275 | $13,602 |
| Liabilities and Capital | Month 1 | Month 2 | Month 3 | Month 4 | Month 5 | Month 6 | Month 7 | Month 8 | Month 9 | Month 10 | Month 11 | Month 12 | |
| Current Liabilities | |||||||||||||
| Accounts Payable | $0 | $337 | $519 | $738 | $795 | $941 | $1,050 | $1,064 | $1,192 | $1,282 | $1,357 | $1,523 | $1,583 |
| Current Borrowing | $2,500 | $2,500 | $2,500 | $2,500 | $2,500 | $2,500 | $2,500 | $2,500 | $2,500 | $2,500 | $2,500 | $2,500 | $2,500 |
| Other Current Liabilities | $0 | $0 | $0 | $0 | $0 | $0 | $0 | $0 | $0 | $0 | $0 | $0 | $0 |
| Subtotal Current Liabilities | $2,500 | $2,837 | $3,019 | $3,238 | $3,295 | $3,441 | $3,550 | $3,564 | $3,692 | $3,782 | $3,857 | $4,023 | $4,083 |
| Long-term Liabilities | $0 | $0 | $0 | $0 | $0 | $0 | $0 | $0 | $0 | $0 | $0 | $0 | $0 |
| Total Liabilities | $2,500 | $2,837 | $3,019 | $3,238 | $3,295 | $3,441 | $3,550 | $3,564 | $3,692 | $3,782 | $3,857 | $4,023 | $4,083 |
| Paid-in Capital | $10,000 | $10,000 | $10,000 | $10,000 | $10,000 | $10,000 | $10,000 | $10,000 | $10,000 | $10,000 | $10,000 | $10,000 | $10,000 |
| Retained Earnings | ($2,100) | ($2,100) | ($2,100) | ($2,100) | ($2,100) | ($2,100) | ($2,100) | ($2,100) | ($2,100) | ($2,100) | ($2,100) | ($2,100) | ($2,100) |
| Earnings | $0 | ($1,292) | ($2,209) | ($2,677) | ($3,027) | ($3,080) | ($2,906) | ($2,706) | ($2,242) | ($1,592) | ($791) | $352 | $1,619 |
| Total Capital | $7,900 | $6,608 | $5,691 | $5,223 | $4,873 | $4,820 | $4,994 | $5,194 | $5,658 | $6,308 | $7,109 | $8,252 | $9,519 |
| Total Liabilities and Capital | $10,400 | $9,445 | $8,710 | $8,462 | $8,168 | $8,261 | $8,544 | $8,758 | $9,350 | $10,090 | $10,966 | $12,275 | $13,602 |
| Net Worth | $7,900 | $6,608 | $5,691 | $5,223 | $4,873 | $4,820 | $4,994 | $5,194 | $5,658 | $6,308 | $7,109 | $8,252 | $9,519 |

