
Miles Garden Carpentry
Executive Summary
Miles Garden Carpentry tailors solutions to customer’s garden carpentry needs. Our goal is to provide an end product that is unique to the customer’s requirements.
Miles Garden Carpentry will focus on the residential construction boom in the Evansville Old Town section. The city has been growing by 10% annually for the past 10 years. With the population now at 1. 3 million, the new construction in the Old Town section of the city is valued at $400 million in home sales next year alone.
Currently, Miles Garden Carpentry is a subcontractor with Bentwood Custom Homes, Greenridge Homes, and Landmark Homes to provide garden carpentry services to their new homes in the area. From this base, Miles Garden Carpentry will market its services to homeowners in the Old Town area.
The current population of the city’s Old Town area is 120,000 with an average income of $100,000. Miles Garden Carpentry is well positioned to capture a lion’s share of the garden carpentry business in this growing residential area.

1.1 Objectives
The objectives of Miles Garden Carpentry are:
- Capture the majority of the garden carpentry business in the Old Town area.
- Offer our customers a superior service, at a low price.
1.2 Mission
The mission of Miles Garden Carpentry is to become the primary resource for residential garden carpentry in the Old Town area.
1.3 Keys to Success
The keys to success for Miles Garden Carpentry are:
- Customer referrals of neighbors and friends.
- Exceeding the customer’s expectation for quality, timeliness and price.
Company Summary
Miles Garden Carpentry tailors solutions to customer’s garden carpentry needs. Our goal is to provide an end product that is unique to the customer’s requirements.
Miles Garden Carpentry will focus on the residential construction boom in the Evansville Old Town section. The city has been growing by 10% annually for the past 10 years. With the population now at 1. 3 million, the new construction in the Old Town section of the city is valued at $400 million in home sales next year alone.
Currently, Miles Garden Carpentry is a subcontractor with Bentwood Custom Homes, Greenridge Homes, and Landmark Homes to provide garden carpentry services to their new homes in the area. From this base, Miles Garden Carpentry will market its services to homeowners in the Old Town area.
The current population of the city’s Old Town area is 120,000 with an average income of $100,000. Miles Garden Carpentry is well positioned to capture a lion’s share of the garden carpentry business in this growing residential area.
1.1 Objectives
The objectives of Miles Garden Carpentry are:
- Capture the majority of the garden carpentry business in the Old Town area.
- Offer our customers a superior service, at a low price.
1.2 Mission
The mission of Miles Garden Carpentry is to become the primary resource for residential garden carpentry in the Old Town area.
1.3 Keys to Success
The keys to success for Miles Garden Carpentry are:
- Customer referrals of neighbors and friends.
- Exceeding the customer’s expectation for quality, timeliness and price.
Services
Miles Garden Carpentry tailors solutions to customer’s garden expectation needs. From a single window box, a row of Versailles-style containers, to a full purpose wooden decking scheme. Our dedicated carpentry service can manufacture and install every type of exterior carpentry project.
Miles Garden Carpentry’s goal is to provide an end product that is unique to the customer’s requirements. The containers, trellis and decking can be manufactured to fit any space, however complicated. Our trellis panels and containers can be built to specific, historical, or an existing design theme within the customer’s garden, the paint or wood stain can be matched to existing garden woodwork or house color schemes.
Market Analysis Summary
The city has been growing by 15% annually for the past 10 years. With the population now at 1. 3 million, the new construction in the Old Town section of the city is valued at $400 million in home sales next year alone.
Currently, Miles Garden Carpentry is a subcontractor with Bentwood Custom Homes, Greenridge Homes, and Landmark Homes to provide garden carpentry services to their new homes in the area. From this base, Miles Garden Carpentry will market its services to homeowners in the Old Town area.
New construction represents an important customer group for Miles Garden Carpentry. The other significant customer group is comprised of the existing home owners in the Old Town area. The revitalization of the area has generated increase remodeling of existing homes. Last year, remodeling projects were up 20% over the previous year and accounted for $15 million paid for remodeling services in the area.
4.1 Market Segmentation
Miles Garden Carpentry will focus on two significant customer groups:
- New home construction.
- Remodeling projects.

| Market Analysis | |||||||
| Year 1 | Year 2 | Year 3 | Year 4 | Year 5 | |||
| Potential Customers | Growth | CAGR | |||||
| New Home Construction | 7% | 2,000 | 2,140 | 2,290 | 2,450 | 2,622 | 7.00% |
| Remodeling Projects | 5% | 3,000 | 3,150 | 3,308 | 3,473 | 3,647 | 5.00% |
| Total | 5.82% | 5,000 | 5,290 | 5,598 | 5,923 | 6,269 | 5.82% |
4.2 Service Business Analysis
The market for garden carpentry contracting services is very fragmented and specialized. Among these, only a few are competing for work in the Old Town area. These are small businesses with less than two full-time employees. Miles Garden Carpentry’s current niche is its strong relationship with Bentwood Custom Homes, Greenridge Homes, and Landmark Homes. But this will not be sufficient for growth in a competitive market.
By focusing on creative integrated wooden decking schemes that can be manufactured to fit any space, Miles Garden Carpentry reduces its direct competitors to two small deck construction firms. Neither competitor has Joan’s relationship with the area’s home builders.
Strategy and Implementation Summary
Miles Garden Carpentry’s strategy is simple and ambitious. First, build its base with new home construction that is planned in the Old Town area. From this secure footing, Joan will begin to market her specialization skills to new customers. Miles Garden Carpentry is uniquely positioned to successfully market its services to women in the area. Women are the most significant customer group for garden carpentry services. Currently, Miles Garden Carpentry is the only woman-owned construction firm in the Old Town area.
5.1 Competitive Edge
Joan Miles’ reputation for quality work and excellent customer skills has been a hallmark of her work history in construction. Starting her own company is just another step in her quest to deliver services to customers that were second to none. As a woman in the male-dominated construction profession, it has always been Joan’s competitive edge that has pushed her ahead with customers and employers. Her focus on creative integrated deck schemes now places her in a unique situation. Many of the new homes in the Old Town area will demand garden carpentry services. Joan’s history of project successes has made her a valuable resource to the area’s builders.
5.2 Sales Forecast
The first three months of operation will focus on projects with new home construction. Miles Garden Carpentry will then turn to marketing to new customers. The following table will outline Miles Garden Carpentry sales forecast data.


| Sales Forecast | |||
| Year 1 | Year 2 | Year 3 | |
| Sales | |||
| New Home Construction | $248,000 | $280,000 | $320,000 |
| Remodeling Projects | $63,000 | $90,000 | $108,000 |
| Total Sales | $311,000 | $370,000 | $428,000 |
| Direct Cost of Sales | Year 1 | Year 2 | Year 3 |
| New Home Construction | $68,600 | $80,000 | $92,000 |
| Remodeling Projects | $18,400 | $30,000 | $33,000 |
| Subtotal Direct Cost of Sales | $87,000 | $110,000 | $125,000 |

Management Summary
Miles Garden Carpentry will be managed by Joan Miles. Joan is a talented professional who holds a Bachelor of Arts degree from Western College in Art that she obtained while working full-time in the construction field. Joan entered the world of construction in 1981 as a means to pay for her education. She quickly gained a reputation for quality and creative work. She started her apprenticeship and early training as an carpenter soon after graduation in 1984. She later relocated to the forecast area in 1992 and has worked exclusively in garden carpentry for the past nine years.
She has worked for Hohner Construction and Miller’s Fine Homes and has created a base of customer support that praise her ability to handle all aspects and responsibilities of the garden carpentry design and construction process.
6.1 Personnel Plan
Miles Garden Carpentry will have a staff of four.
| Personnel Plan | |||
| Year 1 | Year 2 | Year 3 | |
| Joan Miles | $30,000 | $34,000 | $42,000 |
| Garden Carpentry Staff (3) | $90,000 | $102,000 | $124,000 |
| Other | $0 | $0 | $0 |
| Total People | 0 | 0 | 0 |
| Total Payroll | $120,000 | $136,000 | $166,000 |
Financial Plan
The following is the financial plan for Miles Garden Carpentry.
7.1 Break-even Analysis
The monthly break-even point is calculated in the table and chart below.

| Break-even Analysis | |
| Monthly Revenue Break-even | $20,211 |
| Assumptions: | |
| Average Percent Variable Cost | 28% |
| Estimated Monthly Fixed Cost | $14,557 |
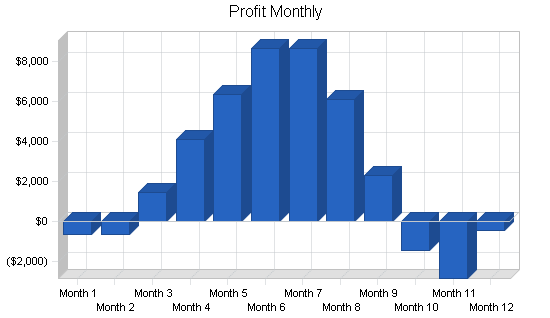
7.2 Projected Profit and Loss
The following table and charts highlight the projected profit and loss for three years.


| Pro Forma Profit and Loss | |||
| Year 1 | Year 2 | Year 3 | |
| Sales | $311,000 | $370,000 | $428,000 |
| Direct Cost of Sales | $87,000 | $110,000 | $125,000 |
| Other Production Expenses | $0 | $0 | $0 |
| Total Cost of Sales | $87,000 | $110,000 | $125,000 |
| Gross Margin | $224,000 | $260,000 | $303,000 |
| Gross Margin % | 72.03% | 70.27% | 70.79% |
| Expenses | |||
| Payroll | $120,000 | $136,000 | $166,000 |
| Sales and Marketing and Other Expenses | $18,000 | $23,000 | $28,000 |
| Depreciation | $4,284 | $4,284 | $4,284 |
| Leased Equipment | $0 | $0 | $0 |
| Utilities | $2,400 | $2,400 | $2,400 |
| Insurance | $0 | $0 | $0 |
| Rent | $12,000 | $12,000 | $12,000 |
| Payroll Taxes | $18,000 | $20,400 | $24,900 |
| Other | $0 | $0 | $0 |
| Total Operating Expenses | $174,684 | $198,084 | $237,584 |
| Profit Before Interest and Taxes | $49,316 | $61,916 | $65,416 |
| EBITDA | $53,600 | $66,200 | $69,700 |
| Interest Expense | $4,459 | $3,501 | $2,501 |
| Taxes Incurred | $13,457 | $17,525 | $18,875 |
| Net Profit | $31,400 | $40,891 | $44,041 |
| Net Profit/Sales | 10.10% | 11.05% | 10.29% |
7.3 Projected Cash Flow
The following is the projected cash flow for three years.

| Pro Forma Cash Flow | |||
| Year 1 | Year 2 | Year 3 | |
| Cash Received | |||
| Cash from Operations | |||
| Cash Sales | $311,000 | $370,000 | $428,000 |
| Subtotal Cash from Operations | $311,000 | $370,000 | $428,000 |
| Additional Cash Received | |||
| Sales Tax, VAT, HST/GST Received | $0 | $0 | $0 |
| New Current Borrowing | $0 | $0 | $0 |
| New Other Liabilities (interest-free) | $0 | $0 | $0 |
| New Long-term Liabilities | $0 | $0 | $0 |
| Sales of Other Current Assets | $0 | $0 | $0 |
| Sales of Long-term Assets | $0 | $0 | $0 |
| New Investment Received | $0 | $0 | $0 |
| Subtotal Cash Received | $311,000 | $370,000 | $428,000 |
| Expenditures | Year 1 | Year 2 | Year 3 |
| Expenditures from Operations | |||
| Cash Spending | $120,000 | $136,000 | $166,000 |
| Bill Payments | $145,527 | $183,094 | $211,633 |
| Subtotal Spent on Operations | $265,527 | $319,094 | $377,633 |
| Additional Cash Spent | |||
| Sales Tax, VAT, HST/GST Paid Out | $0 | $0 | $0 |
| Principal Repayment of Current Borrowing | $0 | $0 | $0 |
| Other Liabilities Principal Repayment | $0 | $0 | $0 |
| Long-term Liabilities Principal Repayment | $9,996 | $9,996 | $9,996 |
| Purchase Other Current Assets | $0 | $0 | $0 |
| Purchase Long-term Assets | $0 | $0 | $0 |
| Dividends | $0 | $0 | $0 |
| Subtotal Cash Spent | $275,523 | $329,090 | $387,629 |
| Net Cash Flow | $35,477 | $40,910 | $40,371 |
| Cash Balance | $48,177 | $89,087 | $129,458 |
7.4 Projected Balance Sheet
The following is the projected balance sheet for three years.
| Pro Forma Balance Sheet | |||
| Year 1 | Year 2 | Year 3 | |
| Assets | |||
| Current Assets | |||
| Cash | $48,177 | $89,087 | $129,458 |
| Other Current Assets | $0 | $0 | $0 |
| Total Current Assets | $48,177 | $89,087 | $129,458 |
| Long-term Assets | |||
| Long-term Assets | $35,000 | $35,000 | $35,000 |
| Accumulated Depreciation | $4,284 | $8,568 | $12,852 |
| Total Long-term Assets | $30,716 | $26,432 | $22,148 |
| Total Assets | $78,893 | $115,519 | $151,606 |
| Liabilities and Capital | Year 1 | Year 2 | Year 3 |
| Current Liabilities | |||
| Accounts Payable | $9,789 | $15,520 | $17,562 |
| Current Borrowing | $0 | $0 | $0 |
| Other Current Liabilities | $0 | $0 | $0 |
| Subtotal Current Liabilities | $9,789 | $15,520 | $17,562 |
| Long-term Liabilities | $40,004 | $30,008 | $20,012 |
| Total Liabilities | $49,793 | $45,528 | $37,574 |
| Paid-in Capital | $60,000 | $60,000 | $60,000 |
| Retained Earnings | ($62,300) | ($30,900) | $9,991 |
| Earnings | $31,400 | $40,891 | $44,041 |
| Total Capital | $29,100 | $69,991 | $114,031 |
| Total Liabilities and Capital | $78,893 | $115,519 | $151,606 |
| Net Worth | $29,100 | $69,991 | $114,031 |
7.5 Business Ratios
Business ratios for the years of this plan are shown below. Industry profile ratios based on the Standard Industrial Classification (SIC) code 1751, Carpentry Work, are shown for comparison.
| Ratio Analysis | ||||
| Year 1 | Year 2 | Year 3 | Industry Profile | |
| Sales Growth | 0.00% | 18.97% | 15.68% | 7.90% |
| Percent of Total Assets | ||||
| Other Current Assets | 0.00% | 0.00% | 0.00% | 30.30% |
| Total Current Assets | 61.07% | 77.12% | 85.39% | 71.50% |
| Long-term Assets | 38.93% | 22.88% | 14.61% | 28.50% |
| Total Assets | 100.00% | 100.00% | 100.00% | 100.00% |
| Current Liabilities | 12.41% | 13.43% | 11.58% | 42.70% |
| Long-term Liabilities | 50.71% | 25.98% | 13.20% | 14.30% |
| Total Liabilities | 63.11% | 39.41% | 24.78% | 57.00% |
| Net Worth | 36.89% | 60.59% | 75.22% | 43.00% |
| Percent of Sales | ||||
| Sales | 100.00% | 100.00% | 100.00% | 100.00% |
| Gross Margin | 72.03% | 70.27% | 70.79% | 31.60% |
| Selling, General & Administrative Expenses | 61.93% | 59.22% | 60.50% | 16.70% |
| Advertising Expenses | 3.86% | 4.05% | 4.21% | 0.50% |
| Profit Before Interest and Taxes | 15.86% | 16.73% | 15.28% | 3.40% |
| Main Ratios | ||||
| Current | 4.92 | 5.74 | 7.37 | 1.64 |
| Quick | 4.92 | 5.74 | 7.37 | 1.28 |
| Total Debt to Total Assets | 63.11% | 39.41% | 24.78% | 57.00% |
| Pre-tax Return on Net Worth | 154.15% | 83.46% | 55.17% | 7.50% |
| Pre-tax Return on Assets | 56.86% | 50.57% | 41.50% | 17.40% |
| Additional Ratios | Year 1 | Year 2 | Year 3 | |
| Net Profit Margin | 10.10% | 11.05% | 10.29% | n.a |
| Return on Equity | 107.90% | 58.42% | 38.62% | n.a |
| Activity Ratios | ||||
| Accounts Payable Turnover | 15.87 | 12.17 | 12.17 | n.a |
| Payment Days | 27 | 24 | 28 | n.a |
| Total Asset Turnover | 3.94 | 3.20 | 2.82 | n.a |
| Debt Ratios | ||||
| Debt to Net Worth | 1.71 | 0.65 | 0.33 | n.a |
| Current Liab. to Liab. | 0.20 | 0.34 | 0.47 | n.a |
| Liquidity Ratios | ||||
| Net Working Capital | $38,388 | $73,567 | $111,895 | n.a |
| Interest Coverage | 11.06 | 17.69 | 26.16 | n.a |
| Additional Ratios | ||||
| Assets to Sales | 0.25 | 0.31 | 0.35 | n.a |
| Current Debt/Total Assets | 12% | 13% | 12% | n.a |
| Acid Test | 4.92 | 5.74 | 7.37 | n.a |
| Sales/Net Worth | 10.69 | 5.29 | 3.75 | n.a |
| Dividend Payout | 0.00 | 0.00 | 0.00 | n.a |
Appendix
| Sales Forecast | |||||||||||||
| Month 1 | Month 2 | Month 3 | Month 4 | Month 5 | Month 6 | Month 7 | Month 8 | Month 9 | Month 10 | Month 11 | Month 12 | ||
| Sales | |||||||||||||
| New Home Construction | 0% | $19,000 | $19,000 | $19,000 | $23,000 | $27,000 | $30,000 | $29,000 | $24,000 | $19,000 | $14,000 | $11,000 | $14,000 |
| Remodeling Projects | 0% | $0 | $0 | $4,000 | $6,000 | $7,000 | $9,000 | $9,000 | $8,000 | $6,000 | $4,000 | $4,000 | $6,000 |
| Total Sales | $19,000 | $19,000 | $23,000 | $29,000 | $34,000 | $39,000 | $38,000 | $32,000 | $25,000 | $18,000 | $15,000 | $20,000 | |
| Direct Cost of Sales | Month 1 | Month 2 | Month 3 | Month 4 | Month 5 | Month 6 | Month 7 | Month 8 | Month 9 | Month 10 | Month 11 | Month 12 | |
| New Home Construction | $5,000 | $5,000 | $5,000 | $6,400 | $7,800 | $9,000 | $8,000 | $6,400 | $5,000 | $4,000 | $3,000 | $4,000 | |
| Remodeling Projects | $0 | $0 | $1,000 | $1,800 | $2,200 | $2,700 | $2,700 | $2,000 | $1,800 | $1,200 | $1,200 | $1,800 | |
| Subtotal Direct Cost of Sales | $5,000 | $5,000 | $6,000 | $8,200 | $10,000 | $11,700 | $10,700 | $8,400 | $6,800 | $5,200 | $4,200 | $5,800 | |
| Personnel Plan | |||||||||||||
| Month 1 | Month 2 | Month 3 | Month 4 | Month 5 | Month 6 | Month 7 | Month 8 | Month 9 | Month 10 | Month 11 | Month 12 | ||
| Joan Miles | 0% | $2,500 | $2,500 | $2,500 | $2,500 | $2,500 | $2,500 | $2,500 | $2,500 | $2,500 | $2,500 | $2,500 | $2,500 |
| Garden Carpentry Staff (3) | 0% | $7,500 | $7,500 | $7,500 | $7,500 | $7,500 | $7,500 | $7,500 | $7,500 | $7,500 | $7,500 | $7,500 | $7,500 |
| Other | 0% | $0 | $0 | $0 | $0 | $0 | $0 | $0 | $0 | $0 | $0 | $0 | $0 |
| Total People | 0 | 0 | 0 | 0 | 0 | 0 | 0 | 0 | 0 | 0 | 0 | 0 | |
| Total Payroll | $10,000 | $10,000 | $10,000 | $10,000 | $10,000 | $10,000 | $10,000 | $10,000 | $10,000 | $10,000 | $10,000 | $10,000 | |
| General Assumptions | |||||||||||||
| Month 1 | Month 2 | Month 3 | Month 4 | Month 5 | Month 6 | Month 7 | Month 8 | Month 9 | Month 10 | Month 11 | Month 12 | ||
| Plan Month | 1 | 2 | 3 | 4 | 5 | 6 | 7 | 8 | 9 | 10 | 11 | 12 | |
| Current Interest Rate | 10.00% | 10.00% | 10.00% | 10.00% | 10.00% | 10.00% | 10.00% | 10.00% | 10.00% | 10.00% | 10.00% | 10.00% | |
| Long-term Interest Rate | 10.00% | 10.00% | 10.00% | 10.00% | 10.00% | 10.00% | 10.00% | 10.00% | 10.00% | 10.00% | 10.00% | 10.00% | |
| Tax Rate | 30.00% | 30.00% | 30.00% | 30.00% | 30.00% | 30.00% | 30.00% | 30.00% | 30.00% | 30.00% | 30.00% | 30.00% | |
| Other | 0 | 0 | 0 | 0 | 0 | 0 | 0 | 0 | 0 | 0 | 0 | 0 | |
| Pro Forma Profit and Loss | |||||||||||||
| Month 1 | Month 2 | Month 3 | Month 4 | Month 5 | Month 6 | Month 7 | Month 8 | Month 9 | Month 10 | Month 11 | Month 12 | ||
| Sales | $19,000 | $19,000 | $23,000 | $29,000 | $34,000 | $39,000 | $38,000 | $32,000 | $25,000 | $18,000 | $15,000 | $20,000 | |
| Direct Cost of Sales | $5,000 | $5,000 | $6,000 | $8,200 | $10,000 | $11,700 | $10,700 | $8,400 | $6,800 | $5,200 | $4,200 | $5,800 | |
| Other Production Expenses | $0 | $0 | $0 | $0 | $0 | $0 | $0 | $0 | $0 | $0 | $0 | $0 | |
| Total Cost of Sales | $5,000 | $5,000 | $6,000 | $8,200 | $10,000 | $11,700 | $10,700 | $8,400 | $6,800 | $5,200 | $4,200 | $5,800 | |
| Gross Margin | $14,000 | $14,000 | $17,000 | $20,800 | $24,000 | $27,300 | $27,300 | $23,600 | $18,200 | $12,800 | $10,800 | $14,200 | |
| Gross Margin % | 73.68% | 73.68% | 73.91% | 71.72% | 70.59% | 70.00% | 71.84% | 73.75% | 72.80% | 71.11% | 72.00% | 71.00% | |
| Expenses | |||||||||||||
| Payroll | $10,000 | $10,000 | $10,000 | $10,000 | $10,000 | $10,000 | $10,000 | $10,000 | $10,000 | $10,000 | $10,000 | $10,000 | |
| Sales and Marketing and Other Expenses | $1,500 | $1,500 | $1,500 | $1,500 | $1,500 | $1,500 | $1,500 | $1,500 | $1,500 | $1,500 | $1,500 | $1,500 | |
| Depreciation | $357 | $357 | $357 | $357 | $357 | $357 | $357 | $357 | $357 | $357 | $357 | $357 | |
| Leased Equipment | $0 | $0 | $0 | $0 | $0 | $0 | $0 | $0 | $0 | $0 | $0 | $0 | |
| Utilities | $200 | $200 | $200 | $200 | $200 | $200 | $200 | $200 | $200 | $200 | $200 | $200 | |
| Insurance | $0 | $0 | $0 | $0 | $0 | $0 | $0 | $0 | $0 | $0 | $0 | $0 | |
| Rent | $1,000 | $1,000 | $1,000 | $1,000 | $1,000 | $1,000 | $1,000 | $1,000 | $1,000 | $1,000 | $1,000 | $1,000 | |
| Payroll Taxes | 15% | $1,500 | $1,500 | $1,500 | $1,500 | $1,500 | $1,500 | $1,500 | $1,500 | $1,500 | $1,500 | $1,500 | $1,500 |
| Other | $0 | $0 | $0 | $0 | $0 | $0 | $0 | $0 | $0 | $0 | $0 | $0 | |
| Total Operating Expenses | $14,557 | $14,557 | $14,557 | $14,557 | $14,557 | $14,557 | $14,557 | $14,557 | $14,557 | $14,557 | $14,557 | $14,557 | |
| Profit Before Interest and Taxes | ($557) | ($557) | $2,443 | $6,243 | $9,443 | $12,743 | $12,743 | $9,043 | $3,643 | ($1,757) | ($3,757) | ($357) | |
| EBITDA | ($200) | ($200) | $2,800 | $6,600 | $9,800 | $13,100 | $13,100 | $9,400 | $4,000 | ($1,400) | ($3,400) | $0 | |
| Interest Expense | $410 | $403 | $396 | $389 | $382 | $375 | $368 | $361 | $354 | $347 | $340 | $333 | |
| Taxes Incurred | ($290) | ($288) | $614 | $1,756 | $2,718 | $3,710 | $3,712 | $2,605 | $987 | ($631) | ($1,229) | ($207) | |
| Net Profit | ($677) | ($672) | $1,433 | $4,098 | $6,343 | $8,658 | $8,662 | $6,077 | $2,302 | ($1,473) | ($2,868) | ($483) | |
| Net Profit/Sales | -3.56% | -3.54% | 6.23% | 14.13% | 18.66% | 22.20% | 22.80% | 18.99% | 9.21% | -8.18% | -19.12% | -2.42% | |
| Pro Forma Cash Flow | |||||||||||||
| Month 1 | Month 2 | Month 3 | Month 4 | Month 5 | Month 6 | Month 7 | Month 8 | Month 9 | Month 10 | Month 11 | Month 12 | ||
| Cash Received | |||||||||||||
| Cash from Operations | |||||||||||||
| Cash Sales | $19,000 | $19,000 | $23,000 | $29,000 | $34,000 | $39,000 | $38,000 | $32,000 | $25,000 | $18,000 | $15,000 | $20,000 | |
| Subtotal Cash from Operations | $19,000 | $19,000 | $23,000 | $29,000 | $34,000 | $39,000 | $38,000 | $32,000 | $25,000 | $18,000 | $15,000 | $20,000 | |
| Additional Cash Received | |||||||||||||
| Sales Tax, VAT, HST/GST Received | 0.00% | $0 | $0 | $0 | $0 | $0 | $0 | $0 | $0 | $0 | $0 | $0 | $0 |
| New Current Borrowing | $0 | $0 | $0 | $0 | $0 | $0 | $0 | $0 | $0 | $0 | $0 | $0 | |
| New Other Liabilities (interest-free) | $0 | $0 | $0 | $0 | $0 | $0 | $0 | $0 | $0 | $0 | $0 | $0 | |
| New Long-term Liabilities | $0 | $0 | $0 | $0 | $0 | $0 | $0 | $0 | $0 | $0 | $0 | $0 | |
| Sales of Other Current Assets | $0 | $0 | $0 | $0 | $0 | $0 | $0 | $0 | $0 | $0 | $0 | $0 | |
| Sales of Long-term Assets | $0 | $0 | $0 | $0 | $0 | $0 | $0 | $0 | $0 | $0 | $0 | $0 | |
| New Investment Received | $0 | $0 | $0 | $0 | $0 | $0 | $0 | $0 | $0 | $0 | $0 | $0 | |
| Subtotal Cash Received | $19,000 | $19,000 | $23,000 | $29,000 | $34,000 | $39,000 | $38,000 | $32,000 | $25,000 | $18,000 | $15,000 | $20,000 | |
| Expenditures | Month 1 | Month 2 | Month 3 | Month 4 | Month 5 | Month 6 | Month 7 | Month 8 | Month 9 | Month 10 | Month 11 | Month 12 | |
| Expenditures from Operations | |||||||||||||
| Cash Spending | $10,000 | $10,000 | $10,000 | $10,000 | $10,000 | $10,000 | $10,000 | $10,000 | $10,000 | $10,000 | $10,000 | $10,000 | |
| Bill Payments | $311 | $9,320 | $9,378 | $11,321 | $14,637 | $17,390 | $19,952 | $18,867 | $15,458 | $12,233 | $9,062 | $7,598 | |
| Subtotal Spent on Operations | $10,311 | $19,320 | $19,378 | $21,321 | $24,637 | $27,390 | $29,952 | $28,867 | $25,458 | $22,233 | $19,062 | $17,598 | |
| Additional Cash Spent | |||||||||||||
| Sales Tax, VAT, HST/GST Paid Out | $0 | $0 | $0 | $0 | $0 | $0 | $0 | $0 | $0 | $0 | $0 | $0 | |
| Principal Repayment of Current Borrowing | $0 | $0 | $0 | $0 | $0 | $0 | $0 | $0 | $0 | $0 | $0 | $0 | |
| Other Liabilities Principal Repayment | $0 | $0 | $0 | $0 | $0 | $0 | $0 | $0 | $0 | $0 | $0 | $0 | |
| Long-term Liabilities Principal Repayment | $833 | $833 | $833 | $833 | $833 | $833 | $833 | $833 | $833 | $833 | $833 | $833 | |
| Purchase Other Current Assets | $0 | $0 | $0 | $0 | $0 | $0 | $0 | $0 | $0 | $0 | $0 | $0 | |
| Purchase Long-term Assets | $0 | $0 | $0 | $0 | $0 | $0 | $0 | $0 | $0 | $0 | $0 | $0 | |
| Dividends | $0 | $0 | $0 | $0 | $0 | $0 | $0 | $0 | $0 | $0 | $0 | $0 | |
| Subtotal Cash Spent | $11,144 | $20,153 | $20,211 | $22,154 | $25,470 | $28,223 | $30,785 | $29,700 | $26,291 | $23,066 | $19,895 | $18,431 | |
| Net Cash Flow | $7,856 | ($1,153) | $2,789 | $6,846 | $8,530 | $10,777 | $7,215 | $2,300 | ($1,291) | ($5,066) | ($4,895) | $1,569 | |
| Cash Balance | $20,556 | $19,404 | $22,193 | $29,039 | $37,569 | $48,346 | $55,561 | $57,861 | $56,570 | $51,504 | $46,608 | $48,177 | |
| Pro Forma Balance Sheet | |||||||||||||
| Month 1 | Month 2 | Month 3 | Month 4 | Month 5 | Month 6 | Month 7 | Month 8 | Month 9 | Month 10 | Month 11 | Month 12 | ||
| Assets | Starting Balances | ||||||||||||
| Current Assets | |||||||||||||
| Cash | $12,700 | $20,556 | $19,404 | $22,193 | $29,039 | $37,569 | $48,346 | $55,561 | $57,861 | $56,570 | $51,504 | $46,608 | $48,177 |
| Other Current Assets | $0 | $0 | $0 | $0 | $0 | $0 | $0 | $0 | $0 | $0 | $0 | $0 | $0 |
| Total Current Assets | $12,700 | $20,556 | $19,404 | $22,193 | $29,039 | $37,569 | $48,346 | $55,561 | $57,861 | $56,570 | $51,504 | $46,608 | $48,177 |
| Long-term Assets | |||||||||||||
| Long-term Assets | $35,000 | $35,000 | $35,000 | $35,000 | $35,000 | $35,000 | $35,000 | $35,000 | $35,000 | $35,000 | $35,000 | $35,000 | $35,000 |
| Accumulated Depreciation | $0 | $357 | $714 | $1,071 | $1,428 | $1,785 | $2,142 | $2,499 | $2,856 | $3,213 | $3,570 | $3,927 | $4,284 |
| Total Long-term Assets | $35,000 | $34,643 | $34,286 | $33,929 | $33,572 | $33,215 | $32,858 | $32,501 | $32,144 | $31,787 | $31,430 | $31,073 | $30,716 |
| Total Assets | $47,700 | $55,199 | $53,690 | $56,122 | $62,611 | $70,784 | $81,204 | $88,062 | $90,005 | $88,357 | $82,934 | $77,681 | $78,893 |
| Liabilities and Capital | Month 1 | Month 2 | Month 3 | Month 4 | Month 5 | Month 6 | Month 7 | Month 8 | Month 9 | Month 10 | Month 11 | Month 12 | |
| Current Liabilities | |||||||||||||
| Accounts Payable | $0 | $9,009 | $9,004 | $10,836 | $14,060 | $16,724 | $19,319 | $18,348 | $15,047 | $11,929 | $8,812 | $7,261 | $9,789 |
| Current Borrowing | $0 | $0 | $0 | $0 | $0 | $0 | $0 | $0 | $0 | $0 | $0 | $0 | $0 |
| Other Current Liabilities | $0 | $0 | $0 | $0 | $0 | $0 | $0 | $0 | $0 | $0 | $0 | $0 | $0 |
| Subtotal Current Liabilities | $0 | $9,009 | $9,004 | $10,836 | $14,060 | $16,724 | $19,319 | $18,348 | $15,047 | $11,929 | $8,812 | $7,261 | $9,789 |
| Long-term Liabilities | $50,000 | $49,167 | $48,334 | $47,501 | $46,668 | $45,835 | $45,002 | $44,169 | $43,336 | $42,503 | $41,670 | $40,837 | $40,004 |
| Total Liabilities | $50,000 | $58,176 | $57,338 | $58,337 | $60,728 | $62,559 | $64,321 | $62,517 | $58,383 | $54,432 | $50,482 | $48,098 | $49,793 |
| Paid-in Capital | $60,000 | $60,000 | $60,000 | $60,000 | $60,000 | $60,000 | $60,000 | $60,000 | $60,000 | $60,000 | $60,000 | $60,000 | $60,000 |
| Retained Earnings | ($62,300) | ($62,300) | ($62,300) | ($62,300) | ($62,300) | ($62,300) | ($62,300) | ($62,300) | ($62,300) | ($62,300) | ($62,300) | ($62,300) | ($62,300) |
| Earnings | $0 | ($677) | ($1,349) | $84 | $4,182 | $10,525 | $19,183 | $27,845 | $33,922 | $36,225 | $34,752 | $31,883 | $31,400 |
| Total Capital | ($2,300) | ($2,977) | ($3,649) | ($2,216) | $1,882 | $8,225 | $16,883 | $25,545 | $31,622 | $33,925 | $32,452 | $29,583 | $29,100 |
| Total Liabilities and Capital | $47,700 | $55,199 | $53,690 | $56,122 | $62,611 | $70,784 | $81,204 | $88,062 | $90,005 | $88,357 | $82,934 | $77,681 | $78,893 |
| Net Worth | ($2,300) | ($2,977) | ($3,649) | ($2,216) | $1,882 | $8,225 | $16,883 | $25,545 | $31,622 | $33,925 | $32,452 | $29,583 | $29,100 |


