
Godsend Concierge Service
Executive Summary
Introduction
Godsend Concierge Service (GCS) is a full-service concierge primarily serving the untapped corporate market in Eugene, Oregon. The company is able to do almost any errand the clients need, freeing up their time to develop value for their employer. Employers will welcome our service as it provides another form of compensation used to attract qualified workers.
The most important objectives for the first three years include: the utilization of GCS in at least four of the top 10 local companies, and to increase our number of clients served by 20% per year through superior performance and word-of-mouth referrals.
The Company
This will be a home-based business with Taylor Gogetter as the sole proprietor. The staff will consist of Mr. Gogetter working full-time for GCS. The company intends to hire 3 full time employees by the end of year 1. As this is an industry that demands high quality individuals, GCS intends to offer higher wages to insure quality performance. GCS will provide an extensive employee training program on an ongoing basis.
Services
Godsend Concierge Service will provide a wide range of services for our customers. The tasks for the employees will range considerably; however, the underlying need will be for services/errands made during normal business hours, hours the employees are at work and the company would rather have the employee at work being productive instead of running an errand.
The Market
Corporations recognize that their employees have less free time than they used to, so they have begun to contract with concierge companies to provide their employees with a wide range of services as an additional form of compensation. Some of the large corporations that we will target in Eugene are Hyundai, Sony Disc Manufacturing, Levi Strauss, etc. Medium-size companies include Burley Design Cooperative, Palo Alto Software, Bike Friday, larger law firms and medical offices, etc.
While some of corporations already offer a concierge service for their employees, they typically do this through an in-house employee who does the errands. In the eyes of the employee, having the concierge in house is as much of a perk, but it is less efficient for the company. GCS can provide concierge services to companies at a lower rate.
We will also service individuals who recognize the value in having someone else do tasks that they do not have the time for or, after cost/benefit analysis, decide it is not worth their time to complete the task. We will attract this segment of the market through word-of-mouth marketing.
Currently in Eugene there are two concierge style companies, both primarily servicing individuals. GCS will be targeting companies because the market has been overlooked, and it provides larger volume, and more consistent work.
Financial Considerations
Godsend Concierge Service’s start-up costs will include all the equipment needed for the home-based office, legal fees, website creation, and start-up advertising. The projected growth rate for GCS is over 100% per year, with strong operating margins. GCS expects to have sales of $156,000 by year 3. The company plans to bill its clients on an hourly rate.
Objectives
The objectives for the first three years of operation include:
- To create a service-based company whose primary goal is to exceed customers’ expectations.
- The utilization of GCS in at least four of the top 10 local companies as listed in the local newspaper in its annual local business listing.
- To increase our number of clients served by 20% per year through superior performance and word-of-mouth referrals.
- To develop a sustainable home business, surviving off of its own cash flow.
Mission
The mission of the company is to provide the customer with whatever type of legitimate service he/she desires. We exist to attract and maintain customers. When we adhere to this maxim, everything else will fall into place. Our services will exceed the expectations of our customers. We will foster a workplace where employees take pride and ownership in their contributions, which empowers them to do their best.

Company Summary
Godsend Concierge Service, soon to be located in Eugene, OR, will offer an unlimited concierge service for companies and individuals. GCS will provide a wide range of services for clients, from purchasing theatre tickets, picking up dry cleaning, pet care, and car repairs, to event planning and grocery shopping. The only limit to what we will do is the customer’s imagination and the legality of the task.
The business will be based out of the owner’s home and within 12 months will employ three additional people.
If the business goes per the forecasted plans, after month one it will be making a profit, and will grow steadily each consecutive month.
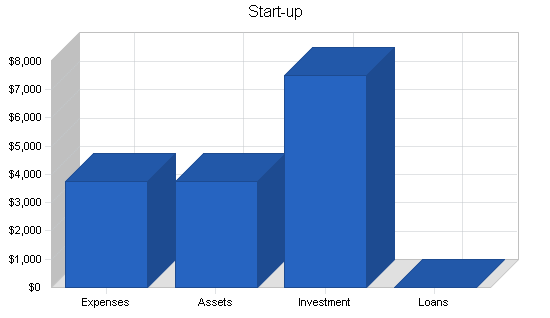
Start-up Summary
Godsend Concierge Service’s start-up costs will include all the equipment needed for the home-based office, legal fees, website creation, and start-up advertising.
The home office equipment will be the largest chunk of the start-up expenses. This equipment includes a computer system, fax machine, office supplies, cellular phone, and pager. The computer should have at least a 500 megahertz Celeron/Pentium processor, 64 megabytes of RAM (preferably 128), 6 gigabyte hard drive, and a rewritable CD-ROM for backing up the system. Additionally, there will be the installation of a broadband connection. While a broadband connection is not totally necessary, it only costs $40-50 per month for service and will make working on the Internet significantly faster and easier. The home office will also require furniture to transform a standard room into an office. Lastly, an additional (land) phone line will be required.
The legal fees are used for the formation of the business as well as for reviewing/generating standard client contracts.
The Web creation fees at start-up are for design and creation of the website.
The advertising costs are based on the need to communicate our service to perspective customers. The bulk of the “advertising” will be communications with corporations and setting up full-service contracts.
Lastly, as we achieve an increase in clients and need to bring on more people, there will be training costs for each employee. We will not bring on new employees initially, and therefore the start-up costs will not reflect this expense.
| Start-up | |
| Requirements | |
| Start-up Expenses | |
| Legal | $500 |
| Stationery etc. | $50 |
| Brochures | $50 |
| Insurance | $400 |
| Computer | $1,500 |
| Broadband Internet Access | $150 |
| Fax machine | $100 |
| Cellular phone | $50 |
| Pager | $20 |
| Office supplies | $25 |
| Web site creation | $500 |
| Advertising | $250 |
| Licenses | $150 |
| Other | $0 |
| Total Start-up Expenses | $3,745 |
| Start-up Assets | |
| Cash Required | $1,255 |
| Other Current Assets | $2,500 |
| Long-term Assets | $0 |
| Total Assets | $3,755 |
| Total Requirements | $7,500 |
| Start-up Funding | |
| Start-up Expenses to Fund | $3,745 |
| Start-up Assets to Fund | $3,755 |
| Total Funding Required | $7,500 |
| Assets | |
| Non-cash Assets from Start-up | $2,500 |
| Cash Requirements from Start-up | $1,255 |
| Additional Cash Raised | $0 |
| Cash Balance on Starting Date | $1,255 |
| Total Assets | $3,755 |
| Liabilities and Capital | |
| Liabilities | |
| Current Borrowing | $0 |
| Long-term Liabilities | $0 |
| Accounts Payable (Outstanding Bills) | $0 |
| Other Current Liabilities (interest-free) | $0 |
| Total Liabilities | $0 |
| Capital | |
| Planned Investment | |
| Owner-operator | $7,500 |
| Other | $0 |
| Additional Investment Requirement | $0 |
| Total Planned Investment | $7,500 |
| Loss at Start-up (Start-up Expenses) | ($3,745) |
| Total Capital | $3,755 |
| Total Capital and Liabilities | $3,755 |
| Total Funding | $7,500 |
Company Ownership
Godsend Concierge Service will be a sole proprietorship, owned by Taylor Gogetter.
Services
Godsend Concierge Service will provide a wide range of services for our customers. We will have two target customers. The first will be corporations, the second will be individuals. As Americans work harder and longer hours, they have less and less time to take care of “personal maintenance;” therefore, having someone do your errands for you when you are working is quite attractive.

Corporations recognize that their employees have less free time than they used to, so they have begun to contract with concierge companies to provide their employees with a wide range of concierge services as an additional form of compensation.
We will also service individuals who recognize the value in having someone else do tasks that they do not have the time for or, after cost/benefit analysis, decide it is not worth their time to complete the task.
Market Analysis Summary
GCS will be focusing on two distinct groups that utilize the concierge market: companies or corporations, and individuals. Both groups, for different reasons, use concierge services. A company will hire concierges and offer them as a perk for its employees. It is attractive to employees because it allows them to have some personal maintenance taken care of during normal business hours. The company also benefits by keeping the employee happy, and by having the employee at work during the day, which develops value for the company.
Currently in Eugene there are two concierge style companies, both primarily servicing individuals. GCS will be targeting companies because the market has been overlooked, and it provides larger volume, and more consistent work.
Market Segmentation
Our customers can be divided into two general groups, corporate/company customers, and individuals.
The corporate customer is a company that contracts with GCS to perform services for it’s employees. Presumably the corporation has a policy with its organizational members that provides guidelines for usage. When employees are in need of GCS, they contact us directly and we bill the company.
We will be soliciting contracts from large corporations as well as medium-size businesses. Some of the large corporations that we will target in Eugene are Hyundai, Sony Disc Manufacturing, Levi Strauss, etc. Medium-size companies will be from 15-40 employees. Examples of these are Burley, Palo Alto Software, Bike Friday, larger law firms and medical offices, etc. Dividing the companies into smaller subgroups is not required, as the needs of the employees are fairly similar between dissimilar companies.
The tasks for the employees will range considerably; however, the underlying need will be for services/errands made during normal business hours, hours the employees are at work and the company would rather have the employee at work being productive instead of running an errand.
The second group of customers are individuals. This group has similar needs to the employees of companies, however, we will be contracting with them directly. This group can be further broken down into three subgroups: those who are at work and do not have the ability to accomplish the needed tasks, those that have done a cost benefit analysis and decided it is a worthy, timesaving service, choose not to for a multitude of reasons, and people who are not from Eugene but need something done in Eugene.

| Market Analysis | |||||||
| Year 1 | Year 2 | Year 3 | Year 4 | Year 5 | |||
| Potential Customers | Growth | CAGR | |||||
| Corporations | 7% | 400 | 428 | 458 | 490 | 524 | 6.98% |
| Individuals | 10% | 3,000 | 3,300 | 3,630 | 3,993 | 4,392 | 10.00% |
| Total | 9.66% | 3,400 | 3,728 | 4,088 | 4,483 | 4,916 | 9.66% |
Target Market Segment Strategy
GCS intends to target people who need service during the day but do not have the time to perform necessary tasks. We are focusing on corporations/companies because they have a large number of employees who would find a concierge service attractive as a part of their compensation package, and the employer would prefer to pay our service to perform the employee’s task, allowing the employee to stay at work and remain productive. Even though we will offer the companies a discount over our standard hourly rate, our revenue will continue to increase because we will see an increase in usage without the normal costs of attracting the individual customers. We would bill the corporation monthly, decreasing the labor costs for processing the invoices.
We will also be targeting individual clients. This targeted group will be a much smaller percentage of our business but will be charged a higher hourly rate. This group will be targeted to provide us with work when we have vacancies in our schedule from the corporations.
Service Business Analysis
The concierge industry in Eugene is relatively small. It is currently serviced by two different companies that cater primarily to individual clients. Medium to large-size companies that offer a concierge service to their employees typically create an in-house solution. Companies are struggling with ways in which they can they can offer perks to employees at reasonable costs. Additionally, there is the ever-present pressure from stakeholders to become more efficient. This pressure will fuel company’s use of concierges as efficiencies can be accomplished by having the employees present at work, developing value instead of out of the office pursuing personal maintenance.
Competition and Buying Patterns
Currently, there are two competitors in the concierge service space. These services are listed under “errands & miscellaneous service” headings of the yellow pages and they target individuals as opposed to corporations.
While some of corporations already offer a concierge service for their employees, they typically do this through an in-house employee who does the errands. In the eyes of the employee, having the concierge in house is as much of a perk, but it is less efficient for the company. GCS can provide concierge services to companies at a lower rate because this is our core competency and we have worked hard to become as efficient as possible.
Strategy and Implementation Summary
GCS will be aggressively courting corporate contracts. Administrative details, such as billing, are streamlined when we are performing on contracts with an entire company. With this in mind, we will structure our service for the corporate customer. This will be done through our investment of human capital. We will win contracts from corporations through our compelling quantitative analysis that will prove increased efficiencies through the use of a concierge service.
We will be attracting individual clients through our website.
Competitive Edge
Our competitive advantage will be based on two factors: our concentration on corporate/company clients, and our investment in human capital. Since we are concentrating on the corporate market, we will be able to best meet the needs of this market. We will become aware of what these special needs are and offer them. These special needs are flexibility, monthly billing, and the ability to handle a decent number of transactions.
Our other competitive advantage is based on our investment in human capital. GCS will be developing a fairly extensive training program to provide employees with the tools necessary to perform at a level that the founder alone would otherwise be offering. It can be difficult to maintain a high level of customer service if you are relying on employees. This problem can be overcome and turned into a competitive advantage by providing employees with the tools to offer the same high level of service that GCS provides. While this costs money, and takes time up front, it will pay off in the long run. This is based on our mission statement that it is our goal to attract and maintain customers. It is difficult to expect a mission statement which demands high levels of service to become organizational behavior unless you provide the organization with the tools to achieve this high standard.
Sales Strategy
Our sales strategy will be targeted at obtaining the corporate/company clients. It is our belief that the individual customers will be obtained through word of mouth. It is likely that they will have spoken to a previous client about GCS and the referral of our services will speak for itself.
Our sales strategy will be to use a cost benefit analysis when trying to close the sale of a prospect. We will use quantitative information to illustrate the value the company will receive by offering a concierge service to employees. The value is recognized in different forms:
- The attraction and retention of employees who are offered this service.
- The value in keeping the employee productive at work instead of taking care of personal maintenance outside of work during normal business hours.
Additionally, we will provide the company with several different options in which they could offer this service to employees ranging as a no-cost-to-the-employee perk to a partially-subsidized service. The different options will be attractive to the company based on a number of different variables, from the cost they are willing to invest into the program to the amount they are willing to spend on the different employees within the company.
Our sales strategy for individuals will be based on our Web presence. Through our marketing efforts we will be driving people to our website. Once on our website, people will see the wide range of services that we offer and can then contact us for a service request. The website will be especially useful for out-of-town clients who are in need of a Eugene-based concierge service.
Please note that GCS will be accepting credit from the corporations. This is based on the assumption that the corporations would find this option a major benefit so that they only had to reconcile their account once a month, as opposed to every time a transaction occurs.
Sales Forecast
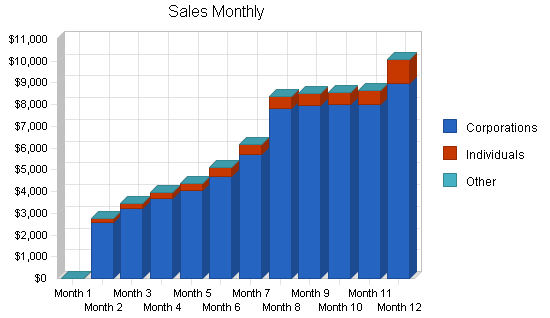
The first month will be spent setting up the business. It is unlikely that there will be much sales activity. In addition to dealing with legal and accounting issues for the business, equipment will need to be purchased and set up. Once the physical office is set up, we will then develop a manual for future employees. The manual will cover topics such as company policies and procedures, the training program (which covers ways to handle clients, tips on efficiencies, principles of empowerment, etc.), and other necessary kernels of information. This will take time so it is important to take care of this initially before the real business gets underway, otherwise the document would be likely produced under time constraints affecting the quality of the document.
The second month will begin to see some activity. The clients will be served by the founder, as there will not yet be a need to bring on new employees. During these few months, at least half of the administrative details (scheduling, answering phones, etc.) will be done from remote locations while serving clients. The remainder of the administrative details will be completed at the office. After month five, GCS will bring on another employee to serve the clients, and the founder will then be able to perform the bulk of the administrative details from the office. Month seven will see the addition of a second employee, and by month 12 we will plateau at three employees, allowing Taylor to remain in the office 95% of the time (of course there will be exigent circumstances requiring Taylor’s services in the field). Having the ability to operate the office remotely (with a pager and cellular phone) will provide the necessary flexibility to accommodate a wide range of needs.
The first employee will be needed by the fifth month, as GCS will be receiving at least six hours of jobs a day. This, coupled with required administrative time, will necessitate an employee. By month seven we will see an increase in our corporate program and will utilize a second employee. By month 12 we will likely be at a level that will plateau for the foreseeable future. Years two and three will be similar to the activity in month 12.
| Sales Forecast | |||
| Year 1 | Year 2 | Year 3 | |
| Sales | |||
| Corporations | $64,716 | $118,741 | $135,000 |
| Individuals | $5,334 | $14,054 | $21,000 |
| Other | $0 | $0 | $0 |
| Total Sales | $70,050 | $132,795 | $156,000 |
| Direct Cost of Sales | Year 1 | Year 2 | Year 3 |
| Corporations | $9,605 | $26,496 | $26,496 |
| Individuals | $1,066 | $4,500 | $6,500 |
| Other | $0 | $0 | $0 |
| Subtotal Direct Cost of Sales | $10,671 | $30,996 | $32,996 |
Milestones
GCS will have several milestones early on:
- Business plan completion. This will be done as a road map for the organization. While we do not need a business plan to raise capital, it will be an indispensable tool for the ongoing performance and improvement of the company.
- Office set up. This will done within the first month.
- Training program. This will be the development of a training program for the employees. The employees will receive initial sessions of training all at once, and then training will become an ongoing process. Continual learning is key.
- Quarterly training. This is basically a check up to make sure that the employees are still learning skills and developing.
| Milestones | |||||
| Milestone | Start Date | End Date | Budget | Manager | Department |
| Business Plan | 8/1/2001 | 9/1/2001 | $0 | Gogetter | Admin |
| Office Set-up | 8/1/2001 | 9/1/2001 | $0 | Gogetter | Admin |
| Training Program | 9/1/2001 | 10/1/2001 | $0 | Gogetter | Admin |
| Quarterly Training | 11/1/2001 | 12/1/2001 | $50 | Gogetter | Admin |
| Totals | $50 | ||||
Management Summary
Godsend Concierge Services is owned and operated by Taylor Gogetter. It will be formed as a sole proprietorship. There is no a compelling need to incorporate. The advantage of incorporation would be limited liability, the disadvantage would be the set costs and maintenance (double taxation). An extensive insurance policy should cover any liability GCS is exposed to.
Taylor Gogetter, founder and owner, has a degree in philosophy from Washington and Jefferson College. Taylor spent four years after college managing a retail bicycle shop. As manager, one of Taylor’s principle responsibilities was attending to customer needs. While 40% of his time was devoted to the administrative details to running the company, 60% of the time was dealing with customers, assessing their needs and delivering a service that exceeded their expectations.
Taylor also spent two years guiding hiking trips of 12-18 people through the Alps on two-week trips. In this experience, Taylor spent 30% of his time accomplishing administrative tasks with the remainder 70% spent addressing the needs of the customers.
Prior to these experiences, Taylor opened and operated his own Sealcoating business. Taylor was able to develop close relationships with customers and was awarded jobs based on his superior services.
These experiences, taken as a whole, provide Taylor with a wealth of practical knowledge to develop a high quality service organization. Taylor’s recognition that it requires time and money to properly train employees is essential to the prosperity of GCS, as the employee will be the interface that the client deals with.
Personnel Plan
The staff will consist of Taylor working full-time for GCS. We will hire one full-time employee at $9 per hour in month five, a second full-time employee in month seven, and a third in month 12. GCS has decided to compensate its employees at $9, which is a fair amount above minimum wage. This wage rate was chosen to attract a higher-quality employee than what minimum wage typically attracts, it will also increase employee morale, and decrease turnover. This is important as, after month five, it will be the employees who are representing GCS and there is a need to exceed the clients expectations every time. GCS will provide an extensive employee training program on an ongoing basis. GCS is cognizant that it costs far more to train a new employee relative to maintain a current employee.
| Personnel Plan | |||
| Year 1 | Year 2 | Year 3 | |
| Payroll | $39,461 | $82,992 | $98,000 |
| Other | $0 | $0 | $0 |
| Total People | 1 | 1 | 1 |
| Total Payroll | $39,461 | $82,992 | $98,000 |
Financial Plan
The following sections will outline the important financial assumptions, key financial indictors, break-even analysis, profit and loss, cash flow, and balance sheet.
Important Assumptions
The following table highlights some of the important financial assumptions for GCS.
| General Assumptions | |||
| Year 1 | Year 2 | Year 3 | |
| Plan Month | 1 | 2 | 3 |
| Current Interest Rate | 10.00% | 10.00% | 10.00% |
| Long-term Interest Rate | 10.00% | 10.00% | 10.00% |
| Tax Rate | 25.42% | 25.00% | 25.42% |
| Other | 0 | 0 | 0 |
Break-even Analysis
The break-even analysis is based on the hourly rate charged to corporations, as they derive 90% of our business. The charge for individuals is slightly higher, but accounts for less than 10% of our projected revenue. This is in keeping with our conservative estimate philosophy.

| Break-even Analysis | |
| Monthly Revenue Break-even | $5,263 |
| Assumptions: | |
| Average Percent Variable Cost | 15% |
| Estimated Monthly Fixed Cost | $4,461 |
Projected Profit and Loss
The following table will indicate projected profit and loss.


| Pro Forma Profit and Loss | |||
| Year 1 | Year 2 | Year 3 | |
| Sales | $70,050 | $132,795 | $156,000 |
| Direct Cost of Sales | $10,671 | $30,996 | $32,996 |
| Other | $0 | $0 | $0 |
| Total Cost of Sales | $10,671 | $30,996 | $32,996 |
| Gross Margin | $59,379 | $101,799 | $123,004 |
| Gross Margin % | 84.77% | 76.66% | 78.85% |
| Expenses | |||
| Payroll | $39,461 | $82,992 | $98,000 |
| Sales and Marketing and Other Expenses | $2,000 | $1,750 | $1,750 |
| Depreciation | $0 | $0 | $0 |
| Depreciation | $492 | $492 | $0 |
| Additional payroll burdens- 7.5% | $2,295 | $4,424 | $5,924 |
| Comunication Equipment | $2,465 | $0 | $0 |
| Utilities | $0 | $0 | $0 |
| Insurance | $900 | $0 | $0 |
| Payroll Taxes | $5,919 | $12,449 | $14,700 |
| Other | $0 | $0 | $0 |
| Total Operating Expenses | $53,532 | $102,107 | $120,374 |
| Profit Before Interest and Taxes | $5,847 | ($308) | $2,630 |
| EBITDA | $5,847 | ($308) | $2,630 |
| Interest Expense | $0 | $0 | $0 |
| Taxes Incurred | $1,337 | $0 | $668 |
| Net Profit | $4,510 | ($308) | $1,962 |
| Net Profit/Sales | 6.44% | -0.23% | 1.26% |
Projected Cash Flow
The following chart and table will indicate projected cash flow.

| Pro Forma Cash Flow | |||
| Year 1 | Year 2 | Year 3 | |
| Cash Received | |||
| Cash from Operations | |||
| Cash Sales | $42,030 | $79,677 | $93,600 |
| Cash from Receivables | $20,636 | $46,504 | $59,954 |
| Subtotal Cash from Operations | $62,666 | $126,181 | $153,554 |
| Additional Cash Received | |||
| Sales Tax, VAT, HST/GST Received | $0 | $0 | $0 |
| New Current Borrowing | $0 | $0 | $0 |
| New Other Liabilities (interest-free) | $2,000 | $0 | $0 |
| New Long-term Liabilities | $0 | $0 | $0 |
| Sales of Other Current Assets | $0 | $0 | $0 |
| Sales of Long-term Assets | $0 | $0 | $0 |
| New Investment Received | $1,255 | $7,000 | $0 |
| Subtotal Cash Received | $65,921 | $133,181 | $153,554 |
| Expenditures | Year 1 | Year 2 | Year 3 |
| Expenditures from Operations | |||
| Cash Spending | $39,461 | $82,992 | $98,000 |
| Bill Payments | $21,893 | $50,179 | $55,551 |
| Subtotal Spent on Operations | $61,354 | $133,171 | $153,551 |
| Additional Cash Spent | |||
| Sales Tax, VAT, HST/GST Paid Out | $0 | $0 | $0 |
| Principal Repayment of Current Borrowing | $0 | $0 | $0 |
| Other Liabilities Principal Repayment | $0 | $0 | $0 |
| Long-term Liabilities Principal Repayment | $0 | $0 | $0 |
| Purchase Other Current Assets | $0 | $0 | $0 |
| Purchase Long-term Assets | $0 | $0 | $0 |
| Dividends | $0 | $0 | $0 |
| Subtotal Cash Spent | $61,354 | $133,171 | $153,551 |
| Net Cash Flow | $4,567 | $10 | $3 |
| Cash Balance | $5,822 | $5,832 | $5,834 |
Projected Balance Sheet
The following table will indicate the projected balance sheet.
| Pro Forma Balance Sheet | |||
| Year 1 | Year 2 | Year 3 | |
| Assets | |||
| Current Assets | |||
| Cash | $5,822 | $5,832 | $5,834 |
| Accounts Receivable | $7,384 | $13,999 | $16,445 |
| Other Current Assets | $2,500 | $2,500 | $2,500 |
| Total Current Assets | $15,706 | $22,331 | $24,779 |
| Long-term Assets | |||
| Long-term Assets | $0 | $0 | $0 |
| Accumulated Depreciation | $0 | $0 | $0 |
| Total Long-term Assets | $0 | $0 | $0 |
| Total Assets | $15,706 | $22,331 | $24,779 |
| Liabilities and Capital | Year 1 | Year 2 | Year 3 |
| Current Liabilities | |||
| Accounts Payable | $4,187 | $4,119 | $4,606 |
| Current Borrowing | $0 | $0 | $0 |
| Other Current Liabilities | $2,000 | $2,000 | $2,000 |
| Subtotal Current Liabilities | $6,187 | $6,119 | $6,606 |
| Long-term Liabilities | $0 | $0 | $0 |
| Total Liabilities | $6,187 | $6,119 | $6,606 |
| Paid-in Capital | $8,755 | $15,755 | $15,755 |
| Retained Earnings | ($3,745) | $765 | $457 |
| Earnings | $4,510 | ($308) | $1,962 |
| Total Capital | $9,520 | $16,212 | $18,173 |
| Total Liabilities and Capital | $15,706 | $22,331 | $24,779 |
| Net Worth | $9,520 | $16,212 | $18,173 |
Business Ratios
The following table contains important business ratios for the personal services industry, as determined by the Standard Industry Classification (SIC) Index code 7299.
| Ratio Analysis | ||||
| Year 1 | Year 2 | Year 3 | Industry Profile | |
| Sales Growth | n.a. | 89.57% | 17.47% | 17.90% |
| Percent of Total Assets | ||||
| Accounts Receivable | 47.02% | 62.69% | 66.37% | 11.10% |
| Other Current Assets | 15.92% | 11.20% | 10.09% | 37.10% |
| Total Current Assets | 100.00% | 100.00% | 100.00% | 52.80% |
| Long-term Assets | 0.00% | 0.00% | 0.00% | 47.20% |
| Total Assets | 100.00% | 100.00% | 100.00% | 100.00% |
| Current Liabilities | 39.39% | 27.40% | 26.66% | 33.90% |
| Long-term Liabilities | 0.00% | 0.00% | 0.00% | 28.00% |
| Total Liabilities | 39.39% | 27.40% | 26.66% | 61.90% |
| Net Worth | 60.61% | 72.60% | 73.34% | 38.10% |
| Percent of Sales | ||||
| Sales | 100.00% | 100.00% | 100.00% | 100.00% |
| Gross Margin | 84.77% | 76.66% | 78.85% | 0.00% |
| Selling, General & Administrative Expenses | 76.37% | 69.80% | 72.92% | 72.70% |
| Advertising Expenses | 0.21% | 0.00% | 0.00% | 2.20% |
| Profit Before Interest and Taxes | 8.35% | -0.23% | 1.69% | 4.00% |
| Main Ratios | ||||
| Current | 2.54 | 3.65 | 3.75 | 1.81 |
| Quick | 2.54 | 3.65 | 3.75 | 1.33 |
| Total Debt to Total Assets | 39.39% | 27.40% | 26.66% | 61.90% |
| Pre-tax Return on Net Worth | 61.42% | -1.90% | 14.47% | 6.30% |
| Pre-tax Return on Assets | 37.23% | -1.38% | 10.61% | 16.60% |
| Additional Ratios | Year 1 | Year 2 | Year 3 | |
| Net Profit Margin | 6.44% | -0.23% | 1.26% | n.a |
| Return on Equity | 47.37% | -1.90% | 10.79% | n.a |
| Activity Ratios | ||||
| Accounts Receivable Turnover | 3.79 | 3.79 | 3.79 | n.a |
| Collection Days | 56 | 73 | 89 | n.a |
| Accounts Payable Turnover | 6.23 | 12.17 | 12.17 | n.a |
| Payment Days | 30 | 30 | 28 | n.a |
| Total Asset Turnover | 4.46 | 5.95 | 6.30 | n.a |
| Debt Ratios | ||||
| Debt to Net Worth | 0.65 | 0.38 | 0.36 | n.a |
| Current Liab. to Liab. | 1.00 | 1.00 | 1.00 | n.a |
| Liquidity Ratios | ||||
| Net Working Capital | $9,520 | $16,212 | $18,173 | n.a |
| Interest Coverage | 0.00 | 0.00 | 0.00 | n.a |
| Additional Ratios | ||||
| Assets to Sales | 0.22 | 0.17 | 0.16 | n.a |
| Current Debt/Total Assets | 39% | 27% | 27% | n.a |
| Acid Test | 1.35 | 1.36 | 1.26 | n.a |
| Sales/Net Worth | 7.36 | 8.19 | 8.58 | n.a |
| Dividend Payout | 0.00 | 0.00 | 0.00 | n.a |
Appendix
| Sales Forecast | |||||||||||||
| Month 1 | Month 2 | Month 3 | Month 4 | Month 5 | Month 6 | Month 7 | Month 8 | Month 9 | Month 10 | Month 11 | Month 12 | ||
| Sales | |||||||||||||
| Corporations | 0% | $0 | $2,577 | $3,216 | $3,677 | $4,032 | $4,706 | $5,700 | $7,847 | $7,984 | $7,998 | $8,001 | $8,978 |
| Individuals | 0% | $0 | $180 | $246 | $295 | $341 | $393 | $482 | $534 | $543 | $549 | $671 | $1,100 |
| Other | 0% | $0 | $0 | $0 | $0 | $0 | $0 | $0 | $0 | $0 | $0 | $0 | $0 |
| Total Sales | $0 | $2,757 | $3,462 | $3,972 | $4,373 | $5,099 | $6,182 | $8,381 | $8,527 | $8,547 | $8,672 | $10,078 | |
| Direct Cost of Sales | Month 1 | Month 2 | Month 3 | Month 4 | Month 5 | Month 6 | Month 7 | Month 8 | Month 9 | Month 10 | Month 11 | Month 12 | |
| Corporations | $0 | $0 | $0 | $0 | $0 | $0 | $1,325 | $1,325 | $1,490 | $1,656 | $1,822 | $1,987 | |
| Individuals | $0 | $0 | $0 | $0 | $0 | $0 | $147 | $147 | $165 | $184 | $202 | $221 | |
| Other | $0 | $0 | $0 | $0 | $0 | $0 | $0 | $0 | $0 | $0 | $0 | $0 | |
| Subtotal Direct Cost of Sales | $0 | $0 | $0 | $0 | $0 | $0 | $1,472 | $1,472 | $1,655 | $1,840 | $2,024 | $2,208 | |
| Personnel Plan | |||||||||||||
| Month 1 | Month 2 | Month 3 | Month 4 | Month 5 | Month 6 | Month 7 | Month 8 | Month 9 | Month 10 | Month 11 | Month 12 | ||
| Payroll | 0% | $2,000 | $2,000 | $2,000 | $2,000 | $2,000 | $2,000 | $3,298 | $3,298 | $4,689 | $4,848 | $4,912 | $6,416 |
| Other | 0% | $0 | $0 | $0 | $0 | $0 | $0 | $0 | $0 | $0 | $0 | $0 | $0 |
| Total People | 1 | 1 | 1 | 1 | 1 | 1 | 1 | 1 | 1 | 1 | 1 | 1 | |
| Total Payroll | $2,000 | $2,000 | $2,000 | $2,000 | $2,000 | $2,000 | $3,298 | $3,298 | $4,689 | $4,848 | $4,912 | $6,416 | |
| General Assumptions | |||||||||||||
| Month 1 | Month 2 | Month 3 | Month 4 | Month 5 | Month 6 | Month 7 | Month 8 | Month 9 | Month 10 | Month 11 | Month 12 | ||
| Plan Month | 1 | 2 | 3 | 4 | 5 | 6 | 7 | 8 | 9 | 10 | 11 | 12 | |
| Current Interest Rate | 10.00% | 10.00% | 10.00% | 10.00% | 10.00% | 10.00% | 10.00% | 10.00% | 10.00% | 10.00% | 10.00% | 10.00% | |
| Long-term Interest Rate | 10.00% | 10.00% | 10.00% | 10.00% | 10.00% | 10.00% | 10.00% | 10.00% | 10.00% | 10.00% | 10.00% | 10.00% | |
| Tax Rate | 30.00% | 25.00% | 25.00% | 25.00% | 25.00% | 25.00% | 25.00% | 25.00% | 25.00% | 25.00% | 25.00% | 25.00% | |
| Other | 0 | 0 | 0 | 0 | 0 | 0 | 0 | 0 | 0 | 0 | 0 | 0 | |
| Pro Forma Profit and Loss | |||||||||||||
| Month 1 | Month 2 | Month 3 | Month 4 | Month 5 | Month 6 | Month 7 | Month 8 | Month 9 | Month 10 | Month 11 | Month 12 | ||
| Sales | $0 | $2,757 | $3,462 | $3,972 | $4,373 | $5,099 | $6,182 | $8,381 | $8,527 | $8,547 | $8,672 | $10,078 | |
| Direct Cost of Sales | $0 | $0 | $0 | $0 | $0 | $0 | $1,472 | $1,472 | $1,655 | $1,840 | $2,024 | $2,208 | |
| Other | $0 | $0 | $0 | $0 | $0 | $0 | $0 | $0 | $0 | $0 | $0 | $0 | |
| Total Cost of Sales | $0 | $0 | $0 | $0 | $0 | $0 | $1,472 | $1,472 | $1,655 | $1,840 | $2,024 | $2,208 | |
| Gross Margin | $0 | $2,757 | $3,462 | $3,972 | $4,373 | $5,099 | $4,710 | $6,909 | $6,872 | $6,707 | $6,648 | $7,870 | |
| Gross Margin % | 0.00% | 100.00% | 100.00% | 100.00% | 100.00% | 100.00% | 76.19% | 82.44% | 80.59% | 78.47% | 76.66% | 78.09% | |
| Expenses | |||||||||||||
| Payroll | $2,000 | $2,000 | $2,000 | $2,000 | $2,000 | $2,000 | $3,298 | $3,298 | $4,689 | $4,848 | $4,912 | $6,416 | |
| Sales and Marketing and Other Expenses | $0 | $150 | $150 | $150 | $125 | $375 | $150 | $150 | $150 | $200 | $200 | $200 | |
| Depreciation | $0 | $0 | $0 | $0 | $0 | $0 | $0 | $0 | $0 | $0 | $0 | $0 | |
| Depreciation | $41 | $41 | $41 | $41 | $41 | $41 | $41 | $41 | $41 | $41 | $41 | $41 | |
| Additional payroll burdens- 7.5% | $0 | $0 | $0 | $0 | $110 | $110 | $110 | $371 | $371 | $371 | $371 | $481 | |
| Comunication Equipment | $150 | $175 | $200 | $200 | $200 | $220 | $220 | $220 | $220 | $220 | $220 | $220 | |
| Utilities | $0 | $0 | $0 | $0 | $0 | $0 | $0 | $0 | $0 | $0 | $0 | $0 | |
| Insurance | $0 | $0 | $0 | $100 | $100 | $100 | $100 | $100 | $100 | $100 | $100 | $100 | |
| Payroll Taxes | 15% | $300 | $300 | $300 | $300 | $300 | $300 | $495 | $495 | $703 | $727 | $737 | $962 |
| Other | $0 | $0 | $0 | $0 | $0 | $0 | $0 | $0 | $0 | $0 | $0 | $0 | |
| Total Operating Expenses | $2,491 | $2,666 | $2,691 | $2,791 | $2,876 | $3,146 | $4,414 | $4,675 | $6,274 | $6,507 | $6,581 | $8,420 | |
| Profit Before Interest and Taxes | ($2,491) | $91 | $771 | $1,181 | $1,497 | $1,953 | $296 | $2,234 | $598 | $200 | $67 | ($550) | |
| EBITDA | ($2,491) | $91 | $771 | $1,181 | $1,497 | $1,953 | $296 | $2,234 | $598 | $200 | $67 | ($550) | |
| Interest Expense | $0 | $0 | $0 | $0 | $0 | $0 | $0 | $0 | $0 | $0 | $0 | $0 | |
| Taxes Incurred | ($747) | $23 | $193 | $295 | $374 | $488 | $74 | $559 | $149 | $50 | $17 | ($138) | |
| Net Profit | ($1,744) | $68 | $578 | $886 | $1,123 | $1,465 | $222 | $1,676 | $448 | $150 | $50 | ($413) | |
| Net Profit/Sales | 0.00% | 2.48% | 16.70% | 22.30% | 25.67% | 28.73% | 3.59% | 19.99% | 5.26% | 1.75% | 0.58% | -4.10% | |
| Pro Forma Cash Flow | |||||||||||||
| Month 1 | Month 2 | Month 3 | Month 4 | Month 5 | Month 6 | Month 7 | Month 8 | Month 9 | Month 10 | Month 11 | Month 12 | ||
| Cash Received | |||||||||||||
| Cash from Operations | |||||||||||||
| Cash Sales | $0 | $1,654 | $2,077 | $2,383 | $2,624 | $3,059 | $3,709 | $5,029 | $5,116 | $5,128 | $5,203 | $6,047 | |
| Cash from Receivables | $0 | $0 | $37 | $1,112 | $1,392 | $1,594 | $1,759 | $2,054 | $2,502 | $3,354 | $3,411 | $3,420 | |
| Subtotal Cash from Operations | $0 | $1,654 | $2,114 | $3,495 | $4,015 | $4,654 | $5,468 | $7,083 | $7,618 | $8,483 | $8,614 | $9,467 | |
| Additional Cash Received | |||||||||||||
| Sales Tax, VAT, HST/GST Received | 0.00% | $0 | $0 | $0 | $0 | $0 | $0 | $0 | $0 | $0 | $0 | $0 | $0 |
| New Current Borrowing | $0 | $0 | $0 | $0 | $0 | $0 | $0 | $0 | $0 | $0 | $0 | $0 | |
| New Other Liabilities (interest-free) | $0 | $0 | $0 | $0 | $2,000 | $0 | $0 | $0 | $0 | $0 | $0 | $0 | |
| New Long-term Liabilities | $0 | $0 | $0 | $0 | $0 | $0 | $0 | $0 | $0 | $0 | $0 | $0 | |
| Sales of Other Current Assets | $0 | $0 | $0 | $0 | $0 | $0 | $0 | $0 | $0 | $0 | $0 | $0 | |
| Sales of Long-term Assets | $0 | $0 | $0 | $0 | $0 | $0 | $0 | $0 | $0 | $0 | $0 | $0 | |
| New Investment Received | $1,255 | $0 | $0 | $0 | $0 | $0 | $0 | $0 | $0 | $0 | $0 | $0 | |
| Subtotal Cash Received | $1,255 | $1,654 | $2,114 | $3,495 | $6,015 | $4,654 | $5,468 | $7,083 | $7,618 | $8,483 | $8,614 | $9,467 | |
| Expenditures | Month 1 | Month 2 | Month 3 | Month 4 | Month 5 | Month 6 | Month 7 | Month 8 | Month 9 | Month 10 | Month 11 | Month 12 | |
| Expenditures from Operations | |||||||||||||
| Cash Spending | $2,000 | $2,000 | $2,000 | $2,000 | $2,000 | $2,000 | $3,298 | $3,298 | $4,689 | $4,848 | $4,912 | $6,416 | |
| Bill Payments | ($256) | ($225) | $695 | $891 | $1,092 | $1,263 | $1,669 | $2,687 | $3,407 | $3,395 | $3,554 | $3,722 | |
| Subtotal Spent on Operations | $1,744 | $1,775 | $2,695 | $2,891 | $3,092 | $3,263 | $4,967 | $5,985 | $8,096 | $8,243 | $8,466 | $10,138 | |
| Additional Cash Spent | |||||||||||||
| Sales Tax, VAT, HST/GST Paid Out | $0 | $0 | $0 | $0 | $0 | $0 | $0 | $0 | $0 | $0 | $0 | $0 | |
| Principal Repayment of Current Borrowing | $0 | $0 | $0 | $0 | $0 | $0 | $0 | $0 | $0 | $0 | $0 | $0 | |
| Other Liabilities Principal Repayment | $0 | $0 | $0 | $0 | $0 | $0 | $0 | $0 | $0 | $0 | $0 | $0 | |
| Long-term Liabilities Principal Repayment | $0 | $0 | $0 | $0 | $0 | $0 | $0 | $0 | $0 | $0 | $0 | $0 | |
| Purchase Other Current Assets | $0 | $0 | $0 | $0 | $0 | $0 | $0 | $0 | $0 | $0 | $0 | $0 | |
| Purchase Long-term Assets | $0 | $0 | $0 | $0 | $0 | $0 | $0 | $0 | $0 | $0 | $0 | $0 | |
| Dividends | $0 | $0 | $0 | $0 | $0 | $0 | $0 | $0 | $0 | $0 | $0 | $0 | |
| Subtotal Cash Spent | $1,744 | $1,775 | $2,695 | $2,891 | $3,092 | $3,263 | $4,967 | $5,985 | $8,096 | $8,243 | $8,466 | $10,138 | |
| Net Cash Flow | ($489) | ($121) | ($581) | $605 | $2,924 | $1,390 | $502 | $1,098 | ($477) | $239 | $148 | ($671) | |
| Cash Balance | $766 | $645 | $64 | $669 | $3,593 | $4,983 | $5,485 | $6,583 | $6,105 | $6,345 | $6,493 | $5,822 | |
| Pro Forma Balance Sheet | |||||||||||||
| Month 1 | Month 2 | Month 3 | Month 4 | Month 5 | Month 6 | Month 7 | Month 8 | Month 9 | Month 10 | Month 11 | Month 12 | ||
| Assets | Starting Balances | ||||||||||||
| Current Assets | |||||||||||||
| Cash | $1,255 | $766 | $645 | $64 | $669 | $3,593 | $4,983 | $5,485 | $6,583 | $6,105 | $6,345 | $6,493 | $5,822 |
| Accounts Receivable | $0 | $0 | $1,103 | $2,451 | $2,927 | $3,285 | $3,730 | $4,444 | $5,743 | $6,651 | $6,716 | $6,774 | $7,384 |
| Other Current Assets | $2,500 | $2,500 | $2,500 | $2,500 | $2,500 | $2,500 | $2,500 | $2,500 | $2,500 | $2,500 | $2,500 | $2,500 | $2,500 |
| Total Current Assets | $3,755 | $3,266 | $4,248 | $5,015 | $6,096 | $9,378 | $11,214 | $12,429 | $14,825 | $15,257 | $15,561 | $15,766 | $15,706 |
| Long-term Assets | |||||||||||||
| Long-term Assets | $0 | $0 | $0 | $0 | $0 | $0 | $0 | $0 | $0 | $0 | $0 | $0 | $0 |
| Accumulated Depreciation | $0 | $0 | $0 | $0 | $0 | $0 | $0 | $0 | $0 | $0 | $0 | $0 | $0 |
| Total Long-term Assets | $0 | $0 | $0 | $0 | $0 | $0 | $0 | $0 | $0 | $0 | $0 | $0 | $0 |
| Total Assets | $3,755 | $3,266 | $4,248 | $5,015 | $6,096 | $9,378 | $11,214 | $12,429 | $14,825 | $15,257 | $15,561 | $15,766 | $15,706 |
| Liabilities and Capital | Month 1 | Month 2 | Month 3 | Month 4 | Month 5 | Month 6 | Month 7 | Month 8 | Month 9 | Month 10 | Month 11 | Month 12 | |
| Current Liabilities | |||||||||||||
| Accounts Payable | $0 | $0 | $914 | $1,102 | $1,298 | $1,456 | $1,828 | $2,821 | $3,541 | $3,525 | $3,679 | $3,834 | $4,187 |
| Current Borrowing | $0 | $0 | $0 | $0 | $0 | $0 | $0 | $0 | $0 | $0 | $0 | $0 | $0 |
| Other Current Liabilities | $0 | $0 | $0 | $0 | $0 | $2,000 | $2,000 | $2,000 | $2,000 | $2,000 | $2,000 | $2,000 | $2,000 |
| Subtotal Current Liabilities | $0 | $0 | $914 | $1,102 | $1,298 | $3,456 | $3,828 | $4,821 | $5,541 | $5,525 | $5,679 | $5,834 | $6,187 |
| Long-term Liabilities | $0 | $0 | $0 | $0 | $0 | $0 | $0 | $0 | $0 | $0 | $0 | $0 | $0 |
| Total Liabilities | $0 | $0 | $914 | $1,102 | $1,298 | $3,456 | $3,828 | $4,821 | $5,541 | $5,525 | $5,679 | $5,834 | $6,187 |
| Paid-in Capital | $7,500 | $8,755 | $8,755 | $8,755 | $8,755 | $8,755 | $8,755 | $8,755 | $8,755 | $8,755 | $8,755 | $8,755 | $8,755 |
| Retained Earnings | ($3,745) | ($3,745) | ($3,745) | ($3,745) | ($3,745) | ($3,745) | ($3,745) | ($3,745) | ($3,745) | ($3,745) | ($3,745) | ($3,745) | ($3,745) |
| Earnings | $0 | ($1,744) | ($1,675) | ($1,097) | ($211) | $911 | $2,376 | $2,598 | $4,274 | $4,722 | $4,872 | $4,922 | $4,510 |
| Total Capital | $3,755 | $3,266 | $3,335 | $3,913 | $4,799 | $5,921 | $7,386 | $7,608 | $9,284 | $9,732 | $9,882 | $9,932 | $9,520 |
| Total Liabilities and Capital | $3,755 | $3,266 | $4,248 | $5,015 | $6,096 | $9,378 | $11,214 | $12,429 | $14,825 | $15,257 | $15,561 | $15,766 | $15,706 |
| Net Worth | $3,755 | $3,266 | $3,335 | $3,913 | $4,799 | $5,921 | $7,386 | $7,608 | $9,284 | $9,732 | $9,882 | $9,932 | $9,520 |

