
I Tech Solutions
Executive Summary
I Tech Solutions is a consulting-oriented company, intending to fill in the market need for a professional, customer-focused computer company. The company emphasizes service and support to differentiate itself from more price-oriented computer companies. We are on the brink of penetrating a lucrative market in a rapidly growing industry. The current trend towards an increase in the number of entrepreneurs and competition amongst existing companies presents an opportunity for I Tech Solutions to penetrate this market.
Located at (discussion omitted), we realize that, for us to prosper, we need to be flexible and responsive, to delight clients by providing them with what they want, when they want it, and before the competition can offer it. The company intends to achieve this through a solutions approach that is customer-centric, and in which the customer’s business objectives enjoy top priority.
Once the needs and processes are understood and described, leading edge products and best-of-industry skills will be applied to design and develop a fitting solution to enable the client’s business in the most cost effective way.
Our marketing strategy will be based mainly on ensuring that clients know what need the service(s) is able to fulfill, and making the right service and information available to the right target client. We intend to implement a market penetration strategy that will ensure that our services are well known and respected in our respective industry. Our strategy will convey a sense of quality and satisfaction in every picture, every promotion, and every publication. Our promotional strategy will involve traditional advertising, Internet marketing, personal selling, public relations, and direct marketing, details of which are provided in the marketing section of this plan.
It is important to recognize that make our intangible resources, such as our ability to relate to customers regarding their needs and wants, management style, corporate culture and commitment. These elements will differentiate us from our competitors and contribute towards the development of a sustainable competitive advantage.
In a nutshell, we don’t intend to just market and sell our product and services, but to provide customized services and products that will enable our clients to optimize their output and, assist in the attainment of their goals and objectives. However, for us to attain the above stated we shall need funding from outside investors.
Note: All currency values in the charts and tables are expressed in the Botswana Pula (P).

1.1 Objectives
Our business strategy will revolve around the need to provide quality products and services to our various target customers. This shall be undertaken through the establishment of a professional team and the provision of quality, custom-designed services, catering to the client’s particular needs.
We intend to attain the following objectives:
- Develop a follow-up strategy to gauge performance with all our clients.
- To continuously formalize and measure cross-functional working communication so as to ensure that the various departments work harmoniously towards attainment of company objectives.
- To instill a culture of continuous improvement in beating standards of customer satisfaction and efficiency.
- We are fully committed to supporting growth and development in the economy.
1.2 Keys to Success
The keys to the projects’ success will undoubtedly be effective market segmentation through identification of several niche markets and implementation strategies. The key success factors will include the following:
- Excellence in fulfilling the promise: completely confidential, reliable, trustworthy expertise, and service(s) through the provision of an uncompromising service. This dictates that we have the latest technology, hardware, software, and well-trained personnel so as to deliver this promise.
- Timeous response to clients’ orders: we cannot afford to delay our clients for whatever reason, as this will have a negative bearing on our image, reputation, and future business. We need to be continually communicating with the client, ensuring we provide needs-based solutions.
- Skill and depth of knowledge: Considering the nature of our services and their relative infancy on the market, the skill and depth of knowledge of our personnel is of utmost importance in determining the provision of the service(s) to the end-users.
- Clear product and marketing positioning: Not wanting to be associated with the numerous vendors on the market, we intend to aggressively market our business and the services we provide in order to be at the top of our clients’ minds.
- Leveraging from a large pool of expertise: The company’s various alliances with technological and training partners shall prove invaluable. The skills and intellectual capacity these partners will have in the fields of product support, design and system integration, implementation and execution, lifecycle support and understanding, training, and in the application of new technology are intangible benefits to I Tech Solutions.
1.3 Mission
Company Values
I Tech Solutions is committed to the fair and ethical treatment of employees and stakeholders. This shall be undertaken through implementation of the following company values:
- We intend to be a responsible corporate citizen, fulfilling our obligations as an integral member of society. Our business decisions will give appropriate weight and consideration to social and environmental impacts.
- We intend to provide products and services of uncompromising quality.
- We intend to seek mutually beneficial and enduring relationships in all the commitments that we make, ensuring that they are straightforward and honest. Our communication will be open and accurate, both internally and externally.
- We will intend to uphold all the above company values, promoting our employees to do likewise.
Through implementation of the company values, we believe that we will be able to attain our goals and objectives for the benefit of all concerned, in particular, the communities in which we will operate.
I Tech Solutions is built on the assumption that the management of information technology for business is like legal advice or accounting, in that it is not inherently a do-it-yourself prospect, and requires outside expertise to install and implement it. Smart business people need to find quality vendors of reliable hardware, software, service, and support. They need to use these quality vendors as they use their other professional service suppliers: as trusted allies.
I Tech Solutions intends to be such a solution provider. We will serve our clients as trusted allies, providing them with the loyalty of a business partner and the economics of an outside vendor. We want to make sure that our clients have what they need to run their businesses as well as possible, with maximum efficiency and reliability. Many of our information applications will be mission critical, so we will give our clients the assurance that we will be there when they need us. The above is well summarized in our mission statement which is as follows:
“The company is dedicated to leveraging emerging technologies to provide the highest level of quality products and services, customer service, and security.”
Company Summary
I Tech Solutions was founded in November 2000 as a private limited company. For most of its initial existence, the company intends to establish close relationships with its various clients, with the intention of expanding in the near future.
2.1 Company Ownership
I Tech Solutions is a company incorporated at the Registrar of Companies by Mr. T, Mr. S, and Mr. P. Though relatively new, the directors realize their company’s vast potential market and opportunity for growth if given the necessary funding.

2.2 Start-up Summary
Total start-up capital and expenses covered include legal costs, business cards, stationery, and related expenses. Messrs. T., S., and P. have provided investment covering much of the starting assets, with the rest of required financing coming from a 5-year commercial loan obtained from Bank Z. The start-up table below itemizes the start-up expenses.
Note: All currency values in the charts and tables are expressed in the Botswana Pula (P).

| Start-up Funding | |
| Start-up Expenses to Fund | P207,749 |
| Start-up Assets to Fund | P492,251 |
| Total Funding Required | P700,000 |
| Assets | |
| Non-cash Assets from Start-up | P0 |
| Cash Requirements from Start-up | P492,251 |
| Additional Cash Raised | P0 |
| Cash Balance on Starting Date | P492,251 |
| Total Assets | P492,251 |
| Liabilities and Capital | |
| Liabilities | |
| Current Borrowing | P0 |
| Long-term Liabilities | P600,000 |
| Accounts Payable (Outstanding Bills) | P0 |
| Other Current Liabilities (interest-free) | P0 |
| Total Liabilities | P600,000 |
| Capital | |
| Planned Investment | |
| Investor 1 | P40,000 |
| Investor 2 | P30,000 |
| Investor 3 | P30,000 |
| Additional Investment Requirement | P0 |
| Total Planned Investment | P100,000 |
| Loss at Start-up (Start-up Expenses) | (P207,749) |
| Total Capital | (P107,749) |
| Total Capital and Liabilities | P492,251 |
| Total Funding | P700,000 |
| Start-up | |
| Requirements | |
| Start-up Expenses | |
| Legal | P1,400 |
| Stationery etc. | P2,000 |
| Brochures | P5,000 |
| Consultants | P4,500 |
| Staff Engagement | P4,000 |
| Office Locatioin | P2,600 |
| Staff Training | P5,000 |
| Expensed equipment | P171,349 |
| Other | P11,900 |
| Total Start-up Expenses | P207,749 |
| Start-up Assets | |
| Cash Required | P492,251 |
| Start-up Inventory | P0 |
| Other Current Assets | P0 |
| Long-term Assets | P0 |
| Total Assets | P492,251 |
| Total Requirements | P700,000 |
Products and Services
I Tech Solutions will provide computer products and services to small, medium, and large businesses. We will also be focused on providing network systems and services to businesses. The systems include both PC-based Land Area Networks (LAN) systems and minicomputer server-based systems. Our services include design and installation of network systems, training, and support.
3.1 Product and Service Description
I Tech Solutions intends to provide the following services:
- Financial Solutions (discussion omitted in this sample plan)
- Network Solutions (discussion omitted)
- Data Backup Solutions and Services (discussion omitted)
- E-commerce Solutions (discussion omitted)
- Hardware Supply and Technical Support (discussion omitted)
- Paperless Office Automation Solutions (discussion omitted)
- Training (discussion omitted)
3.2 Technology
I Tech Solutions will strive to maintain the latest hardware and software capabilities so as to ensure we are continuously at the forefront in our market arena. The one certainty in our industry is that technology will continue to evolve and develop, changing what we market, as well as how we market it. Our aim is to be aware of the implications of this new technology, and utilize it in our existing framework where possible. Complete presentation facilities for preparation and delivery of multimedia presentations on Macintosh or Windows machines, in formats that include on-disk presentation or video presentation are also possibilities.
3.3 Macro-environment
Our macro-environment is exciting. We are in the middle of an unprecedented boom in connectivity and communications, as the Internet offers information technology like we never dreamed of. We are concerned with real value, real changes in the way we deal with information.
Meanwhile, all other signs are positive. The current drive by the government towards a more diversified economy presents an opportunity for our business to propel and excel in our intended markets, benefiting from the support of the concerned institutions and trade bodies. In addition to Botswana becoming an increasing economic hub, we foresee the demand for high quality business communication solutions to be on the rise. Through the undertaking of our business activities, we foresee no difficulty, in gaining market acceptance, provided we deliver the final service timeously, of good quality, and at competitive rates.
3.4 Future Products and Services
We must remain on top of any new technology, because this is our bread and butter. For networking, we need to provide better knowledge of cross platform technologies. Also, we will be under pressure to improve our understanding of direct-connect Internet and related communications.
In putting the company together, we have attempted to offer enough services to allow us to always be in demand by our clients. However, technological developments have provided us with a new era of opportunities for the various organizations in which we can only guess at the needs. For example, current rapid innovations/development of Wireless Application Protocol (WAP) technology presents an opportunity to be realized, particularly focusing on WAP-enabled cell phones that allow individuals to access or send email messages on a cell phone. However, the most important factor in developing future services will be market need. Our understanding of the needs of our target market segments will be one of our competitive advantages.
Market Analysis Summary
The current drive and emphasis by the government on diversification of the industrial base away from the minerals sector presents an opportunity for I Tech Solutions to make a valuable contribution towards achieving this goal. This will result in the implementation of modern Information Technology (IT) services and techniques, transfer of knowledge, and availability of quality brands.
4.1 Market Segmentation
We will be focusing on proactive, market seeking organizations that want to ensure an efficient and effective IT system that will assist in the realization of their business objectives.
Our target companies are large enough to require the high-quality IT management we offer, but too small to have a separate computer management staff. However, our most important group of potential customers will be business executives in large, medium, and small corporations. These are marketing managers, general managers, sales managers, and other decision makers who often need to access company data and information in their various business decisions. They will not waste their time or money looking for bargain information, questionable expertise, or cheap computers and accessories. Our potential clients will include: (discussion omitted).
Another intention will be to offer an attractive development alternative to the company that is management constrained and unable to address opportunities in new markets and new market segments, due to technological shortfalls.

| Market Analysis | |||||||
| Year 1 | Year 2 | Year 3 | Year 4 | Year 5 | |||
| Potential Customers | Growth | CAGR | |||||
| SOHO Executives | 3% | 100 | 103 | 106 | 109 | 112 | 2.87% |
| Government Institutions | 12% | 800 | 896 | 1,004 | 1,124 | 1,259 | 12.00% |
| Financial Institutions | 17% | 50 | 59 | 69 | 81 | 95 | 17.41% |
| Corporations | 22% | 3,000 | 3,660 | 4,465 | 5,447 | 6,645 | 22.00% |
| Professional Firms | 3% | 400 | 412 | 424 | 437 | 450 | 2.99% |
| Other | 4% | 200 | 208 | 216 | 225 | 234 | 4.00% |
| Total | 17.91% | 4,550 | 5,338 | 6,284 | 7,423 | 8,795 | 17.91% |
4.2 Target Market Segment Strategy
Our marketing strategy will be based mainly on making the right service(s) available to the right target customer. We will ensure that our products and services’ prices take customers’ budgets into consideration, and that these people appreciate the product/service and know that it exists, including where to find it. One of our intentions will be to target those innovative or proactive companies contemplating transferring a part of their marketing activities on the Internet, in order to benefit from the advantages offered by this unique system of communication. We realize the need to focus our marketing message and our service offerings.
4.2.1 Market Needs
Since our target market is the product and service seeker, the most important market needs are support, service, training, and installation, in that order. One of the key points of our strategy will be the focus on target segments that know and understand these needs and are willing to pay to have them filled. We realize that all personal computer users need support and service. Many of our target customers are going to be those who cannot get good products or services from the major vendors who focus on high volume orders only.
Our target businesses are dependent on reliable information technology. They use the computers for a complete range of functions, beginning with the core administration information such as accounting and record entry, communications, and personal productivity. They are not, however, large enough to have dedicated computer personnel such as the Management Information System (MIS) departments in large businesses.
4.2.2 Market Trends
The most obvious trend in the market is the increasing number of IT firms on the market. This has been true for years, but the trend seems to be accelerating. We see the major brand-name manufacturers being established on the market mainly through agents. Secondly, the computer has become a basic necessity in the office environment and business set-up. The vast improvements in computer power and storage, means that owners are mandated to up-grade or buy new and improved systems, with the former often being much cheaper. A third trend is ever-greater connectivity. Everybody wants to be on the Internet, and every office is looking at having a LAN. However, the major stumbling block for the majority of theses companies is the high cost of installing such networks.
4.3 Service Business Analysis
The following sections provided discussions on who participates in the computer industry, what the competition provides, and what the customer has been purchasing.
4.3.1 Business Participants
We are part of the computer reselling business, which includes several kinds of businesses:
- Computer Dealers: Storefront computer resellers usually offer a minimum of software, and very little, if any service and support. They are concerned with moving as much stock as possible. Their prices are usually higher than the larger stores.
- Chain and Computer Stores: They often occupy a large area of space, decent walk-in service, and are often warehouse-like locations where people go to find products in boxes. They often however charge exorbitant prices for their brand products and maintenance service, if they provide any at all.
- Computer Consultants: These include consultancy companies that mainly specialize in the installation of new systems. Their consultant fees are often very high, especially for small- to medium-sized companies.
4.3.2 Competition and Buying Patterns
The vast majority of proactive, market-oriented businesses understand the value of having an efficient computer system, as well as the concept of service and support. They are much more likely to pay for them when the offering and benefits are clearly stated.
There is no doubt that we will compete more against the box pushers than other service providers. We need to effectively compete against the idea that once a computer is out-dated businesses should buy new ones, when with ongoing service and support, they can be upgraded.
The most important element of general competition, by far, is what it takes to keep clients for repeat business. It is worth making huge concessions in any single service to maintain a client relationship that brings the client back for future services.
Strategy and Implementation Summary
I Tech Solutions intends to win and maintain customers by providing products and services that add value, safety, and are supported by a well-trained professional team with commercial expertise. This is important to the successful implementation of our overall strategy and the need to ensure that all divisions and functions in the organization are working harmoniously towards attainment of the goals and objectives.
Our marketing strategy emphasizes focus. The target customers will include key decision-makers in business, who often order or recommend on behalf of the whole organization, the aim being to obtain an initial order and fully satisfy the customer from then on.
- We intend to initially build image and awareness through consistency and distinctiveness in our product and service provision.
- We intend to focus on delivering quality products and services that produce good referrals, which can then generate revenue. We intend to have a heavy personal selling component, supported by regular advertising we will always be active in our personal relationships with clients and strategic allies, keeping abreast of their needs and wants.
- We are focusing advertising on several key media.
We intend to achieve growth by creating a more enthusiastic customer culture than that of our competitors. The strategy is to grow the business by nurturing customers, differentiating the product/service offering through service and staff behavior.
Through the implementation of a fair, effective, and competitive remuneration policy we intend to optimize our human resource output and advancement. We need the right people in the right place at the right time if we are to ensure optimum growth. We intend to develop our team so that our people can grow as the company grows–a mutually beneficial relationship.
5.1 SWOT Analysis
The SWOT Analysis is a necessity to any start-up, it is an in-depth look at your Strengths, Weaknesses, Opportunities, and Threats. We are in a highly lucrative market in a growing economy. We foresee our strengths as the ability to respond to the market and to provide custom designed technological services. Our key personnel will have a wide and thorough knowledge of the technological services we intend to provide, which will go a long way towards penetrating the market. Below is a summary of the SWOT Analysis.
5.1.1 Weaknesses
- The introduction of new organizational practices and personnel who have not previously worked together presents a challenge to the organization.
- A limited financial base compared to the current major players in the IT industry.
5.1.2 Opportunities
- The Internet. The increasing opportunities of the Internet offer us another area of strength in comparison to the box-on-the-shelf major stores. Our potential customers want more help with the Internet, and we intend to be in a better position to give it to them.
- Service. As our target market needs more service, our competitors are less likely than ever to provide it. Their business model doesn’t include service, just selling the computers.
- Emerging Technologies. The rate of new product introduction in IT presents an opportunity to be explored.
5.1.3 Threats
- Innovation shortens life cycles and hence the need to act timeously on the market. This will recoup new service introductions in a shorter time frame.
- Concerns of decision-makers over ease of access and overall security of electronic transactions may need to be addressed. The recent glitch of the Barclays electronic system, which enabled some clients to access other account holders’ accounts while upgrading the system, proves the very realistic security concerns regarding the use of the Internet.
- The slow adoption rate of new technologies and products in these parts of the world does not bode well for our intended products and services.
5.1.4 Strengths
- Knowledge. Our competitors are retailers, pushing boxes. We know systems, networks, connectivity, programming, and data management.
- Relationship selling. We intend to get to know our customers, one by one. Our direct sales efforts will seek to maintain a relationship with our customers.
- Diversified market segments. The diversity of the products and services we intend to provide will ensure the lack of dependency on one particular market.
- Combination of skills in implementation. The management team intends to jointly develop business strategy and long-term plans with its strategic allies, having wide experience in their respective market and product know-how, and strong technical skills and business know-how.
5.2 Competitive Edge
Our competitive edge is our positioning as a strategic ally with our clients, who are clients more than customers. By building a business based on long-standing relationships with satisfied clients, we will simultaneously build defenses against competition. The longer the relationship stands, the more we help our clients understand what we offer them and why they need it. The delivery of whole, end-to-end solutions will have a significant impact on gaining commitment from the market at all levels. The company believes in partnering with its customers so as to provide customized solutions that are needs-based.
5.3 Marketing Strategy
One core element of our marketing strategy will be that of differentiation from our competitors. In terms of promotion, we intend to sell our company as a strategic ally, not just our products. We intend to offer extremely reasonable prices in comparison to competition, and we need to be able to sustain that. Market penetration through lower prices shall be undertaken where need be, while premium pricing in the case of the upper-end of the market.
We have developed two strategy foci, each based on one main fundamental strategy. The first strategy is about (discussion omitted).
Our second strategic focus, that of (discussion omitted).
5.3.1 Distribution Strategy
Service provision and consulting will be sold and purchased mainly on a word-of-mouth basis, with relationships and previous experience being, by far, the most important factor. In this regard we intend to provide a service that exceeds customer expectations so as to ensure they refer us to potential clients through word-of-mouth. New business shall be developed through industry associations, business associations, and, in some cases, social associations, such as country clubs.
5.3.2 Marketing Programs
Advertising
In view of the fact that we are new on the market, we intend to undertake extensive advertising of our name and products and services we offer. This is to instill awareness and knowledge of our existence in the marketplace, which shall convert into market share. We intend to advertise in business and IT magazines that are read by our target market and will ensure we are adequately exposed on the market. A constant lookout will be made of any special editions in these various publications, which may provide an opportunity for us to advertise our services and ourselves. Advertising will also be conducted through television, radio, newspapers/magazines, and the Internet. Sponsoring a technology discussion/call-in talk show is a possibility.
Personal Selling
Word of mouth is critical in this segment. We will have to make sure that once we gain a customer, we never lose him/her. To help accomplish this, we must work to establish and maintain relationships. Personal selling will be a powerful form of promotion due to the fact that its flexibility will enable us to match the customer’s needs to specific attributes of our services, as well as giving concise details of what we are able to offer.
Public Relations
Recognizing that we are relatively new on the market, there will be a need to organize an event introducing ourselves onto the market. To this we will invite potential customers, senior officials, possibly including a government minister and other stakeholders, so as to penetrate the market. In collaboration with this we, also intend to place news stories and features in magazines and newspapers to keep stakeholders updated on the latest developments and to increase awareness.
Events
The number of IT companies on the market dictates that the organization needs to promote itself through participation in trade shows and expositions. Not only will these increase awareness of our products and services, but if a particular product or service were to gain recognition, for example through being chosen No. 1 in innovativeness, the organization will be able to take advantage of this in all its promotional campaigns, adding leverage to its reputation and corporate image. An example of a trade show we intend to participate at is BITEC. These expositions will also be a good opportunity for us to network with various organizations and individuals.
Internet Marketing
The company will sell its services over the Internet as it is cost effective to reach a large number of potential clients, regionally and internationally. We also realize that customer/client research is needed before building an effective website, something which is rarely done by existing companies, in order to find out how customers will want to access information and journey through the site.
5.3.3 Positioning Statement
I Tech Solutions will position itself as a reliable solutions provider and trusted strategic ally who makes sure systems work, people are comfortable and conversant with the system, and down time is minimal. Unlike the other vendors/retail stores, we intend to know the customer and go to his or her site when needed, offering proactive support, service, training, and installation. In addition, I Tech Solutions is an ally to our clients’ businesses, and offers them a full range of services, from installation to support.
5.3.4 Pricing Strategy
We must charge appropriately for the high-end, high-quality service and support we offer. Our revenue structure has to match our cost structure, so the salaries we pay to assure good service and support must be balanced by the revenue we charge. Therefore, we must make sure that we deliver and charge for service and support. Training, service, installation, and networking support–all of this must be readily available and priced to sell and deliver revenue. We will charge (discussion omitted). This will ensure we penetrate the market upon entry.
5.3.5 Promotion Strategy
Our promotion strategy will be based primarily on informing potential customers of our existence and making the right information available to our target customer. I Tech Solutions intends to utilize an aggressive promotional campaign to introduce its products and services to the market. The intention will be to take advantage of several media sources in announcing the products and services and in the process enforcing awareness of our existence.
5.4 Sales Strategy
I Tech Solutions will receive its revenue streams from a combination of licensing agreements, sales commissions, monthly subscriptions, registration fees, network access charges, service fees, transaction charges, training, promotional incentive programs, and sales of hardware and software. The derived value of I Tech Solutions will come from the key partnerships established and developed in order to deliver a product and service provision of transactionally-based activities, providing opportunity to build brand and loyalty, around which relationship marketing will play a key role.
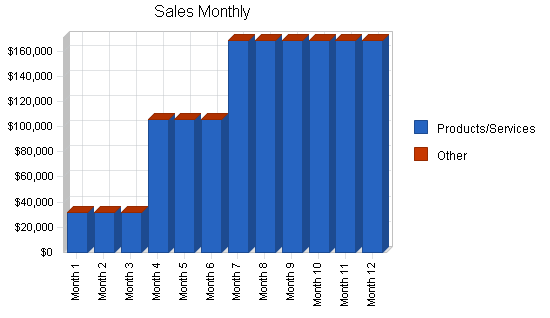
The sales forecast monthly summary is included in the appendix. The annual sales projections are provided in a table below. It should be noted that as we become established and known on the market we project sales to increase at a faster rate than the initial year.
Note: All currency values in the charts and tables are expressed in the Botswana Pula (P).

| Sales Forecast | |||
| Year 1 | Year 2 | Year 3 | |
| Sales | |||
| Products/Services | P1,422,225 | P2,528,400 | P3,034,080 |
| Other | P0 | P0 | P0 |
| Total Sales | P1,422,225 | P2,528,400 | P3,034,080 |
| Direct Cost of Sales | Year 1 | Year 2 | Year 3 |
| Products/Services | P711,114 | P1,264,200 | P1,517,040 |
| Other | P0 | P0 | P0 |
| Subtotal Direct Cost of Sales | P711,114 | P1,264,200 | P1,517,040 |
5.5 Strategic Alliances
I Tech Solutions intends to go into strategic alliances with several organizations. This will also reassure our customers that they are investing in “winning” products, technology, and service that are maintainable, flexible, and scalable enough to meet future demands.
At this writing, strategic alliances with several companies are possibilities, including X, given the content of existing interest and discussions. By going into strategic partnerships with suitable organizations, we will benefit from being able to concentrate on our core activities in the delivery of our products and services to the end-user, while ensuring that we do not have to compromise on quality of execution or the number of products and services we are able to deliver.
Management Summary
The human resources element shall be an essential component in the delivery of the total service. By having enthusiastic, capable, and empowered people interacting with our clients, we intend to build the competitive advantage of being able to comprehensively meet our clients’ needs. We also intend to give our teams enough leverage in decision-making to ensure that clients are handled promptly and to reduce lead-time in actual delivery of the service. It will be necessary to evaluate jobs and remuneration packages against market benchmarks to employees for their tasks to ensure they are competitive.
6.1 Organizational Structure
Our management philosophy is based on responsibility and mutual respect. We recognize the need to be constantly changing so as to adapt to the prevailing environment. We will have a flexible structure allowing for the above to be undertaken swiftly and smoothly. Please find below the job titles and descriptions we intend to have in place for the key personnel. (table omitted)
6.2 Management Team
In a highly volatile industry with increasing competition, we recognize the need to be constantly changing to adapt to the prevailing environment. The management team extensive expertise and a broad knowledge of the products/services and markets, which, if well planned, will enable the business to realize its goals and objectives.
(profiles omitted)
The management style will reflect the participation of the shareholders. The company will respect its community and treat all employees well. We will develop and nurture the company as a community. We will not be hierarchical, especially considering the rate of change in our industry, which makes it mandatory for us to be highly flexible. Management’s ongoing initiatives to drive sales, market share and productivity will provide additional impetus.
6.3 Personnel Plan
The detailed monthly personnel plan for the first three years is included in the appendix. The annual personnel estimates are included here. We believe this plan is a fair compromise between fairness and expedience, and meets the commitments of our mission statement. We want the company to stay lean and flexible so that we can respond to our markets’ needs quickly. As we expand and increase in size we do expect to increase our personnel.
We will compensate our personnel well, so as to retain their invaluable expertise and ensure job satisfaction and enrichment through delegation of authority. Our compensation will include health care, generous profit sharing, and a minimum of 3 weeks vacation.
Note: All currency values in the charts and tables are expressed in the Botswana Pula (P).
| Personnel Plan | |||
| Year 1 | Year 2 | Year 3 | |
| Directors | P135,000 | P180,000 | P216,000 |
| Personal Assistant | P10,800 | P13,200 | P14,520 |
| Cleaner | P3,600 | P6,000 | P7,200 |
| Total People | 5 | 5 | 5 |
| Total Payroll | P149,400 | P199,200 | P237,720 |
6.4 Training
In-house training shall be continuous with regular external training being undertaken, particularly following any new developments in the market. This is to ensure that we are continuously able to anticipate our markets needs–a proactive approach, which is so essential if we are to gain and maintain a competitive advantage. External training will also be conducted to ensure we are aware of the latest products and technology. This will also ensure that our personnel are able to set high standards, or benchmark, using these organizations standards.
6.5 Feedback and Control
(a) We will encourage our employees to put forward any suggestions they might have regarding the improvement of any of the company’s functions–an open door philosophy. Such a culture will enhance innovativeness and creativity in turn leading to job satisfaction and enrichment.
(b) We undertake to continuously formalize and measure cross-functional working communication so as to ensure that the various departments work harmoniously towards attainment of corporate objectives
(c) Important notices and developments will be continuously communicated to employees so as to keep them abreast of developments and promoting a sense of belonging and oneness in the organization.
Financial Plan
We want to finance growth mainly through cash flow and equity. We recognize that this means we will have to grow more slowly than we might like. The most important factor in our case is collection days. We can’t push our clients hard on collection days, because they are in larger companies and will normally have marketing authority, not financial authority. Therefore we need to develop a permanent system of receivables financing, using one of the established accounting systems. In turn we intend to ensure that our investors are compatible with our growth plan, management style, and vision. Compatibility in this regard means:
- A fundamental respect for giving our customers value, and for maintaining a healthy and congenial workplace
- Respect for realistic forecasts, conservative cash flow, and financial management
- Cash flow as first priority, growth second, profits third
- Willingness to follow the project objectives and contribute valuable input to strategy and implementation decisions.
Of these, only the last 2 are flexible.
7.1 Break-even Analysis
The following table and chart summarizes our Break-even Analysis. We don’t really expect to reach break-even until several months into the business operation, as illustrated in the financials.
Note: All currency values in the charts and tables are expressed in the Botswana Pula (P).

| Break-even Analysis | |
| Monthly Revenue Break-even | P47,662 |
| Assumptions: | |
| Average Percent Variable Cost | 50% |
| Estimated Monthly Fixed Cost | P23,831 |
7.2 Important Assumptions
The financial plan depends on important assumptions. From the beginning, we recognize that collection days are critical, but not a factor we can influence easily. Interest rates, tax rates, and personnel burden are based on conservative assumptions.
Some of the more important underlying assumptions are:
- We assume a strong economy, without major recession.
- We assume that there are no unforeseen changes in economic policy to make our products and service immediately obsolete.
Others include 30-day average collection days, sales entirely on invoice basis, including a favorable deposit policy, expenses mainly on a net 30-day basis, 30 days on average for payment of invoices, and present-day interest rates.
| General Assumptions | |||
| Year 1 | Year 2 | Year 3 | |
| Plan Month | 1 | 2 | 3 |
| Current Interest Rate | 17.00% | 17.00% | 17.00% |
| Long-term Interest Rate | 17.00% | 17.00% | 17.00% |
| Tax Rate | 25.42% | 25.00% | 25.42% |
| Other | 0 | 0 | 0 |
7.3 Key Financial Indicators
We foresee major growth in sales and operating expenses, and a bump in our collection days as we spread the business during expansion.
Collection days are very important. We do not want to let our average collection days get above 30 under any circumstances. This could cause a serious problem with cash flow, because our working capital situation is chronically tight. However, we recognize that we cannot control this factor easily, because of the relationship with our clients.

7.4 Projected Profit and Loss
Initial marketing and training expenses will be relatively high as we seek to become known on the market and staff get trained in provision of our services. This will be brought about by the development of sales literature, advertising expenses, and function expenses. As our market share increases and capital is generated, further marketing programs and the expansion of those in existence at the time will be undertaken, to ensure market development. However, with time, these programs will start generating revenue for the business, which we shall reinvest.
Our projected Profit and Loss is shown in the appendix, with sales increasing steadily from the first year through the second, and into the third year. We do expect to more than break-even in the first year of operation. Our cost of sales should be much lower, and gross margin higher, than in this projection.
Note: All currency values in the charts and tables are expressed in the Botswana Pula (P).


| Pro Forma Profit and Loss | |||
| Year 1 | Year 2 | Year 3 | |
| Sales | P1,422,225 | P2,528,400 | P3,034,080 |
| Direct Cost of Sales | P711,114 | P1,264,200 | P1,517,040 |
| Other | P0 | P0 | P0 |
| Total Cost of Sales | P711,114 | P1,264,200 | P1,517,040 |
| Gross Margin | P711,111 | P1,264,200 | P1,517,040 |
| Gross Margin % | 50.00% | 50.00% | 50.00% |
| Expenses | |||
| Payroll | P149,400 | P199,200 | P237,720 |
| Sales and Marketing and Other Expenses | P95,772 | P154,140 | P182,196 |
| Depreciation | P0 | P0 | P0 |
| Utilities | P3,600 | P3,960 | P4,356 |
| Telephone | P6,000 | P6,600 | P7,260 |
| Insurance | P14,400 | P15,840 | P17,424 |
| Rent | P16,800 | P18,480 | P20,328 |
| Insurance | P0 | P0 | P0 |
| Payroll Taxes | P0 | P0 | P0 |
| Other | P0 | P0 | P0 |
| Total Operating Expenses | P285,972 | P398,220 | P469,284 |
| Profit Before Interest and Taxes | P425,139 | P865,980 | P1,047,756 |
| EBITDA | P425,139 | P865,980 | P1,047,756 |
| Interest Expense | P92,497 | P75,684 | P58,140 |
| Taxes Incurred | P82,612 | P197,574 | P251,527 |
| Net Profit | P250,030 | P592,722 | P738,089 |
| Net Profit/Sales | 17.58% | 23.44% | 24.33% |
7.5 Projected Cash Flow
The chart and table below present the cash flow projections for I Tech Solutions.
Note: All currency values in the charts and tables are expressed in the Botswana Pula (P).

| Pro Forma Cash Flow | |||
| Year 1 | Year 2 | Year 3 | |
| Cash Received | |||
| Cash from Operations | |||
| Cash Sales | P426,668 | P758,520 | P910,224 |
| Cash from Receivables | P763,507 | P1,589,396 | P2,041,349 |
| Subtotal Cash from Operations | P1,190,174 | P2,347,916 | P2,951,573 |
| Additional Cash Received | |||
| Sales Tax, VAT, HST/GST Received | P0 | P0 | P0 |
| New Current Borrowing | P0 | P0 | P0 |
| New Other Liabilities (interest-free) | P0 | P0 | P0 |
| New Long-term Liabilities | P0 | P0 | P0 |
| Sales of Other Current Assets | P0 | P0 | P0 |
| Sales of Long-term Assets | P0 | P0 | P0 |
| New Investment Received | P0 | P0 | P0 |
| Subtotal Cash Received | P1,190,174 | P2,347,916 | P2,951,573 |
| Expenditures | Year 1 | Year 2 | Year 3 |
| Expenditures from Operations | |||
| Cash Spending | P149,400 | P199,200 | P237,720 |
| Bill Payments | P1,002,379 | P1,773,057 | P2,068,003 |
| Subtotal Spent on Operations | P1,151,779 | P1,972,257 | P2,305,723 |
| Additional Cash Spent | |||
| Sales Tax, VAT, HST/GST Paid Out | P0 | P0 | P0 |
| Principal Repayment of Current Borrowing | P0 | P0 | P0 |
| Other Liabilities Principal Repayment | P0 | P0 | P0 |
| Long-term Liabilities Principal Repayment | P103,200 | P103,200 | P103,200 |
| Purchase Other Current Assets | P141,200 | P0 | P0 |
| Purchase Long-term Assets | P240,000 | P0 | P0 |
| Dividends | P0 | P0 | P0 |
| Subtotal Cash Spent | P1,636,179 | P2,075,457 | P2,408,923 |
| Net Cash Flow | (P446,005) | P272,459 | P542,650 |
| Cash Balance | P46,246 | P318,705 | P861,356 |
7.6 Projected Balance Sheet
The balance sheet shows healthy growth of net worth, and strong financial position. The three-year estimates are included in the appendix.
Note: All currency values in the charts and tables are expressed in the Botswana Pula (P).
| Pro Forma Balance Sheet | |||
| Year 1 | Year 2 | Year 3 | |
| Assets | |||
| Current Assets | |||
| Cash | P46,246 | P318,705 | P861,356 |
| Accounts Receivable | P232,051 | P412,535 | P495,042 |
| Inventory | P92,708 | P164,814 | P197,777 |
| Other Current Assets | P141,200 | P141,200 | P141,200 |
| Total Current Assets | P512,205 | P1,037,254 | P1,695,374 |
| Long-term Assets | |||
| Long-term Assets | P240,000 | P240,000 | P240,000 |
| Accumulated Depreciation | P0 | P0 | P0 |
| Total Long-term Assets | P240,000 | P240,000 | P240,000 |
| Total Assets | P752,205 | P1,277,254 | P1,935,374 |
| Liabilities and Capital | Year 1 | Year 2 | Year 3 |
| Current Liabilities | |||
| Accounts Payable | P113,124 | P148,651 | P171,882 |
| Current Borrowing | P0 | P0 | P0 |
| Other Current Liabilities | P0 | P0 | P0 |
| Subtotal Current Liabilities | P113,124 | P148,651 | P171,882 |
| Long-term Liabilities | P496,800 | P393,600 | P290,400 |
| Total Liabilities | P609,924 | P542,251 | P462,282 |
| Paid-in Capital | P100,000 | P100,000 | P100,000 |
| Retained Earnings | (P207,749) | P42,281 | P635,003 |
| Earnings | P250,030 | P592,722 | P738,089 |
| Total Capital | P142,281 | P735,003 | P1,473,092 |
| Total Liabilities and Capital | P752,205 | P1,277,254 | P1,935,374 |
| Net Worth | P142,281 | P735,003 | P1,473,092 |
7.7 Business Ratios
The following table shows important ratios from the computer related services industry, as determined by the Standard Industry Classification (SIC) Index #7379, Computer Related Services.
| Ratio Analysis | ||||
| Year 1 | Year 2 | Year 3 | Industry Profile | |
| Sales Growth | 0.00% | 77.78% | 20.00% | 7.20% |
| Percent of Total Assets | ||||
| Accounts Receivable | 30.85% | 32.30% | 25.58% | 21.70% |
| Inventory | 12.32% | 12.90% | 10.22% | 3.50% |
| Other Current Assets | 18.77% | 11.05% | 7.30% | 46.70% |
| Total Current Assets | 68.09% | 81.21% | 87.60% | 71.90% |
| Long-term Assets | 31.91% | 18.79% | 12.40% | 28.10% |
| Total Assets | 100.00% | 100.00% | 100.00% | 100.00% |
| Current Liabilities | 15.04% | 11.64% | 8.88% | 51.40% |
| Long-term Liabilities | 66.05% | 30.82% | 15.00% | 19.10% |
| Total Liabilities | 81.08% | 42.45% | 23.89% | 70.50% |
| Net Worth | 18.92% | 57.55% | 76.11% | 29.50% |
| Percent of Sales | ||||
| Sales | 100.00% | 100.00% | 100.00% | 100.00% |
| Gross Margin | 50.00% | 50.00% | 50.00% | 0.00% |
| Selling, General & Administrative Expenses | 32.96% | 27.34% | 26.62% | 80.70% |
| Advertising Expenses | 0.97% | 0.42% | 0.38% | 1.20% |
| Profit Before Interest and Taxes | 29.89% | 34.25% | 34.53% | 1.70% |
| Main Ratios | ||||
| Current | 4.53 | 6.98 | 9.86 | 1.27 |
| Quick | 3.71 | 5.87 | 8.71 | 1.01 |
| Total Debt to Total Assets | 81.08% | 42.45% | 23.89% | 70.50% |
| Pre-tax Return on Net Worth | 233.79% | 107.52% | 67.18% | 3.50% |
| Pre-tax Return on Assets | 44.22% | 61.87% | 51.13% | 11.80% |
| Additional Ratios | Year 1 | Year 2 | Year 3 | |
| Net Profit Margin | 17.58% | 23.44% | 24.33% | n.a |
| Return on Equity | 175.73% | 80.64% | 50.10% | n.a |
| Activity Ratios | ||||
| Accounts Receivable Turnover | 4.29 | 4.29 | 4.29 | n.a |
| Collection Days | 56 | 66 | 78 | n.a |
| Inventory Turnover | 10.91 | 9.82 | 8.37 | n.a |
| Accounts Payable Turnover | 9.86 | 12.17 | 12.17 | n.a |
| Payment Days | 27 | 26 | 28 | n.a |
| Total Asset Turnover | 1.89 | 1.98 | 1.57 | n.a |
| Debt Ratios | ||||
| Debt to Net Worth | 4.29 | 0.74 | 0.31 | n.a |
| Current Liab. to Liab. | 0.19 | 0.27 | 0.37 | n.a |
| Liquidity Ratios | ||||
| Net Working Capital | P399,081 | P888,603 | P1,523,492 | n.a |
| Interest Coverage | 4.60 | 11.44 | 18.02 | n.a |
| Additional Ratios | ||||
| Assets to Sales | 0.53 | 0.51 | 0.64 | n.a |
| Current Debt/Total Assets | 15% | 12% | 9% | n.a |
| Acid Test | 1.66 | 3.09 | 5.83 | n.a |
| Sales/Net Worth | 10.00 | 3.44 | 2.06 | n.a |
| Dividend Payout | 0.00 | 0.00 | 0.00 | n.a |
Contingency Plan
- We intend to watch our results very carefully. We may need to concentrate less on certain products and services than others, if we intend to get the margin up or clients become difficult to attract. We might be able to avoid straight competition with the major IT companies by focusing more on our prime services.
- Another possibility is the introduction of a company or several companies in our niche. The need to undertake aggressive marketing, networking, and delivering a value-added service in our organization is a fundamental one.
Appendix
| Sales Forecast | |||||||||||||
| Month 1 | Month 2 | Month 3 | Month 4 | Month 5 | Month 6 | Month 7 | Month 8 | Month 9 | Month 10 | Month 11 | Month 12 | ||
| Sales | |||||||||||||
| Products/Services | 0% | P31,605 | P31,605 | P31,605 | P105,350 | P105,350 | P105,350 | P168,560 | P168,560 | P168,560 | P168,560 | P168,560 | P168,560 |
| Other | 0% | P0 | P0 | P0 | P0 | P0 | P0 | P0 | P0 | P0 | P0 | P0 | P0 |
| Total Sales | P31,605 | P31,605 | P31,605 | P105,350 | P105,350 | P105,350 | P168,560 | P168,560 | P168,560 | P168,560 | P168,560 | P168,560 | |
| Direct Cost of Sales | Month 1 | Month 2 | Month 3 | Month 4 | Month 5 | Month 6 | Month 7 | Month 8 | Month 9 | Month 10 | Month 11 | Month 12 | |
| Products/Services | P15,803 | P15,803 | P15,803 | P52,675 | P52,675 | P52,675 | P84,280 | P84,280 | P84,280 | P84,280 | P84,280 | P84,280 | |
| Other | P0 | P0 | P0 | P0 | P0 | P0 | P0 | P0 | P0 | P0 | P0 | P0 | |
| Subtotal Direct Cost of Sales | P15,803 | P15,803 | P15,803 | P52,675 | P52,675 | P52,675 | P84,280 | P84,280 | P84,280 | P84,280 | P84,280 | P84,280 | |
| Personnel Plan | |||||||||||||
| Month 1 | Month 2 | Month 3 | Month 4 | Month 5 | Month 6 | Month 7 | Month 8 | Month 9 | Month 10 | Month 11 | Month 12 | ||
| Directors | 0% | P7,500 | P7,500 | P7,500 | P7,500 | P7,500 | P7,500 | P15,000 | P15,000 | P15,000 | P15,000 | P15,000 | P15,000 |
| Personal Assistant | 0% | P900 | P900 | P900 | P900 | P900 | P900 | P900 | P900 | P900 | P900 | P900 | P900 |
| Cleaner | 0% | P300 | P300 | P300 | P300 | P300 | P300 | P300 | P300 | P300 | P300 | P300 | P300 |
| Total People | 5 | 5 | 5 | 5 | 5 | 5 | 5 | 5 | 5 | 5 | 5 | 5 | |
| Total Payroll | P8,700 | P8,700 | P8,700 | P8,700 | P8,700 | P8,700 | P16,200 | P16,200 | P16,200 | P16,200 | P16,200 | P16,200 | |
| General Assumptions | |||||||||||||
| Month 1 | Month 2 | Month 3 | Month 4 | Month 5 | Month 6 | Month 7 | Month 8 | Month 9 | Month 10 | Month 11 | Month 12 | ||
| Plan Month | 1 | 2 | 3 | 4 | 5 | 6 | 7 | 8 | 9 | 10 | 11 | 12 | |
| Current Interest Rate | 17.00% | 17.00% | 17.00% | 17.00% | 17.00% | 17.00% | 17.00% | 17.00% | 17.00% | 17.00% | 17.00% | 17.00% | |
| Long-term Interest Rate | 17.00% | 17.00% | 17.00% | 17.00% | 17.00% | 17.00% | 17.00% | 17.00% | 17.00% | 17.00% | 17.00% | 17.00% | |
| Tax Rate | 30.00% | 25.00% | 25.00% | 25.00% | 25.00% | 25.00% | 25.00% | 25.00% | 25.00% | 25.00% | 25.00% | 25.00% | |
| Other | 0 | 0 | 0 | 0 | 0 | 0 | 0 | 0 | 0 | 0 | 0 | 0 | |
| Pro Forma Profit and Loss | |||||||||||||
| Month 1 | Month 2 | Month 3 | Month 4 | Month 5 | Month 6 | Month 7 | Month 8 | Month 9 | Month 10 | Month 11 | Month 12 | ||
| Sales | P31,605 | P31,605 | P31,605 | P105,350 | P105,350 | P105,350 | P168,560 | P168,560 | P168,560 | P168,560 | P168,560 | P168,560 | |
| Direct Cost of Sales | P15,803 | P15,803 | P15,803 | P52,675 | P52,675 | P52,675 | P84,280 | P84,280 | P84,280 | P84,280 | P84,280 | P84,280 | |
| Other | P0 | P0 | P0 | P0 | P0 | P0 | P0 | P0 | P0 | P0 | P0 | P0 | |
| Total Cost of Sales | P15,803 | P15,803 | P15,803 | P52,675 | P52,675 | P52,675 | P84,280 | P84,280 | P84,280 | P84,280 | P84,280 | P84,280 | |
| Gross Margin | P15,802 | P15,802 | P15,802 | P52,675 | P52,675 | P52,675 | P84,280 | P84,280 | P84,280 | P84,280 | P84,280 | P84,280 | |
| Gross Margin % | 50.00% | 50.00% | 50.00% | 50.00% | 50.00% | 50.00% | 50.00% | 50.00% | 50.00% | 50.00% | 50.00% | 50.00% | |
| Expenses | |||||||||||||
| Payroll | P8,700 | P8,700 | P8,700 | P8,700 | P8,700 | P8,700 | P16,200 | P16,200 | P16,200 | P16,200 | P16,200 | P16,200 | |
| Sales and Marketing and Other Expenses | P6,300 | P2,100 | P2,100 | P7,368 | P7,368 | P7,368 | P10,528 | P10,528 | P10,528 | P10,528 | P10,528 | P10,528 | |
| Depreciation | P0 | P0 | P0 | P0 | P0 | P0 | P0 | P0 | P0 | P0 | P0 | P0 | |
| Utilities | P300 | P300 | P300 | P300 | P300 | P300 | P300 | P300 | P300 | P300 | P300 | P300 | |
| Telephone | P500 | P500 | P500 | P500 | P500 | P500 | P500 | P500 | P500 | P500 | P500 | P500 | |
| Insurance | P1,200 | P1,200 | P1,200 | P1,200 | P1,200 | P1,200 | P1,200 | P1,200 | P1,200 | P1,200 | P1,200 | P1,200 | |
| Rent | P1,400 | P1,400 | P1,400 | P1,400 | P1,400 | P1,400 | P1,400 | P1,400 | P1,400 | P1,400 | P1,400 | P1,400 | |
| Insurance | P0 | P0 | P0 | P0 | P0 | P0 | P0 | P0 | P0 | P0 | P0 | P0 | |
| Payroll Taxes | 0% | P0 | P0 | P0 | P0 | P0 | P0 | P0 | P0 | P0 | P0 | P0 | P0 |
| Other | P0 | P0 | P0 | P0 | P0 | P0 | P0 | P0 | P0 | P0 | P0 | P0 | |
| Total Operating Expenses | P18,400 | P14,200 | P14,200 | P19,468 | P19,468 | P19,468 | P30,128 | P30,128 | P30,128 | P30,128 | P30,128 | P30,128 | |
| Profit Before Interest and Taxes | (P2,598) | P1,602 | P1,602 | P33,207 | P33,207 | P33,207 | P54,152 | P54,152 | P54,152 | P54,152 | P54,152 | P54,152 | |
| EBITDA | (P2,598) | P1,602 | P1,602 | P33,207 | P33,207 | P33,207 | P54,152 | P54,152 | P54,152 | P54,152 | P54,152 | P54,152 | |
| Interest Expense | P8,378 | P8,256 | P8,135 | P8,013 | P7,891 | P7,769 | P7,647 | P7,525 | P7,404 | P7,282 | P7,160 | P7,038 | |
| Taxes Incurred | (P3,293) | (P1,664) | (P1,633) | P6,299 | P6,329 | P6,360 | P11,626 | P11,657 | P11,687 | P11,718 | P11,748 | P11,779 | |
| Net Profit | (P7,683) | (P4,991) | (P4,899) | P18,896 | P18,987 | P19,079 | P34,879 | P34,970 | P35,061 | P35,153 | P35,244 | P35,336 | |
| Net Profit/Sales | -24.31% | -15.79% | -15.50% | 17.94% | 18.02% | 18.11% | 20.69% | 20.75% | 20.80% | 20.85% | 20.91% | 20.96% | |
| Pro Forma Cash Flow | |||||||||||||
| Month 1 | Month 2 | Month 3 | Month 4 | Month 5 | Month 6 | Month 7 | Month 8 | Month 9 | Month 10 | Month 11 | Month 12 | ||
| Cash Received | |||||||||||||
| Cash from Operations | |||||||||||||
| Cash Sales | P9,482 | P9,482 | P9,482 | P31,605 | P31,605 | P31,605 | P50,568 | P50,568 | P50,568 | P50,568 | P50,568 | P50,568 | |
| Cash from Receivables | P0 | P737 | P22,124 | P22,124 | P23,844 | P73,745 | P73,745 | P75,220 | P117,992 | P117,992 | P117,992 | P117,992 | |
| Subtotal Cash from Operations | P9,482 | P10,219 | P31,605 | P53,729 | P55,449 | P105,350 | P124,313 | P125,788 | P168,560 | P168,560 | P168,560 | P168,560 | |
| Additional Cash Received | |||||||||||||
| Sales Tax, VAT, HST/GST Received | 0.00% | P0 | P0 | P0 | P0 | P0 | P0 | P0 | P0 | P0 | P0 | P0 | P0 |
| New Current Borrowing | P0 | P0 | P0 | P0 | P0 | P0 | P0 | P0 | P0 | P0 | P0 | P0 | |
| New Other Liabilities (interest-free) | P0 | P0 | P0 | P0 | P0 | P0 | P0 | P0 | P0 | P0 | P0 | P0 | |
| New Long-term Liabilities | P0 | P0 | P0 | P0 | P0 | P0 | P0 | P0 | P0 | P0 | P0 | P0 | |
| Sales of Other Current Assets | P0 | P0 | P0 | P0 | P0 | P0 | P0 | P0 | P0 | P0 | P0 | P0 | |
| Sales of Long-term Assets | P0 | P0 | P0 | P0 | P0 | P0 | P0 | P0 | P0 | P0 | P0 | P0 | |
| New Investment Received | P0 | P0 | P0 | P0 | P0 | P0 | P0 | P0 | P0 | P0 | P0 | P0 | |
| Subtotal Cash Received | P9,482 | P10,219 | P31,605 | P53,729 | P55,449 | P105,350 | P124,313 | P125,788 | P168,560 | P168,560 | P168,560 | P168,560 | |
| Expenditures | Month 1 | Month 2 | Month 3 | Month 4 | Month 5 | Month 6 | Month 7 | Month 8 | Month 9 | Month 10 | Month 11 | Month 12 | |
| Expenditures from Operations | |||||||||||||
| Cash Spending | P8,700 | P8,700 | P8,700 | P8,700 | P8,700 | P8,700 | P16,200 | P16,200 | P16,200 | P16,200 | P16,200 | P16,200 | |
| Bill Payments | P1,599 | P47,302 | P27,893 | P30,821 | P116,958 | P77,660 | P80,061 | P151,085 | P117,387 | P117,296 | P117,204 | P117,113 | |
| Subtotal Spent on Operations | P10,299 | P56,002 | P36,593 | P39,521 | P125,658 | P86,360 | P96,261 | P167,285 | P133,587 | P133,496 | P133,404 | P133,313 | |
| Additional Cash Spent | |||||||||||||
| Sales Tax, VAT, HST/GST Paid Out | P0 | P0 | P0 | P0 | P0 | P0 | P0 | P0 | P0 | P0 | P0 | P0 | |
| Principal Repayment of Current Borrowing | P0 | P0 | P0 | P0 | P0 | P0 | P0 | P0 | P0 | P0 | P0 | P0 | |
| Other Liabilities Principal Repayment | P0 | P0 | P0 | P0 | P0 | P0 | P0 | P0 | P0 | P0 | P0 | P0 | |
| Long-term Liabilities Principal Repayment | P8,600 | P8,600 | P8,600 | P8,600 | P8,600 | P8,600 | P8,600 | P8,600 | P8,600 | P8,600 | P8,600 | P8,600 | |
| Purchase Other Current Assets | P0 | P0 | P141,200 | P0 | P0 | P0 | P0 | P0 | P0 | P0 | P0 | P0 | |
| Purchase Long-term Assets | P20,000 | P20,000 | P20,000 | P20,000 | P20,000 | P20,000 | P20,000 | P20,000 | P20,000 | P20,000 | P20,000 | P20,000 | |
| Dividends | P0 | P0 | P0 | P0 | P0 | P0 | P0 | P0 | P0 | P0 | P0 | P0 | |
| Subtotal Cash Spent | P38,899 | P84,602 | P206,393 | P68,121 | P154,258 | P114,960 | P124,861 | P195,885 | P162,187 | P162,096 | P162,004 | P161,913 | |
| Net Cash Flow | (P29,418) | (P74,383) | (P174,788) | (P14,393) | (P98,809) | (P9,610) | (P548) | (P70,097) | P6,373 | P6,464 | P6,556 | P6,647 | |
| Cash Balance | P462,833 | P388,450 | P213,662 | P199,269 | P100,460 | P90,850 | P90,303 | P20,206 | P26,579 | P33,043 | P39,599 | P46,246 | |
| Pro Forma Balance Sheet | |||||||||||||
| Month 1 | Month 2 | Month 3 | Month 4 | Month 5 | Month 6 | Month 7 | Month 8 | Month 9 | Month 10 | Month 11 | Month 12 | ||
| Assets | Starting Balances | ||||||||||||
| Current Assets | |||||||||||||
| Cash | P492,251 | P462,833 | P388,450 | P213,662 | P199,269 | P100,460 | P90,850 | P90,303 | P20,206 | P26,579 | P33,043 | P39,599 | P46,246 |
| Accounts Receivable | P0 | P22,124 | P43,510 | P43,510 | P95,131 | P145,032 | P145,032 | P189,279 | P232,051 | P232,051 | P232,051 | P232,051 | P232,051 |
| Inventory | P0 | P17,383 | P17,383 | P17,383 | P57,943 | P57,943 | P57,943 | P92,708 | P92,708 | P92,708 | P92,708 | P92,708 | P92,708 |
| Other Current Assets | P0 | P0 | P0 | P141,200 | P141,200 | P141,200 | P141,200 | P141,200 | P141,200 | P141,200 | P141,200 | P141,200 | P141,200 |
| Total Current Assets | P492,251 | P502,340 | P449,343 | P415,755 | P493,543 | P444,635 | P435,025 | P513,490 | P486,165 | P492,538 | P499,002 | P505,558 | P512,205 |
| Long-term Assets | |||||||||||||
| Long-term Assets | P0 | P20,000 | P40,000 | P60,000 | P80,000 | P100,000 | P120,000 | P140,000 | P160,000 | P180,000 | P200,000 | P220,000 | P240,000 |
| Accumulated Depreciation | P0 | P0 | P0 | P0 | P0 | P0 | P0 | P0 | P0 | P0 | P0 | P0 | P0 |
| Total Long-term Assets | P0 | P20,000 | P40,000 | P60,000 | P80,000 | P100,000 | P120,000 | P140,000 | P160,000 | P180,000 | P200,000 | P220,000 | P240,000 |
| Total Assets | P492,251 | P522,340 | P489,343 | P475,755 | P573,543 | P544,635 | P555,025 | P653,490 | P646,165 | P672,538 | P699,002 | P725,558 | P752,205 |
| Liabilities and Capital | Month 1 | Month 2 | Month 3 | Month 4 | Month 5 | Month 6 | Month 7 | Month 8 | Month 9 | Month 10 | Month 11 | Month 12 | |
| Current Liabilities | |||||||||||||
| Accounts Payable | P0 | P46,373 | P26,966 | P26,878 | P114,370 | P75,074 | P74,986 | P147,172 | P113,477 | P113,389 | P113,300 | P113,212 | P113,124 |
| Current Borrowing | P0 | P0 | P0 | P0 | P0 | P0 | P0 | P0 | P0 | P0 | P0 | P0 | P0 |
| Other Current Liabilities | P0 | P0 | P0 | P0 | P0 | P0 | P0 | P0 | P0 | P0 | P0 | P0 | P0 |
| Subtotal Current Liabilities | P0 | P46,373 | P26,966 | P26,878 | P114,370 | P75,074 | P74,986 | P147,172 | P113,477 | P113,389 | P113,300 | P113,212 | P113,124 |
| Long-term Liabilities | P600,000 | P591,400 | P582,800 | P574,200 | P565,600 | P557,000 | P548,400 | P539,800 | P531,200 | P522,600 | P514,000 | P505,400 | P496,800 |
| Total Liabilities | P600,000 | P637,773 | P609,766 | P601,078 | P679,970 | P632,074 | P623,386 | P686,972 | P644,677 | P635,989 | P627,300 | P618,612 | P609,924 |
| Paid-in Capital | P100,000 | P100,000 | P100,000 | P100,000 | P100,000 | P100,000 | P100,000 | P100,000 | P100,000 | P100,000 | P100,000 | P100,000 | P100,000 |
| Retained Earnings | (P207,749) | (P207,749) | (P207,749) | (P207,749) | (P207,749) | (P207,749) | (P207,749) | (P207,749) | (P207,749) | (P207,749) | (P207,749) | (P207,749) | (P207,749) |
| Earnings | P0 | (P7,683) | (P12,674) | (P17,573) | P1,322 | P20,309 | P39,388 | P74,267 | P109,237 | P144,298 | P179,451 | P214,695 | P250,030 |
| Total Capital | (P107,749) | (P115,432) | (P120,423) | (P125,322) | (P106,427) | (P87,440) | (P68,361) | (P33,482) | P1,488 | P36,549 | P71,702 | P106,946 | P142,281 |
| Total Liabilities and Capital | P492,251 | P522,340 | P489,343 | P475,755 | P573,543 | P544,635 | P555,025 | P653,490 | P646,165 | P672,538 | P699,002 | P725,558 | P752,205 |
| Net Worth | (P107,749) | (P115,432) | (P120,423) | (P125,322) | (P106,427) | (P87,440) | (P68,361) | (P33,482) | P1,488 | P36,549 | P71,702 | P106,946 | P142,281 |


