
Eagle Computers
Executive Summary
Eagle Computers is a one-stop shop for IBM-compatible computer users. We are located in the center of Kailua-Kona, on the Big Island of Hawaii. Our location is a major asset, as it is accessible to both the largest concentration of the local community as well as tourism to the island. We will offer a wide selection of latest-technology computer hardware, custom-built computer systems, computer service, computer rentals by the hour, and networking services. We are dedicated to providing consistently high client satisfaction by rendering excellent service, carrying items that are not locally available, and furnishing a warm, pleasant atmosphere at a competitive price. Our work environment will be one of respect for our clients and our community.
The timing is right for starting this new venture. Our target area is the North Kona and South Kona districts of Hawaii County. Presently, there is only one other computer store in these districts that handles IBM-compatible computers, and that store focuses primarily on computer service, not hardware sales. We have polled the Kona community and have received an overwhelming response that there is a definite need for a more comprehensive resource for computer sales and service in our target area. We will offer solutions to the community not provided by any of our competitors. With over 13 years of experience in the computer industry, information industry, management and retail, Jim and Judy Johnson have the skills necessary to make this venture extremely successful and profitable.
To achieve our objectives, Eagle Computers is seeking a start-up loan. This loan will be paid back from the cash flow of the business within ten years, collateralized by the assets of the company, backed by personal integrity, experience, and a contractual guarantee from the owners. This loan will be used to purchase inventory, increase working capital, and assist in start-up costs.
1.1 Objectives
The objectives for Eagle Computers are outlined below:
- To create a service-based company whose goal is to exceed customer’s expectations.
- Sales increase to over a quarter-million dollars by end of second year and increase modestly in the third year.
- To increase the number of customers serviced by at least 20% per year through superior performance and word-of mouth referrals.
- Have a customer return rate of 90% by end of first year.
- Become an established community destination by end of first year.
1.2 Mission
To provide the West Hawaii community with quality brand-name products, computer and networking solutions, reliable and professional technical support, and unparalleled customer service through the application of the principles of kina`ole and heartfelt aloha, and to earn a fair profit for our employee-owners and stakeholders by embracing sound, ethical business practices.
1.3 Keys to Success
The keys to success in our business are:
- Superior Customer Service: provide reliable, high-quality service and products, and an expedient turn-around time on repairs.
- Environment: provide a clean, friendly, and comfortable environment conducive to giving professional trusting service.
- Convenience: offering clients a wide selection of computer products and services in one environment; including custom-built computers, computer diagnosis and repair, networking, and in-store computer stations where clients can buy time to browse the Internet, check e-mail, and download their digital photos from their camera memory cards onto discs.
- Location: provide an easily accessible location for customer convenience.
- Reputation: credibility, integrity, and 100% dedication from 13+ years of experience in the computer industry.
Company Summary
Eagle Computers will sell and service IBM-compatible computers to the West Hawaii community. It will also offer custom-built computers, networking solutions, and in-store computer stations where customers can buy time to browse the Internet, check e-mail, and download their digital photos from their camera memory cards onto discs. What will set Eagle Computers apart from the competition is providing our customers all this in one convenient location, our dedication to excellent customer service, and an expedient turn-around time on repairs.
2.1 Company Ownership
Eagle Computers will be created as an Hawaii Limited Liability Company (LLC) based in Hawaii County, and privately co-owned by Jim Johnson and his wife, Judy Johnson. Jim has 13 years experience in the computer industry. He was co-owner of Eagle Computers in Phoenix Arizona until he moved out of Arizona to live in Hawaii. Jim is a computer technician and also has many years of management and retail experience.
Judy Johnson has 5 years of experience in the information technology industry. She was most recently employed by Wilmer Communications, which is a nationwide provider of DSL service (high speed Internet access). Judy also has management experience and extensive retail experience.
2.2 Start-up Summary
The start-up costs are to be financed by the direct owner investment. The cost, expense, and investment details are included in the following tables and chart.

| Start-up Funding | |
| Start-up Expenses to Fund | $7,975 |
| Start-up Assets to Fund | $12,025 |
| Total Funding Required | $20,000 |
| Assets | |
| Non-cash Assets from Start-up | $10,000 |
| Cash Requirements from Start-up | $2,025 |
| Additional Cash Raised | $0 |
| Cash Balance on Starting Date | $2,025 |
| Total Assets | $12,025 |
| Liabilities and Capital | |
| Liabilities | |
| Current Borrowing | $0 |
| Long-term Liabilities | $0 |
| Accounts Payable (Outstanding Bills) | $0 |
| Other Current Liabilities (interest-free) | $0 |
| Total Liabilities | $0 |
| Capital | |
| Planned Investment | |
| Jim & Judy Johnson | $20,000 |
| Investor 2 | $0 |
| Other | $0 |
| Additional Investment Requirement | $0 |
| Total Planned Investment | $20,000 |
| Loss at Start-up (Start-up Expenses) | ($7,975) |
| Total Capital | $12,025 |
| Total Capital and Liabilities | $12,025 |
| Total Funding | $20,000 |
| Start-up | |
| Requirements | |
| Start-up Expenses | |
| Business License & Legal | $1,200 |
| Stationery etc. | $100 |
| Brochures | $25 |
| Consultants | $0 |
| Insurance | $150 |
| Rent | $0 |
| Rental Deposit | $1,300 |
| Research and Development | $0 |
| Expensed Equipment | $0 |
| Display Shelving * | $500 |
| Display for Custom-built Systems | $400 |
| Display Cabinet * | $450 |
| Main Store Sign | $75 |
| Store Signs for Windows | $125 |
| Installed Security System | $1,200 |
| Storage Shelving for Inventory | $50 |
| Workstations (4) | $200 |
| Workstation Monitors (4) | $400 |
| 2 Additional Circuits for 4 Total Outlets | $600 |
| Carpet | $1,100 |
| Painting | $100 |
| Other | $0 |
| Total Start-up Expenses | $7,975 |
| Start-up Assets | |
| Cash Required | $2,025 |
| Start-up Inventory | $10,000 |
| Other Current Assets | $0 |
| Long-term Assets | $0 |
| Total Assets | $12,025 |
| Total Requirements | $20,000 |
Products and Services
Most people today use computers either at work or at home. It is important that people have a quality resource for buying and servicing those computers. Eagle Computers will provide the West Hawaii community with just such a quality resource – a one-stop shop for IBM-compatible computers. Eagle Computers will offer the following products and services with excellent customer service in a friendly, professional, and pleasant environment:
- Ready-to-Sell Computers – We will sell new and used computer systems in various price ranges that are already built and ready to be used.
- Custom-Built Computers – We will build and sell computer systems that are custom-designed according to the customer’s preferences.
- Service and Repairs -We will do full-service computer diagnosis and repairs with an emphasis on quality work within an expedient turn-around time.
- Upgrades – We will offer customers the latest technology available to upgrade the computers they already own.
- Networking – We will offer full networking solutions for both home and office, including wireless networking.
- Computer Rental Stations – We will have work-stations set up where customers can browse the Internet, check e-mail, and download their digital photos from their camera memory cards onto discs. These stations will be rented by the hour, but with no minimum time requirement. This will be useful to both tourists and the local community.
Market Analysis Summary
Eagle Computers will focus on markets on the West side of Hawaii, including consumers, small businesses and home offices (less than 10 employees), and tourists (mainly with the Computer Rental Stations).

Market research shows that customers on the West side of Hawaii County go to Kailua-Kona for their technological needs. Because of this, if a computer store is located in Kailua-Kona, the prime market is a 20-mile radius, within the North Kona and South Kona districts. Also, Kailua-Kona is the main center for tourism on the Big Island of Hawaii. Eagle Computers will be located in Kailua-Kona. The following demographics were gathered from the official Hawaii County website, the official Hawaii government website and the Kona-Kohala Chamber of Commerce:
- In 2000, the total resident population of Hawaii County was 148,677 and 25% of the population was located in the districts of North Kona and South Kona. In 2002, that residential population was estimated to be 154,794, which was an increase of 4.1%, or 2.05% per year. Based on those figures, in 2003 is estimated at 157,967.
- In 2000, there were 52,985 households in Hawaii, with an average of 2.75 people per household. Based on a population growth rate of 2.05% per year, there is estimated to be 56,243 households in in 2003.
- In 2000, 52.4% of Hawaii households had computers and 43% had Internet access.
- In 1999, there were 3,548 businesses in Hawaii. Of those businesses, 77% of them were small (less than 10 employees). Based on the population growth rate of 2.05% per year, there are estimated to be 2,956 small businesses in Hawaii County in 2003.
- There were 1,243,313 visitors to Hawaii in 2002. Of those visitors, 1,033,615 of them visited Kona and stayed in Kona an average of 6.21 days. The average tourist’s age is 43 years old. In 2003, visitor arrivals to the State of Hawaii are expected to increase .2% from 2002, for an estimated 1,035,682 visitors to Kona. Also, that growth rate for visitor arrivals is expected to increase dramatically another 6.3% in 2004.
These demographics illustrate a favorable climate for the success of Eagle Computers. Also, in 2001, a new transpacific cable linking Australia to the U.S. mainland via Hawaii provided increased bandwidth to the islands, which has increased the availability of high-speed Internet access to Hawaii computer users.
4.1 Market Segmentation
Our market segmentation focuses on residents, small businesses, and tourists to the Big Island of Hawaii. However, the tourist market segment has very different needs, so the income potential is vastly different than the other two market segments. The income potential analysis is as follows:
Though the numbers in our market segmentation scheme show that the tourist segment makes up the largest portion of potential customers, they do not actually represent the largest income potential. The average tourist is in Kona for about a week and will not be in the market to purchase a computer or have one repaired. However, many tourists want to be able to access the Internet and check their e-mail. We will satisfy this need with our Computer Rental Stations. Tourists will be able to rent time at a Computer Rental Station to browse the Internet, check e-mail, and download their digital photos from their camera memory cards onto discs. The fees we will charge to rent the Stations will be modest, but since there will be no actual product leaving the store for this service, the rental fees are straight profit. We expect these Rental Stations to generate approximately 10% of the business’ profit, so the income from the tourist market segment is actually 10%.
In terms of income potential, the largest market segment is actually the local consumers. This segment is represented in the market segmentation scheme under the heading “Resident Households”. According to the official website for the state of Hawaii, in 2000, 52.4% of Hawaii households had computers. In fact, many households have more than one computer. Consumers need a place to repair and upgrade the computers they already have as well as purchase new computers and parts with the latest technology. Currently, the local residents have very limited resources for purchasing computers or parts. Their options are: a) order computers and computer parts over the Internet, which incurs shipping costs and prevents hands-on inspection by the purchaser; or b) buy a computer from Costco, which only offers a handful of different models and there is no option to customize the computer to match the purchaser’s specific needs. Eagle Computers will resolve these issues for local consumers by selling computers and computer parts that are of the latest technology. We will have computers on display so that a customer can do a hands-on inspection before purchasing. We will also sell custom-built computers and do in-store upgrades so that customers can purchase computers that match their specific needs. In addition, we will offer in-store repair service and guarantee our products. Computers sales, upgrades, and repairs generate a much greater income than the Computer Rental Stations will. We expect the local consumer market segment to provide 50% of the business income.
The remaining 40% of our business income will be generated by the small business market segment. 77% of the businesses in Hawaii are small businesses with less than 10 employees. These small businesses are large enough to need the high-quality computer technology we offer, but too small to have a separate computer management staff. This segment is largely overlooked by most business-focused computer resources because of its “low end” buying habits, and a reluctance to compete with the major retail chain box movers. This currently leaves the small businesses with the same limited resources as are available to the local consumers. As with the local consumers, we will resolve these issues for the small business market segment by providing affordably-priced, high-quality products of the latest technology, customized according to each business’ unique needs. Our full-service computer diagnosis and repair service will provide quality work within an expedient turn-around time. Small businesses cannot afford to wait very long for computer repairs or servicing. We will also offer full networking solutions, including wireless networking.

| Market Analysis | |||||||
| Year 1 | Year 2 | Year 3 | Year 4 | Year 5 | |||
| Potential Customers | Growth | CAGR | |||||
| Resident Households | 2% | 56,243 | 57,396 | 58,573 | 59,774 | 60,999 | 2.05% |
| Small Businesses | 2% | 2,956 | 3,017 | 3,079 | 3,142 | 3,206 | 2.05% |
| Tourists | 2% | 1,035,682 | 1,056,913 | 1,078,580 | 1,100,691 | 1,123,255 | 2.05% |
| Total | 2.05% | 1,094,881 | 1,117,326 | 1,140,232 | 1,163,607 | 1,187,460 | 2.05% |
4.2 Target Market Segment Strategy
Analysis of our market segmentation shows that 90% of our income will be generated by local consumers and small businesses, with the remaining 10% being generated by tourists. Advertising strategy to the local market segments will differ from advertising strategy to the tourism segment in the following ways:
Advertising to Local Consumers and Small Businesses:
- Yellow Pages
- Local newspapers
- Radio
- Hand out flyers to local businesses
- Internet website
Advertising to Tourists:
- Post a sandwich-board sign at the busiest intersection near the store to direct walk-by traffic
- Hand out flyers to local hotels, car rental agencies, and tour companies
4.3 Service Business Analysis
Eagle Computers is part of the retail computer industry, which includes several types of businesses:
- Chain Stores and Computer Superstores: these include major chains such as CompUSA, Best Buy, Sam’s Club, Costco, etc. They are almost always more than 10,000 square feet of space, and are often warehouse-like locations where people go to find products in boxes. They usually offer a wide selection of software as well as the hardware. When purchasing computer systems, customers chose from various as-is computer systems, often without the option to alter the system components. Their products are usually aggressively priced, but little or no support is provided. If they do offer computer repair service, the turn-around time is often lengthy.
- Small Computer Dealers: storefront computer retailers, usually less than 5,000 square feet. These computer stores are usually privately owned and often owner-operated. Because they are privately owned, the quality of products and service varies greatly from one store to another. They usually focus on a few main brands of hardware, offer a minimum of software, and usually offer some level of service and support. A well run store will offer top-quality products and competent, timely support and repair service; whereas, a poorly run store will provide little or no support and carry products chosen mainly for their low price point, not quality or reliability. As with quality and service, the prices at these small stores vary between one store and another. Some small stores make a point to compete with the prices of the large chain stores and superstores, and some do not. Small stores have the advantage of a one-on-one relationship between the customer and the sales person, which often results in more personalized service and products that are better matched to the individual customer’s needs.
- Internet/Mail order: mail order businesses from which customers purchase hardware over the phone or Internet, including components and whole computer systems. They typically offer boxed products that are aggressively priced, but usually offer no service or support. This is a viable option for the purely price-driven buyer, who buys boxes and expects no service. There is, of course, always a time delay between purchasing the products and receiving them due to shipping time, and often, the customer has to pay the shipping charges. Also, there is no opportunity for the customer to do a hands-on inspection before a product is purchased.
The computer industry has a greater influence on our society all the time. Most people use computers either at work or at home. As the general public becomes more computer savvy, it places a greater value on quality resources to meet their computer needs.
4.3.1 Competition and Buying Patterns
Consumers and small business buyers understand the concept of service and support, and are much more likely to pay for it when the offering is clearly stated.
There is no doubt that we compete much more against all the box pushers than against other service providers. We need to effectively compete against the idea that businesses should buy computers as plug-in appliances that don’t need ongoing service, support, and training.
Research indicates that our target consumers and small businesses think about price but would buy based on quality service if the offering were properly presented. They think about price because that’s all they ever see. We have very good indications that many would rather pay 10-20% more for a relationship with a long-term vendor providing back-up and quality service and support; they end up in the box-pusher channels because they aren’t aware of the alternatives.
Availability is also very important. Consumers and small business buyers tend to want immediate, local solutions to problems.
Strategy and Implementation Summary
Our target market consists of consumers, small businesses and home offices (less than 10 employees), and tourists. Our sales and marketing strategy will consist of offering a wide selection of quality products and services, a friendly pleasant atmosphere, and a convenient location in the center of Kailua-Kona with accessibility to locals and tourists alike. We will establish ourselves in the community through word-of-mouth referrals from our satisfied clients, and various forms of advertising.
5.1 Competitive Edge
Our competitive edge is a combination of our wide range of products and services, outstanding location, and our interaction with our clients. By building a business based on long-standing relationships with satisfied clients, we simultaneously build defenses against competition. The longer the relationship stands, the more we help our clients understand what we offer them and why they should both stay with Eagle Computers, and refer us to others in the community. In close-knit communities like the Big Island of Hawaii, reputation is extremely important, and word-of-mouth advertising is invaluable.
5.2 Marketing Strategy
Our marketing strategy is a simple one: satisfied customers are our best marketing tool. The first time a customer comes to Eagle Computers, they will know that they have found a one-stop shop for all of their computer needs, including a friendly personal atmosphere with exceptional customer service. We have talked with many friends and associates who are excited about our plans and are anxious to shop with us and use our services. Word of mouth and a good reputation are the best marketing tools in a close-knit community such as ours.
In addition, we will have a website, do radio and newspaper advertising, distribute flyers to local businesses, and advertise in the Yellow Pages. These venues will help us become known as we establish our business.
5.3 Sales Strategy
Our umbrella sales strategy is to sell Eagle Computers to the West Hawaii community as the best resource for their computer needs, enhancing their lives with our quality, latest-technology products, the convenience of our one-stop shop, affordable pricing and the reliable professional service we offer.
We will sell Eagle Computers through each employee’s expertise, courtesy, and warmth, creating a trusting impression on all customers, and establishing loyalty and return visits. We will ensure each visit to Eagle Computers is a professional and pleasant experience, so that customers can always depend on our brand of service when they arrive.
We expect to have a customer return rate of 90% at the end of the first year and for sales to increase to over a quarter-million dollars by end of second year.
5.3.1 Sales Forecast
The important elements of the Sales Forecasts are shown in the chart and table below. Initial sales forecast indicate a healthy first year revenue increasing modestly but steadily in the second and third year. These figures are based on revenue from three main areas:
- Computer Sales – this includes sales of all hardware components. We estimate a 5% annual increase in this revenue area from new customer acquisition. The sales costs for computer hardware averages 70% of the final sales prices when the hardware is sold. Costs for wholesale computer hardware is expected to have a 2% annual increase.
- Computer Service – revenue generated strictly from labor fees, so except for payroll, there is no sales cost. We estimate a 10% annual increase in this revenue area from repeat business as a result of customer loyalty.
- Computer Rental Stations – revenue generated from customers renting the computer stations by the hour. We estimate a 3% annual increase to reflect the projected increase in tourism to Kona. This revenue is all profit since it requires no cost for inventory and it is basically self-service, so requires no labor hours.


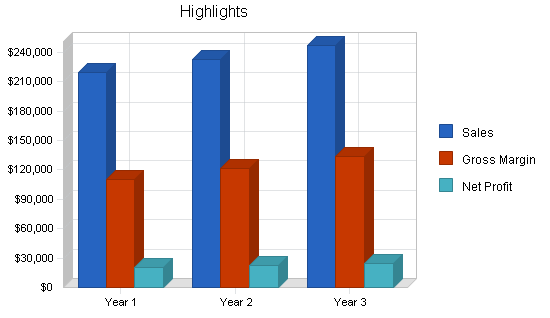
| Sales Forecast | |||
| Year 1 | Year 2 | Year 3 | |
| Sales | |||
| Computer Sales | $156,500 | $164,325 | $172,541 |
| Computer Repairs | $53,000 | $58,300 | $64,130 |
| Computer Rental Stations | $10,050 | $10,352 | $10,662 |
| Total Sales | $219,550 | $232,977 | $247,333 |
| Direct Cost of Sales | Year 1 | Year 2 | Year 3 |
| Computer Parts | $109,550 | $111,741 | $113,976 |
| Row 3 | $0 | $0 | $0 |
| Subtotal Direct Cost of Sales | $109,550 | $111,741 | $113,976 |
5.4 Milestones
The following table lists important program milestones, with dates and managers in charge, and budgets for each. The milestone schedule indicates our emphasis on planning for implementation.

| Milestones | |||||
| Milestone | Start Date | End Date | Budget | Manager | Department |
| Business Plan | 9/25/2003 | 10/23/2003 | $100 | Judy | Management |
| Negotiate/Sign Store Front Lease | 10/22/2003 | 11/1/2003 | $0 | Jim | Management |
| Build Displays & Set Up Store Interior | 11/1/2003 | 12/1/2003 | $6,050 | Jim | Management |
| Secure Business Name and Legal | 11/1/2003 | 11/15/2003 | $1,200 | Judy | Management |
| Obtain Financial Backing | 11/1/2003 | 12/1/2003 | $0 | Judy | Management |
| Print Business Stationary & Flyers | 11/15/2003 | 12/1/2003 | $125 | Judy | Management |
| Grand Opening for Store | 12/1/2003 | 12/7/2003 | $50 | Jim | Management |
| Distribute Flyers | 12/1/2003 | 12/7/2003 | $20 | Judy | Management |
| Research Media Advertising | 1/1/2004 | 1/15/2004 | $0 | Judy | Management |
| Print & Distribute 2nd Group of Flyers | 2/1/2004 | 2/15/2004 | $50 | Judy | Management |
| Totals | $7,595 | ||||
Management Summary
The management philosophy of Eagle Computers is based on respect for each of our fellow employees, respect for every client, and individual responsibility. We believe in listening to our clients and doing our best to embody their vision of a community-minded business dedicated to meeting all their computer needs. Our management team consists of the owners, who are experienced entrepreneurs possessing a breadth of functional experience in computer technology, information technology, management and retail. Both Jim Johnson and Judy Johnson will share the senior management responsibilities with Jim directing the sales, development, operations and production, and Judy directing the finances and marketing.
We still need to find a networking specialist for our clients who require that service, but as the need for that will be on a job-by-job basis, we will use an independent contractor. We already know of a couple of qualified candidates.
When the need arises to hire employees, we will hire only employees who demonstrate technical aptitude and a dedication to excellent customer service. The organizational structure and personnel plan reflect our intentions to maintain an organization that is customer oriented and technologically proficient, while efficiently managing cost controls and productivity.
6.1 Personnel Plan
The Personnel Plan below reflects our projected need at opening, and carries through the second year. The need for any additional personnel is not anticipated before the third year.
| Personnel Plan | |||
| Year 1 | Year 2 | Year 3 | |
| Jim Johnson | $33,000 | $36,000 | $40,000 |
| Judy Johnson | $16,500 | $21,000 | $25,000 |
| Total People | 2 | 2 | 2 |
| Total Payroll | $49,500 | $57,000 | $65,000 |
Financial Plan
The following subtopics help present the financial plan for Eagle Computers.
7.1 Important Assumptions
The key underlying assumptions of our financial plan shown in the following general assumption table are:
- We assume access to the start-up funding necessary to provide adequate initial capitalization and establish our company.
- We assume continued steady economic growth in Hawaii as predicted by Bank of Hawaii, and other Hawaii economists.
- We assume continued steady population growth of the West Hawaii community.
- We assume continued steady increase in tourism to the Kona area as predicted by the Department of Business, Economic Development and Tourism for the State of Hawaii.
- We assume continued usage of IBM-compatible computers in the home and at work.
| General Assumptions | |||
| Year 1 | Year 2 | Year 3 | |
| Plan Month | 1 | 2 | 3 |
| Current Interest Rate | 10.00% | 10.00% | 10.00% |
| Long-term Interest Rate | 10.00% | 10.00% | 10.00% |
| Tax Rate | 30.00% | 30.00% | 30.00% |
| Other | 0 | 0 | 0 |
7.2 Break-even Analysis
For our break-even analysis, we assume running costs which include our full payroll, rent and utilities, and an estimation of other running costs.
We will monitor gross margins very closely, and maintain them at or above 50% by taking advantage of all promotions and discounts offered by our manufacturers and by our higher-profit revenue generators of computer service and Computer Rental Stations.
The chart shows what we need to sell per month to break even, according to these assumptions. This is about 6% of our projected sales for our first year.

| Break-even Analysis | |
| Monthly Revenue Break-even | $12,868 |
| Assumptions: | |
| Average Percent Variable Cost | 50% |
| Estimated Monthly Fixed Cost | $6,447 |
7.3 Projected Profit and Loss
There are two important assumptions with our Projected Profit and Loss statement:
- Our revenue is based on minimum estimated averages against highest expense expectations.
- Our major expense of rent is fixed for the next three years.


| Pro Forma Profit and Loss | |||
| Year 1 | Year 2 | Year 3 | |
| Sales | $219,550 | $232,977 | $247,333 |
| Direct Cost of Sales | $109,550 | $111,741 | $113,976 |
| Other Costs of Goods | $0 | $0 | $0 |
| Total Cost of Sales | $109,550 | $111,741 | $113,976 |
| Gross Margin | $110,000 | $121,236 | $133,357 |
| Gross Margin % | 50.10% | 52.04% | 53.92% |
| Expenses | |||
| Payroll | $49,500 | $57,000 | $65,000 |
| Sales and Marketing and Other Expenses | $280 | $280 | $280 |
| Depreciation | $0 | $0 | $0 |
| Rent | $15,600 | $15,600 | $15,600 |
| Utilities | $3,600 | $3,600 | $3,600 |
| Security Alarm System | $360 | $360 | $360 |
| Insurance | $600 | $600 | $600 |
| Payroll Taxes | $7,425 | $8,550 | $9,750 |
| Other | $0 | $0 | $0 |
| Total Operating Expenses | $77,365 | $85,990 | $95,190 |
| Profit Before Interest and Taxes | $32,635 | $35,246 | $38,167 |
| EBITDA | $32,635 | $35,246 | $38,167 |
| Interest Expense | $3,310 | $2,974 | $2,624 |
| Taxes Incurred | $8,797 | $9,681 | $10,663 |
| Net Profit | $20,527 | $22,590 | $24,880 |
| Net Profit/Sales | 9.35% | 9.70% | 10.06% |
7.4 Projected Cash Flow
Our projected cash flow includes planned borrowing to increase our capital and thereby ensure a positive cash balance while our business is becoming established. Though the cash flow is negative on and off throughout the year, we will maintain a healthy cash balance, which steadily increases in both the second and third years.

| Pro Forma Cash Flow | |||
| Year 1 | Year 2 | Year 3 | |
| Cash Received | |||
| Cash from Operations | |||
| Cash Sales | $219,550 | $232,977 | $247,333 |
| Subtotal Cash from Operations | $219,550 | $232,977 | $247,333 |
| Additional Cash Received | |||
| Sales Tax, VAT, HST/GST Received | $0 | $0 | $0 |
| New Current Borrowing | $0 | $0 | $0 |
| New Other Liabilities (interest-free) | $0 | $0 | $0 |
| New Long-term Liabilities | $35,000 | $0 | $0 |
| Sales of Other Current Assets | $0 | $0 | $0 |
| Sales of Long-term Assets | $0 | $0 | $0 |
| New Investment Received | $0 | $0 | $0 |
| Subtotal Cash Received | $254,550 | $232,977 | $247,333 |
| Expenditures | Year 1 | Year 2 | Year 3 |
| Expenditures from Operations | |||
| Cash Spending | $49,500 | $57,000 | $65,000 |
| Bill Payments | $136,766 | $156,082 | $157,370 |
| Subtotal Spent on Operations | $186,266 | $213,082 | $222,370 |
| Additional Cash Spent | |||
| Sales Tax, VAT, HST/GST Paid Out | $0 | $0 | $0 |
| Principal Repayment of Current Borrowing | $0 | $0 | $0 |
| Other Liabilities Principal Repayment | $0 | $0 | $0 |
| Long-term Liabilities Principal Repayment | $3,504 | $3,504 | $3,504 |
| Purchase Other Current Assets | $0 | $0 | $0 |
| Purchase Long-term Assets | $0 | $0 | $0 |
| Dividends | $0 | $0 | $0 |
| Subtotal Cash Spent | $189,770 | $216,586 | $225,874 |
| Net Cash Flow | $64,780 | $16,390 | $21,460 |
| Cash Balance | $66,805 | $83,195 | $104,655 |
7.5 Projected Balance Sheet
Our Projected Balance Sheet shows we will not have any difficulty meeting our debt obligations as long as our revenue projections are met.
| Pro Forma Balance Sheet | |||
| Year 1 | Year 2 | Year 3 | |
| Assets | |||
| Current Assets | |||
| Cash | $66,805 | $83,195 | $104,655 |
| Inventory | $12,320 | $12,566 | $12,818 |
| Other Current Assets | $0 | $0 | $0 |
| Total Current Assets | $79,125 | $95,762 | $117,473 |
| Long-term Assets | |||
| Long-term Assets | $0 | $0 | $0 |
| Accumulated Depreciation | $0 | $0 | $0 |
| Total Long-term Assets | $0 | $0 | $0 |
| Total Assets | $79,125 | $95,762 | $117,473 |
| Liabilities and Capital | Year 1 | Year 2 | Year 3 |
| Current Liabilities | |||
| Accounts Payable | $15,076 | $12,627 | $12,962 |
| Current Borrowing | $0 | $0 | $0 |
| Other Current Liabilities | $0 | $0 | $0 |
| Subtotal Current Liabilities | $15,076 | $12,627 | $12,962 |
| Long-term Liabilities | $31,496 | $27,992 | $24,488 |
| Total Liabilities | $46,572 | $40,619 | $37,450 |
| Paid-in Capital | $20,000 | $20,000 | $20,000 |
| Retained Earnings | ($7,975) | $12,552 | $35,142 |
| Earnings | $20,527 | $22,590 | $24,880 |
| Total Capital | $32,552 | $55,142 | $80,023 |
| Total Liabilities and Capital | $79,125 | $95,762 | $117,473 |
| Net Worth | $32,552 | $55,142 | $80,023 |
7.6 Business Ratios
The company’s projected business ratios are provided in the table below. The final column, Industry Profile, shows the industry profile ratios based on the Standard Industrial Classification (SIC) code 5734, Computer and Software Stores.
| Ratio Analysis | ||||
| Year 1 | Year 2 | Year 3 | Industry Profile | |
| Sales Growth | 0.00% | 6.12% | 6.16% | 5.90% |
| Percent of Total Assets | ||||
| Inventory | 15.57% | 13.12% | 10.91% | 28.69% |
| Other Current Assets | 0.00% | 0.00% | 0.00% | 23.57% |
| Total Current Assets | 100.00% | 100.00% | 100.00% | 76.76% |
| Long-term Assets | 0.00% | 0.00% | 0.00% | 23.24% |
| Total Assets | 100.00% | 100.00% | 100.00% | 100.00% |
| Current Liabilities | 19.05% | 13.19% | 11.03% | 38.11% |
| Long-term Liabilities | 39.81% | 29.23% | 20.85% | 12.34% |
| Total Liabilities | 58.86% | 42.42% | 31.88% | 50.45% |
| Net Worth | 41.14% | 57.58% | 68.12% | 49.55% |
| Percent of Sales | ||||
| Sales | 100.00% | 100.00% | 100.00% | 100.00% |
| Gross Margin | 50.10% | 52.04% | 53.92% | 32.91% |
| Selling, General & Administrative Expenses | 40.75% | 42.34% | 43.86% | 16.33% |
| Advertising Expenses | 0.00% | 0.00% | 0.00% | 3.48% |
| Profit Before Interest and Taxes | 14.86% | 15.13% | 15.43% | 1.13% |
| Main Ratios | ||||
| Current | 5.25 | 7.58 | 9.06 | 1.84 |
| Quick | 4.43 | 6.59 | 8.07 | 0.96 |
| Total Debt to Total Assets | 58.86% | 42.42% | 31.88% | 53.76% |
| Pre-tax Return on Net Worth | 90.09% | 58.52% | 44.42% | 2.48% |
| Pre-tax Return on Assets | 37.06% | 33.70% | 30.26% | 5.36% |
| Additional Ratios | Year 1 | Year 2 | Year 3 | |
| Net Profit Margin | 9.35% | 9.70% | 10.06% | n.a |
| Return on Equity | 63.06% | 40.97% | 31.09% | n.a |
| Activity Ratios | ||||
| Inventory Turnover | 10.91 | 8.98 | 8.98 | n.a |
| Accounts Payable Turnover | 10.07 | 12.17 | 12.17 | n.a |
| Payment Days | 27 | 33 | 30 | n.a |
| Total Asset Turnover | 2.77 | 2.43 | 2.11 | n.a |
| Debt Ratios | ||||
| Debt to Net Worth | 1.43 | 0.74 | 0.47 | n.a |
| Current Liab. to Liab. | 0.32 | 0.31 | 0.35 | n.a |
| Liquidity Ratios | ||||
| Net Working Capital | $64,048 | $83,134 | $104,511 | n.a |
| Interest Coverage | 9.86 | 11.85 | 14.55 | n.a |
| Additional Ratios | ||||
| Assets to Sales | 0.36 | 0.41 | 0.47 | n.a |
| Current Debt/Total Assets | 19% | 13% | 11% | n.a |
| Acid Test | 4.43 | 6.59 | 8.07 | n.a |
| Sales/Net Worth | 6.74 | 4.23 | 3.09 | n.a |
| Dividend Payout | 0.00 | 0.00 | 0.00 | n.a |
Appendix
| Sales Forecast | |||||||||||||
| Month 1 | Month 2 | Month 3 | Month 4 | Month 5 | Month 6 | Month 7 | Month 8 | Month 9 | Month 10 | Month 11 | Month 12 | ||
| Sales | |||||||||||||
| Computer Sales | 0% | $8,000 | $10,000 | $12,000 | $12,500 | $12,500 | $13,000 | $13,500 | $14,000 | $14,500 | $15,000 | $15,500 | $16,000 |
| Computer Repairs | 0% | $2,000 | $2,500 | $3,000 | $3,500 | $4,000 | $4,500 | $5,000 | $5,500 | $5,600 | $5,700 | $5,800 | $5,900 |
| Computer Rental Stations | 0% | $650 | $700 | $750 | $800 | $850 | $900 | $900 | $900 | $900 | $900 | $900 | $900 |
| Total Sales | $10,650 | $13,200 | $15,750 | $16,800 | $17,350 | $18,400 | $19,400 | $20,400 | $21,000 | $21,600 | $22,200 | $22,800 | |
| Direct Cost of Sales | Month 1 | Month 2 | Month 3 | Month 4 | Month 5 | Month 6 | Month 7 | Month 8 | Month 9 | Month 10 | Month 11 | Month 12 | |
| Computer Parts | $5,600 | $7,000 | $8,400 | $8,750 | $8,750 | $9,100 | $9,450 | $9,800 | $10,150 | $10,500 | $10,850 | $11,200 | |
| Row 3 | $0 | $0 | $0 | $0 | $0 | $0 | $0 | $0 | $0 | $0 | $0 | $0 | |
| Subtotal Direct Cost of Sales | $5,600 | $7,000 | $8,400 | $8,750 | $8,750 | $9,100 | $9,450 | $9,800 | $10,150 | $10,500 | $10,850 | $11,200 | |
| Personnel Plan | |||||||||||||
| Month 1 | Month 2 | Month 3 | Month 4 | Month 5 | Month 6 | Month 7 | Month 8 | Month 9 | Month 10 | Month 11 | Month 12 | ||
| Jim Johnson | 0% | $2,000 | $2,000 | $2,000 | $3,000 | $3,000 | $3,000 | $3,000 | $3,000 | $3,000 | $3,000 | $3,000 | $3,000 |
| Judy Johnson | 0% | $1,000 | $1,000 | $1,000 | $1,500 | $1,500 | $1,500 | $1,500 | $1,500 | $1,500 | $1,500 | $1,500 | $1,500 |
| Total People | 2 | 2 | 2 | 2 | 2 | 2 | 2 | 2 | 2 | 2 | 2 | 2 | |
| Total Payroll | $3,000 | $3,000 | $3,000 | $4,500 | $4,500 | $4,500 | $4,500 | $4,500 | $4,500 | $4,500 | $4,500 | $4,500 | |
| General Assumptions | |||||||||||||
| Month 1 | Month 2 | Month 3 | Month 4 | Month 5 | Month 6 | Month 7 | Month 8 | Month 9 | Month 10 | Month 11 | Month 12 | ||
| Plan Month | 1 | 2 | 3 | 4 | 5 | 6 | 7 | 8 | 9 | 10 | 11 | 12 | |
| Current Interest Rate | 10.00% | 10.00% | 10.00% | 10.00% | 10.00% | 10.00% | 10.00% | 10.00% | 10.00% | 10.00% | 10.00% | 10.00% | |
| Long-term Interest Rate | 10.00% | 10.00% | 10.00% | 10.00% | 10.00% | 10.00% | 10.00% | 10.00% | 10.00% | 10.00% | 10.00% | 10.00% | |
| Tax Rate | 30.00% | 30.00% | 30.00% | 30.00% | 30.00% | 30.00% | 30.00% | 30.00% | 30.00% | 30.00% | 30.00% | 30.00% | |
| Other | 0 | 0 | 0 | 0 | 0 | 0 | 0 | 0 | 0 | 0 | 0 | 0 | |
| Pro Forma Profit and Loss | |||||||||||||
| Month 1 | Month 2 | Month 3 | Month 4 | Month 5 | Month 6 | Month 7 | Month 8 | Month 9 | Month 10 | Month 11 | Month 12 | ||
| Sales | $10,650 | $13,200 | $15,750 | $16,800 | $17,350 | $18,400 | $19,400 | $20,400 | $21,000 | $21,600 | $22,200 | $22,800 | |
| Direct Cost of Sales | $5,600 | $7,000 | $8,400 | $8,750 | $8,750 | $9,100 | $9,450 | $9,800 | $10,150 | $10,500 | $10,850 | $11,200 | |
| Other Costs of Goods | $0 | $0 | $0 | $0 | $0 | $0 | $0 | $0 | $0 | $0 | $0 | $0 | |
| Total Cost of Sales | $5,600 | $7,000 | $8,400 | $8,750 | $8,750 | $9,100 | $9,450 | $9,800 | $10,150 | $10,500 | $10,850 | $11,200 | |
| Gross Margin | $5,050 | $6,200 | $7,350 | $8,050 | $8,600 | $9,300 | $9,950 | $10,600 | $10,850 | $11,100 | $11,350 | $11,600 | |
| Gross Margin % | 47.42% | 46.97% | 46.67% | 47.92% | 49.57% | 50.54% | 51.29% | 51.96% | 51.67% | 51.39% | 51.13% | 50.88% | |
| Expenses | |||||||||||||
| Payroll | $3,000 | $3,000 | $3,000 | $4,500 | $4,500 | $4,500 | $4,500 | $4,500 | $4,500 | $4,500 | $4,500 | $4,500 | |
| Sales and Marketing and Other Expenses | $0 | $0 | $70 | $0 | $0 | $70 | $0 | $0 | $70 | $0 | $0 | $70 | |
| Depreciation | $0 | $0 | $0 | $0 | $0 | $0 | $0 | $0 | $0 | $0 | $0 | $0 | |
| Rent | $1,300 | $1,300 | $1,300 | $1,300 | $1,300 | $1,300 | $1,300 | $1,300 | $1,300 | $1,300 | $1,300 | $1,300 | |
| Utilities | $300 | $300 | $300 | $300 | $300 | $300 | $300 | $300 | $300 | $300 | $300 | $300 | |
| Security Alarm System | $30 | $30 | $30 | $30 | $30 | $30 | $30 | $30 | $30 | $30 | $30 | $30 | |
| Insurance | $50 | $50 | $50 | $50 | $50 | $50 | $50 | $50 | $50 | $50 | $50 | $50 | |
| Payroll Taxes | 15% | $450 | $450 | $450 | $675 | $675 | $675 | $675 | $675 | $675 | $675 | $675 | $675 |
| Other | $0 | $0 | $0 | $0 | $0 | $0 | $0 | $0 | $0 | $0 | $0 | $0 | |
| Total Operating Expenses | $5,130 | $5,130 | $5,200 | $6,855 | $6,855 | $6,925 | $6,855 | $6,855 | $6,925 | $6,855 | $6,855 | $6,925 | |
| Profit Before Interest and Taxes | ($80) | $1,070 | $2,150 | $1,195 | $1,745 | $2,375 | $3,095 | $3,745 | $3,925 | $4,245 | $4,495 | $4,675 | |
| EBITDA | ($80) | $1,070 | $2,150 | $1,195 | $1,745 | $2,375 | $3,095 | $3,745 | $3,925 | $4,245 | $4,495 | $4,675 | |
| Interest Expense | $289 | $287 | $284 | $282 | $280 | $277 | $275 | $272 | $270 | $267 | $265 | $262 | |
| Taxes Incurred | ($111) | $235 | $560 | $274 | $440 | $629 | $846 | $1,042 | $1,097 | $1,193 | $1,269 | $1,324 | |
| Net Profit | ($258) | $548 | $1,306 | $639 | $1,026 | $1,469 | $1,974 | $2,431 | $2,559 | $2,784 | $2,961 | $3,089 | |
| Net Profit/Sales | -2.43% | 4.15% | 8.29% | 3.80% | 5.91% | 7.98% | 10.18% | 11.92% | 12.18% | 12.89% | 13.34% | 13.55% | |
| Pro Forma Cash Flow | |||||||||||||
| Month 1 | Month 2 | Month 3 | Month 4 | Month 5 | Month 6 | Month 7 | Month 8 | Month 9 | Month 10 | Month 11 | Month 12 | ||
| Cash Received | |||||||||||||
| Cash from Operations | |||||||||||||
| Cash Sales | $10,650 | $13,200 | $15,750 | $16,800 | $17,350 | $18,400 | $19,400 | $20,400 | $21,000 | $21,600 | $22,200 | $22,800 | |
| Subtotal Cash from Operations | $10,650 | $13,200 | $15,750 | $16,800 | $17,350 | $18,400 | $19,400 | $20,400 | $21,000 | $21,600 | $22,200 | $22,800 | |
| Additional Cash Received | |||||||||||||
| Sales Tax, VAT, HST/GST Received | 0.00% | $0 | $0 | $0 | $0 | $0 | $0 | $0 | $0 | $0 | $0 | $0 | $0 |
| New Current Borrowing | $0 | $0 | $0 | $0 | $0 | $0 | $0 | $0 | $0 | $0 | $0 | $0 | |
| New Other Liabilities (interest-free) | $0 | $0 | $0 | $0 | $0 | $0 | $0 | $0 | $0 | $0 | $0 | $0 | |
| New Long-term Liabilities | $35,000 | $0 | $0 | $0 | $0 | $0 | $0 | $0 | $0 | $0 | $0 | $0 | |
| Sales of Other Current Assets | $0 | $0 | $0 | $0 | $0 | $0 | $0 | $0 | $0 | $0 | $0 | $0 | |
| Sales of Long-term Assets | $0 | $0 | $0 | $0 | $0 | $0 | $0 | $0 | $0 | $0 | $0 | $0 | |
| New Investment Received | $0 | $0 | $0 | $0 | $0 | $0 | $0 | $0 | $0 | $0 | $0 | $0 | |
| Subtotal Cash Received | $45,650 | $13,200 | $15,750 | $16,800 | $17,350 | $18,400 | $19,400 | $20,400 | $21,000 | $21,600 | $22,200 | $22,800 | |
| Expenditures | Month 1 | Month 2 | Month 3 | Month 4 | Month 5 | Month 6 | Month 7 | Month 8 | Month 9 | Month 10 | Month 11 | Month 12 | |
| Expenditures from Operations | |||||||||||||
| Cash Spending | $3,000 | $3,000 | $3,000 | $4,500 | $4,500 | $4,500 | $4,500 | $4,500 | $4,500 | $4,500 | $4,500 | $4,500 | |
| Bill Payments | $136 | $4,306 | $11,252 | $12,953 | $12,038 | $11,857 | $12,833 | $13,329 | $13,870 | $14,339 | $14,715 | $15,140 | |
| Subtotal Spent on Operations | $3,136 | $7,306 | $14,252 | $17,453 | $16,538 | $16,357 | $17,333 | $17,829 | $18,370 | $18,839 | $19,215 | $19,640 | |
| Additional Cash Spent | |||||||||||||
| Sales Tax, VAT, HST/GST Paid Out | $0 | $0 | $0 | $0 | $0 | $0 | $0 | $0 | $0 | $0 | $0 | $0 | |
| Principal Repayment of Current Borrowing | $0 | $0 | $0 | $0 | $0 | $0 | $0 | $0 | $0 | $0 | $0 | $0 | |
| Other Liabilities Principal Repayment | $0 | $0 | $0 | $0 | $0 | $0 | $0 | $0 | $0 | $0 | $0 | $0 | |
| Long-term Liabilities Principal Repayment | $292 | $292 | $292 | $292 | $292 | $292 | $292 | $292 | $292 | $292 | $292 | $292 | |
| Purchase Other Current Assets | $0 | $0 | $0 | $0 | $0 | $0 | $0 | $0 | $0 | $0 | $0 | $0 | |
| Purchase Long-term Assets | $0 | $0 | $0 | $0 | $0 | $0 | $0 | $0 | $0 | $0 | $0 | $0 | |
| Dividends | $0 | $0 | $0 | $0 | $0 | $0 | $0 | $0 | $0 | $0 | $0 | $0 | |
| Subtotal Cash Spent | $3,428 | $7,598 | $14,544 | $17,745 | $16,830 | $16,649 | $17,625 | $18,121 | $18,662 | $19,131 | $19,507 | $19,932 | |
| Net Cash Flow | $42,222 | $5,602 | $1,206 | ($945) | $520 | $1,751 | $1,775 | $2,279 | $2,338 | $2,469 | $2,693 | $2,868 | |
| Cash Balance | $44,247 | $49,849 | $51,056 | $50,111 | $50,631 | $52,382 | $54,157 | $56,436 | $58,774 | $61,243 | $63,936 | $66,805 | |
| Pro Forma Balance Sheet | |||||||||||||
| Month 1 | Month 2 | Month 3 | Month 4 | Month 5 | Month 6 | Month 7 | Month 8 | Month 9 | Month 10 | Month 11 | Month 12 | ||
| Assets | Starting Balances | ||||||||||||
| Current Assets | |||||||||||||
| Cash | $2,025 | $44,247 | $49,849 | $51,056 | $50,111 | $50,631 | $52,382 | $54,157 | $56,436 | $58,774 | $61,243 | $63,936 | $66,805 |
| Inventory | $10,000 | $6,160 | $7,700 | $9,240 | $9,625 | $9,625 | $10,010 | $10,395 | $10,780 | $11,165 | $11,550 | $11,935 | $12,320 |
| Other Current Assets | $0 | $0 | $0 | $0 | $0 | $0 | $0 | $0 | $0 | $0 | $0 | $0 | $0 |
| Total Current Assets | $12,025 | $50,407 | $57,549 | $60,296 | $59,736 | $60,256 | $62,392 | $64,552 | $67,216 | $69,939 | $72,793 | $75,871 | $79,125 |
| Long-term Assets | |||||||||||||
| Long-term Assets | $0 | $0 | $0 | $0 | $0 | $0 | $0 | $0 | $0 | $0 | $0 | $0 | $0 |
| Accumulated Depreciation | $0 | $0 | $0 | $0 | $0 | $0 | $0 | $0 | $0 | $0 | $0 | $0 | $0 |
| Total Long-term Assets | $0 | $0 | $0 | $0 | $0 | $0 | $0 | $0 | $0 | $0 | $0 | $0 | $0 |
| Total Assets | $12,025 | $50,407 | $57,549 | $60,296 | $59,736 | $60,256 | $62,392 | $64,552 | $67,216 | $69,939 | $72,793 | $75,871 | $79,125 |
| Liabilities and Capital | Month 1 | Month 2 | Month 3 | Month 4 | Month 5 | Month 6 | Month 7 | Month 8 | Month 9 | Month 10 | Month 11 | Month 12 | |
| Current Liabilities | |||||||||||||
| Accounts Payable | $0 | $3,933 | $10,819 | $12,551 | $11,644 | $11,430 | $12,389 | $12,867 | $13,392 | $13,849 | $14,211 | $14,620 | $15,076 |
| Current Borrowing | $0 | $0 | $0 | $0 | $0 | $0 | $0 | $0 | $0 | $0 | $0 | $0 | $0 |
| Other Current Liabilities | $0 | $0 | $0 | $0 | $0 | $0 | $0 | $0 | $0 | $0 | $0 | $0 | $0 |
| Subtotal Current Liabilities | $0 | $3,933 | $10,819 | $12,551 | $11,644 | $11,430 | $12,389 | $12,867 | $13,392 | $13,849 | $14,211 | $14,620 | $15,076 |
| Long-term Liabilities | $0 | $34,708 | $34,416 | $34,124 | $33,832 | $33,540 | $33,248 | $32,956 | $32,664 | $32,372 | $32,080 | $31,788 | $31,496 |
| Total Liabilities | $0 | $38,641 | $45,235 | $46,675 | $45,476 | $44,970 | $45,637 | $45,823 | $46,056 | $46,221 | $46,291 | $46,408 | $46,572 |
| Paid-in Capital | $20,000 | $20,000 | $20,000 | $20,000 | $20,000 | $20,000 | $20,000 | $20,000 | $20,000 | $20,000 | $20,000 | $20,000 | $20,000 |
| Retained Earnings | ($7,975) | ($7,975) | ($7,975) | ($7,975) | ($7,975) | ($7,975) | ($7,975) | ($7,975) | ($7,975) | ($7,975) | ($7,975) | ($7,975) | ($7,975) |
| Earnings | $0 | ($258) | $290 | $1,596 | $2,235 | $3,261 | $4,729 | $6,704 | $9,134 | $11,693 | $14,478 | $17,439 | $20,527 |
| Total Capital | $12,025 | $11,767 | $12,315 | $13,621 | $14,260 | $15,286 | $16,754 | $18,729 | $21,159 | $23,718 | $26,503 | $29,464 | $32,552 |
| Total Liabilities and Capital | $12,025 | $50,407 | $57,549 | $60,296 | $59,736 | $60,256 | $62,392 | $64,552 | $67,216 | $69,939 | $72,793 | $75,871 | $79,125 |
| Net Worth | $12,025 | $11,767 | $12,315 | $13,621 | $14,260 | $15,286 | $16,754 | $18,729 | $21,159 | $23,718 | $26,503 | $29,464 | $32,552 |

