
Gaming Futures, LLC
Executive Summary
Gaming Futures, LLC, provides Windows® application development/support, PlayStation2® development, XBox® development, 2D and 3D art and visual effects, and project guidance. Gaming Futures is a game development studio formed by veterans of Modicum On-Line and Axiomatic InterRational. As developers of the best-selling and critically acclaimed “DreæmWhyrks” series, Gaming Futures’ talented core team members have produced five titles together, and have individual experience with dozens more. Gaming Futures is committed to creating high-quality, innovative, successful games and software.
We offer the following:
- Game concepts and development for PC, PS2®, XBox®, Pocket PC®.
- Game platform ports: PC/PS2/XBox/Game Boy®.
- 2D and 3D art, programming, libraries to spec.
- Interface design and software enhancement.
- Cohesive, talented development team with years of experience shipping products together.
- Proven track record: DreæmWhyrks series has over 3 million units sold to date.
- On time and on budget shipping.
The company is forming out of the ashes of Axiomatic InterRational which shut down last June. Gaming Futures is the core group of the last DreæmWhyrks project at Axiomatic. The DreæmWhyrks line has shipped over 3 million units. The production team has four years of successful product development as a team. Individually, the group has over 30 years of experience and has contributed to over 40 software products.
Bill Kerl, Project Manager for Gaming Futures, believes the company is well positioned to be a valuable resource to gaming companies that are seeking cost-effective ways to implement a gaming design mission that will meet projected completion dates. One of the greatest obstacles is the ability of the production team to perform without wasted effort and resources. Gaming Futures has a documented history of completing its projects under budget and on time.
Currently, the company has been successful in acquiring three contracts with the following companies:
- Clear Mountain Productions
- Weaver Farm, Inc.
Note: Windows®, PlayStation2®, PS2®, Xbox®, Pocket PC® , and Game Boy® are registered trademarks of their respective corporations.

1.1 Objectives
Gaming Futures’ objectives are as follows:
- Achieve sales goal of $200,000 during first year of operation.
- Achieve a customer base of 40 companies.
- Increase sales by 15% during the second year of operation.
1.2 Mission
The mission of Gaming Futures is to provide the highest quality service through the development of innovative, exciting products to the interactive entertainment industry.
Company Summary
Gaming Futures, LLC, is a game development studio providing Windows application development/support, PS2 development, XBox development, 2D and 3D art and visual effects, and project guidance. The company will be organized as a Limited Liability Corporation.
2.1 Company Ownership
Gaming Futures, LLC is owned by its team of developers:
- Bill Kerl
- Diane Huber
- Marcus Hathcock
- Jillian Daley
- Jeremy Lang
2.2 Company Locations and Facilities
Gaming Futures is located in a 3,000 square foot office space in the Northwest Industrial Park in northwest Madison.
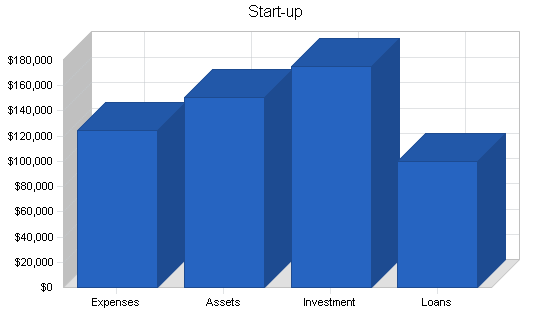
2.3 Start-up Summary
The start-up expense for the Gaming Futures is focused primarily on equipment and office space. William, Diane, Marcus, Jillian, and Jeremy will each invest $35,000. In addition, Gaming Futures will secure a $100,000 long term loan.
| Start-up Funding | |
| Start-up Expenses to Fund | $124,300 |
| Start-up Assets to Fund | $150,700 |
| Total Funding Required | $275,000 |
| Assets | |
| Non-cash Assets from Start-up | $90,000 |
| Cash Requirements from Start-up | $60,700 |
| Additional Cash Raised | $0 |
| Cash Balance on Starting Date | $60,700 |
| Total Assets | $150,700 |
| Liabilities and Capital | |
| Liabilities | |
| Current Borrowing | $0 |
| Long-term Liabilities | $100,000 |
| Accounts Payable (Outstanding Bills) | $0 |
| Other Current Liabilities (interest-free) | $0 |
| Total Liabilities | $100,000 |
| Capital | |
| Planned Investment | |
| Bill Kerl | $35,000 |
| Diane Huber | $35,000 |
| Marcus Hathcock | $35,000 |
| Jillian Daley | $35,000 |
| Jeremy Lang | $35,000 |
| Additional Investment Requirement | $0 |
| Total Planned Investment | $175,000 |
| Loss at Start-up (Start-up Expenses) | ($124,300) |
| Total Capital | $50,700 |
| Total Capital and Liabilities | $150,700 |
| Total Funding | $275,000 |
| Start-up | |
| Requirements | |
| Start-up Expenses | |
| Legal | $1,000 |
| Stationery etc. | $400 |
| Brochures | $400 |
| Insurance | $1,000 |
| Rent | $1,500 |
| Expensed Equipment | $120,000 |
| Total Start-up Expenses | $124,300 |
| Start-up Assets | |
| Cash Required | $60,700 |
| Other Current Assets | $20,000 |
| Long-term Assets | $70,000 |
| Total Assets | $150,700 |
| Total Requirements | $275,000 |
Services
Gaming Futures’ cohesive, talented development team offer their clients:
- Game concepts and development for PC, PS2, Xbox, Pocket PC
- Game platform ports: PC/PS2/Xbox/Game Boy
- 2D and 3D art, programming, libraries to spec.
- Interface design and software enhancement.
- On time and on budget shipping.
Market Analysis Summary
According to a new report from DFC Intelligence, recent sales indicate that the video game market is poised for impressive growth. The report forecasts that annual unit sales of video games and PC games in the U.S. is expected to grow over 40% from 2001 to 2006. The successful introduction of four new game systems in 2000 and 2001 meant that the industry was able to avoid the major downturn in sales that has occurred in past platform transitions. According to DFC Intelligence, the industry should experience another year of record sales in 2002.
The interactive games industry is a major economic force. With an estimated global value of some $10 to $20 billion, the industry rivals Hollywood in revenues and is now recognized as a propulsive force behind the creation of markets for information and communication technologies. Games account for nearly one-third of consumer software sales in North America.
4.1 Target Market Segment Strategy
Not only was the video game market not slowed by a softening economy or the terrorist attacks, but 2001 turned out to be the best year ever for the U.S. video game industry. The total U.S. video game industry grew from $6.6 billion in 2000 to $9.4 billion in 2001. The previous all-time record was $6.9 billion in 1999.
DFC estimates that by 2006 the three leading games systems, the Sony PlayStation2, the Microsoft Xbox and the Nintendo GameCube, should have combined U.S. sales of over 60 million units. The report forecasts strong sales for all three systems. There are currently 3,000 gaming companies that are producing games for one or more of the leading gaming systems. While strong market growth is predicted, there are also many challenges facing the interactive entertainment industry.
Sales of the total U.S. interactive entertainment software market, which includes PC entertainment and video game software, approached $6 billion in 2001 versus $5.4 billion in 2000, DFC found. Console and portable software sales rose 8.3 percent in unit sales, compared to 2000, while PC entertainment software experienced a unit increase of 3.8 percent. The main challenge is that while unit sales are expected to rise rapidly, development and marketing costs are also soaring.
4.2 Service Business Analysis
Companies are combating development costs by outsourcing segments of the development project. Currently, it is estimated that 30% of project work is outsourced. There are a number of advantages to this strategy.
By outsourcing, companies can take advantage of a tremendous gaming experience base without paying the personnel price tag to retain the talent on payroll. By negotiating a price for the outsourcing, companies can also cap development cost. More importantly, as few larger companies compete in the marketplace for dominance, a number of service firms will emerge to fill the demand for quality developers that are necessary for specific projects, much like the rest of software industry. It is estimated that product development in the software industry can save upwards to 30% of development costs by outsourcing key elements of the development process.
4.2.1 Competition and Buying Patterns
The interactive game industry is based on the hype that is created by core players. The ability to create product that satisfies the gaming demands of core players is a critical consideration when outsourcing opportunities emerge. This unique cultural aspect of the industry influences how companies outsource. Technological expertise is secondary to the ability to create a product that the target group will immediately be comfortable with. Companies are looking for production track records with products with similar play devices that were focused on similar target users. Typically, a selected group of firms are asked to submit proposals for the outsourcing assignment much like an ad campaign. The firm with the best ideas and the best talent to implement the idea gets the contract. Over 80% of the interactive game companies have outsourced segments of game development. This represents a client base of 400 companies.

Currently there are 100+ firms that compete for outsourcing contracts in the interactive game industry. Because of the unique cultural aspect of the interactive gaming community, companies specialize in gaming devices or user groups in order to gain advantage in the proposal process.
The team’s track record is the most important pivotal issue when competing for outsourcing contracts. A firm that has an intact team that has achieved past project goals has an advantage in the bidding process. Production companies are looking for assurances that deadlines will be met and the quality will be there. The production of a game is on a tight schedule and any missed deadline will ripple effect over the entire project, and could result in missed revenues and increased expenses.
Strategy and Implementation Summary
Gaming Futures’ developers, William Kerl and Diane Huber, have extensive connections throughout the gaming industry. They will be responsible for marketing the company’s services to potential customers.
5.1 Competitive Edge
The competitive advantage of Gaming Futures is always bringing in a project before the projected deadline. As noted in the Market Analysis Summary, one of the greatest challenges will be production costs. Nowhere is this more critical than with outsourced projects. If a company can produce by deadline, they will get more work.
5.2 Marketing Strategy
William Kerl and Diane Huber will approach the 120 production companies that are currently producing video games. A marketing CD has been created for these presentations.
William and Diane have begun the process of presenting their company’s services to gaming production companies. The team has created a presentation program that will be the centerpiece of the marketing program.
Currently, the company has been successful in acquiring three contracts with the following companies:
- Clear Mountain Productions
- Weaver Farm, Inc.
The company will continue to aggressively pursue new contracts.
5.3 Sales Strategy
Gaming Futures anticipates that sales will start during the third month. The first two months of operation will have flat sales. After that point, sales will increase.
5.3.1 Sales Forecast
The following is the sales forecast for three years. The owners have agreed not to take a salary for the first three months of the operation, and during this phase all five owners will be involved in sales.


| Sales Forecast | |||
| Year 1 | Year 2 | Year 3 | |
| Sales | |||
| Projects | $279,000 | $380,000 | $644,000 |
| Other | $0 | $0 | $0 |
| Total Sales | $279,000 | $380,000 | $644,000 |
| Direct Cost of Sales | Year 1 | Year 2 | Year 3 |
| Projects | $0 | $0 | $0 |
| Other | $0 | $0 | $0 |
| Subtotal Direct Cost of Sales | $0 | $0 | $0 |
5.4 Milestones
The accompanying table lists important program milestones, with dates and managers in charge, and budgets for each. The milestone schedule indicates our emphasis on planning for implementation.
What the table doesn’t show is the commitment behind it. Our business plan includes complete provisions for plan-vs.-actual analysis, and we will hold monthly follow-up meetings to discuss the variance and course corrections.

| Milestones | |||||
| Milestone | Start Date | End Date | Budget | Manager | Department |
| Office Setup | 5/1/2002 | 5/20/2002 | $5,000 | William Kerl | Admin |
| Equipment/Network Setup | 5/1/2002 | 5/20/2002 | $100,000 | Jeremy Lang | Admin |
| Marketing CD | 3/1/2002 | 4/1/2002 | $2,000 | Diane Huber | Web |
| Face to Face Selling | 4/1/2001 | 6/1/2002 | $2,000 | All | Web |
| Totals | $109,000 | ||||
Personnel Plan
Gaming Futures staff is as follows:
Bill Kerl- Producer/New Business
Starting out with games in 1993 programming on the 3DO, then programming and producing DreæmWhyrks games since 1995, Bill is driven to get things out. Planning for success is the most important part of any project.
Diane Huber – Lead Engineer
Diane has been programming computers for over 25 years and has been making great games for the last 15 years, including DreæmWhyrks, Mighty Quinn, and Fire Mountain.
Marcus Hathcock- Programmer/GamePlay
Marcus is a software engineer who has 5 years experience implementing interfaces and gameplay; most of this time was spent working on the DreæmWhyrks series at Axiomatic.
Jillian Daley- Senior Software Engineer
With 11 years programming experience building games, tools, and technologies, she’s been involved in all aspects of several full 3D sims including Penthesilea and the DreæmWhyrks series.
Jeremy Lang- Software Engineer
Jeremy has specialized in using artificial intelligence to simulate physical events. For the past six years Jeremy’s projects at Axiomatic have included the DreæmWhyrks series, Mighty Quinn, Fire Mountain, and Storm Warnings.
6.1 Management Team Gaps
Currently, the firm doesn’t have a corporate leader to manage the anticipated growth of the company during its third year of operation and beyond. As sales grow, the focus will be on production. The management of the company’s resources and decisions on how to effectively grow the firm will demand an individual with extensive management expertise as well as experience in the interactive gaming industry. This is critical vacancy will be addressed during the third year. The firm will hire a President to fill this role.
Financial Plan
The following is the financial plan for Gaming Futures. The various topic tables display annual figures for the first three years. Monthly figures for the first year are presented in the appendix.
7.1 Break-even Analysis
The following table and chart show our Break-even Analysis.

| Break-even Analysis | |
| Monthly Revenue Break-even | $16,971 |
| Assumptions: | |
| Average Percent Variable Cost | 0% |
| Estimated Monthly Fixed Cost | $16,971 |
7.2 Projected Profit and Loss
The following table and charts highlight the projected profit and loss for three years.


| Pro Forma Profit and Loss | |||
| Year 1 | Year 2 | Year 3 | |
| Sales | $279,000 | $380,000 | $644,000 |
| Direct Cost of Sales | $0 | $0 | $0 |
| Other Production Expenses | $0 | $0 | $0 |
| Total Cost of Sales | $0 | $0 | $0 |
| Gross Margin | $279,000 | $380,000 | $644,000 |
| Gross Margin % | 100.00% | 100.00% | 100.00% |
| Expenses | |||
| Payroll | $135,000 | $210,000 | $370,000 |
| Sales and Marketing and Other Expenses | $12,000 | $15,000 | $20,000 |
| Depreciation | $9,996 | $10,000 | $10,000 |
| Leased Equipment | $0 | $0 | $0 |
| Utilities | $4,800 | $4,800 | $4,800 |
| Insurance | $3,600 | $3,600 | $3,600 |
| Rent | $18,000 | $18,000 | $18,000 |
| Payroll Taxes | $20,250 | $31,500 | $55,500 |
| Other | $0 | $0 | $0 |
| Total Operating Expenses | $203,646 | $292,900 | $481,900 |
| Profit Before Interest and Taxes | $75,354 | $87,100 | $162,100 |
| EBITDA | $85,350 | $97,100 | $172,100 |
| Interest Expense | $8,960 | $7,080 | $5,080 |
| Taxes Incurred | $19,918 | $24,006 | $47,106 |
| Net Profit | $46,476 | $56,014 | $109,914 |
| Net Profit/Sales | 16.66% | 14.74% | 17.07% |
7.3 Projected Cash Flow
The following table and chart highlights the projected cash flow for three years.

| Pro Forma Cash Flow | |||
| Year 1 | Year 2 | Year 3 | |
| Cash Received | |||
| Cash from Operations | |||
| Cash Sales | $69,750 | $95,000 | $161,000 |
| Cash from Receivables | $142,750 | $260,927 | $420,075 |
| Subtotal Cash from Operations | $212,500 | $355,927 | $581,075 |
| Additional Cash Received | |||
| Sales Tax, VAT, HST/GST Received | $0 | $0 | $0 |
| New Current Borrowing | $0 | $0 | $0 |
| New Other Liabilities (interest-free) | $0 | $0 | $0 |
| New Long-term Liabilities | $0 | $0 | $0 |
| Sales of Other Current Assets | $0 | $0 | $0 |
| Sales of Long-term Assets | $0 | $0 | $0 |
| New Investment Received | $0 | $0 | $0 |
| Subtotal Cash Received | $212,500 | $355,927 | $581,075 |
| Expenditures | Year 1 | Year 2 | Year 3 |
| Expenditures from Operations | |||
| Cash Spending | $135,000 | $210,000 | $370,000 |
| Bill Payments | $73,476 | $109,491 | $149,968 |
| Subtotal Spent on Operations | $208,476 | $319,491 | $519,968 |
| Additional Cash Spent | |||
| Sales Tax, VAT, HST/GST Paid Out | $0 | $0 | $0 |
| Principal Repayment of Current Borrowing | $0 | $0 | $0 |
| Other Liabilities Principal Repayment | $0 | $0 | $0 |
| Long-term Liabilities Principal Repayment | $19,200 | $20,000 | $20,000 |
| Purchase Other Current Assets | $0 | $0 | $0 |
| Purchase Long-term Assets | $0 | $0 | $0 |
| Dividends | $0 | $0 | $0 |
| Subtotal Cash Spent | $227,676 | $339,491 | $539,968 |
| Net Cash Flow | ($15,176) | $16,435 | $41,107 |
| Cash Balance | $45,524 | $61,959 | $103,066 |
7.4 Projected Balance Sheet
The following table highlights the projected balance sheet for three years.
| Pro Forma Balance Sheet | |||
| Year 1 | Year 2 | Year 3 | |
| Assets | |||
| Current Assets | |||
| Cash | $45,524 | $61,959 | $103,066 |
| Accounts Receivable | $66,500 | $90,573 | $153,498 |
| Other Current Assets | $20,000 | $20,000 | $20,000 |
| Total Current Assets | $132,024 | $172,533 | $276,564 |
| Long-term Assets | |||
| Long-term Assets | $70,000 | $70,000 | $70,000 |
| Accumulated Depreciation | $9,996 | $19,996 | $29,996 |
| Total Long-term Assets | $60,004 | $50,004 | $40,004 |
| Total Assets | $192,028 | $222,537 | $316,568 |
| Liabilities and Capital | Year 1 | Year 2 | Year 3 |
| Current Liabilities | |||
| Accounts Payable | $14,052 | $8,547 | $12,665 |
| Current Borrowing | $0 | $0 | $0 |
| Other Current Liabilities | $0 | $0 | $0 |
| Subtotal Current Liabilities | $14,052 | $8,547 | $12,665 |
| Long-term Liabilities | $80,800 | $60,800 | $40,800 |
| Total Liabilities | $94,852 | $69,347 | $53,465 |
| Paid-in Capital | $175,000 | $175,000 | $175,000 |
| Retained Earnings | ($124,300) | ($77,824) | ($21,810) |
| Earnings | $46,476 | $56,014 | $109,914 |
| Total Capital | $97,176 | $153,190 | $263,104 |
| Total Liabilities and Capital | $192,028 | $222,537 | $316,568 |
| Net Worth | $97,176 | $153,190 | $263,104 |
7.5 Business Ratios
Business ratios for the years of this plan are shown below. Industry profile ratios based on the Standard Industrial Classification (SIC) code 7371, Computer Programming Services, are shown for comparison.
| Ratio Analysis | ||||
| Year 1 | Year 2 | Year 3 | Industry Profile | |
| Sales Growth | 0.00% | 36.20% | 69.47% | 10.40% |
| Percent of Total Assets | ||||
| Accounts Receivable | 34.63% | 40.70% | 48.49% | 24.10% |
| Other Current Assets | 10.42% | 8.99% | 6.32% | 42.90% |
| Total Current Assets | 68.75% | 77.53% | 87.36% | 71.10% |
| Long-term Assets | 31.25% | 22.47% | 12.64% | 28.90% |
| Total Assets | 100.00% | 100.00% | 100.00% | 100.00% |
| Current Liabilities | 7.32% | 3.84% | 4.00% | 47.80% |
| Long-term Liabilities | 42.08% | 27.32% | 12.89% | 19.10% |
| Total Liabilities | 49.39% | 31.16% | 16.89% | 66.90% |
| Net Worth | 50.61% | 68.84% | 83.11% | 33.10% |
| Percent of Sales | ||||
| Sales | 100.00% | 100.00% | 100.00% | 100.00% |
| Gross Margin | 100.00% | 100.00% | 100.00% | 0.00% |
| Selling, General & Administrative Expenses | 83.34% | 85.26% | 82.93% | 82.10% |
| Advertising Expenses | 4.30% | 3.95% | 3.11% | 1.20% |
| Profit Before Interest and Taxes | 27.01% | 22.92% | 25.17% | 2.00% |
| Main Ratios | ||||
| Current | 9.40 | 20.19 | 21.84 | 1.30 |
| Quick | 9.40 | 20.19 | 21.84 | 1.03 |
| Total Debt to Total Assets | 49.39% | 31.16% | 16.89% | 66.90% |
| Pre-tax Return on Net Worth | 68.32% | 52.24% | 59.68% | 3.10% |
| Pre-tax Return on Assets | 34.58% | 35.96% | 49.60% | 9.30% |
| Additional Ratios | Year 1 | Year 2 | Year 3 | |
| Net Profit Margin | 16.66% | 14.74% | 17.07% | n.a |
| Return on Equity | 47.83% | 36.57% | 41.78% | n.a |
| Activity Ratios | ||||
| Accounts Receivable Turnover | 3.15 | 3.15 | 3.15 | n.a |
| Collection Days | 55 | 101 | 92 | n.a |
| Accounts Payable Turnover | 6.23 | 12.17 | 12.17 | n.a |
| Payment Days | 27 | 40 | 25 | n.a |
| Total Asset Turnover | 1.45 | 1.71 | 2.03 | n.a |
| Debt Ratios | ||||
| Debt to Net Worth | 0.98 | 0.45 | 0.20 | n.a |
| Current Liab. to Liab. | 0.15 | 0.12 | 0.24 | n.a |
| Liquidity Ratios | ||||
| Net Working Capital | $117,972 | $163,986 | $263,900 | n.a |
| Interest Coverage | 8.41 | 12.30 | 31.91 | n.a |
| Additional Ratios | ||||
| Assets to Sales | 0.69 | 0.59 | 0.49 | n.a |
| Current Debt/Total Assets | 7% | 4% | 4% | n.a |
| Acid Test | 4.66 | 9.59 | 9.72 | n.a |
| Sales/Net Worth | 2.87 | 2.48 | 2.45 | n.a |
| Dividend Payout | 0.00 | 0.00 | 0.00 | n.a |
Appendix
| Sales Forecast | |||||||||||||
| Month 1 | Month 2 | Month 3 | Month 4 | Month 5 | Month 6 | Month 7 | Month 8 | Month 9 | Month 10 | Month 11 | Month 12 | ||
| Sales | |||||||||||||
| Projects | 0% | $0 | $0 | $10,000 | $15,000 | $17,000 | $24,000 | $28,000 | $30,000 | $30,000 | $35,000 | $40,000 | $50,000 |
| Other | 0% | $0 | $0 | $0 | $0 | $0 | $0 | $0 | $0 | $0 | $0 | $0 | $0 |
| Total Sales | $0 | $0 | $10,000 | $15,000 | $17,000 | $24,000 | $28,000 | $30,000 | $30,000 | $35,000 | $40,000 | $50,000 | |
| Direct Cost of Sales | Month 1 | Month 2 | Month 3 | Month 4 | Month 5 | Month 6 | Month 7 | Month 8 | Month 9 | Month 10 | Month 11 | Month 12 | |
| Projects | $0 | $0 | $0 | $0 | $0 | $0 | $0 | $0 | $0 | $0 | $0 | $0 | |
| Other | $0 | $0 | $0 | $0 | $0 | $0 | $0 | $0 | $0 | $0 | $0 | $0 | |
| Subtotal Direct Cost of Sales | $0 | $0 | $0 | $0 | $0 | $0 | $0 | $0 | $0 | $0 | $0 | $0 | |
| Personnel Plan | |||||||||||||
| Month 1 | Month 2 | Month 3 | Month 4 | Month 5 | Month 6 | Month 7 | Month 8 | Month 9 | Month 10 | Month 11 | Month 12 | ||
| Bill Kerl | 0% | $0 | $0 | $0 | $3,000 | $3,000 | $3,000 | $3,000 | $3,000 | $3,000 | $3,000 | $3,000 | $3,000 |
| Diane Huber | 0% | $0 | $0 | $0 | $3,000 | $3,000 | $3,000 | $3,000 | $3,000 | $3,000 | $3,000 | $3,000 | $3,000 |
| Marcus Hathcock | 0% | $0 | $0 | $0 | $3,000 | $3,000 | $3,000 | $3,000 | $3,000 | $3,000 | $3,000 | $3,000 | $3,000 |
| Jillian Daley | 0% | $0 | $0 | $0 | $3,000 | $3,000 | $3,000 | $3,000 | $3,000 | $3,000 | $3,000 | $3,000 | $3,000 |
| Jeremy Lang | 0% | $0 | $0 | $0 | $3,000 | $3,000 | $3,000 | $3,000 | $3,000 | $3,000 | $3,000 | $3,000 | $3,000 |
| President | 0% | $0 | $0 | $0 | $0 | $0 | $0 | $0 | $0 | $0 | $0 | $0 | $0 |
| Total People | 5 | 5 | 5 | 5 | 5 | 5 | 5 | 5 | 5 | 5 | 5 | 5 | |
| Total Payroll | $0 | $0 | $0 | $15,000 | $15,000 | $15,000 | $15,000 | $15,000 | $15,000 | $15,000 | $15,000 | $15,000 | |
| General Assumptions | |||||||||||||
| Month 1 | Month 2 | Month 3 | Month 4 | Month 5 | Month 6 | Month 7 | Month 8 | Month 9 | Month 10 | Month 11 | Month 12 | ||
| Plan Month | 1 | 2 | 3 | 4 | 5 | 6 | 7 | 8 | 9 | 10 | 11 | 12 | |
| Current Interest Rate | 10.00% | 10.00% | 10.00% | 10.00% | 10.00% | 10.00% | 10.00% | 10.00% | 10.00% | 10.00% | 10.00% | 10.00% | |
| Long-term Interest Rate | 10.00% | 10.00% | 10.00% | 10.00% | 10.00% | 10.00% | 10.00% | 10.00% | 10.00% | 10.00% | 10.00% | 10.00% | |
| Tax Rate | 30.00% | 30.00% | 30.00% | 30.00% | 30.00% | 30.00% | 30.00% | 30.00% | 30.00% | 30.00% | 30.00% | 30.00% | |
| Other | 0 | 0 | 0 | 0 | 0 | 0 | 0 | 0 | 0 | 0 | 0 | 0 | |
| Pro Forma Profit and Loss | |||||||||||||
| Month 1 | Month 2 | Month 3 | Month 4 | Month 5 | Month 6 | Month 7 | Month 8 | Month 9 | Month 10 | Month 11 | Month 12 | ||
| Sales | $0 | $0 | $10,000 | $15,000 | $17,000 | $24,000 | $28,000 | $30,000 | $30,000 | $35,000 | $40,000 | $50,000 | |
| Direct Cost of Sales | $0 | $0 | $0 | $0 | $0 | $0 | $0 | $0 | $0 | $0 | $0 | $0 | |
| Other Production Expenses | $0 | $0 | $0 | $0 | $0 | $0 | $0 | $0 | $0 | $0 | $0 | $0 | |
| Total Cost of Sales | $0 | $0 | $0 | $0 | $0 | $0 | $0 | $0 | $0 | $0 | $0 | $0 | |
| Gross Margin | $0 | $0 | $10,000 | $15,000 | $17,000 | $24,000 | $28,000 | $30,000 | $30,000 | $35,000 | $40,000 | $50,000 | |
| Gross Margin % | 0.00% | 0.00% | 100.00% | 100.00% | 100.00% | 100.00% | 100.00% | 100.00% | 100.00% | 100.00% | 100.00% | 100.00% | |
| Expenses | |||||||||||||
| Payroll | $0 | $0 | $0 | $15,000 | $15,000 | $15,000 | $15,000 | $15,000 | $15,000 | $15,000 | $15,000 | $15,000 | |
| Sales and Marketing and Other Expenses | $1,000 | $1,000 | $1,000 | $1,000 | $1,000 | $1,000 | $1,000 | $1,000 | $1,000 | $1,000 | $1,000 | $1,000 | |
| Depreciation | $833 | $833 | $833 | $833 | $833 | $833 | $833 | $833 | $833 | $833 | $833 | $833 | |
| Leased Equipment | $0 | $0 | $0 | $0 | $0 | $0 | $0 | $0 | $0 | $0 | $0 | $0 | |
| Utilities | $400 | $400 | $400 | $400 | $400 | $400 | $400 | $400 | $400 | $400 | $400 | $400 | |
| Insurance | $300 | $300 | $300 | $300 | $300 | $300 | $300 | $300 | $300 | $300 | $300 | $300 | |
| Rent | $1,500 | $1,500 | $1,500 | $1,500 | $1,500 | $1,500 | $1,500 | $1,500 | $1,500 | $1,500 | $1,500 | $1,500 | |
| Payroll Taxes | 15% | $0 | $0 | $0 | $2,250 | $2,250 | $2,250 | $2,250 | $2,250 | $2,250 | $2,250 | $2,250 | $2,250 |
| Other | $0 | $0 | $0 | $0 | $0 | $0 | $0 | $0 | $0 | $0 | $0 | $0 | |
| Total Operating Expenses | $4,033 | $4,033 | $4,033 | $21,283 | $21,283 | $21,283 | $21,283 | $21,283 | $21,283 | $21,283 | $21,283 | $21,283 | |
| Profit Before Interest and Taxes | ($4,033) | ($4,033) | $5,967 | ($6,283) | ($4,283) | $2,717 | $6,717 | $8,717 | $8,717 | $13,717 | $18,717 | $28,717 | |
| EBITDA | ($3,200) | ($3,200) | $6,800 | ($5,450) | ($3,450) | $3,550 | $7,550 | $9,550 | $9,550 | $14,550 | $19,550 | $29,550 | |
| Interest Expense | $820 | $807 | $793 | $780 | $767 | $753 | $740 | $727 | $713 | $700 | $687 | $673 | |
| Taxes Incurred | ($1,456) | ($1,452) | $1,552 | ($2,119) | ($1,515) | $589 | $1,793 | $2,397 | $2,401 | $3,905 | $5,409 | $8,413 | |
| Net Profit | ($3,397) | ($3,388) | $3,622 | ($4,944) | ($3,535) | $1,375 | $4,184 | $5,593 | $5,603 | $9,112 | $12,621 | $19,631 | |
| Net Profit/Sales | 0.00% | 0.00% | 36.22% | -32.96% | -20.79% | 5.73% | 14.94% | 18.64% | 18.68% | 26.03% | 31.55% | 39.26% | |
| Pro Forma Cash Flow | |||||||||||||
| Month 1 | Month 2 | Month 3 | Month 4 | Month 5 | Month 6 | Month 7 | Month 8 | Month 9 | Month 10 | Month 11 | Month 12 | ||
| Cash Received | |||||||||||||
| Cash from Operations | |||||||||||||
| Cash Sales | $0 | $0 | $2,500 | $3,750 | $4,250 | $6,000 | $7,000 | $7,500 | $7,500 | $8,750 | $10,000 | $12,500 | |
| Cash from Receivables | $0 | $0 | $0 | $250 | $7,625 | $11,300 | $12,925 | $18,100 | $21,050 | $22,500 | $22,625 | $26,375 | |
| Subtotal Cash from Operations | $0 | $0 | $2,500 | $4,000 | $11,875 | $17,300 | $19,925 | $25,600 | $28,550 | $31,250 | $32,625 | $38,875 | |
| Additional Cash Received | |||||||||||||
| Sales Tax, VAT, HST/GST Received | 0.00% | $0 | $0 | $0 | $0 | $0 | $0 | $0 | $0 | $0 | $0 | $0 | $0 |
| New Current Borrowing | $0 | $0 | $0 | $0 | $0 | $0 | $0 | $0 | $0 | $0 | $0 | $0 | |
| New Other Liabilities (interest-free) | $0 | $0 | $0 | $0 | $0 | $0 | $0 | $0 | $0 | $0 | $0 | $0 | |
| New Long-term Liabilities | $0 | $0 | $0 | $0 | $0 | $0 | $0 | $0 | $0 | $0 | $0 | $0 | |
| Sales of Other Current Assets | $0 | $0 | $0 | $0 | $0 | $0 | $0 | $0 | $0 | $0 | $0 | $0 | |
| Sales of Long-term Assets | $0 | $0 | $0 | $0 | $0 | $0 | $0 | $0 | $0 | $0 | $0 | $0 | |
| New Investment Received | $0 | $0 | $0 | $0 | $0 | $0 | $0 | $0 | $0 | $0 | $0 | $0 | |
| Subtotal Cash Received | $0 | $0 | $2,500 | $4,000 | $11,875 | $17,300 | $19,925 | $25,600 | $28,550 | $31,250 | $32,625 | $38,875 | |
| Expenditures | Month 1 | Month 2 | Month 3 | Month 4 | Month 5 | Month 6 | Month 7 | Month 8 | Month 9 | Month 10 | Month 11 | Month 12 | |
| Expenditures from Operations | |||||||||||||
| Cash Spending | $0 | $0 | $0 | $15,000 | $15,000 | $15,000 | $15,000 | $15,000 | $15,000 | $15,000 | $15,000 | $15,000 | |
| Bill Payments | $85 | $2,564 | $2,654 | $5,498 | $4,131 | $4,771 | $6,832 | $8,003 | $8,573 | $8,614 | $10,105 | $11,645 | |
| Subtotal Spent on Operations | $85 | $2,564 | $2,654 | $20,498 | $19,131 | $19,771 | $21,832 | $23,003 | $23,573 | $23,614 | $25,105 | $26,645 | |
| Additional Cash Spent | |||||||||||||
| Sales Tax, VAT, HST/GST Paid Out | $0 | $0 | $0 | $0 | $0 | $0 | $0 | $0 | $0 | $0 | $0 | $0 | |
| Principal Repayment of Current Borrowing | $0 | $0 | $0 | $0 | $0 | $0 | $0 | $0 | $0 | $0 | $0 | $0 | |
| Other Liabilities Principal Repayment | $0 | $0 | $0 | $0 | $0 | $0 | $0 | $0 | $0 | $0 | $0 | $0 | |
| Long-term Liabilities Principal Repayment | $1,600 | $1,600 | $1,600 | $1,600 | $1,600 | $1,600 | $1,600 | $1,600 | $1,600 | $1,600 | $1,600 | $1,600 | |
| Purchase Other Current Assets | $0 | $0 | $0 | $0 | $0 | $0 | $0 | $0 | $0 | $0 | $0 | $0 | |
| Purchase Long-term Assets | $0 | $0 | $0 | $0 | $0 | $0 | $0 | $0 | $0 | $0 | $0 | $0 | |
| Dividends | $0 | $0 | $0 | $0 | $0 | $0 | $0 | $0 | $0 | $0 | $0 | $0 | |
| Subtotal Cash Spent | $1,685 | $4,164 | $4,254 | $22,098 | $20,731 | $21,371 | $23,432 | $24,603 | $25,173 | $25,214 | $26,705 | $28,245 | |
| Net Cash Flow | ($1,685) | ($4,164) | ($1,754) | ($18,098) | ($8,856) | ($4,071) | ($3,507) | $997 | $3,377 | $6,036 | $5,920 | $10,630 | |
| Cash Balance | $59,015 | $54,851 | $53,096 | $34,999 | $26,143 | $22,071 | $18,564 | $19,562 | $22,938 | $28,974 | $34,894 | $45,524 | |
| Pro Forma Balance Sheet | |||||||||||||
| Month 1 | Month 2 | Month 3 | Month 4 | Month 5 | Month 6 | Month 7 | Month 8 | Month 9 | Month 10 | Month 11 | Month 12 | ||
| Assets | Starting Balances | ||||||||||||
| Current Assets | |||||||||||||
| Cash | $60,700 | $59,015 | $54,851 | $53,096 | $34,999 | $26,143 | $22,071 | $18,564 | $19,562 | $22,938 | $28,974 | $34,894 | $45,524 |
| Accounts Receivable | $0 | $0 | $0 | $7,500 | $18,500 | $23,625 | $30,325 | $38,400 | $42,800 | $44,250 | $48,000 | $55,375 | $66,500 |
| Other Current Assets | $20,000 | $20,000 | $20,000 | $20,000 | $20,000 | $20,000 | $20,000 | $20,000 | $20,000 | $20,000 | $20,000 | $20,000 | $20,000 |
| Total Current Assets | $80,700 | $79,015 | $74,851 | $80,596 | $73,499 | $69,768 | $72,396 | $76,964 | $82,362 | $87,188 | $96,974 | $110,269 | $132,024 |
| Long-term Assets | |||||||||||||
| Long-term Assets | $70,000 | $70,000 | $70,000 | $70,000 | $70,000 | $70,000 | $70,000 | $70,000 | $70,000 | $70,000 | $70,000 | $70,000 | $70,000 |
| Accumulated Depreciation | $0 | $833 | $1,666 | $2,499 | $3,332 | $4,165 | $4,998 | $5,831 | $6,664 | $7,497 | $8,330 | $9,163 | $9,996 |
| Total Long-term Assets | $70,000 | $69,167 | $68,334 | $67,501 | $66,668 | $65,835 | $65,002 | $64,169 | $63,336 | $62,503 | $61,670 | $60,837 | $60,004 |
| Total Assets | $150,700 | $148,182 | $143,185 | $148,097 | $140,167 | $135,603 | $137,398 | $141,133 | $145,698 | $149,691 | $158,644 | $171,106 | $192,028 |
| Liabilities and Capital | Month 1 | Month 2 | Month 3 | Month 4 | Month 5 | Month 6 | Month 7 | Month 8 | Month 9 | Month 10 | Month 11 | Month 12 | |
| Current Liabilities | |||||||||||||
| Accounts Payable | $0 | $2,479 | $2,470 | $5,361 | $3,974 | $4,545 | $6,566 | $7,717 | $8,288 | $8,279 | $9,720 | $11,161 | $14,052 |
| Current Borrowing | $0 | $0 | $0 | $0 | $0 | $0 | $0 | $0 | $0 | $0 | $0 | $0 | $0 |
| Other Current Liabilities | $0 | $0 | $0 | $0 | $0 | $0 | $0 | $0 | $0 | $0 | $0 | $0 | $0 |
| Subtotal Current Liabilities | $0 | $2,479 | $2,470 | $5,361 | $3,974 | $4,545 | $6,566 | $7,717 | $8,288 | $8,279 | $9,720 | $11,161 | $14,052 |
| Long-term Liabilities | $100,000 | $98,400 | $96,800 | $95,200 | $93,600 | $92,000 | $90,400 | $88,800 | $87,200 | $85,600 | $84,000 | $82,400 | $80,800 |
| Total Liabilities | $100,000 | $100,879 | $99,270 | $100,561 | $97,574 | $96,545 | $96,966 | $96,517 | $95,488 | $93,879 | $93,720 | $93,561 | $94,852 |
| Paid-in Capital | $175,000 | $175,000 | $175,000 | $175,000 | $175,000 | $175,000 | $175,000 | $175,000 | $175,000 | $175,000 | $175,000 | $175,000 | $175,000 |
| Retained Earnings | ($124,300) | ($124,300) | ($124,300) | ($124,300) | ($124,300) | ($124,300) | ($124,300) | ($124,300) | ($124,300) | ($124,300) | ($124,300) | ($124,300) | ($124,300) |
| Earnings | $0 | ($3,397) | ($6,785) | ($3,163) | ($8,107) | ($11,642) | ($10,268) | ($6,084) | ($490) | $5,112 | $14,224 | $26,845 | $46,476 |
| Total Capital | $50,700 | $47,303 | $43,915 | $47,537 | $42,593 | $39,058 | $40,432 | $44,616 | $50,210 | $55,812 | $64,924 | $77,545 | $97,176 |
| Total Liabilities and Capital | $150,700 | $148,182 | $143,185 | $148,097 | $140,167 | $135,603 | $137,398 | $141,133 | $145,698 | $149,691 | $158,644 | $171,106 | $192,028 |
| Net Worth | $50,700 | $47,303 | $43,915 | $47,537 | $42,593 | $39,058 | $40,432 | $44,616 | $50,210 | $55,812 | $64,924 | $77,545 | $97,176 |


