
Brilliant Points, Inc.
Executive Summary
Brilliant Points, Inc. (Brilliant Points or the Company) is a software and services company that uses unique software designs and configurations to transfer information from users to computers through innovative applications of laser, optical, and video technologies. The Company currently has received one U.S. patent in the field of optical control of computers (e.g. computer-based presentations) and has applied for others that have promising applications. Foreign patents have also been applied for and are pending.
The Company’s mission is to identify and create new intellectual property, secure the intellectual property through international patent applications, aggressively protect the patents against infringement, and ultimately enter into licensing agreements with manufacturers and vendors of optical, laser, and video components. The Company has also designed multiple products that leverage its intellectual property into revenue. These products have immediate applications in home, corporate, educational, gaming, and government environments.
Brilliant Points has entered the computer presentation market space with innovative, cutting-edge technologies that have real world applications and are simple to use. The Company believes that it has created technologies whose time has come. The opportunity for the Company lies in securing marketable, patentable technologies and then to successfully obtain licensing agreements with current manufacturers of existing solutions, thus helping to expand their product line and offer innovative solutions for common problems.
The first patented technology to be created by Brilliant Points, U.S. Patent #6,275,214 – Computer Presentation System and Method With Optical Tracking of Wireless Pointer, utilizes software to enable full computer control via common laser-pointing devices and drivers that give the high-end laser pointing device the functionality of an integrated mouse and keyboard. This makes presentations much more user-friendly, expands the range of possibilities for presenters, and opens up new application areas for gaming and entertainment. By combining the functionality of two necessary peripherals, the mouse and the keyboard, into the already useful laser pointer, Brilliant Points allows the presenter or user to focus more on the art of the presentation or application, rather than the technology enabling it. A three-minute demo video is available for download from http://kchansen.home.att.net/.
The computer presentation market is large, and is growing rapidly. Research firm Stanford Resources estimates that two years ago, worldwide shipments of business projectors (each of which represents a presentation system for a boardroom, conference room, etc.) approached 1.4 million units and $6 billion in revenue. They also forecast this market to approach 4.5 million units and $10 billion in revenue four years from now. PC manufacturers have significant interest in this market as well, evidenced by recent announcements by Hewlett-Packard and Dell that they intend to commence shipments of business projector systems. InFocus, a very large business projector manufacturer, has targeted achievement of 4% “attachment rate” of its business projectors to the laptop computer market. The at-home market for these devices is also expected to explode. InFocus forecasts that its projector system shipments for home entertainment systems could exceed 2.5 million units by next year. For more information, see:
http://news.com.com/2100-1040-878277.html
http://media.corporate-ir.net/media_files/NSD/infs/presentations/2002shareholdermeeting/sld032.htm
http://media.corporate-ir.net/media_files/NSD/infs/presentations/2002shareholdermeeting/sld041.htm
Brilliant Points expects to penetrate the presentation systems market by aggressively marketing and licensing its technology, through sales of “upgrade” kits (consisting of Webcam, pointer, and Company software) to existing projector owners, and with sales/licensing of Brilliant Points SDK tools that enable other companies to develop applications and drivers which build on the patented Brilliant Points technology.
The Company intends to initially focus on retrofitting the current presentation hardware owners through “upgrade” kits. At the same time, Brilliant Points hopes to create the latent demand necessary to motivate the makers of presentation hardware to include the Brilliant Points software set and laser pointers with their hardware as a replacement for the limited functionality of a remote or other controlling device. A focus on business presentation systems could also lead to applications in other industries, such as home entertainment, gaming, and webcams, all very large and growing markets which could be enhanced by the software solutions set designed by Brilliant Points.
This forecast proliferation of computer-based projection systems, coupled with the expected demand for Brilliant Points technology, alone makes a strong case for investment in the Company, but there are other opportunities under development which have as much or more potential but will take more time to develop and realize.
Brilliant Points is currently developing patent pending products that make it possible to (1) securely transmit data through the laser-pointing device (secure pointer technology), (2) use a complex laser emitter head capable of forming distinct colors and/or patterns (complex pointer technology), and/or (3) use stabilization mechanisms in the pointer device to reduce “pointer jitter” during a presentation (stable pointer technology). Secure pointer technology improves the performance and applicability of the hardware and software, giving users the ability to confidently use the technology developed by Brilliant Points in multiple devices and related applications without concern for audience interference, such as where hostile audience members attempt to scramble a presentation with their own pointers. Secure pointer technology also opens up opportunities within the military community, by enhancing laser target designator devices, for example, or creating undetectable secure optical communications links which can be sensed directly user-to-user or indirectly via reflections off of walls, clouds, or other obstacles. Complex pointer technology makes possible the development of multi-user interfaces where each user has a unique secure/complex pointing device. Complex/secure pointer technology makes possible presentations which involve audience interaction where audience members have distinct secure/complex pointers from that of the presenter, and also has applications within the military community. Stabilized pointers make it easier for the average user to select menu items, click buttons, etc., during a presentation, and reduce the distraction to the audience that comes from random hand or finger movements causing the pointer on the screen to jump about.
Each of these development areas, (1) secure pointers, (2) complex pointers, and (3) stabilized pointers, in and of itself opens up new sales channels for the laser pointer industry, while simultaneously generating additional revenue streams for Brilliant Points. It is anticipated that these technologies will be of substantial interest to existing laser pointer manufacturers because they will enable a paradigm shift in the market, away from a commodity based one, to a market based on products individualized to specific applications and needs, substantially increasing profits to the manufacturers and to Brilliant Points. While the laser pointing device market has been in decline, it opens doors to future revenue possibilities for Brilliant Points. Some of the companies that manufacture laser pointers are extremely large and have a very diverse product base. By leveraging relationships created through the Brilliant Points presentation product, the Company may be able to expand its licensing revenues through the same companies with new innovations. Because the Brilliant Points presentation system will add functionality to laser pointers, management believes that licensees in the laser pointing device market, which has recently seen substantial declines due to commoditization of the market, will see positive impacts in their markets by permitting them to offer more and better features than competitors, moving them away from a commodity-type market and increasing sales and revenue.

Brilliant Points intends to aggressively pursue licensing agreements with large manufacturers who are already in this market, as well as defend its patents against infringement by competitors. By pursuing this approach, the Company intends to keep costs low while generating significant income for its owners.
Because it is a true start-up, Brilliant Points does not have historical financials, and due to the course it is pursuing, it is very difficult to project revenues with certainty. However, for the purposes of this analysis, the Company has made some basic assumptions that show licensing revenues based on licensing a small percentage of the business presentation system industry. According to these assumptions, the company expects to have significant revenues in its first 18 months of operations, based on achieving licensing of approximately one and one half percent of the forecast business projector sales and/or sales of 60,000 presentation system “upgrade” kits to existing presentation installations in the market today. While the analysis of this plan is based on these projections, “blue-sky” optimistic projections, assuming significant licensing penetration and higher per-unit nets, show potential revenues to the Company in the hundreds of millions per year within five years. Should the anticipated penetration of (1) home entertainment, (2) gaming, (3) military, and (4) pointer manufacturer markets occur, even these highly optimistic estimates may turn out to be low.
Brilliant Points is seeking major capital investment and a line of credit to bring in critical talent and commence aggressive marketing, licensing, and sales of Brilliant Points technology. Brilliant Points anticipates an investor liquidity event horizon at approximately five years consisting of (1) IPO, or (2) acquisition, or (3) Full Intellectual Property purchase by one of the larger companies in this space.
1.1 Objectives
First three months:
- Recruit marketing, sales, and operations directors.
- Recruit software and hardware development staff.
- Obtain office space.
- Commence software/hardware design and development.
- Enhance website.
- Design marketing/sales campaigns.
First six months:
- Release-candidate-1 hardware for simple pointer. (Multiple dots and/or colors.)
- Release-candidate-1 driver software for Win platform(s) driver.
- Beta-1 LaserBoard™ SDK.
- Preliminary licensing negotiations with manufacturers/resellers
-
- Projectors
- Webcams
- Pointers
- PC manufacturers
- OS
- Commence advertising campaigns (under supervision of marketing director).
- Enhance website to handle direct orders and downloads.
- Shipping “Upgrade” kits to in-place business projector owners (e.g. boardrooms, conference rooms, lecture circuit)
-
- Webcam
- Simple pointer
- Simple control application
First year:
- Develop and market multi-button optical pointer. Include options for external keypad, headset, secure pointer, etc.
- Alpha-1 hardware/software for enhanced pointer. (Display head using DLP or other technology.)
- Negotiating first licensing deals with pointer, projector, and Webcam manufacturers/resellers.
- Continue R&D investigation of related technology areas.
- Continue pursuit of IP protection via patent, trademark, and copyright.
- Shipping/Licensing simple pointer, simple driver, enhanced driver.
- 10,000 “Upgrade” kits shipped.
Eighteen months:
- Develop and market secure pointer, with options.
- Develop gaming interface SDK.
- Close first licensing deals.
- 50,000 “Upgrade” kits shipped.
- cash flow positive.
Second year:
- Achieve 1.5% licensing penetration of business projector market.
- Achieve 10% licensing penetration of pointer market.
- 60,000 “Upgrade” kits shipped in year.
- Preliminary licensing negotiations with gaming device manufacturers.
- Continue R&D investigation of related technology areas.
- Continue pursuit of IP protection via patent, trademark, and copyright.
- Profitable.
Third year:
- Achieve 2.5% licensing penetration of business projector market.
- Achieve 20% licensing penetration of pointer market.
- 90,000 “Upgrade” kits shipped in year.
- Continue R&D investigation of related technology areas.
- Continue pursuit of IP protection via patent, trademark, and copyright.
Fourth year:
- Achieve 4% licensing penetration of business projector market.
- Achieve 40% licensing penetration of pointer market.
- Close first licensing deals with gaming device manufacturers.
- 150,000 “Upgrade” kits shipped in year.
- Continue R&D investigation of related technology areas.
- Continue pursuit of IP protection via patent, trademark, and copyright.
Ongoing:
- Investigate and pursue additional licensing areas.
- Increase licensing penetration each year, with goal of 50% or better, for each market area.
- Make software and hardware easy to use, safe, and “idiot-resistant”.
- Make Brilliant Points a household name so that when IP protection begins to expire, people still look first to Brilliant Points for laser and imaging technology solutions.
- Continue R&D investigation of related technology areas.
- Continue pursuit of IP protection via patent, trademark, and copyright.
Investor Exit Strategies:
- Go public around 5th year.
- Acquired by another company
- Input device manufacturer/reseller
- Projector manufacturer/reseller
- OS manufacturer/reseller
- PC manufacturer
- Laser pointer manufacturer/reseller
- Webcam manufacturer/reseller
- Exclusive full-rights licenses to dedicated areas with revenue stream guaranteed for duration of patent.
1.2 Mission
Brilliant Points is in the business of transfer of information from users to computer systems through innovative applications of laser, optical, and video technologies.
Our mission is to define and create new applications, protect those applications so we may better ensure their quality, and bring them into all aspects of human/computer interaction from the corporate boardrooms, to the home user, to the gaming arena.
Our applications will provide users with “cool” yet cutting-edge technologies which are simple to use and robust in operation.
We will accomplish this while providing obvious superior quality to our customers, excellent customer service, and creating a mentally stimulating and enjoyable work environment for our employees.
1.3 Keys to Success
- Patented technology, involving substantial, useful enhancement to existing presentation methods, providing 15 to 17 years of monopoly-like development environment.
- Aggressive protection of IP through patent, copyright, and legal enforcement.
- Rapid development, marketing, and penetration of market to enhance visibility to potential buyers and/or acquirers.
- Licensing of technology to others, rather than being sole-source of hardware/software.
Company Summary
Brilliant Points, Inc., is a Delaware S-corporation which was founded in 2000 to bring innovative applications of laser and imaging technology into the everyday computer user’s world. Its first focus was on enhancing the “computer presentation” environment by turning the common laser pointer into a useful computer input device rather than a “carnival toy.” U.S. Patent #6,275,214 was awarded in this area in the fall of 2001. International patents for this technology are applied for, and additional patents covering further uses of laser technology have been prepared and submitted. Brilliant Points shareholders have invested large sums and over 10,000 hours in R & D and initial development culminating in successful pursuit of the core patent. After obtaining this critical protection of its core technology, the shareholders formed Brilliant Points in order to develop and market the products enabled by this technology.
The business presentation market is best represented by the unit sales of business-use projectors, e.g., InFocus. In 2001, there were approximately 1,400,000 business projector sales, and this market is expected to grow to sales of 4,500,000 units by 2007. The Company intends to use its patented technology to penetrate this market during the early years of its patent protection and establish itself as “the source” for this kind of technology in preparation for the time when this and future patents expire. By building its base during the protected years, and keeping per-unit revenue requirements low, prohibitive natural barriers to entry will exist once the patents begin to expire which will help Brilliant Points retain its position as the market leader.
2.1 Company Ownership
Brilliant Points, Inc., is currently owned by Karl and Lisa Hansen, each 50% owners of the company.
2.2 Start-up Summary
Start-up assumptions:
Legal – Costs incurred to date for patent and copyright research and fees, both domestic and international.
Consultants – Experts brought in to advise and flesh out business plan and organization needs.
Rent – For the first two to three months the executive team will be working out of their houses while we locate suitable facilities. Prime office space in the Amherst, NH, area runs between $15 and $22 per square foot per year, which will begin paying in the 2nd to 4th month. The figure is an estimate of the entire first-year’s full-services lease for a facility with 2,000 to 3,500 square feet of space, which should suffice for projected growth for the first two years.
Research & Development – Expenses incurred during the development and patenting of the core Brilliant Points IP.
Expensed Equipment – Equipment purchased and/or leased to support the R&D effort.
Office Equipment – Equipment and/or furniture for ten to twelve people and/or offices.
| Start-up | |
| Requirements | |
| Start-up Expenses | |
| Legal | $75,000 |
| Office supplies (Stationery, pens, pencils, etc.) | $1,000 |
| Brochures | $1,000 |
| Consultants | $20,000 |
| Insurance | $2,000 |
| Rent | $75,000 |
| Research and Development | $650,000 |
| Expensed Equipment | $55,000 |
| Office Equipment | $55,000 |
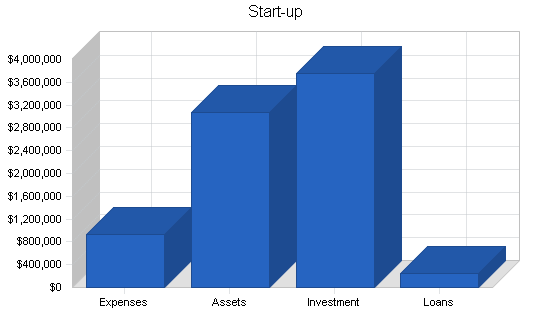
| Total Start-up Expenses | $934,000 |
| Start-up Assets | |
| Cash Required | $3,066,000 |
| Other Current Assets | $0 |
| Long-term Assets | $0 |
| Total Assets | $3,066,000 |
| Total Requirements | $4,000,000 |
| Start-up Funding | |
| Start-up Expenses to Fund | $934,000 |
| Start-up Assets to Fund | $3,066,000 |
| Total Funding Required | $4,000,000 |
| Assets | |
| Non-cash Assets from Start-up | $0 |
| Cash Requirements from Start-up | $3,066,000 |
| Additional Cash Raised | $0 |
| Cash Balance on Starting Date | $3,066,000 |
| Total Assets | $3,066,000 |
| Liabilities and Capital | |
| Liabilities | |
| Current Borrowing | $250,000 |
| Long-term Liabilities | $0 |
| Accounts Payable (Outstanding Bills) | $0 |
| Other Current Liabilities (interest-free) | $0 |
| Total Liabilities | $250,000 |
| Capital | |
| Planned Investment | |
| Karl C. Hansen | $750,000 |
| Outside Investor 1 | $750,000 |
| Outside Investor 2 | $750,000 |
| Outside Investor 3 | $750,000 |
| Outside Investor 4 | $750,000 |
| Additional Investment Requirement | $0 |
| Total Planned Investment | $3,750,000 |
| Loss at Start-up (Start-up Expenses) | ($934,000) |
| Total Capital | $2,816,000 |
| Total Capital and Liabilities | $3,066,000 |
| Total Funding | $4,000,000 |
Products
Many presenters make use of optical pointers such as laser pointers during their presentations. Presentations have evolved across the past couple of decades from extremely basic to quite complex, as the capabilities of the presentation design software packages have been enhanced. Unfortunately there remain significant restrictions on the typical computer-based presentation. First, a presentation must, almost by definition, advance sequentially from slide to slide. This requires that a presentation be timed to advance automatically at preset times forcing the presenter to a rigid pace, or requires that the presenter remain near the computer in order to control the presentation, or forces the presenter to carry some kind of remote-control device with wires or RF problems, or incurs the added cost of an assistant who advances the slides on cue. If a presenter wishes to skip slides or go back to earlier slides they must access the keyboard on the computer, or sequentially cycle past the undesired slides, or inform their assistant which slide is desired and hope they understand and locate it. Second, a presentation cannot demonstrate complex applications, but must resort to screen-demos or pre-built demo videos to show how an application works, completely removing the presenter from the demonstration. If a presenter wishes to fully demonstrate an application, they become tied to the computer keyboard and mouse while they run the application. Yet another complication is that a presenter typically wears a wireless microphone, carries some form of wireless computer remote which may interfere with the wireless microphone and has restricted usefulness, and uses a laser pointer as well.
Brilliant Points, Inc., resolves these and other presentation problems by turning the common laser pointer into a general computer input device, making possible mouse control and full keyboard computer interaction without wires, RF, or requiring direct access to the computer keyboard/mouse. The Company’s technology frees a presenter to incorporate anything into a presentation, makes possible substantially more complex presentations, and eliminates the need for an “assistant” whose sole role is “keyboardist” during a presentation. Using a Brilliant Points enhanced presentation system, a presenter can demonstrate any aspect of a computer application without having to touch the computer’s mouse or keyboard.
Brilliant Points intends to revolutionize the computer presentation environment by placing Brilliant Points technology in each “business presentation seat”. A presentation seat is defined as a computer and a business projector. Placing Brilliant Points technology into this seat requires addition of a camera (high-quality Webcam, approx. $100 to $200), an optical pointer (approx. $50), and Brilliant Points software (approx. $50 to $150), for a combined total ($200 to $400) which is a small fraction of the cost of the computer and projector combined ($4000 to $30,000). We are confident that businesses will seek to acquire Brilliant Points technology as they see our technology in use in the marketplace.
Brilliant Points intends to build itself around four product areas:
- Core technology licenses
- LaserBoard™ SDK kits and/or licenses
- Presentation seat “upgrade” kits
- Complex and/or Secure pointer technology products and licenses.
Our customers are businesses and individuals who purchase business projector systems for “presentation environments” such as boardrooms, conference rooms, lecture halls, home entertainment systems, etc. Such environments are ideal for integration of Brilliant Points technology for a fraction of the cost of the projector system itself. We will reach our customers first through direct sales of upgrade kits and second through licensees of Brilliant Points technology who provide pieces of the presentation environment. We anticipate licensing revenues from projector manufacturers, computer input-device manufacturers, and laser pointer manufacturers. A conservative estimate of the potential size of this market is given by the one-year sales of business projectors, estimated by research firm Stanford Resources at nearly 1,400,000 units in 2001, and $6 billion in revenue. The median price of projectors in this market is around $3,000. When combined with the price of a typical business computer (about $1,500 to $2,000) the installed price of a presentation system runs between $4,000 and $5,000. The incremental cost of $200 to $400 to turn a common presentation system into a Brilliant Points enhanced presentation system will not likely be a significant decision barrier to business decision makers. Qualitative cross-spectrum tests of Brilliant Points technology, involving CEOs, VPs, Lawyers, sales directors, professional presenters, professors, and typical computer users, have demonstrated rapid acceptance and comfort using the demonstrator software and pointers, as well as serious inquiries into commercial availability of the product. This universal interest, across the spectrum of potential business users, is expected to continue as we expand our studies from the small groups to complete market and sales surveys.
The company has one approved patent. In addition, it has two other patents pending that will further enhance pointers by providing data transmission, secure identification, and gyro stabilization. This patented (foreign and other patents submitted and/or pending) technology, involving substantial, useful enhancement to existing presentation methods, works well and is or will be made available through the Company via a licensing framework.
Out of these patents the Company has developed several functional areas. These have real-world applications and are ready to be integrated into input device software. With Brilliant Points software, users are able to:
- “Click” mouse buttons with the laser pointer (e.g. left button, right button, center button, button chords, etc.)
- Perform complex mouse or mouse-and-keyboard actions such as click-and-drag, shift-click, etc.
- Enter alphanumeric data including backspace, spacebar, Tab, Enter
- Enter command-key sequences (e.g. Windows key, Menu key, F1, F2, Escape, etc.)
- Enter complex key sequences (e.g. Alt-Tab, Control-Shift-Alt-Tab, Control-Alt-Delete, Control-f1, Control-Shift-f12, etc.)
Much of this is accomplished through pop-up interfaces called “LaserBoard™s.” Below are two examples of LaserBoard™ interfaces. The first permits the user to enter any sequence of standard keyboard key-presses. The second permits a user with an off-the-shelf laser pointer to perform complex mouse sequences such as click-and-drag while using a single-button pointer. Additional LaserBoard™s are under development, including a full 104-key laserboard with access to the separate numeric and editing keypad. When completed, the Brilliant Points SDK will enable rapid development of additional LaserBoard™s so that licensees can rapidly create LaserBoard™s which facilitate their presentations or use of their applications.

Figure 3.0-1: Keyboard LaserBoard™ which permits any arbitrary key-press sequence.
Figure 3.0-2: Mouse LaserBoard™ which permits complex mouse and keyboard interaction using a standard single-button laser pointer.
When activated, these LaserBoard™ interfaces make complete control of the computer and presentation possible with a simple, standard, off-the-shelf laser pointer. While data-entry is slow, it is, nonetheless, possible. With patent-pending Brilliant Points technology such as complex pointers and secure data transmission through the pointer, it becomes possible to connect user-worn portable data-entry devices directly to the pointer, enabling such things as rapid keyboard data entry during a presentation, voice channel transmission so the presenter no longer has to wonder whether the wireless microphone receiver is working, etc. The presenter wears one device, one battery, and if the mouse cursor tracks the laser pointer, they know the entire system is operational.
The applications of this software set are most easily seen in the presentation market, where current technology is both limited and difficult to use. By incorporating Brilliant Points technology into presentation systems, presenters will find their laser pointers have the functionality of many devices in one, their “roaming range” while using the system is effectively unlimited, and the options available to them while designing or giving a presentation increase exponentially. At the same time, the need for an “assistant” or “drone,” who must accompany many presenters, is eliminated.
In addition, the Brilliant Points software solution set could be applied to a host of other applications, including home entertainment systems, gaming, webcam and video conferencing, and multi-user presentations. Other software products will be developed from the patents pending. These have expected development times of six months to two years. Secure pointers, id badges, security badges, stabilized pointers, gyro stabilization, and data transmission channels would all be enhanced through the technology, expanding the field of potential products to the hundreds.
The Company currently has functional software in the final beta stages, and expects to have version 1.0 product software within two months. This can be accelerated once funding is obtained, as faster development is constrained by availability of development staff. Presently all development is performed by Mr. Hansen, whose time is constrained by consulting and building the company plan. This time frame is reflected in the current plan by showing zero sales for the first two months of operations. This time estimate is quite conservative, and is based on Mr. Hansen’s own deep expertise in the software development arena. It is quite probable that V1.0 will be available ahead of schedule and sales will commence earlier than projected.
The Company anticipates that new software features will be available periodically, possibly as often as six month intervals, opening up repetitive update sales as an additional revenue stream.
Market Analysis Summary
Our customers are businesses and individuals who purchase business projector systems for “presentation environments” such as boardrooms, conference rooms, lecture halls, home entertainment systems, etc. Such environments are ideal for integration of Brilliant Points technology for a fraction of the cost of the projector system itself.
Research firm Stanford Resources estimates that in 2001, worldwide shipments of business projectors reached 1,400,000 units. They also forecast this market to grow to 4,500,000 units by 2007. InFocus forecasts that projector system shipments for home entertainment systems will exceed 2,500,000 units within three years.
Brilliant Points technology is a “market forming” technology, in that this technology (optical control of a presentation or computer through the use of video capture) has only recently become possible, but is instantly recognized as useful by people who give business presentations. Data is available giving the size of the presentation market, but acceptance of this new technology is difficult to predict using existing data. Preliminary response from user tests indicates ready acceptance as long as the price-point is not excessive, so we feel confident that the target of $50 per presentation seat is readily achieved, with higher targets still possible without significantly affecting demand.
The Company expects to license its technology to various electronic equipment manufacturers in the United States, Europe, and Japan. Initially, it will seek licensing agreements on a limited basis in first the United States and then in Japan. Europe will follow after the other two markets are established.
The Company will seek to license its technology first with presentation device manufacturers and laser pointing device manufacturers, but plans to expand to include manufacturers of personal computer input devices, digital cameras and webcams, and digital camcorders. Brilliant Points believes that seeking strategic partnerships to bundle its software with these manufacturers, along with targeted marketing to presenters and educators will allow it to achieve penetration in the market. There is also significant opportunity in the gaming industry for Brilliant Points’ technology later in the product lifecycle.
The Company expects to methodically develop its marketing channels through use of strategic partnerships with presentation input device manufacturers. The Company will seek partnerships with companies in the United States and Japan, including presentation and computer device makers, such as Logitech, InFocus, Toshiba, HP, Dell, Microsoft, Belkin, Samsung, Hitachi and others. In addition, many of the largest makers of laser pointers today include 3M, Acme United, Clearline, Laserlyte and Fortune Brands. With the diverse and broad product offerings, the Company feels that licensing relationships established now with these companies will provide many leveragable benefits in the future.
The Company’s business development groups will pursue opportunities in the presentation market both nationally and internationally. Nationally, the Company will develop distribution channels with several of the companies listed above in the U.S. It will focus its efforts on three target industries, presentation (and computer) input device companies, laser pointing device companies, and industrial laser application companies, in that order.
Simultaneously, Brilliant Points is considering a business development relationship with a Japanese business development company that develops business partnerships with large Japanese conglomerates who seek to capture United States developed technologies.
4.1 Market Segmentation
A presentation seat is defined as a computer and a projector. There are two distinct environments in which they are used: business presentation and home entertainment.
- The home entertainment market is just starting up, but InFocus expects to ship 2,500,000 projectors into this market over the next three years. This market is targeted primarily through licensing.
- The business presentation market shipped approximately 1,400,000 projectors in 2001, with forecast growth to 4,500,000 in 2007. The business presentation market is further divided into (1) installed base and (2) future growth.
- Installed base is estimated using the 2001 projector shipments. This gives a good conservative estimate of an installed base of presentation systems, since those recipients are not likely to replace their projectors for a few years. This market segment is targeted by upgrade kits.
- Future growth is estimated using the 2002 and beyond shipment forecasts. These shipments are either replacement of further installed base not accounted for in our installed base estimate, or growth in the presentation system market. This market segment is targeted first through licensing and second through upgrade kits.
Note that future growth and installed base estimates are intentionally simplified to aid in calculations. We realize that some of the “new” data will, in fact, be replacements for “installed base”, especially as we reach four to five years out, but we account for this fact by stipulating that upgrade kit sales will increase and peak around years four to five, and simultaneously estimating that we will only achieve penetration of 20 to 30 percent of this installed base of 1,400,000 units before it begins to be replaced under future growth sales.
Placing Brilliant Points technology into a presentation seat requires addition of a camera (high-quality Webcam, approx. $100 to $200), an optical pointer (approx. $50), and Brilliant Points software (approx. $50 to $150), for a combined total ($200 to $400) which is a small fraction of the cost of the computer and projector combined ($4,000 to $30,000). We feel that due to the low incremental cost for upgrading and the substantial enhancement which accrues, this upgrade path will be quickly accepted into existing presentation seats.
We are confident that businesses will seek to acquire Brilliant Points technology as they see our technology in use in the marketplace.

| Market Analysis | |||||||
| Year 1 | Year 2 | Year 3 | Year 4 | Year 5 | |||
| Potential Customers | Growth | CAGR | |||||
| Business Presentation Systems | 34% | 1,400,000 | 1,876,000 | 2,513,840 | 3,368,546 | 4,513,852 | 34.00% |
| Home Entertainment Systems | 80% | 200,000 | 300,000 | 700,000 | 1,400,000 | 2,100,000 | 80.01% |
| Upgrade Kits | -40% | 1,400,000 | 840,000 | 504,000 | 302,400 | 181,440 | -40.00% |
| Total | 22.68% | 3,000,000 | 3,016,000 | 3,717,840 | 5,070,946 | 6,795,292 | 22.68% |
4.2 Competition and Buying Patterns
Brilliant Points is aware of two companies that independently, after the initial Brilliant Points patent application was submitted, developed technology which is believed to infringe on the Brilliant Points patent. These companies are IC-Tech, website at www.ictech.com, with their LightMouse™ technology, and InfoValley, website at www.infovalley.com, with their LaserDraw™ technology. Both of these companies are small, and funded primarily through SBIR research grants. The Company has initiated contact with these companies, informing them of probable infringement, and IC-Tech has responded indicating a desire to license. InfoValley has yet to respond and we are pursuing legal and other options.
Neither IC-Tech nor InfoValley has captured the scope and breadth of the Brilliant Points patent in their efforts, and we do not expect significant revenue from either due to their market positions.
Brilliant Points has initiated contact with Logitech Corporation’s New Business Ventures Group because they manufacture and distribute both a good quality, low-cost webcam, as well as a radio frequency (RF) mouse which is bluetooth-based and also contains an embedded laser pointer for item emphasis within a presentation. A licensing agreement with a company such as Logitech makes strong business sense for both Brilliant Points as well as Logitech because both companies get to play off of the strengths of the other and can bring new technology to market rapidly without significant expense on the part of either. IOGEAR is another input-device company which has designed a bluetooth-based remote trackball with an integrated laser pointer, very similar to the Logitech device.
The Company intends to seek other potential partners for discussions such as those entered into with Logitech, but plans on sales of update kits as the primary revenue stream for the first 18 months.
The bluetooth technology is a short-range (dozens of feet) RF technology designed for multiple-wireless-device use. It can be considered by some to be competing technology because input devices (e.g. mouse, trackball, touchpad, etc.) designed with this technology also allow remote control of a computer presentation. Bluetooth technology, however, has a maximum receiver range of about 30 feet, with high-reliability range restricted to 10 feet or less, especially in the presence of RF interference or significant numbers of same-band transmitters. This restriction means that the computer with its bluetooth receiver is forced to be in proximity to the presenter, while the projector may need to be much further back in order to provide sufficient “throw” to give a large display area. These same restrictions apply to other RF-based wireless device technologies. All of them experience difficulty as more and more same-technology devices are used within a given area, and all of them are more appropriate to local use of a computer and network than for remote control of a presentation system from possibly hundreds of feet away.
Brilliant Points technology has no RF-like range restrictions: if the pointer is visible, the system works, regardless of whether the pointer is a foot away or a mile away. The computer, projector, and Webcam are conveniently located on one area, and the presenter is free to roam the area without concerns of RF range or “trip wires” scattered around the room. Optical systems are also typically lower-power devices since the radiated output is restricted to a narrow beam rather than radiated omnidirectionally as in bluetooth. Because of this, batteries in remote input devices will likely last much longer in Brilliant Points technology-based devices. Furthermore, optical systems are inherently noise immune and unaffected by even extreme amounts of RF interference. Because Brilliant Points technology is optical, and unidirectional, using a pointer to control a computer via the Company’s technology is a significantly different control system than one involving networking systems, or connecting a computer to peripherals such as printers, disk drives, displays, projectors, etc., all of which need to be omnidirectional if wireless, or wired. Multiple-same-technology-device issues will not arise during the use of Brilliant Points technology. As a final note, it should be recognized that in spite of providing computer-like control via bluetooth, the developers of these devices (e.g. Logitech and IOGEAR) still saw a significant market advantage to incorporating the laser pointer into the device, in obvious deference to its readily demonstrated usefulness during a presentation.
In summary, while companies such as Logitech and IOGEAR, which implement input devices using bluetooth or other RF-type mechanisms, may appear to some to be a threat to Brilliant Points, we see them as additional licensing opportunities.
Strategy and Implementation Summary
Brilliant Points’ marketing and sales strategies are discussed in the following individual topics.
5.1 Sales Strategy
Brilliant Points’ sales strategy is to price our technology at a level which makes it attractive in terms of value and features added and insignificant in cost compared with the core units of a presentation system, the computer and projector. These can run from a low of around $4,000 to as much as $30,000 or more depending largely upon the kind of projector selected.
A presentation seat is defined as a computer and a business projector. Placing Brilliant Points technology into this seat requires addition of a camera (high-quality webcam, approx. $100 to $200), an optical pointer (approx. $50), and Brilliant Points software (approx. $50 to $150), for a combined total ($200 to $400) which is a small fraction of the cost of the computer and projector combined ($4,000 to $30,000). As an additional upgrade path, users who already posess a camera and pointer will be able to purchase and download the software from the Brilliant Points website, generating the same net revenue without the work of processing a complete upgrade kit.
We are confident that pricing our technology in this range will enable us to rapidly penetrate the presentation systems market, first through upgrade kits, and second through licensing deals with manufacturers/resellers of presentation system sub-units. Many corporate boardrooms and conference rooms already have camera technology installed for video conferencing, and in many cases those same devices can become dual-use, further reducing the net cost for upgrading to a Brilliant Points presentation system.
5.1.1 Sales Forecast
The Sales Forecast table shows net after cost of goods, which is why the “Direct Cost of Sales” section of the table is empty. This is due to the variability of what comprises an “upgrade” kit. Some customers will need the full set of camera, pointer, and software, while others will need only pointer and software, or download the software alone from the Brilliant Points website. To account for this variability, we assume that all sales will cover the cost of goods and shipping/handling, plus a minimum of $50 revenue to Brilliant Points. Note that all company expenses other than cost of goods are accounted for against this revenue stream. The only “hidden” variable is the cost of goods sold which will be bundled into the price of the upgrade kits.
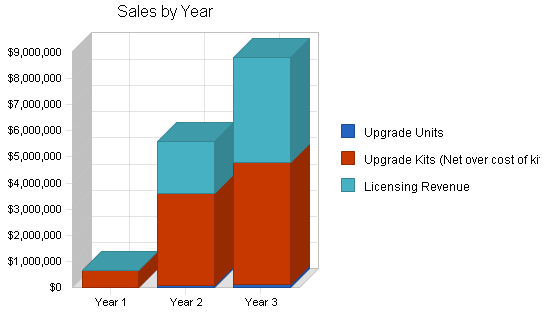
We expect upgrade kit sales to ramp up from zero to a total of approximately 13,000 kits sold the first year. In the second year, upgrade kits sold are expected to increase to approximately 70,000, and in the third year to approximately 100,000 kits. We expect upgrade kit sales to plateau and begin to fall, perhaps significantly after the fourth year, as licensing penetration increases.
While shipping as many as 6,000 upgrade kits per month (approximate rate at the end of second year) with a staff this size may seem aggressive, this is a rate of 300 units per day with 20 shipping days per month. Since an upgrade kit consists of off-the-shelf camera, pointer, and Brilliant Points software, assembly is simple. This rate is readily attainable with four people working fulfillment, 5 hours each day, assembling and stacking one box every 4 minutes. Self-stick labels are pre-printed, shipping is handled by outsource to one of the common shipping houses. With part-time assistance this is feasible within the 2-year staffing projections.
Licensing revenues are not expected to be realized until the second year of operations. We project reaching 1.5 percent penetration of the potential presentation seat market by end of second year of operations, with 2.5 percent penetration by end of third year. We expect licensing penetration to continue to increase year over year through the duration of the patent protection (15 years). It is expected that we will achieve at least 50 percent penetration of this market before the patent expires.
Sales forecasts will be impacted by overall economy, as well as user acceptance of the Brilliant Points technology. Preliminary user tests have shown extremely favorable response, so we do not anticipate any significant negative response. While the forecast presentation market growth may not materialize, the installed base will still need to upgrade and/or replace failed equipment, providing on-going revenue even if this should occur.
Note that in the Sales Forecast table as provided by the Business Plan Pro® software being used, all row entries are treated as dollar amounts and summed into the total. Because of this, and in order to show both total net on sales as well as total units sold, the first row contains the number of units sold, which is treated as $1 per unit, and the second row shows the remaining net on sales ($49 per unit), with a minimum of $50 net target per unit sold. This approach, while somewhat “clunky” allows us to quickly see both the dollar amount and the unit volume for each entry.
Further market analysis by the VP of Marketing will determine whether the revenue target can be increased above $50 without significantly impacting demand. In preliminary (small sample) surveys, every presentation-using respondent indicated willingness to pay at least $50 for access to this technology, a good indicator that a higher figure may be attainable.
We make no attempt to forecast or project sales and penetration into the Home Entertainment or Gaming markets, nor the Military or optical pointer markets, but significant potential exists in these areas. Refer to section 7.5, Projected Balance Sheet for additional comments regarding this decision.

| Sales Forecast | |||
| Year 1 | Year 2 | Year 3 | |
| Sales | |||
| Upgrade Units | $12,910 | $72,000 | $96,000 |
| Upgrade Kits (Net over cost of kit) | $632,590 | $3,528,000 | $4,704,000 |
| Licensing Revenue | $0 | $2,000,000 | $4,000,000 |
| Total Sales | $645,500 | $5,600,000 | $8,800,000 |
| Direct Cost of Sales | Year 1 | Year 2 | Year 3 |
| Upgrade Units | $0 | $0 | $0 |
| Upgrade Kits (Net over cost of kit) | $0 | $0 | $0 |
| Licensing Revenue | $0 | $0 | $0 |
| Subtotal Direct Cost of Sales | $0 | $0 | $0 |
5.2 Competitive Edge
Brilliant Points has developed a “market expanding” technology, and protected it with patents, both domestic and international. This patent protection will expire in approximately 17 years, in 2019. We intend to capitalize on this “government sanctioned monopoly” time frame to rapidly establish Brilliant Points as the source for this technology.
The patents alone present a formidable barrier to entry for competitors, but we intend to also position ourselves as the source for high-quality value-priced technology related to our patent so that in the future we are in a position to capitalize on our already significant market presence as the patent expiration date approaches and competitors consider entering the field.
5.3 Marketing Strategy
The full marketing strategy will be developed by the VP of Marketing so as to quickly establish market awareness of the Brilliant Points technology. This will be the primary task of the VP of Marketing during the first quarter of operations. Sample demonstrations of the Brilliant Points technology have made it clear that we will be able to close a significant number of sales without having a marketing plan and campaign in place, but the plan and its implementation will improve the success of the sales force.
Management Summary
The Company’s Management Team provides solid, proven experience in successful companies, with demonstrated competence in high tech, marketing (both consumer- and business-oriented), business development and sales (domestic and international), intellectual property protection, and business finances. All members of the team have experienced the “explosive growth” environment of successful start-ups and contribute unique talents and essential skills which will make Brilliant Points successful. The members of the team beyond Mr. Hansen have committed to come on board once funding is obtained. All members of the team are bi-lingual, and many have multi-national business experience. The team currently consists of:
Karl Hansen, Chairman of the Board, CEO, CTO, VP Engineering
Karl Hansen is the Company’s founder and chief executive officer. Mr. Hansen has a long history of technology development, having created the intellectual property (U.S. Patent #5,832,263) around which a start-up, DigiDox, was formed in 1994. He served as the CTO and Vice President of Engineering at DigiDox until its sale to Adobe Software in 1997, for $4,000,000.
Mr. Hansen’s recent activities have included IT consulting for Hamilton-Sundstrand, BF Goodrich, and Teradyne, where he was engaged in designing high-speed, high-reliability, embedded, real-time software and hardware. At Hamilton-Sundstrand he created the world’s first FAA level-A certified real-time multi-tasking kernel, and also developed the software driving the hydraulic system for the next-generation Space Shuttle. He holds a BS in Computer Engineering and a Master’s degree in Electrical Engineering, with doctorate-level studies during his tenure at DigiDox.
Mr. Hansen is also a registered Professional Engineer, a member of the National Society of Professional Engineers, the American Management Association, the Association of Computing Machinery, the Experimental Aircraft Association, and is a private pilot. Over the course of the last eight years Mr. Hansen has developed the technologies and received the patent that is the foundation of Brilliant Points’ business endeavors. Mr. Hansen’s success as a consultant and in the DigiDox start-up venture has enabled him to fund Brilliant Points from concept through obtaining the critical IP patent awarded last fall. Mr. Hansen has personally invested approximately $750,000, in addition to his “sweat equity”, in the Brilliant Points venture. Mr. Hansen is also fluent in Spanish, and has moderate ability in several other languages.
VP Operations [Name omitted for confidentiality in this sample plan]
The VP Operations candidate has an MBA from the Marriott School of Business Administration. Most recently he has been serving as the Director of Marketing at a B2B start-up where he is responsible for strategic and tactical marketing. At this start-up, the VP Operations candidate was instrumental in securing almost $30,000,000 in first-round funding. He is also the primary point of contact for industry analysts for the company. The candidate was recruited from Hewlett-Packard, where he worked in a variety of business units, and was instrumental in developing and rolling out a start-up business under the HP umbrella. In this role, he grew the start-up to over $10,000,000 in business and leveraged acquired technologies into other HP product areas. The candidate has additional business development, management, and contract negotiation experience with a major storage-provider and a software start-up. He is fluent in German.
VP Marketing [Name omitted for confidentiality in this sample plan]
The VP Marketing candidate has an MBA from the Anderson School at UCLA, where he focused on Marketing and International Business, and also participated in the Exchange Program with L’Institut Superieur des Affaires, Groupe HEC, FRANCE. Currently working as a Marketing Consultant, he recently left a high-tech medical devices company, where he served as Vice President, Marketing & Customer Service, after wrapping up a successful IPO that took them public in January 2001. This IPO achieved the largest valuation ever for an emerging medical device company (>$500MM). At that company, the VP Marketing candidate conceived and developed their trade-names, and secured domestic and international trademark protection. The candidate was also responsible for the PR program which garnered feature stories and placements in Wall Street Journal, USA Today, Associated Press, Fortune, People, NY Times, LA Times, and major television networks across the country.
The VP Marketing candidate was recruited to the medical devices start-up while working at Pharmacia & Upjohn, where he managed several extremely high-profile products and brands with annual retail sales of $150MM+. The candidate led the program which identified and successfully recruited celebrity user-endorsers for the product public relations campaigns and advertising, including NBA MVP Karl Malone, NFL Super Bowl Champion Coach Mike Holmgren, Tennis Champion John McEnroe, and others. Prior to his work at Pharmacia & Upjohn, the candidate worked at an international beauty-care company where he led the rollout of the first mass-marketed alpha hydroxy make-up, and at The Procter & Gamble Company where he developed world-class advertising programs which received the highest trial potential results in the history of that P&G product category, and was adopted as the model by foreign P&G units. The candidate is also fluent in French.
VP Corporate Strategy, Business Development and Sales [Name omitted for confidentiality in this sample plan]
The VP Corporate Strategy candidate was educated in Switzerland, receiving a Swiss Degree (comparable to an American BS degree) for Structural Engineering from the Schweizerischer Bundesverband, and additional education from BWI Business Institute of ETH (Swiss Federal Institute of Technology), both in Zürich. Presently he is serving as VP of Business Development and Corporate Strategy for a privately held international business software start-up headquartered in Canada, where he develops and manages corporate strategic alliances and partnerships, has defined the sales and marketing strategies for the core server applications, and serves on the Board of Directors. The candidate has served as Director of Sales at another Canadian software company, where he developed and managed global strategic sales with multi-national accounts and OEM customers. He also has served as Director of Worldwide Business Development and Sales at two well-known California software start-ups, and as European Sales Manager, for two major applications and networking companies.
As Director of Worldwide Business Development and Sales, the candidate was responsible for identifying, developing, and executing strategic alliances and partnerships, new products and product lines, and assisting executive management with technology acquisitions. He also managed OEM sales and business development for the Asia-Pacific countries and Latin America, where he took OEM revenue from an annual $100K to $4 Million in 7 months, and reorganized and turned around sales operations, nearly doubling corporate sales in under a year. He developed and managed the inside and outside sales organizations, including recruiting, training, and managing the sales staff, and developed and implemented a corporate Customer Relationship Management (CRM) system to measure, analyze, and strategically utilize marketing and sales information. As European Sales Manager with the networking and applications companies, the candidate developed and executed international sales and field marketing strategies, built strategic alliances, developed multi-national sales teams, and identified and exploited new or underdeveloped markets and vertical market opportunities. The candidate is fluent in English, with German his native language.
Director of Finance [Name omitted for confidentiality in this sample plan]
The Director of Finance candidate has a BA in Finance from Utah State University, and is on track to complete an MBA at Babson College, in Wellesley, MA, in early 2003. The candidate recently left a Voice-over-IP start-up, where he worked for four years, most recently as Finance Manager for the $20 million IP Communications Services (IPCS) business group. In his role with IPCS, he was responsible for developing economic models, strategic financial planning, budgeting, forecasting, and analysis for IPCS and senior executives. Prior to his role as Finance Manager, the candidate served as Account Manager where he researched and analysed accounts to improve penetration, and booked $2 million, over 250% of quota, as Commission Accounting Supervisor where he automated commission calculations by implementing a sales compensation database in Oracle, submitted payroll, and developed commission submission and payment processes, and as Senior Specialist over Compensation/Quota where he developed and administered compensation plans, researched and resolved compensation discrepancies, and submitted biweekly payroll. The candidate is fluent in Spanish.
6.1 Personnel Plan
The personnel plan calls for immediate hire of the four key management personnel, followed by the staff for each of the functional areas in the Company. We intend to “run lean”, in that we will staff as appropriate to achieve the sales targets, as shown in the following personnel table. Assuming sales targets are met, it is projected that by year end staffing will be in the neighborhood of 16 people, with part-time help assisting in the order fulfillment area. If we exceed sales targets, it may be necessary to increase staffing levels to meet demand. As the heads of the functional areas flesh out their respective areas, these figures may be revised up or down to reflect their needs and sales growth. The majority of any staffing growth beyond the initial 16 people will most likely be in the areas of sales, marketing, order fulfillment, and customer service.
Salary and compensation are intended to be extremely competitive to attract and retain the best employees. Brilliant Points intends to be both a technology leader and a desirable place to work. As such, Brilliant Points intends to offer above average packages to attract and retain above average employees.
| Personnel Plan | |||
| Year 1 | Year 2 | Year 3 | |
| Karl C. Hansen, Chairman/CEO/CTO/VP Engineering | $180,000 | $240,000 | $280,000 |
| VP of Operations | $150,000 | $180,000 | $190,000 |
| VP of Corporate Strategy, Business Development and Sales | $150,000 | $180,000 | $190,000 |
| VP of Marketing | $150,000 | $180,000 | $190,000 |
| Director of Finance | $108,000 | $120,000 | $130,000 |
| Lisa Hansen, Executive Assistant, Market & Usability Research | $72,000 | $76,000 | $80,000 |
| Office Manager | $55,000 | $60,000 | $65,000 |
| Order Fulfillment | $38,500 | $40,000 | $42,000 |
| Order Fulfillment | $27,000 | $35,000 | $38,000 |
| Sales | $77,000 | $80,000 | $82,000 |
| Sales | $54,000 | $70,000 | $72,000 |
| Marketing | $77,000 | $80,000 | $82,000 |
| Marketing | $54,000 | $70,000 | $72,000 |
| Developer | $93,500 | $90,000 | $93,000 |
| Developer | $70,200 | $82,000 | $85,000 |
| Developer | $42,000 | $74,000 | $77,000 |
| Total People | 16 | 16 | 16 |
| Total Payroll | $1,398,200 | $1,657,000 | $1,768,000 |
Financial Plan
Details of Brilliant Points’ financial plan are discussed in the following individual topics.
7.1 Important Assumptions
Some general assumptions about Brilliant Points’ economic environment are shown in this table.
| General Assumptions | |||
| Year 1 | Year 2 | Year 3 | |
| Plan Month | 1 | 2 | 3 |
| Current Interest Rate | 8.00% | 8.00% | 8.00% |
| Long-term Interest Rate | 10.00% | 10.00% | 10.00% |
| Tax Rate | 25.42% | 25.00% | 25.42% |
| Other | 0 | 0 | 0 |
7.2 Break-even Analysis
This break-even analysis is based on the projected fixed costs (office, utilities, staff, and maintenance) for a fully-staffed 2-year company. Near-term sales and revenue are expected to be quite low for approximately six to twelve months, ramping up quickly after that as licensing deals close and “update” kit sales ramp up.
The analysis uses a target figure of $50 net revenue for each “presentation seat” filled with Brilliant Points technology. A “presentation seat” consists of a computer, a projector, a camera (webcam or similar), a pointer, and software. Over and above the cost-of-goods for the seat, assuming Brilliant Points provides everything for a seat, Brilliant Points would net a minimum of $50 revenue for the use of the Brilliant Points technology. Because there are existing installations which have a computer and a projector, “update” kits will be created and sold which consist of a camera, a pointer, and software to enable the Brilliant Points technology. During the initial two years, the majority of “presentation seats” filled would be through the “update” kit route. As licenses are put into place, more and more of these seats would be filled through licensee equipment sales. It is expected that “update” kit volume would peak around 4 to 5 years and begin to decline as greater penetration of the OEM/Reseller market for the devices in a presentation seat occurs.
Market research data shows that approximately 1,400,000 business projectors were sold in 2001, giving a good starting figure for existing installed presentation seats. We target filling 30% (400,000 seats, cumulative) of these existing seats by the end of the 4th year in operations through a combination of upgrade kits and replacements with licensee equipment, either of which nets the $50 estimate. Additional revenue will be generated by placement of licensee equipment in new presentation seats. Because business projector sales are projected to grow from the 1,400,000 in 2001 to approximately 4,500,000 in 2007, we feel this target is both conservative and achievable.
The break-even analysis shows that approximately 3,000 presentation seats must be filled on a monthly basis to reach break-even for fixed costs (including salaries) and approximately 4,400 to cover projected variable costs, for an annual total of about 53,000 presentation seats per year. We expect to exceed this rate between 13 and 15 months in business, becoming revenue-positive during the second year of operations, and profitable during our third year.

| Break-even Analysis | |
| Monthly Revenue Break-even | $205,138 |
| Assumptions: | |
| Average Percent Variable Cost | 0% |
| Estimated Monthly Fixed Cost | $205,138 |
7.3 Projected Profit and Loss
The following Profit & Loss table attempts to forecast expenses over the first three years in business.
Advertising/Promotion and Travel: It is anticipated that marketing and travel will be significant expenses due to the need to present and demonstrate Brilliant Points technology to a wide audience.
Miscellaneous: Attempts to account for unforseen petty-cash, office, travel, and repair expenses.
Depreciation: Will need to be filled in as capital equipment and other depreciable items are purchased.
Leased Equipment: TBD. We anticipate some larger-cost items will be leased rather than purchased.
Insurance: We are in the process of obtaining insurance quotes from several providers and will replace these figures with more accurate data when the quotes arrive. These figures are based on simple scaling of existing liability and damage insurance to account for the increased personnel and office space.
Rent: Shows zero for the first year because the entire first year’s lease is included in start-up costs.
Contract/Consultants: Attempts to budget for attorney time for patent work, IP protection, etc., and additional consulting time that may be needed.
Interest Expense Short-term: Shows interest which would be paid based on assumed short-term rates and immediate full draw-down of corporate line-of-credit. There is, at present, no short-term debt.
Interest Expense Long-term: We have no current long-term debt and have no present plans to incur any.
Taxes Incurred: Automatically calculated based on computed profits and assumed corporate tax rate (see Sect. 7.1).
Extraordinary Items: We do not anticipate any extraordinary expenses during the first three years of operations.
These figures will be pinned down with more accuracy by the VP of Operations and the Director of Finance during the first quarter once we have a better handle on office space, travel and marketing estimates from the VP of Marketing and VP of Sales, and insurance coverage.


| Pro Forma Profit and Loss | |||
| Year 1 | Year 2 | Year 3 | |
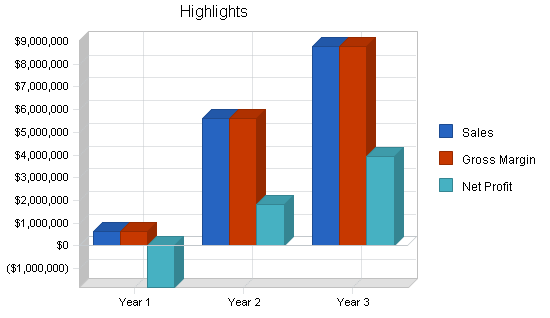
| Sales | $645,500 | $5,600,000 | $8,800,000 |
| Direct Cost of Sales | $0 | $0 | $0 |
| Other | $0 | $0 | $0 |
| Total Cost of Sales | $0 | $0 | $0 |
| Gross Margin | $645,500 | $5,600,000 | $8,800,000 |
| Gross Margin % | 100.00% | 100.00% | 100.00% |
| Expenses | |||
| Payroll | $1,398,200 | $1,657,000 | $1,768,000 |
| Sales and Marketing and Other Expenses | $619,000 | $876,000 | $1,088,000 |
| Depreciation | $0 | $0 | $0 |
| Leased Equipment | $20,000 | $30,000 | $40,000 |
| Utilities | $0 | $0 | $0 |
| Insurance | $5,000 | $6,000 | $7,000 |
| Rent (Full Services, 1st year covered in startup costs) | $0 | $85,000 | $100,000 |
| Payroll Taxes | $419,460 | $497,100 | $530,400 |
| Other | $0 | $0 | $0 |
| Total Operating Expenses | $2,461,660 | $3,151,100 | $3,533,400 |
| Profit Before Interest and Taxes | ($1,816,160) | $2,448,900 | $5,266,600 |
| EBITDA | ($1,816,160) | $2,448,900 | $5,266,600 |
| Interest Expense | $20,000 | $20,000 | $20,000 |
| Taxes Incurred | $0 | $607,225 | $1,333,511 |
| Net Profit | ($1,836,160) | $1,821,675 | $3,913,089 |
| Net Profit/Sales | -284.46% | 32.53% | 44.47% |
7.4 Projected Cash Flow
The following Projected Cash Flow table shows anticipated cash movement. With respect to the corporate line-of-credit, it shows immediate full draw-down and associated interest expense when in fact the draw on this line will only occur as needed and no immediate interest will accrue.
According to the table, we are still cash flow-negative at the end of first year of operations, with a net loss (from the Profit and Loss table). Assuming sales targets are hit, break-even is reached within the first quarter of second year of operations, and we show a net profit by the end of second year of operations, but have not recovered the first year’s loss. By the end of the third year of operations, we show significant profit, and have very nearly recovered the first year’s loss.
Because Cash Balance never falls to the point that the corporate line-of-credit is required, the monthly interest payments shown in the Profit and Loss table do not exist, increasing Cash Balance for each year shown.
Cash Spent on Costs and Expenses: This field is automatically computed based on expenses from Sect. 7.3 and the “Expenses in Cash %” assumption called out in Sect. 7.1. “Expenses in Cash” shows how much of current expenses is paid out of cash, with the remainder carried over into Accounts Payable.
Payment of Accounts Payable: This field is automatically computed based on the expenses rolled into Accounts Payable, and cover a portion of the current month’s Accounts Payable plus the previous month’s remaining Accounts Payable.

| Pro Forma Cash Flow | |||
| Year 1 | Year 2 | Year 3 | |
| Cash Received | |||
| Cash from Operations | |||
| Cash Sales | $645,500 | $5,600,000 | $8,800,000 |
| Subtotal Cash from Operations | $645,500 | $5,600,000 | $8,800,000 |
| Additional Cash Received | |||
| Sales Tax, VAT, HST/GST Received | $0 | $0 | $0 |
| New Current Borrowing | $0 | $0 | $0 |
| New Other Liabilities (interest-free) | $0 | $0 | $0 |
| New Long-term Liabilities | $0 | $0 | $0 |
| Sales of Other Current Assets | $0 | $0 | $0 |
| Sales of Long-term Assets | $0 | $0 | $0 |
| New Investment Received | $0 | $0 | $0 |
| Subtotal Cash Received | $645,500 | $5,600,000 | $8,800,000 |
| Expenditures | Year 1 | Year 2 | Year 3 |
| Expenditures from Operations | |||
| Cash Spending | $1,398,200 | $1,657,000 | $1,768,000 |
| Bill Payments | $963,925 | $2,066,504 | $3,036,917 |
| Subtotal Spent on Operations | $2,362,125 | $3,723,504 | $4,804,917 |
| Additional Cash Spent | |||
| Sales Tax, VAT, HST/GST Paid Out | $0 | $0 | $0 |
| Principal Repayment of Current Borrowing | $0 | $0 | $0 |
| Other Liabilities Principal Repayment | $0 | $0 | $0 |
| Long-term Liabilities Principal Repayment | $0 | $0 | $0 |
| Purchase Other Current Assets | $0 | $0 | $0 |
| Purchase Long-term Assets | $0 | $0 | $0 |
| Dividends | $0 | $0 | $0 |
| Subtotal Cash Spent | $2,362,125 | $3,723,504 | $4,804,917 |
| Net Cash Flow | ($1,716,625) | $1,876,496 | $3,995,083 |
| Cash Balance | $1,349,375 | $3,225,870 | $7,220,953 |
7.5 Projected Balance Sheet
The following Projected Balance Sheet table shows anticipated corporate balances. As indicated in the Projected Cash Flow topic, with respect to the corporate line-of-credit, it shows immediate full draw-down and associated interest expense when in fact the draw on this line will only occur as needed and no immediate interest will accrue.
The table shows that by the end of second year of operations we have recovered the first year’s loss, and very nearly covered start-up expenses as well.
Note that these assumptions are based on achieving only 2.5% penetration of the Business Presentation market by the end of third year of operations. Should market acceptance/demand be wide (probable), net revenue-per-seat potential be greater than $50 (almost certainty), licensing penetration be significantly greater (50% by some estimates), there is potential for revenues to reach into the hundreds of millions. Note also that these projections rely only on revenue from the Business Presentation market. Growth into the home entertainment/gaming markets will only enhance these figures. Furthermore, there is significant potential for revenue in the areas covered by the currently pending patent applications, within the military and the optical pointer industries, as secure/complex/stabilized pointers are developed. While we have not attempted to show the impact of these markets on the business plan, we feel that they independently hold as much or more potential than the Business Presentation market.
| Pro Forma Balance Sheet | |||
| Year 1 | Year 2 | Year 3 | |
| Assets | |||
| Current Assets | |||
| Cash | $1,349,375 | $3,225,870 | $7,220,953 |
| Other Current Assets | $0 | $0 | $0 |
| Total Current Assets | $1,349,375 | $3,225,870 | $7,220,953 |
| Long-term Assets | |||
| Long-term Assets | $0 | $0 | $0 |
| Accumulated Depreciation | $0 | $0 | $0 |
| Total Long-term Assets | $0 | $0 | $0 |
| Total Assets | $1,349,375 | $3,225,870 | $7,220,953 |
| Liabilities and Capital | Year 1 | Year 2 | Year 3 |
| Current Liabilities | |||
| Accounts Payable | $119,535 | $174,355 | $256,349 |
| Current Borrowing | $250,000 | $250,000 | $250,000 |
| Other Current Liabilities | $0 | $0 | $0 |
| Subtotal Current Liabilities | $369,535 | $424,355 | $506,349 |
| Long-term Liabilities | $0 | $0 | $0 |
| Total Liabilities | $369,535 | $424,355 | $506,349 |
| Paid-in Capital | $3,750,000 | $3,750,000 | $3,750,000 |
| Retained Earnings | ($934,000) | ($2,770,160) | ($948,485) |
| Earnings | ($1,836,160) | $1,821,675 | $3,913,089 |
| Total Capital | $979,840 | $2,801,515 | $6,714,604 |
| Total Liabilities and Capital | $1,349,375 | $3,225,870 | $7,220,953 |
| Net Worth | $979,840 | $2,801,515 | $6,714,604 |
7.6 Business Ratios
Business ratios for the years of this plan are shown below. Industry profile ratios based on the Standard Industrial Classification (SIC) code 5406, Computers, peripherals and software, are shown for comparison.
| Ratio Analysis | ||||
| Year 1 | Year 2 | Year 3 | Industry Profile | |
| Sales Growth | 0.00% | 767.54% | 57.14% | 5.80% |
| Percent of Total Assets | ||||
| Other Current Assets | 0.00% | 0.00% | 0.00% | 21.50% |
| Total Current Assets | 100.00% | 100.00% | 100.00% | 86.80% |
| Long-term Assets | 0.00% | 0.00% | 0.00% | 13.20% |
| Total Assets | 100.00% | 100.00% | 100.00% | 100.00% |
| Current Liabilities | 27.39% | 13.15% | 7.01% | 43.70% |
| Long-term Liabilities | 0.00% | 0.00% | 0.00% | 11.20% |
| Total Liabilities | 27.39% | 13.15% | 7.01% | 54.90% |
| Net Worth | 72.61% | 86.85% | 92.99% | 45.10% |
| Percent of Sales | ||||
| Sales | 100.00% | 100.00% | 100.00% | 100.00% |
| Gross Margin | 100.00% | 100.00% | 100.00% | 24.80% |
| Selling, General & Administrative Expenses | 384.46% | 67.47% | 55.28% | 15.60% |
| Advertising Expenses | 66.15% | 10.71% | 8.18% | 0.50% |
| Profit Before Interest and Taxes | -281.36% | 43.73% | 59.85% | 2.70% |
| Main Ratios | ||||
| Current | 3.65 | 7.60 | 14.26 | 1.93 |
| Quick | 3.65 | 7.60 | 14.26 | 0.92 |
| Total Debt to Total Assets | 27.39% | 13.15% | 7.01% | 54.90% |
| Pre-tax Return on Net Worth | -187.39% | 86.70% | 78.14% | 5.50% |
| Pre-tax Return on Assets | -136.07% | 75.29% | 72.66% | 12.20% |
| Additional Ratios | Year 1 | Year 2 | Year 3 | |
| Net Profit Margin | -284.46% | 32.53% | 44.47% | n.a |
| Return on Equity | -187.39% | 65.02% | 58.28% | n.a |
| Activity Ratios | ||||
| Accounts Payable Turnover | 9.06 | 12.17 | 12.17 | n.a |
| Payment Days | 27 | 25 | 25 | n.a |
| Total Asset Turnover | 0.48 | 1.74 | 1.22 | n.a |
| Debt Ratios | ||||
| Debt to Net Worth | 0.38 | 0.15 | 0.08 | n.a |
| Current Liab. to Liab. | 1.00 | 1.00 | 1.00 | n.a |
| Liquidity Ratios | ||||
| Net Working Capital | $979,840 | $2,801,515 | $6,714,604 | n.a |
| Interest Coverage | -90.81 | 122.45 | 263.33 | n.a |
| Additional Ratios | ||||
| Assets to Sales | 2.09 | 0.58 | 0.82 | n.a |
| Current Debt/Total Assets | 27% | 13% | 7% | n.a |
| Acid Test | 3.65 | 7.60 | 14.26 | n.a |
| Sales/Net Worth | 0.66 | 2.00 | 1.31 | n.a |
| Dividend Payout | 0.00 | 0.00 | 0.00 | n.a |
Appendix
| Sales Forecast | |||||||||||||
| Month 1 | Month 2 | Month 3 | Month 4 | Month 5 | Month 6 | Month 7 | Month 8 | Month 9 | Month 10 | Month 11 | Month 12 | ||
| Sales | |||||||||||||
| Upgrade Units | 5000% | $0 | $0 | $30 | $80 | $200 | $400 | $700 | $1,100 | $1,600 | $2,200 | $2,900 | $3,700 |
| Upgrade Kits (Net over cost of kit) | 0% | $0 | $0 | $1,470 | $3,920 | $9,800 | $19,600 | $34,300 | $53,900 | $78,400 | $107,800 | $142,100 | $181,300 |
| Licensing Revenue | 0% | $0 | $0 | $0 | $0 | $0 | $0 | $0 | $0 | $0 | $0 | $0 | $0 |
| Total Sales | $0 | $0 | $1,500 | $4,000 | $10,000 | $20,000 | $35,000 | $55,000 | $80,000 | $110,000 | $145,000 | $185,000 | |
| Direct Cost of Sales | Month 1 | Month 2 | Month 3 | Month 4 | Month 5 | Month 6 | Month 7 | Month 8 | Month 9 | Month 10 | Month 11 | Month 12 | |
| Upgrade Units | $0 | $0 | $0 | $0 | $0 | $0 | $0 | $0 | $0 | $0 | $0 | $0 | |
| Upgrade Kits (Net over cost of kit) | $0 | $0 | $0 | $0 | $0 | $0 | $0 | $0 | $0 | $0 | $0 | $0 | |
| Licensing Revenue | $0 | $0 | $0 | $0 | $0 | $0 | $0 | $0 | $0 | $0 | $0 | $0 | |
| Subtotal Direct Cost of Sales | $0 | $0 | $0 | $0 | $0 | $0 | $0 | $0 | $0 | $0 | $0 | $0 | |
| Personnel Plan | |||||||||||||
| Month 1 | Month 2 | Month 3 | Month 4 | Month 5 | Month 6 | Month 7 | Month 8 | Month 9 | Month 10 | Month 11 | Month 12 | ||
| Karl C. Hansen, Chairman/CEO/CTO/VP Engineering | 0% | $15,000 | $15,000 | $15,000 | $15,000 | $15,000 | $15,000 | $15,000 | $15,000 | $15,000 | $15,000 | $15,000 | $15,000 |
| VP of Operations | 0% | $12,500 | $12,500 | $12,500 | $12,500 | $12,500 | $12,500 | $12,500 | $12,500 | $12,500 | $12,500 | $12,500 | $12,500 |
| VP of Corporate Strategy, Business Development and Sales | 0% | $12,500 | $12,500 | $12,500 | $12,500 | $12,500 | $12,500 | $12,500 | $12,500 | $12,500 | $12,500 | $12,500 | $12,500 |
| VP of Marketing | 0% | $12,500 | $12,500 | $12,500 | $12,500 | $12,500 | $12,500 | $12,500 | $12,500 | $12,500 | $12,500 | $12,500 | $12,500 |
| Director of Finance | 0% | $9,000 | $9,000 | $9,000 | $9,000 | $9,000 | $9,000 | $9,000 | $9,000 | $9,000 | $9,000 | $9,000 | $9,000 |
| Lisa Hansen, Executive Assistant, Market & Usability Research | 0% | $6,000 | $6,000 | $6,000 | $6,000 | $6,000 | $6,000 | $6,000 | $6,000 | $6,000 | $6,000 | $6,000 | $6,000 |
| Office Manager | 0% | $0 | $5,000 | $5,000 | $5,000 | $5,000 | $5,000 | $5,000 | $5,000 | $5,000 | $5,000 | $5,000 | $5,000 |
| Order Fulfillment | 0% | $0 | $3,500 | $3,500 | $3,500 | $3,500 | $3,500 | $3,500 | $3,500 | $3,500 | $3,500 | $3,500 | $3,500 |
| Order Fulfillment | 0% | $0 | $0 | $0 | $3,000 | $3,000 | $3,000 | $3,000 | $3,000 | $3,000 | $3,000 | $3,000 | $3,000 |
| Sales | 0% | $0 | $7,000 | $7,000 | $7,000 | $7,000 | $7,000 | $7,000 | $7,000 | $7,000 | $7,000 | $7,000 | $7,000 |
| Sales | 0% | $0 | $0 | $0 | $6,000 | $6,000 | $6,000 | $6,000 | $6,000 | $6,000 | $6,000 | $6,000 | $6,000 |
| Marketing | 0% | $0 | $7,000 | $7,000 | $7,000 | $7,000 | $7,000 | $7,000 | $7,000 | $7,000 | $7,000 | $7,000 | $7,000 |
| Marketing | 0% | $0 | $0 | $0 | $6,000 | $6,000 | $6,000 | $6,000 | $6,000 | $6,000 | $6,000 | $6,000 | $6,000 |
| Developer | 0% | $0 | $8,500 | $8,500 | $8,500 | $8,500 | $8,500 | $8,500 | $8,500 | $8,500 | $8,500 | $8,500 | $8,500 |
| Developer | 0% | $0 | $0 | $0 | $7,800 | $7,800 | $7,800 | $7,800 | $7,800 | $7,800 | $7,800 | $7,800 | $7,800 |
| Developer | 0% | $0 | $0 | $0 | $0 | $0 | $0 | $7,000 | $7,000 | $7,000 | $7,000 | $7,000 | $7,000 |
| Total People | 16 | 16 | 16 | 16 | 16 | 16 | 16 | 16 | 16 | 16 | 16 | 16 | |
| Total Payroll | $67,500 | $98,500 | $98,500 | $121,300 | $121,300 | $121,300 | $128,300 | $128,300 | $128,300 | $128,300 | $128,300 | $128,300 | |
| General Assumptions | |||||||||||||
| Month 1 | Month 2 | Month 3 | Month 4 | Month 5 | Month 6 | Month 7 | Month 8 | Month 9 | Month 10 | Month 11 | Month 12 | ||
| Plan Month | 1 | 2 | 3 | 4 | 5 | 6 | 7 | 8 | 9 | 10 | 11 | 12 | |
| Current Interest Rate | 8.00% | 8.00% | 8.00% | 8.00% | 8.00% | 8.00% | 8.00% | 8.00% | 8.00% | 8.00% | 8.00% | 8.00% | |
| Long-term Interest Rate | 10.00% | 10.00% | 10.00% | 10.00% | 10.00% | 10.00% | 10.00% | 10.00% | 10.00% | 10.00% | 10.00% | 10.00% | |
| Tax Rate | 30.00% | 25.00% | 25.00% | 25.00% | 25.00% | 25.00% | 25.00% | 25.00% | 25.00% | 25.00% | 25.00% | 25.00% | |
| Other | 0 | 0 | 0 | 0 | 0 | 0 | 0 | 0 | 0 | 0 | 0 | 0 | |
| Pro Forma Profit and Loss | |||||||||||||
| Month 1 | Month 2 | Month 3 | Month 4 | Month 5 | Month 6 | Month 7 | Month 8 | Month 9 | Month 10 | Month 11 | Month 12 | ||
| Sales | $0 | $0 | $1,500 | $4,000 | $10,000 | $20,000 | $35,000 | $55,000 | $80,000 | $110,000 | $145,000 | $185,000 | |
| Direct Cost of Sales | $0 | $0 | $0 | $0 | $0 | $0 | $0 | $0 | $0 | $0 | $0 | $0 | |
| Other | $0 | $0 | $0 | $0 | $0 | $0 | $0 | $0 | $0 | $0 | $0 | $0 | |
| Total Cost of Sales | $0 | $0 | $0 | $0 | $0 | $0 | $0 | $0 | $0 | $0 | $0 | $0 | |
| Gross Margin | $0 | $0 | $1,500 | $4,000 | $10,000 | $20,000 | $35,000 | $55,000 | $80,000 | $110,000 | $145,000 | $185,000 | |
| Gross Margin % | 0.00% | 0.00% | 100.00% | 100.00% | 100.00% | 100.00% | 100.00% | 100.00% | 100.00% | 100.00% | 100.00% | 100.00% | |
| Expenses | |||||||||||||
| Payroll | $67,500 | $98,500 | $98,500 | $121,300 | $121,300 | $121,300 | $128,300 | $128,300 | $128,300 | $128,300 | $128,300 | $128,300 | |
| Sales and Marketing and Other Expenses | $13,000 | $16,000 | $23,000 | $33,000 | $45,000 | $55,000 | $57,000 | $67,000 | $69,000 | $79,000 | $81,000 | $81,000 | |
| Depreciation | TBD | $0 | $0 | $0 | $0 | $0 | $0 | $0 | $0 | $0 | $0 | $0 | $0 |
| Leased Equipment | TBD | $0 | $0 | $2,000 | $2,000 | $2,000 | $2,000 | $2,000 | $2,000 | $2,000 | $2,000 | $2,000 | $2,000 |
| Utilities | See Rent | $0 | $0 | $0 | $0 | $0 | $0 | $0 | $0 | $0 | $0 | $0 | $0 |
| Insurance | TBD | $0 | $0 | $500 | $500 | $500 | $500 | $500 | $500 | $500 | $500 | $500 | $500 |
| Rent (Full Services, 1st year covered in startup costs) | See Note | $0 | $0 | $0 | $0 | $0 | $0 | $0 | $0 | $0 | $0 | $0 | $0 |
| Payroll Taxes | 30% | $20,250 | $29,550 | $29,550 | $36,390 | $36,390 | $36,390 | $38,490 | $38,490 | $38,490 | $38,490 | $38,490 | $38,490 |
| Other | $0 | $0 | $0 | $0 | $0 | $0 | $0 | $0 | $0 | $0 | $0 | $0 | |
| Total Operating Expenses | $100,750 | $144,050 | $153,550 | $193,190 | $205,190 | $215,190 | $226,290 | $236,290 | $238,290 | $248,290 | $250,290 | $250,290 | |
| Profit Before Interest and Taxes | ($100,750) | ($144,050) | ($152,050) | ($189,190) | ($195,190) | ($195,190) | ($191,290) | ($181,290) | ($158,290) | ($138,290) | ($105,290) | ($65,290) | |
| EBITDA | ($100,750) | ($144,050) | ($152,050) | ($189,190) | ($195,190) | ($195,190) | ($191,290) | ($181,290) | ($158,290) | ($138,290) | ($105,290) | ($65,290) | |
| Interest Expense | $1,667 | $1,667 | $1,667 | $1,667 | $1,667 | $1,667 | $1,667 | $1,667 | $1,667 | $1,667 | $1,667 | $1,667 | |
| Taxes Incurred | $0 | $0 | $0 | $0 | $0 | $0 | $0 | $0 | $0 | $0 | $0 | $0 | |
| Net Profit | ($102,417) | ($145,717) | ($153,717) | ($190,857) | ($196,857) | ($196,857) | ($192,957) | ($182,957) | ($159,957) | ($139,957) | ($106,957) | ($66,957) | |
| Net Profit/Sales | 0.00% | 0.00% | -10247.78% | -4771.42% | -1968.57% | -984.28% | -551.30% | -332.65% | -199.95% | -127.23% | -73.76% | -36.19% | |
| Pro Forma Cash Flow | |||||||||||||
| Month 1 | Month 2 | Month 3 | Month 4 | Month 5 | Month 6 | Month 7 | Month 8 | Month 9 | Month 10 | Month 11 | Month 12 | ||
| Cash Received | |||||||||||||
| Cash from Operations | |||||||||||||
| Cash Sales | $0 | $0 | $1,500 | $4,000 | $10,000 | $20,000 | $35,000 | $55,000 | $80,000 | $110,000 | $145,000 | $185,000 | |
| Subtotal Cash from Operations | $0 | $0 | $1,500 | $4,000 | $10,000 | $20,000 | $35,000 | $55,000 | $80,000 | $110,000 | $145,000 | $185,000 | |
| Additional Cash Received | |||||||||||||
| Sales Tax, VAT, HST/GST Received | 0.00% | $0 | $0 | $0 | $0 | $0 | $0 | $0 | $0 | $0 | $0 | $0 | $0 |
| New Current Borrowing | $0 | $0 | $0 | $0 | $0 | $0 | $0 | $0 | $0 | $0 | $0 | $0 | |
| New Other Liabilities (interest-free) | $0 | $0 | $0 | $0 | $0 | $0 | $0 | $0 | $0 | $0 | $0 | $0 | |
| New Long-term Liabilities | $0 | $0 | $0 | $0 | $0 | $0 | $0 | $0 | $0 | $0 | $0 | $0 | |
| Sales of Other Current Assets | $0 | $0 | $0 | $0 | $0 | $0 | $0 | $0 | $0 | $0 | $0 | $0 | |
| Sales of Long-term Assets | $0 | $0 | $0 | $0 | $0 | $0 | $0 | $0 | $0 | $0 | $0 | $0 | |
| New Investment Received | $0 | $0 | $0 | $0 | $0 | $0 | $0 | $0 | $0 | $0 | $0 | $0 | |
| Subtotal Cash Received | $0 | $0 | $1,500 | $4,000 | $10,000 | $20,000 | $35,000 | $55,000 | $80,000 | $110,000 | $145,000 | $185,000 | |
| Expenditures | Month 1 | Month 2 | Month 3 | Month 4 | Month 5 | Month 6 | Month 7 | Month 8 | Month 9 | Month 10 | Month 11 | Month 12 | |
| Expenditures from Operations | |||||||||||||
| Cash Spending | $67,500 | $98,500 | $98,500 | $121,300 | $121,300 | $121,300 | $128,300 | $128,300 | $128,300 | $128,300 | $128,300 | $128,300 | |
| Bill Payments | $1,164 | $35,327 | $47,533 | $57,278 | $73,957 | $85,890 | $95,693 | $99,990 | $109,723 | $111,990 | $121,723 | $123,657 | |
| Subtotal Spent on Operations | $68,664 | $133,827 | $146,033 | $178,578 | $195,257 | $207,190 | $223,993 | $228,290 | $238,023 | $240,290 | $250,023 | $251,957 | |
| Additional Cash Spent | |||||||||||||
| Sales Tax, VAT, HST/GST Paid Out | $0 | $0 | $0 | $0 | $0 | $0 | $0 | $0 | $0 | $0 | $0 | $0 | |
| Principal Repayment of Current Borrowing | $0 | $0 | $0 | $0 | $0 | $0 | $0 | $0 | $0 | $0 | $0 | $0 | |
| Other Liabilities Principal Repayment | $0 | $0 | $0 | $0 | $0 | $0 | $0 | $0 | $0 | $0 | $0 | $0 | |
| Long-term Liabilities Principal Repayment | $0 | $0 | $0 | $0 | $0 | $0 | $0 | $0 | $0 | $0 | $0 | $0 | |
| Purchase Other Current Assets | $0 | $0 | $0 | $0 | $0 | $0 | $0 | $0 | $0 | $0 | $0 | $0 | |
| Purchase Long-term Assets | $0 | $0 | $0 | $0 | $0 | $0 | $0 | $0 | $0 | $0 | $0 | $0 | |
| Dividends | $0 | $0 | $0 | $0 | $0 | $0 | $0 | $0 | $0 | $0 | $0 | $0 | |
| Subtotal Cash Spent | $68,664 | $133,827 | $146,033 | $178,578 | $195,257 | $207,190 | $223,993 | $228,290 | $238,023 | $240,290 | $250,023 | $251,957 | |
| Net Cash Flow | ($68,664) | ($133,827) | ($144,533) | ($174,578) | ($185,257) | ($187,190) | ($188,993) | ($173,290) | ($158,023) | ($130,290) | ($105,023) | ($66,957) | |
| Cash Balance | $2,997,336 | $2,863,509 | $2,718,976 | $2,544,398 | $2,359,141 | $2,171,951 | $1,982,958 | $1,809,668 | $1,651,645 | $1,521,355 | $1,416,331 | $1,349,375 | |
| Pro Forma Balance Sheet | |||||||||||||
| Month 1 | Month 2 | Month 3 | Month 4 | Month 5 | Month 6 | Month 7 | Month 8 | Month 9 | Month 10 | Month 11 | Month 12 | ||
| Assets | Starting Balances | ||||||||||||
| Current Assets | |||||||||||||
| Cash | $3,066,000 | $2,997,336 | $2,863,509 | $2,718,976 | $2,544,398 | $2,359,141 | $2,171,951 | $1,982,958 | $1,809,668 | $1,651,645 | $1,521,355 | $1,416,331 | $1,349,375 |
| Other Current Assets | $0 | $0 | $0 | $0 | $0 | $0 | $0 | $0 | $0 | $0 | $0 | $0 | $0 |
| Total Current Assets | $3,066,000 | $2,997,336 | $2,863,509 | $2,718,976 | $2,544,398 | $2,359,141 | $2,171,951 | $1,982,958 | $1,809,668 | $1,651,645 | $1,521,355 | $1,416,331 | $1,349,375 |
| Long-term Assets | |||||||||||||
| Long-term Assets | $0 | $0 | $0 | $0 | $0 | $0 | $0 | $0 | $0 | $0 | $0 | $0 | $0 |
| Accumulated Depreciation | $0 | $0 | $0 | $0 | $0 | $0 | $0 | $0 | $0 | $0 | $0 | $0 | $0 |
| Total Long-term Assets | $0 | $0 | $0 | $0 | $0 | $0 | $0 | $0 | $0 | $0 | $0 | $0 | $0 |
| Total Assets | $3,066,000 | $2,997,336 | $2,863,509 | $2,718,976 | $2,544,398 | $2,359,141 | $2,171,951 | $1,982,958 | $1,809,668 | $1,651,645 | $1,521,355 | $1,416,331 | $1,349,375 |
| Liabilities and Capital | Month 1 | Month 2 | Month 3 | Month 4 | Month 5 | Month 6 | Month 7 | Month 8 | Month 9 | Month 10 | Month 11 | Month 12 | |
| Current Liabilities | |||||||||||||
| Accounts Payable | $0 | $33,753 | $45,643 | $54,826 | $71,105 | $82,705 | $92,371 | $96,335 | $106,001 | $107,935 | $117,601 | $119,535 | $119,535 |
| Current Borrowing | $250,000 | $250,000 | $250,000 | $250,000 | $250,000 | $250,000 | $250,000 | $250,000 | $250,000 | $250,000 | $250,000 | $250,000 | $250,000 |
| Other Current Liabilities | $0 | $0 | $0 | $0 | $0 | $0 | $0 | $0 | $0 | $0 | $0 | $0 | $0 |
| Subtotal Current Liabilities | $250,000 | $283,753 | $295,643 | $304,826 | $321,105 | $332,705 | $342,371 | $346,335 | $356,001 | $357,935 | $367,601 | $369,535 | $369,535 |
| Long-term Liabilities | $0 | $0 | $0 | $0 | $0 | $0 | $0 | $0 | $0 | $0 | $0 | $0 | $0 |
| Total Liabilities | $250,000 | $283,753 | $295,643 | $304,826 | $321,105 | $332,705 | $342,371 | $346,335 | $356,001 | $357,935 | $367,601 | $369,535 | $369,535 |
| Paid-in Capital | $3,750,000 | $3,750,000 | $3,750,000 | $3,750,000 | $3,750,000 | $3,750,000 | $3,750,000 | $3,750,000 | $3,750,000 | $3,750,000 | $3,750,000 | $3,750,000 | $3,750,000 |
| Retained Earnings | ($934,000) | ($934,000) | ($934,000) | ($934,000) | ($934,000) | ($934,000) | ($934,000) | ($934,000) | ($934,000) | ($934,000) | ($934,000) | ($934,000) | ($934,000) |
| Earnings | $0 | ($102,417) | ($248,133) | ($401,850) | ($592,707) | ($789,563) | ($986,420) | ($1,179,377) | ($1,362,333) | ($1,522,290) | ($1,662,247) | ($1,769,203) | ($1,836,160) |
| Total Capital | $2,816,000 | $2,713,583 | $2,567,867 | $2,414,150 | $2,223,293 | $2,026,437 | $1,829,580 | $1,636,623 | $1,453,667 | $1,293,710 | $1,153,753 | $1,046,797 | $979,840 |
| Total Liabilities and Capital | $3,066,000 | $2,997,336 | $2,863,509 | $2,718,976 | $2,544,398 | $2,359,141 | $2,171,951 | $1,982,958 | $1,809,668 | $1,651,645 | $1,521,355 | $1,416,331 | $1,349,375 |
| Net Worth | $2,816,000 | $2,713,583 | $2,567,867 | $2,414,150 | $2,223,293 | $2,026,437 | $1,829,580 | $1,636,623 | $1,453,667 | $1,293,710 | $1,153,753 | $1,046,797 | $979,840 |


