
Flash Commercial Photography
Executive Summary
Flash Commercial Photography, located in and serving Rochester, NY, will serve small and medium-sized businesses and non-profits for all of their studio photography needs by creating beautiful shots that serve the client’s needs, offering excellent service and flexibility with a personal touch, and offering value-added services related to photography. Founded and directed by veteran freelance commercial photographer Matte Flash, Flash Commercial Photography intends to raise $53,000 by adding limited partners to the business in order to open a studio space, hire staff, and undergo a new marketing campaign.
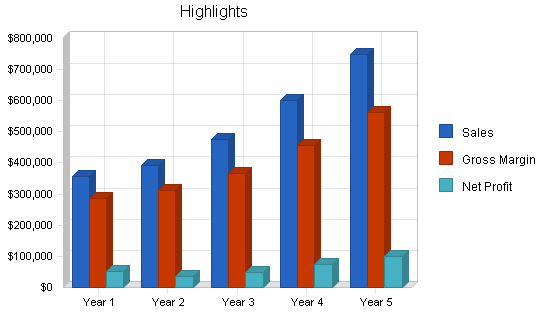
Sales and profits from the business are projected to rise steadily, from $356,000 revenues and $50,000 profits in the first year to $750,000 revenues and $99,000 profits in year 5. Gross margins and net profit margins will be relatively steady at 75% and 13% respectively.
The keys to success for the business include:
- Establishing Flash Photography as flexible to the needs of small and medium-sized businesses
- Offering a range of additional services, such as printing, photo editing, framing, and production of photos in a variety of digital formats
- Making businesses feel at home in our studio and a part of the creative process
Objectives
Flash Commercial Photography seeks to enter the top three commercial photography providers in the Rochester, NY metropolitan area within five years. We seek the following objectives within that five year period:
- To be in the top three commercial photography studios in terms of market share
- To exceed $900 thousand in annual revenue
- To support five full-time staff
Mission
Flash Commercial Photography seeks to serve small and medium-sized businesses and non-profits for all of their studio photography needs by creating beautiful shots that serve the client’s needs, offering excellent service and flexibility with a personal touch, and offering value-added services related to photography. Flash intends to offer personalized service to make it easy for small businesses to outsource their photography needs.
Keys to Success
- Establishing Flash Photography as flexible to the needs of small and medium-sized businesses
- Offering a range of additional services, such as printing, photo editing, framing, and production of photos in a variety of digital formats
- Making businesses feel at home in our studio and part of the creative process
Company Summary
Flash Commercial Photography will be based in a conveniently-located studio space within half an hour of downtown Rochester, NY. The company was founded by Matte Flash in 1999. For more than ten years, Flash has operated as a freelance photographer specializing in commercial shoots, establishing a reputation among small businesses as a professional and talented photographer. Over this time, Flash’s business has steadily grown, including a variety of returning clients who rely on Flash for their product photography for pamphlets, brochures, websites, and other marketing collateral. Flash has operated without a devoted studio during this time, traveling to client sites and setting up a studio space wherever possible.
Company Ownership
Flash Commercial Photography was established as a sole proprietorship in 1999 and is currently being re-established as a limited liability partnership to facilitate the participation of investing partners. Currently, all shares of Flash Commercial Photography are owned by Matte Flash.
Start-up Summary
Start-up expenses include the legal fees associated with re-incorporating the business, permits associated with a studio space, and the build-out of the studio space. Marketing includes a promotional campaign to alert customers and potential customers to the services and capacity Flash Commercial Photography is adding. Rent includes two months of studio rent to cover the build-out period and two additional months for a security deposit.
Long-term assets include additional photography equipment (cameras, tripods, backdrops, flashes, lighting) that must be purchased.

| Start-up | |
| Requirements | |
| Start-up Expenses | |
| Legal | $2,500 |
| Stationery etc. | $1,000 |
| Insurance | $1,000 |
| Rent | $8,000 |
| Marketing | $10,000 |
| Studio Build-Out | $2,000 |
| Total Start-up Expenses | $24,500 |
| Start-up Assets | |
| Cash Required | $15,000 |
| Other Current Assets | $1,000 |
| Long-term Assets | $30,000 |
| Total Assets | $46,000 |
| Total Requirements | $70,500 |
Services
Services to be offered include the following:
- Studio commercial photography
- On-site commercial photography
- Set dressing services for photo shoots
- Photo editing and digital editing work
- Delivery of prints or digital files of photo shoots
- Framing of photos
- Web portal to access digital files from shoots and manage editing process with clients
- Rental of the studio space to subcontractors when time allows
In the future, as additional staff are are added, there are plans to offer graphic design services for the photos taken, and to expand to a multi-room studio to allow for multiple shoots simultaneously.
Market Analysis Summary
The market for commercial photography includes all businesses and non-profits. For Flash Commercial Photography, the target market is small and medium-sized businesses and non-profits (those with under 500 employees) based within a 15 mile radius of Rochester, NY.
In the past two years, the market for commercial photography in Rochester, NY has contracted due to the recent economic downturn. It is estimated by the Rochester Chamber of Commerce that commercial photography has shrunk from $5.7 million to $4.5 million annual revenues since two years ago. Small and medium-sized businesses which formerly used large commercial studios can no longer afford their rates. This has created an opportunity for smaller photography studios with lower overhead and prices to serve this market and seize market share in time for a market upswing.
Market Segmentation
Very Small Businesses: These businesses are generally run by their owners. Photography needs tend to be for their basic marketing collateral (signs, menus, pamphlets, brochures, websites, newsletters, etc.). These businesses generally begin by taking these photographs in-house, but, over time, determine that this method produces sub-standard results. They then seek inexpensive freelance photographers who can quickly handle their needs.
Small Businesses: These businesses have ongoing and regular needs for photography of their products and services, such as quarterly catalogs. They appreciate establishing relationships with vendors who understand their way of working, allow them access to the creative process, and reduce the stress of creating marketing materials. They prefer to work with one vendor for all photography needs and will be reluctant to change that vendor once it is found. However, they do continue to check the prices of their vendor against competitors to make sure they are getting the preferred mix of quality and price.
Medium Businesses: These businesses have marketing departments which outsource photography to photo studios. They have a higher volume of photography needs than smaller businesses and pay great attention to the quality of the images as well as the price. Volume discounts may be needed to retain businesses in this category.

| Market Analysis | |||||||
| Year 1 | Year 2 | Year 3 | Year 4 | Year 5 | |||
| Potential Customers | Growth | CAGR | |||||
| Very Small Businesses | 10% | 1,000 | 1,100 | 1,210 | 1,331 | 1,464 | 10.00% |
| Small Businesses | 15% | 500 | 575 | 661 | 760 | 874 | 14.98% |
| Medium Businesses | 20% | 200 | 240 | 288 | 346 | 415 | 20.02% |
| Total | 12.81% | 1,700 | 1,915 | 2,159 | 2,437 | 2,753 | 12.81% |
Target Market Segment Strategy
Larger businesses in the Rochester area are served by large studios who can send photographers to the client site or set up shoots with little notice. These businesses require photography vendors with the capacity to shoot in multiple locations at the same time.
Smaller businesses, on the other hand, are comfortable working with smaller photography studios. They are generally unhappy with larger studios, as they find they are not a priority compared with the larger clients of the studio. They want the same level of service, scaled to the needs and budget of their business, and only a smaller studio can provide this.
Furthermore, larger businesses often bring a great deal of photo editing work in-house to their marketing departments. Smaller businesses value the ability of a photo studio to handle this work as their marketing or design departments often do not have the capacity to deal with this work when new materials are being developed.

Medium and small businesses can provide ongoing work. However, without serving very small businesses, Flash will miss out on capturing smaller customers before they grow. Working with very small businesses can also provide a wide base of customers, making the revenue streams of the business less susceptible to the loss of any one customer.
Service Business Analysis
The commercial photography industry is characterized by local photo studios which serve cities or small regions. Very few businesses grow beyond this geographic range. Within a local market, such as Rochester, NY, there are dozens of photo studios in operation. Businesses seek photography vendors through referrals, internet search, and the local yellow pages. Photography studios generally base their charges on the time of the shoot as well as the number of edited photos provided.
Specific competitors for Flash Commercial Photography include:
Redwood Studios – Established 5 years ago and operating a small studio, this company focuses on product photography only
ImageMakers – Established 10 years ago, this company does not operate a studio, but uses student photographers to offer lower-priced on-site photography shoots
Flash Photographers – Established 3 years ago, this company subcontracts all of its photography work to freelance photographers, acting as a broker between these freelancers and clients. This leads to a lower level of quality assurance, and some client dissatisfaction
Competition and Buying Patterns
There are very few barriers to entry into the commercial photography business. At the low-end of the market, freelance photographers with inexpensive digital cameras start work officially and unofficially every day. However, at the high end of the market, quality photographers working with the best equipment and a studio space are protected by the capital required to purchase equipment and to rent and build out a studio.
Customers among small and medium-sized businesses seek low prices, but will not sacrifice quality. The best quality is obtained in the controlled environment of a studio, with well-trained photographers and high-quality equipment. Customers choose between photo studios based on their websites and portfolios of work, as well as the personal assurances of the salesperson they work with at the studio that their needs will be taken care of.
Word of mouth is extremely important for this business. While the product of the work becomes very visible, it is important that customers feel so strongly about the experience of working with their photo studio that they talk about it to other businesses and contacts. These referrals are extremely helpful in generating business.
Strategy and Implementation Summary
To build its reputation as a quality choice for commercial photography in the Rochester, NY market, Flash Commercial Photography will focus on small and medium-sized businesses. These include:
- Very Small Businesses (under 20 employees)
- Small Businesses (20 to 200 employees)
- Medium Businesses (200 to 500 employees)
To reach these target markets, Flash will use email marketing, business networking, and web marketing to find clients and to ensure that clients find Flash. The CEO, Matte Flash, will sell to clients, and both he and an additional team of assistant photographers will be assigned to client photo shoots in the Flash studio and, when needed, at client sites.
Competitive Edge
Flash Commercial Photography has a competitive edge from the reputation of Matte Flash in the business community as a high-quality photographer who is easy to work with and attentive to the needs of clients. Flash will continue to develop this competitive edge by training additional photographers with his signature style of photography and high attention to customer service.
Marketing Strategy
The marketing strategy for Flash Commercial Photography is based on the belief that using a few marketing tactics extremely well is preferable to using many marketing tactics with moderate success with each. The following are components of the initial marketing campaign:
Email Marketing: Emailing a new business announcement and then monthly newsletters with details on new packages, the development of the studio, and new hires to past clients and other targets in the business community. Newsletters will include helpful tips on how to use photography and this will be used to gain permission from marketing departments at prospective client businesses to be sent the newsletters. Within these emails will be calls to action to encourage business referrals.
Business Networking: Matte Flash will promote the business through the local chapter of BNI (Business Networking International), the Chamber of Commerce, and the Rochester Business Owner’s Association. Through these meetings, Flash will introduce his company’s work to other business owners, share leads on business, and receive both exposure and qualified referrals. To encourage members of networking groups to use Flash’s services so that they are educated referrers, Flash will offer a 25% discount on services to members of the networking group on their first purchase.
Web Marketing: Flash Photography will purchase search engine advertising with Google Adwords around commercial photography keywords for the Rochester market and gear its advertisements towards the needs of small and medium-sized businesses. Furthermore, Flash Photography’s website will be optimized for higher search engine ranking under these keywords.
Sales Strategy
The company’s sales strategy is to utilize the experience of Matte Flash as salesperson. Flash will be able to assure clients of what the company and its photographers can accomplish as all will be personally trained by him.
To increase the closing rate of prospects, Flash will meet clients at their businesses whenever possible to go beyond phone conversations. He will use a portfolio of images and testimonials. Flash will use Salesforce.com as a tool to manage the sales process, and to train additional salespeople when the time comes.
The scheduling and fulfillment of services will be administered by the office manager, who will use Salesforce.com and QuickBooks to manage clients and capture information related to orders. Standard procedures for order fulfillment will be created by Flash and checked on an ongoing basis.
Sales Forecast
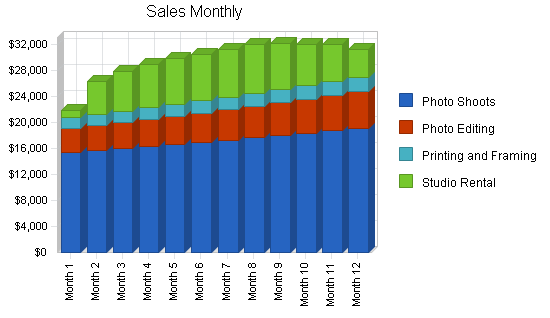
Sales for photo shoots are expected to drive the business and will grow with the growing staff. Additional photographers will be hired to meet the need first as part-time and then as full-time staff.
Supplementary revenue streams will be photo editing services and printing and framing of images. Finally, off-hours for the studio will be rented for events of other purposes to create a steady monthly stream of revenue.

| Sales Forecast | |||||
| Year 1 | Year 2 | Year 3 | Year 4 | Year 5 | |
| Sales | |||||
| Photo Shoots | $206,332 | $256,841 | $300,000 | $370,000 | $450,000 |
| Photo Editing | $55,345 | $69,759 | $90,000 | $120,000 | $150,000 |
| Printing and Framing | $23,321 | $29,524 | $50,000 | $70,000 | $100,000 |
| Studio Rental | $71,638 | $36,000 | $36,000 | $40,000 | $50,000 |
| Total Sales | $356,636 | $392,124 | $476,000 | $600,000 | $750,000 |
| Direct Cost of Sales | Year 1 | Year 2 | Year 3 | Year 4 | Year 5 |
| Printing and Framing Cost | $17,491 | $21,743 | $37,500 | $52,500 | $75,000 |
| Other Cost of Sales | $53,495 | $58,819 | $71,400 | $90,000 | $112,500 |
| Subtotal Direct Cost of Sales | $70,986 | $80,562 | $108,900 | $142,500 | $187,500 |
Milestones
The promotional marketing before the opening of the studio is in a two month period in which an initial Web marketing and email marketing campaign will take place, directed by the CEO, with some help from the part-time administrative assistant, and marketing vendors (a Web marketing specialist). Furthermore, ads will be placed to specifically highlight the studio as a rental option for other uses.
- Web Marketing specialist will be hired to set-up and maintain Google Adwords campaign and to optimize website for search engines.
- Constant Contact will be used to maintain email marketing with announcements about the studio opening, new staff, and new services.

| Milestones | |||||
| Milestone | Start Date | End Date | Budget | Manager | Department |
| Sign Lease on Studio | 9/30/2009 | 9/30/2009 | $0 | GC | Operations |
| Hire Part-Time Staff | 11/1/2009 | 11/1/2009 | $0 | GC | Operations |
| Train Part-Time Staff | 11/1/2009 | 12/31/2009 | $0 | GC | Operations |
| Open Studio For Business | 1/1/2010 | 1/1/2010 | $0 | GC | Operations |
| Web Marketing Campaign | 11/1/2009 | 12/31/2009 | $8,000 | GC | Marketing |
| Email Marketing Campaign | 11/23/2009 | 12/23/2009 | $1,000 | GC | Marketing |
| Rental Studio Marketing | 11/15/2009 | 12/31/2009 | $1,000 | GC | Marketing |
| Totals | $10,000 | ||||
Management Summary
Matte Flash will act as CEO of Flash Commercial Photography. Flash has extensive industry, sales, and operational experience. Immediate hires will include one part-time assistant photographer and one part-time administrative assistant.
The CEO will be responsible for sales and marketing, management of all staff, and fulfillment of client services.
The first part-time assistant photographer will be Timothy Smith, a recent graduate of the School of Visual Arts and an accomplished photographer new to Rochester. The assistant photographer will assist on shoots during training and begin to take the lead on photo shoots over time. He will move to full-time within one year if sales projections are met.
The administrative assistant will be responsible for bookkeeping (accounts payable and receivable), scheduling of shoots and labor, and fielding calls for rental of the studio and initial sales inquiries. He or she will execute marketing campaigns (update website, print brochures and portfolios, etc). He or she will offer customer service to answer basic questions by phone or email.
Personnel Plan
Flash Commercial Photography will begin its expansion with one part-time assistant photographer and one part-time administrative assistant, with the understanding that both positions will grow to full-time shortly. Each year an additional assistant photographer will be added.
| Personnel Plan | |||||
| Year 1 | Year 2 | Year 3 | Year 4 | Year 5 | |
| CEO | $60,000 | $60,000 | $60,000 | $60,000 | $60,000 |
| Assistant Photographer | $33,736 | $48,000 | $49,920 | $51,917 | $53,993 |
| Administrative Assistant | $19,019 | $28,344 | $40,000 | $45,000 | $50,000 |
| Assistant Photographer 2 | $0 | $13,942 | $15,000 | $30,000 | $31,200 |
| Assistant Photographer 3 | $0 | $0 | $0 | $15,000 | $35,000 |
| Assistant Photographer 4 | $0 | $0 | $0 | $4 | $15,000 |
| Total People | 3 | 3 | 4 | 6 | 7 |
| Total Payroll | $112,755 | $150,286 | $164,920 | $201,921 | $245,193 |
Financial Plan
The launch of the business will be financed by the founder’s investment and credit and by investments from limited partners. In exchange for $53,000 investment in the business at startup, limited partners will receive 49% ownership shares. The initial funding requirements are modest for the business.
The growth of the business, beyond the first year, will be financed by the free cash flows generated by the business. This will allow for the expansion of staff to include additional photographers, the ramping up of marketing expenditures, and the resulting increase in sales. Only one photographer will be added per year in order to make sure that there is time for adequate training of new staff.
Start-up Funding
Funding for the business is in part from personal loans, credit cards, and cash investment by the owner, Matte Flash. The remainder of funding will be from one to three limited partners in the form of equity investment.
| Start-up Funding | |
| Start-up Expenses to Fund | $24,500 |
| Start-up Assets to Fund | $46,000 |
| Total Funding Required | $70,500 |
| Assets | |
| Non-cash Assets from Start-up | $31,000 |
| Cash Requirements from Start-up | $15,000 |
| Additional Cash Raised | $0 |
| Cash Balance on Starting Date | $15,000 |
| Total Assets | $46,000 |
| Liabilities and Capital | |
| Liabilities | |
| Current Borrowing | $5,000 |
| Long-term Liabilities | $5,000 |
| Accounts Payable (Outstanding Bills) | $2,500 |
| Other Current Liabilities (interest-free) | $0 |
| Total Liabilities | $12,500 |
| Capital | |
| Planned Investment | |
| Owner | $5,000 |
| Limited Partners | $53,000 |
| Additional Investment Requirement | $0 |
| Total Planned Investment | $58,000 |
| Loss at Start-up (Start-up Expenses) | ($24,500) |
| Total Capital | $33,500 |
| Total Capital and Liabilities | $46,000 |
| Total Funding | $70,500 |
Break-even Analysis
The break even for the business is high, as the salaries of staff are relatively fixed.

| Break-even Analysis | |
| Monthly Revenue Break-even | $22,228 |
| Assumptions: | |
| Average Percent Variable Cost | 20% |
| Estimated Monthly Fixed Cost | $17,804 |
Projected Profit and Loss
Gross margins are expected to remain consistent, as most costs of the business are not direct costs of sales. The greatest cost of the service is labor, which is part of salaries and not cost of sales, for example.
In year 2, profit is expected to drop as capacity is increased to prepare for growth. This will rectify in future years as sales come in line with the payroll expenses.


| Pro Forma Profit and Loss | |||||
| Year 1 | Year 2 | Year 3 | Year 4 | Year 5 | |
| Sales | $356,636 | $392,124 | $476,000 | $600,000 | $750,000 |
| Direct Cost of Sales | $70,986 | $80,562 | $108,900 | $142,500 | $187,500 |
| Other Costs of Sales | $0 | $0 | $0 | $0 | $0 |
| Total Cost of Sales | $70,986 | $80,562 | $108,900 | $142,500 | $187,500 |
| Gross Margin | $285,650 | $311,562 | $367,100 | $457,500 | $562,500 |
| Gross Margin % | 80.10% | 79.46% | 77.12% | 76.25% | 75.00% |
| Expenses | |||||
| Payroll | $112,755 | $150,286 | $164,920 | $201,921 | $245,193 |
| Marketing/Promotion | $36,000 | $36,000 | $50,000 | $60,000 | $70,000 |
| Depreciation | $6,000 | $6,000 | $6,000 | $6,000 | $6,000 |
| Rent | $24,000 | $25,200 | $26,460 | $27,783 | $29,172 |
| Utilities | $2,400 | $3,000 | $3,500 | $3,800 | $4,200 |
| Insurance | $2,400 | $3,000 | $3,500 | $4,000 | $4,500 |
| Payroll Taxes | $18,091 | $22,543 | $24,738 | $30,288 | $36,779 |
| Other | $12,000 | $14,400 | $17,000 | $20,000 | $25,000 |
| Total Operating Expenses | $213,646 | $260,429 | $296,118 | $353,792 | $420,845 |
| Profit Before Interest and Taxes | $72,004 | $51,134 | $70,982 | $103,708 | $141,655 |
| EBITDA | $78,004 | $57,134 | $76,982 | $109,708 | $147,655 |
| Interest Expense | $458 | $0 | $0 | $0 | $0 |
| Taxes Incurred | $21,464 | $15,340 | $21,295 | $31,112 | $42,497 |
| Net Profit | $50,082 | $35,793 | $49,687 | $72,596 | $99,159 |
| Net Profit/Sales | 14.04% | 9.13% | 10.44% | 12.10% | 13.22% |
Projected Cash Flow
Cash flow is expected to be positive after the first month of operations. This is due to the fact that Matte Flash has a proven track record and can hit the ground running with continued work for existing clients. Cash reserves in the company will be increased over the first year to prepare for additional expansion in year two.

| Pro Forma Cash Flow | |||||
| Year 1 | Year 2 | Year 3 | Year 4 | Year 5 | |
| Cash Received | |||||
| Cash from Operations | |||||
| Cash Sales | $71,327 | $78,425 | $95,200 | $120,000 | $150,000 |
| Cash from Receivables | $261,059 | $310,351 | $374,897 | $471,273 | $589,443 |
| Subtotal Cash from Operations | $332,387 | $388,775 | $470,097 | $591,273 | $739,443 |
| Additional Cash Received | |||||
| Sales Tax, VAT, HST/GST Received | $0 | $0 | $0 | $0 | $0 |
| New Current Borrowing | $0 | $0 | $0 | $0 | $0 |
| New Other Liabilities (interest-free) | $0 | $0 | $0 | $0 | $0 |
| New Long-term Liabilities | $0 | $0 | $0 | $0 | $0 |
| Sales of Other Current Assets | $0 | $0 | $0 | $0 | $0 |
| Sales of Long-term Assets | $0 | $0 | $0 | $0 | $0 |
| New Investment Received | $0 | $0 | $0 | $0 | $0 |
| Subtotal Cash Received | $332,387 | $388,775 | $470,097 | $591,273 | $739,443 |
| Expenditures | Year 1 | Year 2 | Year 3 | Year 4 | Year 5 |
| Expenditures from Operations | |||||
| Cash Spending | $112,755 | $150,286 | $164,920 | $201,921 | $245,193 |
| Bill Payments | $174,582 | $198,957 | $251,206 | $314,216 | $393,059 |
| Subtotal Spent on Operations | $287,337 | $349,243 | $416,126 | $516,137 | $638,252 |
| Additional Cash Spent | |||||
| Sales Tax, VAT, HST/GST Paid Out | $0 | $0 | $0 | $0 | $0 |
| Principal Repayment of Current Borrowing | $5,000 | $0 | $0 | $0 | $0 |
| Other Liabilities Principal Repayment | $0 | $0 | $0 | $0 | $0 |
| Long-term Liabilities Principal Repayment | $5,000 | $0 | $0 | $0 | $0 |
| Purchase Other Current Assets | $0 | $0 | $0 | $0 | $0 |
| Purchase Long-term Assets | $0 | $0 | $0 | $0 | $0 |
| Dividends | $0 | $0 | $21,588 | $30,054 | $40,476 |
| Subtotal Cash Spent | $297,337 | $349,243 | $437,714 | $546,191 | $678,729 |
| Net Cash Flow | $35,049 | $39,533 | $32,383 | $45,082 | $60,714 |
| Cash Balance | $50,049 | $89,582 | $121,964 | $167,046 | $227,760 |
Projected Balance Sheet
The business is projected to show growth in retained earnings (which allow for dividends to be paid) as there are not substantial additional capital expenditures needed after the launch. There will be healthy growth in net worth over the first five years of operation, as additional debt is not required to fund the business.
| Pro Forma Balance Sheet | |||||
| Year 1 | Year 2 | Year 3 | Year 4 | Year 5 | |
| Assets | |||||
| Current Assets | |||||
| Cash | $50,049 | $89,582 | $121,964 | $167,046 | $227,760 |
| Accounts Receivable | $24,249 | $27,598 | $33,501 | $42,228 | $52,785 |
| Other Current Assets | $1,000 | $1,000 | $1,000 | $1,000 | $1,000 |
| Total Current Assets | $75,299 | $118,180 | $156,466 | $210,274 | $281,546 |
| Long-term Assets | |||||
| Long-term Assets | $30,000 | $30,000 | $30,000 | $30,000 | $30,000 |
| Accumulated Depreciation | $6,000 | $12,000 | $18,000 | $24,000 | $30,000 |
| Total Long-term Assets | $24,000 | $18,000 | $12,000 | $6,000 | $0 |
| Total Assets | $99,299 | $136,180 | $168,466 | $216,274 | $281,546 |
| Liabilities and Capital | Year 1 | Year 2 | Year 3 | Year 4 | Year 5 |
| Current Liabilities | |||||
| Accounts Payable | $15,717 | $16,804 | $20,991 | $26,259 | $32,848 |
| Current Borrowing | $0 | $0 | $0 | $0 | $0 |
| Other Current Liabilities | $0 | $0 | $0 | $0 | $0 |
| Subtotal Current Liabilities | $15,717 | $16,804 | $20,991 | $26,259 | $32,848 |
| Long-term Liabilities | $0 | $0 | $0 | $0 | $0 |
| Total Liabilities | $15,717 | $16,804 | $20,991 | $26,259 | $32,848 |
| Paid-in Capital | $58,000 | $58,000 | $58,000 | $58,000 | $58,000 |
| Retained Earnings | ($24,500) | $25,582 | $39,787 | $59,420 | $91,539 |
| Earnings | $50,082 | $35,793 | $49,687 | $72,596 | $99,159 |
| Total Capital | $83,582 | $119,375 | $147,474 | $190,015 | $248,698 |
| Total Liabilities and Capital | $99,299 | $136,180 | $168,466 | $216,274 | $281,546 |
| Net Worth | $83,582 | $119,375 | $147,474 | $190,015 | $248,698 |
Business Ratios
The business will spend more than the industry average on advertising, for example, in order to promote the competitive advantage of the company on the Web. The overhead reflected by Selling, General & Administrative expense is lower than the industry, as the business will make use of digital tools, reducing the costs of equipment and supplies.
| Ratio Analysis | ||||||
| Year 1 | Year 2 | Year 3 | Year 4 | Year 5 | Industry Profile | |
| Sales Growth | n.a. | 9.95% | 21.39% | 26.05% | 25.00% | -1.13% |
| Percent of Total Assets | ||||||
| Accounts Receivable | 24.42% | 20.27% | 19.89% | 19.53% | 18.75% | 20.28% |
| Other Current Assets | 1.01% | 0.73% | 0.59% | 0.46% | 0.36% | 59.10% |
| Total Current Assets | 75.83% | 86.78% | 92.88% | 97.23% | 100.00% | 83.86% |
| Long-term Assets | 24.17% | 13.22% | 7.12% | 2.77% | 0.00% | 16.14% |
| Total Assets | 100.00% | 100.00% | 100.00% | 100.00% | 100.00% | 100.00% |
| Current Liabilities | 15.83% | 12.34% | 12.46% | 12.14% | 11.67% | 40.82% |
| Long-term Liabilities | 0.00% | 0.00% | 0.00% | 0.00% | 0.00% | 36.82% |
| Total Liabilities | 15.83% | 12.34% | 12.46% | 12.14% | 11.67% | 77.65% |
| Net Worth | 84.17% | 87.66% | 87.54% | 87.86% | 88.33% | 22.35% |
| Percent of Sales | ||||||
| Sales | 100.00% | 100.00% | 100.00% | 100.00% | 100.00% | 100.00% |
| Gross Margin | 80.10% | 79.46% | 77.12% | 76.25% | 75.00% | 75.47% |
| Selling, General & Administrative Expenses | 66.05% | 70.33% | 66.68% | 64.15% | 61.78% | 36.59% |
| Advertising Expenses | 10.09% | 9.18% | 10.50% | 10.00% | 9.33% | 0.94% |
| Profit Before Interest and Taxes | 20.19% | 13.04% | 14.91% | 17.28% | 18.89% | 6.66% |
| Main Ratios | ||||||
| Current | 4.79 | 7.03 | 7.45 | 8.01 | 8.57 | 1.49 |
| Quick | 4.79 | 7.03 | 7.45 | 8.01 | 8.57 | 1.38 |
| Total Debt to Total Assets | 15.83% | 12.34% | 12.46% | 12.14% | 11.67% | 77.65% |
| Pre-tax Return on Net Worth | 85.60% | 42.83% | 48.13% | 54.58% | 56.96% | 104.64% |
| Pre-tax Return on Assets | 72.05% | 37.55% | 42.13% | 47.95% | 50.31% | 23.39% |
| Additional Ratios | Year 1 | Year 2 | Year 3 | Year 4 | Year 5 | |
| Net Profit Margin | 14.04% | 9.13% | 10.44% | 12.10% | 13.22% | n.a |
| Return on Equity | 59.92% | 29.98% | 33.69% | 38.21% | 39.87% | n.a |
| Activity Ratios | ||||||
| Accounts Receivable Turnover | 11.77 | 11.37 | 11.37 | 11.37 | 11.37 | n.a |
| Collection Days | 29 | 30 | 29 | 29 | 29 | n.a |
| Accounts Payable Turnover | 11.95 | 11.90 | 12.17 | 12.17 | 12.17 | n.a |
| Payment Days | 28 | 30 | 27 | 27 | 27 | n.a |
| Total Asset Turnover | 3.59 | 2.88 | 2.83 | 2.77 | 2.66 | n.a |
| Debt Ratios | ||||||
| Debt to Net Worth | 0.19 | 0.14 | 0.14 | 0.14 | 0.13 | n.a |
| Current Liab. to Liab. | 1.00 | 1.00 | 1.00 | 1.00 | 1.00 | n.a |
| Liquidity Ratios | ||||||
| Net Working Capital | $59,582 | $101,375 | $135,474 | $184,015 | $248,698 | n.a |
| Interest Coverage | 157.10 | 0.00 | 0.00 | 0.00 | 0.00 | n.a |
| Additional Ratios | ||||||
| Assets to Sales | 0.28 | 0.35 | 0.35 | 0.36 | 0.38 | n.a |
| Current Debt/Total Assets | 16% | 12% | 12% | 12% | 12% | n.a |
| Acid Test | 3.25 | 5.39 | 5.86 | 6.40 | 6.96 | n.a |
| Sales/Net Worth | 4.27 | 3.28 | 3.23 | 3.16 | 3.02 | n.a |
| Dividend Payout | 0.00 | 0.00 | 0.43 | 0.41 | 0.41 | n.a |
Long-term Plan
The profitability of the company will increase in absolute terms with growth. However, the gross margins and net profit margins will not increase dramatically over time as the additional growth in revenues requires additional direct labor. To maintain the reputation of the company, this labor cannot be performed by less skilled, lower-wage photographers.
As revenues grow and additional photographers are hired, the CEO will focus a greater percentage of time on sales and prospecting. This will allow for steady growth in revenues while the brand of Flash Commercial Photography becomes established in the market. A larger studio space with multiple rooms can be leased after a critical mass of utilization has been achieved with the current space. This will allow for continued growth.
Appendix
| Sales Forecast | |||||||||||||
| Month 1 | Month 2 | Month 3 | Month 4 | Month 5 | Month 6 | Month 7 | Month 8 | Month 9 | Month 10 | Month 11 | Month 12 | ||
| Sales | |||||||||||||
| Photo Shoots | $15,383 | $15,691 | $16,005 | $16,325 | $16,652 | $16,985 | $17,325 | $17,672 | $18,025 | $18,386 | $18,754 | $19,129 | |
| Photo Editing | $3,683 | $3,831 | $3,984 | $4,143 | $4,309 | $4,481 | $4,661 | $4,847 | $5,041 | $5,243 | $5,452 | $5,670 | |
| Printing and Framing | $1,739 | $1,774 | $1,809 | $1,845 | $1,882 | $1,920 | $1,958 | $1,997 | $2,037 | $2,078 | $2,120 | $2,162 | |
| Studio Rental | $1,023 | $5,027 | $6,163 | $6,651 | $7,075 | $7,162 | $7,436 | $7,494 | $7,162 | $6,344 | $5,705 | $4,396 | |
| Total Sales | $21,828 | $26,323 | $27,961 | $28,964 | $29,918 | $30,548 | $31,380 | $32,010 | $32,265 | $32,051 | $32,031 | $31,357 | |
| Direct Cost of Sales | Month 1 | Month 2 | Month 3 | Month 4 | Month 5 | Month 6 | Month 7 | Month 8 | Month 9 | Month 10 | Month 11 | Month 12 | |
| Printing and Framing Cost | $1,304 | $1,331 | $1,357 | $1,384 | $1,412 | $1,440 | $1,469 | $1,498 | $1,528 | $1,559 | $1,590 | $1,622 | |
| Other Cost of Sales | $3,274 | $3,948 | $4,194 | $4,345 | $4,488 | $4,582 | $4,707 | $4,802 | $4,840 | $4,808 | $4,805 | $4,704 | |
| Subtotal Direct Cost of Sales | $4,578 | $5,279 | $5,551 | $5,728 | $5,899 | $6,022 | $6,176 | $6,299 | $6,368 | $6,366 | $6,395 | $6,325 | |
| Personnel Plan | |||||||||||||
| Month 1 | Month 2 | Month 3 | Month 4 | Month 5 | Month 6 | Month 7 | Month 8 | Month 9 | Month 10 | Month 11 | Month 12 | ||
| CEO | $5,000 | $5,000 | $5,000 | $5,000 | $5,000 | $5,000 | $5,000 | $5,000 | $5,000 | $5,000 | $5,000 | $5,000 | |
| Assistant Photographer | $2,000 | $2,120 | $2,247 | $2,382 | $2,525 | $2,676 | $2,837 | $3,007 | $3,187 | $3,378 | $3,581 | $3,796 | |
| Administrative Assistant | $1,500 | $1,515 | $1,530 | $1,545 | $1,560 | $1,576 | $1,592 | $1,608 | $1,624 | $1,640 | $1,656 | $1,673 | |
| Assistant Photographer 2 | $0 | $0 | $0 | $0 | $0 | $0 | $0 | $0 | $0 | $0 | $0 | $0 | |
| Assistant Photographer 3 | $0 | $0 | $0 | $0 | $0 | $0 | $0 | $0 | $0 | $0 | $0 | $0 | |
| Assistant Photographer 4 | $0 | $0 | $0 | $0 | $0 | $0 | $0 | $0 | $0 | $0 | $0 | $0 | |
| Total People | 2 | 2 | 2 | 2 | 2 | 3 | 3 | 3 | 3 | 3 | 3 | 3 | |
| Total Payroll | $8,500 | $8,635 | $8,777 | $8,927 | $9,085 | $9,252 | $9,429 | $9,615 | $9,811 | $10,018 | $10,237 | $10,469 | |
| Pro Forma Profit and Loss | |||||||||||||
| Month 1 | Month 2 | Month 3 | Month 4 | Month 5 | Month 6 | Month 7 | Month 8 | Month 9 | Month 10 | Month 11 | Month 12 | ||
| Sales | $21,828 | $26,323 | $27,961 | $28,964 | $29,918 | $30,548 | $31,380 | $32,010 | $32,265 | $32,051 | $32,031 | $31,357 | |
| Direct Cost of Sales | $4,578 | $5,279 | $5,551 | $5,728 | $5,899 | $6,022 | $6,176 | $6,299 | $6,368 | $6,366 | $6,395 | $6,325 | |
| Other Costs of Sales | $0 | $0 | $0 | $0 | $0 | $0 | $0 | $0 | $0 | $0 | $0 | $0 | |
| Total Cost of Sales | $4,578 | $5,279 | $5,551 | $5,728 | $5,899 | $6,022 | $6,176 | $6,299 | $6,368 | $6,366 | $6,395 | $6,325 | |
| Gross Margin | $17,250 | $21,044 | $22,410 | $23,236 | $24,019 | $24,526 | $25,205 | $25,711 | $25,898 | $25,685 | $25,636 | $25,032 | |
| Gross Margin % | 79.02% | 79.95% | 80.15% | 80.22% | 80.28% | 80.29% | 80.32% | 80.32% | 80.26% | 80.14% | 80.04% | 79.83% | |
| Expenses | |||||||||||||
| Payroll | $8,500 | $8,635 | $8,777 | $8,927 | $9,085 | $9,252 | $9,429 | $9,615 | $9,811 | $10,018 | $10,237 | $10,469 | |
| Marketing/Promotion | $3,000 | $3,000 | $3,000 | $3,000 | $3,000 | $3,000 | $3,000 | $3,000 | $3,000 | $3,000 | $3,000 | $3,000 | |
| Depreciation | $500 | $500 | $500 | $500 | $500 | $500 | $500 | $500 | $500 | $500 | $500 | $500 | |
| Rent | $2,000 | $2,000 | $2,000 | $2,000 | $2,000 | $2,000 | $2,000 | $2,000 | $2,000 | $2,000 | $2,000 | $2,000 | |
| Utilities | $200 | $200 | $200 | $200 | $200 | $200 | $200 | $200 | $200 | $200 | $200 | $200 | |
| Insurance | $200 | $200 | $200 | $200 | $200 | $200 | $200 | $200 | $200 | $200 | $200 | $200 | |
| Payroll Taxes | 15% | $1,275 | $1,313 | $1,352 | $1,393 | $1,435 | $1,478 | $1,522 | $1,568 | $1,615 | $1,663 | $1,713 | $1,764 |
| Other | $1,000 | $1,000 | $1,000 | $1,000 | $1,000 | $1,000 | $1,000 | $1,000 | $1,000 | $1,000 | $1,000 | $1,000 | |
| Total Operating Expenses | $16,675 | $16,848 | $17,029 | $17,220 | $17,420 | $17,630 | $17,851 | $18,083 | $18,326 | $18,581 | $18,850 | $19,133 | |
| Profit Before Interest and Taxes | $575 | $4,196 | $5,381 | $6,016 | $6,599 | $6,896 | $7,354 | $7,628 | $7,572 | $7,104 | $6,786 | $5,899 | |
| EBITDA | $1,075 | $4,696 | $5,881 | $6,516 | $7,099 | $7,396 | $7,854 | $8,128 | $8,072 | $7,604 | $7,286 | $6,399 | |
| Interest Expense | $76 | $69 | $63 | $56 | $49 | $42 | $35 | $28 | $21 | $14 | $7 | $0 | |
| Taxes Incurred | $149 | $1,238 | $1,596 | $1,788 | $1,965 | $2,056 | $2,196 | $2,280 | $2,265 | $2,127 | $2,034 | $1,770 | |
| Net Profit | $349 | $2,889 | $3,723 | $4,172 | $4,585 | $4,798 | $5,123 | $5,320 | $5,285 | $4,963 | $4,746 | $4,129 | |
| Net Profit/Sales | 1.60% | 10.97% | 13.32% | 14.40% | 15.33% | 15.71% | 16.33% | 16.62% | 16.38% | 15.48% | 14.82% | 13.17% | |
| Pro Forma Cash Flow | |||||||||||||
| Month 1 | Month 2 | Month 3 | Month 4 | Month 5 | Month 6 | Month 7 | Month 8 | Month 9 | Month 10 | Month 11 | Month 12 | ||
| Cash Received | |||||||||||||
| Cash from Operations | |||||||||||||
| Cash Sales | $4,366 | $5,265 | $5,592 | $5,793 | $5,984 | $6,110 | $6,276 | $6,402 | $6,453 | $6,410 | $6,406 | $6,271 | |
| Cash from Receivables | $582 | $17,582 | $21,102 | $22,396 | $23,197 | $23,951 | $24,461 | $25,121 | $25,615 | $25,806 | $25,640 | $25,607 | |
| Subtotal Cash from Operations | $4,948 | $22,847 | $26,694 | $28,188 | $29,180 | $30,061 | $30,737 | $31,523 | $32,068 | $32,216 | $32,046 | $31,878 | |
| Additional Cash Received | |||||||||||||
| Sales Tax, VAT, HST/GST Received | 0.00% | $0 | $0 | $0 | $0 | $0 | $0 | $0 | $0 | $0 | $0 | $0 | $0 |
| New Current Borrowing | $0 | $0 | $0 | $0 | $0 | $0 | $0 | $0 | $0 | $0 | $0 | $0 | |
| New Other Liabilities (interest-free) | $0 | $0 | $0 | $0 | $0 | $0 | $0 | $0 | $0 | $0 | $0 | $0 | |
| New Long-term Liabilities | $0 | $0 | $0 | $0 | $0 | $0 | $0 | $0 | $0 | $0 | $0 | $0 | |
| Sales of Other Current Assets | $0 | $0 | $0 | $0 | $0 | $0 | $0 | $0 | $0 | $0 | $0 | $0 | |
| Sales of Long-term Assets | $0 | $0 | $0 | $0 | $0 | $0 | $0 | $0 | $0 | $0 | $0 | $0 | |
| New Investment Received | $0 | $0 | $0 | $0 | $0 | $0 | $0 | $0 | $0 | $0 | $0 | $0 | |
| Subtotal Cash Received | $4,948 | $22,847 | $26,694 | $28,188 | $29,180 | $30,061 | $30,737 | $31,523 | $32,068 | $32,216 | $32,046 | $31,878 | |
| Expenditures | Month 1 | Month 2 | Month 3 | Month 4 | Month 5 | Month 6 | Month 7 | Month 8 | Month 9 | Month 10 | Month 11 | Month 12 | |
| Expenditures from Operations | |||||||||||||
| Cash Spending | $8,500 | $8,635 | $8,777 | $8,927 | $9,085 | $9,252 | $9,429 | $9,615 | $9,811 | $10,018 | $10,237 | $10,469 | |
| Bill Payments | $2,916 | $12,540 | $14,321 | $14,974 | $15,378 | $15,756 | $16,009 | $16,336 | $16,578 | $16,665 | $16,569 | $16,539 | |
| Subtotal Spent on Operations | $11,416 | $21,175 | $23,098 | $23,901 | $24,463 | $25,008 | $25,438 | $25,951 | $26,389 | $26,683 | $26,806 | $27,008 | |
| Additional Cash Spent | |||||||||||||
| Sales Tax, VAT, HST/GST Paid Out | $0 | $0 | $0 | $0 | $0 | $0 | $0 | $0 | $0 | $0 | $0 | $0 | |
| Principal Repayment of Current Borrowing | $417 | $417 | $417 | $417 | $417 | $417 | $417 | $417 | $417 | $417 | $417 | $417 | |
| Other Liabilities Principal Repayment | $0 | $0 | $0 | $0 | $0 | $0 | $0 | $0 | $0 | $0 | $0 | $0 | |
| Long-term Liabilities Principal Repayment | $417 | $417 | $417 | $417 | $417 | $417 | $417 | $417 | $417 | $417 | $417 | $417 | |
| Purchase Other Current Assets | $0 | $0 | $0 | $0 | $0 | $0 | $0 | $0 | $0 | $0 | $0 | $0 | |
| Purchase Long-term Assets | $0 | $0 | $0 | $0 | $0 | $0 | $0 | $0 | $0 | $0 | $0 | $0 | |
| Dividends | $0 | $0 | $0 | $0 | $0 | $0 | $0 | $0 | $0 | $0 | $0 | $0 | |
| Subtotal Cash Spent | $12,249 | $22,008 | $23,932 | $24,735 | $25,296 | $25,842 | $26,271 | $26,784 | $27,222 | $27,517 | $27,640 | $27,841 | |
| Net Cash Flow | ($7,302) | $839 | $2,763 | $3,454 | $3,884 | $4,219 | $4,465 | $4,738 | $4,845 | $4,700 | $4,407 | $4,037 | |
| Cash Balance | $7,698 | $8,537 | $11,299 | $14,753 | $18,637 | $22,856 | $27,322 | $32,060 | $36,905 | $41,605 | $46,012 | $50,049 | |
| Pro Forma Balance Sheet | |||||||||||||
| Month 1 | Month 2 | Month 3 | Month 4 | Month 5 | Month 6 | Month 7 | Month 8 | Month 9 | Month 10 | Month 11 | Month 12 | ||
| Assets | Starting Balances | ||||||||||||
| Current Assets | |||||||||||||
| Cash | $15,000 | $7,698 | $8,537 | $11,299 | $14,753 | $18,637 | $22,856 | $27,322 | $32,060 | $36,905 | $41,605 | $46,012 | $50,049 |
| Accounts Receivable | $0 | $16,880 | $20,356 | $21,623 | $22,399 | $23,137 | $23,624 | $24,267 | $24,754 | $24,952 | $24,786 | $24,771 | $24,249 |
| Other Current Assets | $1,000 | $1,000 | $1,000 | $1,000 | $1,000 | $1,000 | $1,000 | $1,000 | $1,000 | $1,000 | $1,000 | $1,000 | $1,000 |
| Total Current Assets | $16,000 | $25,579 | $29,893 | $33,923 | $38,152 | $42,774 | $47,480 | $52,589 | $57,814 | $62,857 | $67,391 | $71,783 | $75,299 |
| Long-term Assets | |||||||||||||
| Long-term Assets | $30,000 | $30,000 | $30,000 | $30,000 | $30,000 | $30,000 | $30,000 | $30,000 | $30,000 | $30,000 | $30,000 | $30,000 | $30,000 |
| Accumulated Depreciation | $0 | $500 | $1,000 | $1,500 | $2,000 | $2,500 | $3,000 | $3,500 | $4,000 | $4,500 | $5,000 | $5,500 | $6,000 |
| Total Long-term Assets | $30,000 | $29,500 | $29,000 | $28,500 | $28,000 | $27,500 | $27,000 | $26,500 | $26,000 | $25,500 | $25,000 | $24,500 | $24,000 |
| Total Assets | $46,000 | $55,079 | $58,893 | $62,423 | $66,152 | $70,274 | $74,480 | $79,089 | $83,814 | $88,357 | $92,391 | $96,283 | $99,299 |
| Liabilities and Capital | Month 1 | Month 2 | Month 3 | Month 4 | Month 5 | Month 6 | Month 7 | Month 8 | Month 9 | Month 10 | Month 11 | Month 12 | |
| Current Liabilities | |||||||||||||
| Accounts Payable | $2,500 | $12,063 | $13,823 | $14,462 | $14,853 | $15,223 | $15,465 | $15,784 | $16,023 | $16,113 | $16,018 | $15,997 | $15,717 |
| Current Borrowing | $5,000 | $4,583 | $4,167 | $3,750 | $3,333 | $2,917 | $2,500 | $2,083 | $1,667 | $1,250 | $833 | $417 | $0 |
| Other Current Liabilities | $0 | $0 | $0 | $0 | $0 | $0 | $0 | $0 | $0 | $0 | $0 | $0 | $0 |
| Subtotal Current Liabilities | $7,500 | $16,647 | $17,989 | $18,212 | $18,186 | $18,140 | $17,965 | $17,867 | $17,689 | $17,363 | $16,851 | $16,413 | $15,717 |
| Long-term Liabilities | $5,000 | $4,583 | $4,167 | $3,750 | $3,333 | $2,917 | $2,500 | $2,083 | $1,667 | $1,250 | $833 | $417 | $0 |
| Total Liabilities | $12,500 | $21,230 | $22,156 | $21,962 | $21,519 | $21,056 | $20,465 | $19,950 | $19,356 | $18,613 | $17,684 | $16,830 | $15,717 |
| Paid-in Capital | $58,000 | $58,000 | $58,000 | $58,000 | $58,000 | $58,000 | $58,000 | $58,000 | $58,000 | $58,000 | $58,000 | $58,000 | $58,000 |
| Retained Earnings | ($24,500) | ($24,500) | ($24,500) | ($24,500) | ($24,500) | ($24,500) | ($24,500) | ($24,500) | ($24,500) | ($24,500) | ($24,500) | ($24,500) | ($24,500) |
| Earnings | $0 | $349 | $3,237 | $6,960 | $11,132 | $15,718 | $20,515 | $25,639 | $30,959 | $36,244 | $41,207 | $45,953 | $50,082 |
| Total Capital | $33,500 | $33,849 | $36,737 | $40,460 | $44,632 | $49,218 | $54,015 | $59,139 | $64,459 | $69,744 | $74,707 | $79,453 | $83,582 |
| Total Liabilities and Capital | $46,000 | $55,079 | $58,893 | $62,423 | $66,152 | $70,274 | $74,480 | $79,089 | $83,814 | $88,357 | $92,391 | $96,283 | $99,299 |
| Net Worth | $33,500 | $33,849 | $36,737 | $40,460 | $44,632 | $49,218 | $54,015 | $59,139 | $64,459 | $69,744 | $74,707 | $79,453 | $83,582 |


