
Twin Brothers Construction
Executive Summary
Twin Brothers Construction (TBC) plans to become a leading provider of construction and renovation services in the local area. The company’s overall strategy will be based on a continuing improvement process of setting objectives, measuring results, and providing feedback to facilitate further growth and progress.
TBC is a company, with principal offices located in the local area. The company’s management is highly experienced and qualified: the brothers who will lead the management team have each accumulated over twenty five years of experience in the construction industry.
Products/Services
Through their years of experience, TBC’s owners have developed sophisticated bidding, scheduling and materials solutions for some of the most complex construction projects being done today. The company will use versatile and completely adaptable methods for a variety of building configurations.
Owners, developers, construction managers, general contractors, and sub-contractors are expected to realize substantial savings in labor and material costs by using the company’s construction methods and systems. Applications include commercial and residential structures.
The Market
The housing industry has been growing at a fast pace for several years. An all-time record was set in 1998, when 886,000 new-site single family homes were sold. That represented a 10% gain from the robust total of 804,000 homes sold in 1997. Although there was a slight drop in the number from 2003, this makes for an excellent opportunity for future expansion of the industry.
Twin Brothers Construction plans to rapidly develop marketing alliances with industry leaders and pursue new sales of its services to residential and commercial builders. The marketing strategy will focus on securing city, county, and state and federal government contracts.
TBC plans to use a direct sales force, relationship selling, and sub-contractors to reach its target markets. These channels are most appropriate because of time to market, reduced capital requirements, and fast access to established distribution channels.
Financial Considerations
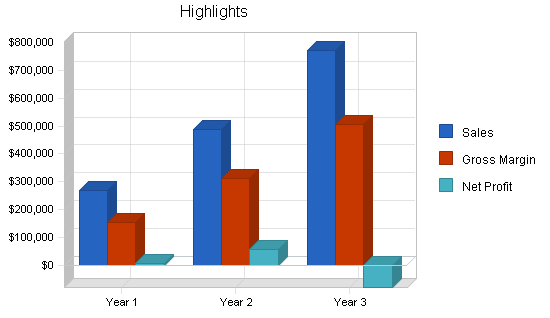
We expect to pass the break-even point in the second half of the first year. Despite initial large outlays in cash to promote sales, the company’s cash account is expected to remain healthy. The company expects approximately $772,000 in sales revenue and reasonable net profits by Year 3.
1.1 Mission
Our mission is to be the best partner for our customers, suppliers and employees. To realize our vision, we will strive for profitable growth, operational excellence, customer satisfaction and strong brand positioning.
1.2 Objectives
- To have up to three construction projects established within the first year.
- To have two building renovation projects in progress by the end of the first year.
- To locate and purchase our first rental building by the end of the first year.
- To achieve at least 7% profit by the second year.
1.3 Keys to Success
We believe our keys to success will be:
- Using the most updated materials and equipment to assure quality construction projects for ourselves and our customers.
- Educating the customers and providing valuable advice during the construction planning stages.
- Helping to confirm customer’s research about targeting markets and specific sectors.
- Overseeing the logistics associated with a project, which can include arranging local transportation, booking meetings etc.
- Assigning the actual work to an experienced and qualified third-party contractors and sub-contractors.
Company Summary
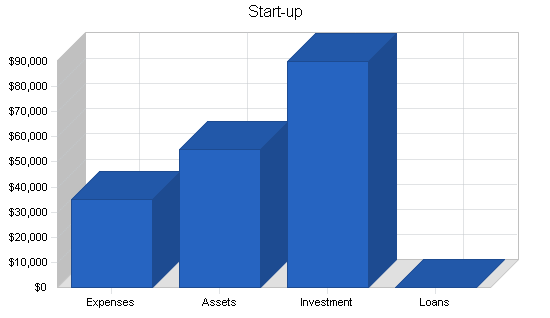
The brothers will invest a total of $90,000 combined ($55,000 and $35,000) in the start-up of the company. Initial cash requirements will total $50,000. Start-up assets total $55,000.
2.1 Start-up Summary
The following table describes our start-up requirements. One of our biggest start-up expenses involves the creation of a website. Ongoing maintenance expenses for the website are included in our Profit and Loss expenses section.
| Start-up Funding | |
| Start-up Expenses to Fund | $35,000 |
| Start-up Assets to Fund | $55,000 |
| Total Funding Required | $90,000 |
| Assets | |
| Non-cash Assets from Start-up | $25,000 |
| Cash Requirements from Start-up | $50,000 |
| Additional Cash Raised | $0 |
| Cash Balance on Starting Date | $50,000 |
| Total Assets | $75,000 |
| Liabilities and Capital | |
| Liabilities | |
| Current Borrowing | $0 |
| Long-term Liabilities | $0 |
| Accounts Payable (Outstanding Bills) | $0 |
| Other Current Liabilities (interest-free) | $0 |
| Total Liabilities | $0 |
| Capital | |
| Planned Investment | |
| Owner 1 | $55,000 |
| Owner 2 | $35,000 |
| Other | $0 |
| Additional Investment Requirement | $0 |
| Total Planned Investment | $90,000 |
| Loss at Start-up (Start-up Expenses) | ($35,000) |
| Total Capital | $55,000 |
| Total Capital and Liabilities | $55,000 |
| Total Funding | $90,000 |
| Start-up | |
| Requirements | |
| Start-up Expenses | |
| Legal | $2,000 |
| Stationery etc. | $100 |
| Brochures | $500 |
| Consultants | $2,000 |
| Insurance | $10,000 |
| Rent (Deposit and 1st Month) | $3,000 |
| Work Equipment | $6,000 |
| Website Development | $10,000 |
| Other | $1,400 |
| Total Start-up Expenses | $35,000 |
| Start-up Assets | |
| Cash Required | $50,000 |
| Other Current Assets | $5,000 |
| Long-term Assets | $0 |
| Total Assets | $55,000 |
| Total Requirements | $90,000 |
2.2 Company Ownership
The company ownership will be shared by the Chairman and Chief Executive Officer in the following percentage amounts:
Chairman = 60%
Chief Executive Officer = 40%
Both owners are veterans in the building industry, each with over 25 years experience.
Products and Services
TBC will sell its services to clients in the area of commercial construction and renovation. The company’s staff will design specialized construction drawings that outline the schedule, work sequence and the materials needed for building and renovation construction projects. Owners, developers and general contractors will realize substantial savings in labor and material costs by using TBC’s customized performance methods. TBC’s methods will offer complete adaptability at cost-effective prices. The drawings that the company will furnish to the contractor will specify the order of assembly and erection, including the location of the strongbacks and joists, the location and actual loading of the ties, location of accessories and advise clients of the maximum allowable rate of concrete placement.
A longer-term service will be commercial building rental management. This will include the purchase of commercial building sites or existing buildings that need renovation, coordinating the construction/renovation, then managing the rental of the property. The company will also be looking for existing property owners whose properties need renovation to update and increase its income potential, with TBC eventually taking over the management of these properties on behalf of the owner.
To enter the market with minimum overhead costs, TBC plans to utilize in the first year of operation mainly sub-contractors and independent experts for its building and renovation projects.
Accident prevention will be the cornerstone of TBC’s safety commitment. The company will strive to eliminate foreseeable hazards which could result in personal injury or illness; at TBC, health and safety will not be compromised.
Market Analysis Summary
There were about 792,000 construction companies in the United States in 2002: 237,000 were building construction contractors; 60,000 were heavy and civil engineering construction or highway contractors; and 496,000 were specialty trade contractors. Most of these establishments tend to be small, the majority employing fewer than 10 workers. About 4 out of 5 workers are employed by small contractors.
Construction offers more opportunities than most other industries for individuals who want to own and run their own business. The 1.6 million self-employed and unpaid family workers in 2002 performed work directly for property owners or acted as contractors on small jobs, such as additions, remodeling, and maintenance projects. The rate of self-employment varies greatly by individual occupation in the construction trades.
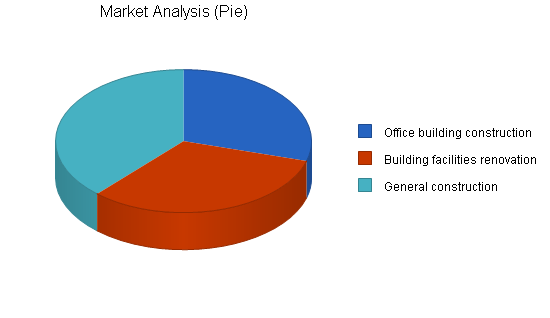
The local area is booming at this time, with many development projects running both by public and by private sources. Overall business growth over the past seven years has averaged approximately 9.5% and is expected to continue for at least the next several years. This constitutes an attractive market for TBC. The company will be concentrating on office building construction. This is the fastest growing segment of all the commercial clients requiring our services. The other categories to serve will include building renovation along with a segment it calls the general category, to serve other potential commercial clients.

One longer-term field of operation for the company will be the selling of building material and components to contractors. By slowly establishing itself as a first-rate material provider, the company expects to broaden and strengthen its stance in the local building industry. Initially it will focus on purchasing supplies for its own construction and renovation projects, then use those completed projects as marketing examples to showcase the quality of materials used and the customized approach used to design and construct them.
The company plans to develop marketing alliances with industry leaders and pursue new sales of its services to commercial builders. The market strategy is to capitalize on the company’s future alliances by securing city, county, and state government contracts.
TBC also plans to use a direct sales force, relationship selling, and sub-contractors to reach its markets. These channels are most appropriate because of time to market, reduced capital requirements, and fast access to established distribution channels.
4.1 Market Segmentation
The overall Construction Industry was segmented in 2002 as follows (employment in thousands):
|
Industry |
Employment |
Percent |
|
Total, all industries |
6,731.7 |
100.0 |
|
Construction of Buildings |
1,583.8 |
23.5 |
|
Residential building |
807.4 |
12.0 |
|
Nonresidential building construction |
776.4 |
11.5 |
|
Special trade contractors |
4,217.9 |
62.7 |
|
Building equipment contractors |
1,842.5 |
27.4 |
|
Foundation, structure, & building exterior contractors |
915.4 |
13.6 |
|
Building finishing contractors |
879.5 |
13.1 |
|
Other specialty trade contractors |
580.5 |
8.6 |
|
Highway, street, and bridge construction |
344.4 |
5.1 |
|
Land subdivision |
86.1 |
1.3 |
|
Other heavy and civil engineering construction |
119.0 |
1.8 |
|
Special trade contractors |
4,217.9 |
62.7 |
|
Building equipment contractors |
1,842.5 |
27.4 |
|
Foundation, structure, & building exterior contractors |
915.4 |
13.6 |
|
Building finishing contractors |
879.5 |
13.1 |
|
Other specialty trade contractors |
580.5 |
8.6 |
Source: U.S. Department of Labor, Bureau of Labor Statistics (March 9, 2004)
For the purpose of this paper we shall segment our initial targeted market as follows:
- Office Building Construction
- Building Facilities Renovation
- General Construction
| Market Analysis | |||||||
| Year 1 | Year 2 | Year 3 | Year 4 | Year 5 | |||
| Potential Customers | Growth | CAGR | |||||
| Office building construction | 6% | 2,517 | 4,027 | 4,268 | 4,524 | 4,795 | 17.48% |
| Building facilities renovation | 3% | 2,750 | 2,833 | 2,917 | 3,005 | 3,095 | 3.00% |
| General construction | 3% | 3,264 | 3,362 | 3,462 | 3,567 | 3,674 | 3.00% |
| Total | 7.90% | 8,531 | 10,222 | 10,647 | 11,096 | 11,564 | 7.90% |
4.2 Service Business Analysis
The construction industry is divided into three major segments. Construction of buildings contractors, or general contractors, who build residential, industrial, commercial, and other buildings. Heavy and civil engineering construction contractors who build sewers, roads, highways, bridges, tunnels, and other projects. Specialty trade contractors who are engaged in specialized activities such as carpentry, painting, plumbing, and electrical work.
Construction usually is done or coordinated by general contractors, who specialize in one type of construction, such as residential or commercial building. They take full responsibility for the complete job, except for specified portions of the work that may be omitted from the general contract. Although general contractors may do a portion of the work with their own crews, they often sub-contract most of the work to heavy construction or specialty trade contractors.
Specialty trade contractors usually do the work of only one trade, such as painting, carpentry, or electrical work, or of two or more closely-related trades, such as plumbing and heating. Beyond fitting their work to that of the other trades, specialty trade contractors have no responsibility for the structure as a whole. They obtain orders for their work from general contractors, architects, or property owners. Repair work is almost always done on direct order from owners, occupants, architects, or rental agents.
Twin Brothers Construction will concentrate its activity in the following areas:
- Commercial Building Construction
- Commercial Building Renovation
- Buildings Management and Rental
- Building Materials Supplies
Strategy and Implementation Summary
TBC plans to use a direct sales force, relationship selling, and sub-contractors to reach its target markets. These channels are most appropriate because of time to market, reduced capital requirements, and fast access to established distribution channels. The owners of TBC want to emphasize to their potential customers that they are more than general contractors, they are complete construction coordinators.
TBC plans to advertise in magazines, newspapers, and radio. Initially a website with information on the company owners, their construction background, and contact information will be available online. References to the website will be mentioned in all other forms of advertising. Channels used to reach market segments include: sales associates, the Internet and direct mail.
In addition, The table and chart below outline the company’s sales forecast for FY2005-2007. In our sales forecasts, the cost of sales includes only direct labor costs.
5.1 Competitive Edge
The company plans to become a leading provider of construction services in the local area. To achieve this, TBC will invest in many ways that will pay off in competitive advantages for its customers, for example:
- Pre-job conferencing upon request
- Assist in technical or conceptual design
- Assist in supervision when other contractors are employed
- Organize project supervision facilities and staff
- Organize delivery of purchased materials
- Furnishing after-market products
5.2 Marketing Strategy
Our marketing strategy is the key to our success:
- Emphasize our name and unique services through advertising, including a Web page of contact information. An amount of $10,000 for the design of the website has been included in the Start-up expenses with ongoing maintenance costs estimated monthly.
- Focus on commercial building and renovation projects as our initial and primary target markets.
- Use completed projects to showcase our customized construction project management to prospective clients.
5.3 Sales Strategy
Sales success requires planning. The company will formulate its sales strategy and tactics to achieve sales success by following these steps:
Step 1 – Analyzing The Company’s Potential: Step through a structured process to help us develop a sales strategy.
Step 2 – Strategize Around Strengths: The description of sales activity will be analyzed to produce a report on factors impacting sales potential and ways to strengthen this potential.
Step 3 – Develop Tactics: Receive guidance to develop a comprehensive tactical plan to achieve success.
Step 4 – Measure Our Past Success: Develop key measurements that mark the progress of financial estimates that guide our growth.
Final Step – Employ An Action Plan for Success: Provide sales force with a tactical plan that is aligned with management’s strategic objectives.
5.3.1 Sales Forecast
The company will start its operation in the first year by focusing on two areas:
- Direct construction work
- Renovation of existing buildings
Starting later in the second year and continuing into the third year the following areas of operation will be added:
- Renting of Industrial Spaces
- Sale of components and other building materials and components
The following table details the forecasts.


| Sales Forecast | |||
| Year 1 | Year 2 | Year 3 | |
| Sales | |||
| Direct Construction Projects | $135,000 | $175,000 | $218,750 |
| Building Renovations | $123,000 | $153,750 | $192,188 |
| Building Rentals | $0 | $75,000 | $200,000 |
| Sale of Components and Goods | $0 | $75,000 | $150,000 |
| Other | $9,000 | $10,000 | $12,000 |
| Total Sales | $267,000 | $488,750 | $772,938 |
| Direct Cost of Sales | Year 1 | Year 2 | Year 3 |
| All construction work | $54,000 | $70,000 | $87,500 |
| Renovations | $49,200 | $61,500 | $76,875 |
| Rentals | $0 | $15,000 | $40,000 |
| Sale of Components and Goods | $0 | $30,000 | $60,000 |
| Other | $9,000 | $1,000 | $1,200 |
| Subtotal Direct Cost of Sales | $112,200 | $177,500 | $265,575 |
5.4 Milestones
The milestones table describes the steps required for the beginning of operations. Steps might take longer than estimated, however the owners and the staff will do their utmost to adhere to this timetable.

| Milestones | |||||
| Milestone | Start Date | End Date | Budget | Manager | Department |
| Establishing Permits | 1/1/2005 | 1/15/2005 | $500 | Chairman | Department |
| Establishing office | 1/15/2005 | 1/20/2005 | $500 | CEO | Department |
| Preparing Web Site | 1/15/2005 | 2/15/2005 | $1,000 | Consultant | Department |
| Purchasing work equipment | 1/15/2005 | 2/25/2005 | $6,000 | CEO | Department |
| Hiring staff | 2/1/2005 | 3/1/2005 | $0 | Chairman@CEO | Department |
| Purcase Initial Inventory | 2/15/2005 | 3/25/2005 | $20,000 | Chairman&CEO | Department |
| Receive Stock | 3/1/2005 | 4/1/2005 | $500 | Staff | Department |
| Start Operation | 4/1/2005 | 4/30/2005 | $0 | Everybody | Department |
| Totals | $28,500 | ||||
Web Plan Summary
Although TBC plans to use traditional advertising methods to reach potential customers, the owners feel that the Internet has become a valuable resource for customers to find out about the company and for the company to promote its services to prospective customers. The construction industry was slower to join the Internet bandwagon compared to other types of businesses. But now, many local contractors and building suppliers have websites.
The cost to create a website has been included in start-up costs, with website maintenance costs included in our ongoing expenses. The initial website will have basic contact information and background about the company owners. Later, it will show information about current projects as well as completed projects as examples of what the company can do. Once the building materials portion of the business is well established, the website will expand to include an online store. At this point in the business plan, there are no estimates for the cost of this expansion and it will need to be researched and planned for more thoroughly at a later point.
It will take time before the initial cost outlay for the website will pay for itself in potential customers, but once established, it will provide a cost-effective way to communicate to new and existing customers.
We will mention our website address as part of our other advertising media.
6.1 Website Marketing Strategy
We hope to be able to secure links to our website from the local city and chamber of commerce websites as well as local construction-related websites that we can affiliate with.
6.2 Development Requirements
We will contract with a Website developer to initially design the look and information provided on the website. Our initial cost for this design also includes the first six months of website maintenance by the website developer. In October, we plan to hire a technician with experience in website maintenance to troubleshoot and maintain the Website internally.
Once the business has progressed, we will either increase this person’s hours from temporary to a full-time position, or we will hire a second temporary technical position to assist in the re-design and expansion of the website. Our long-term goal is to have an online store for the sale of building materials and components.
Management Summary
The company’s management philosophy will be based on responsibility and mutual respect. Twin Brothers Construction will maintain an environment and structure that will encourage productivity and respect for customers and fellow employees.
TBC will be responsible to its employees and sub-contractors, the men and women who will work with the company throughout the state. At TBC everyone will be considered as an individual and the company will respect their dignity and recognize their merit. Employees will be encouraged to have a sense of security and pride in their jobs. Additionally, employees will be free to make suggestions and complaints. The company will afford equal opportunity for employment, development, and advancement for those qualified.
TBC employees will be committed to:
- Providing a safe work environment to protect employees, the employees of customers and sub-contractors, and the public.
- Supplying safe products for customers.
- Continuously improving the company’s safety program to reduce the risk of accidents and occupational illness in a changing work environment.
- Encouraging employees to participate in accident prevention programs and take personal responsibility for their own and their co-workers’ health and safety.
- Regulatory compliance and contribution to high safety standards for our industry.
- Monitoring workplaces, enforcing safe work practices, and communicating the company’s safety performance to employees and other stakeholders.
- Making safety a value-added service that the company provides to its customers.
The company is planning to expand its personnel to add more job superintendents as soon as the number of projects increases. These superintendents will have the following duties:
Direct supervision of all work at the job sites:
- Quality Control
- Scheduling sub-contractors and material deliveries
- Verifying and insuring that all work is done in accordance with plans
- Insuring that all work is performed in accordance with all OSHA guidelines
7.1 Personnel Plan
The personnel plan is based on the two owners to guide and oversee the operations that will be managed by themselves. Having been in business for over 25 years, they have agreed to draw very low salaries for the first two years to offset some of the initial expenses in starting the business.
For the first year, the company will hire temporary and part-time employees and sub-contract with consultants and construction professionals to perform the variety of tasks needed. Also, our contracted construction personnel expenses are reflected in our Sales Forecast as cost of sales, not part of our personnel table, since they will not be regular employees of the business.
| Personnel Plan | |||
| Year 1 | Year 2 | Year 3 | |
| Chairman (Principal Owner) | $18,000 | $25,000 | $60,000 |
| CEO (Secondary Owner) | $18,000 | $25,000 | $60,000 |
| Office Clerk (Temporary Hire) | $17,250 | $32,000 | $32,000 |
| Foreman (Temporary Hire) | $21,600 | $42,000 | $42,000 |
| Technical Employee (Part-time) | $9,000 | $25,000 | $25,000 |
| Total People | 5 | 7 | 8 |
| Total Payroll | $83,850 | $149,000 | $219,000 |
7.2 Safety
TBC will be committed to conducting business in a manner that protects the health and safety of all employees, customers, and persons living in the community where it operates. To accomplish this, the company will ensure that it complies with current Health Administration and Occupational Health and Safety laws and will maintain its operations, procedures, technologies, and policies accordingly.
Each employee will have the responsibility to fully comply with established safety rules and to perform work in such a manner as to prevent injuries to themselves and others. TBC will be very concerned about job-site safety and plans to set up a comprehensive safety program.
Financial Plan
The brothers have long-term experience in the local construction industry. They are willing to invest heavily in this new company and their accumulated experience will insure success for the new venture. It will be important to watch closely the salaries and regular expenses to assure that the company will not suffer from lack of sufficient cash to fund its operations.
- We assume a conservative entrance and steady growth in the market.
- We assume a slow financial progress based on initially conservative sales against highest expenses.
- We assume there will not be an economic crash that would greatly hinder our target market’s access to their personal luxury finds.
The following sections describe the financials for TBC:
8.1 Projected Profit and Loss
Twin Brothers Construction is in the early stage of development, thus initial projections have only been made based on the sales projections and efficient cost control measures in place. Our first year monthly net profits will become positive by October, but we will still close the year with negative profit. This is primarily because of personnel expenses, which include salaries and the cost of sales for sub-contractors.


| Pro Forma Profit and Loss | |||
| Year 1 | Year 2 | Year 3 | |
| Sales | $267,000 | $488,750 | $772,938 |
| Direct Cost of Sales | $112,200 | $177,500 | $265,575 |
| Other | $0 | $0 | $0 |
| Total Cost of Sales | $112,200 | $177,500 | $265,575 |
| Gross Margin | $154,800 | $311,250 | $507,363 |
| Gross Margin % | 57.98% | 63.68% | 65.64% |
| Expenses | |||
| Payroll | $83,850 | $149,000 | $219,000 |
| Sales and Marketing and Other Expenses | $7,500 | $10,000 | $0 |
| Depreciation | $0 | $0 | $0 |
| Gasoline and oil | $3,600 | $3,750 | $4,800 |
| Telephone | $1,500 | $2,400 | $3,500 |
| Utilities | $4,800 | $11,250 | $10,282 |
| Insurance | $9,000 | $8,226 | $24,000 |
| Rent | $7,478 | $20,000 | $25,000 |
| Payroll Taxes | $6,522 | $0 | $0 |
| Website Maintenance & Support | $4,200 | $6,000 | $9,375 |
| Consultants | $6,000 | $7,500 | $9,000 |
| Advertising | $6,000 | $1,980 | $3,500 |
| Misc. Other Expenses | $1,800 | $2,500 | $267,127 |
| Total Operating Expenses | $142,250 | $222,606 | $575,584 |
| Profit Before Interest and Taxes | $12,550 | $88,644 | ($68,222) |
| EBITDA | $12,550 | $88,644 | ($68,222) |
| Interest Expense | $625 | $7,500 | $11,250 |
| Taxes Incurred | $3,578 | $24,343 | $0 |
| Net Profit | $8,348 | $56,801 | ($79,472) |
| Net Profit/Sales | 3.13% | 11.62% | -10.28% |
8.2 Break-even Analysis
During the first year of operations, the break-even monthly sales volume is estimated as shown below. Our average percent variable reflects our cost of sales which covers contracted construction payroll costs.

| Break-even Analysis | |
| Monthly Revenue Break-even | $20,446 |
| Assumptions: | |
| Average Percent Variable Cost | 42% |
| Estimated Monthly Fixed Cost | $11,854 |
8.3 Projected Cash Flow
We have set our initial Cash at $50,000 so that we have flexibility in handling any unexpected changes in cash flow in the early months to cover expenses. The following table outlines are cash flow estimates.

| Pro Forma Cash Flow | |||
| Year 1 | Year 2 | Year 3 | |
| Cash Received | |||
| Cash from Operations | |||
| Cash Sales | $267,000 | $488,750 | $772,938 |
| Subtotal Cash from Operations | $267,000 | $488,750 | $772,938 |
| Additional Cash Received | |||
| Sales Tax, VAT, HST/GST Received | $0 | $0 | $0 |
| New Current Borrowing | $0 | $0 | $0 |
| New Other Liabilities (interest-free) | $0 | $0 | $0 |
| New Long-term Liabilities | $75,000 | $0 | $75,000 |
| Sales of Other Current Assets | $0 | $0 | $0 |
| Sales of Long-term Assets | $0 | $0 | $0 |
| New Investment Received | $0 | $0 | $0 |
| Subtotal Cash Received | $342,000 | $488,750 | $847,938 |
| Expenditures | Year 1 | Year 2 | Year 3 |
| Expenditures from Operations | |||
| Cash Spending | $83,850 | $149,000 | $219,000 |
| Bill Payments | $152,974 | $281,521 | $604,604 |
| Subtotal Spent on Operations | $236,824 | $430,521 | $823,604 |
| Additional Cash Spent | |||
| Sales Tax, VAT, HST/GST Paid Out | $0 | $0 | $0 |
| Principal Repayment of Current Borrowing | $0 | $0 | $0 |
| Other Liabilities Principal Repayment | $0 | $0 | $0 |
| Long-term Liabilities Principal Repayment | $0 | $0 | $0 |
| Purchase Other Current Assets | $0 | $0 | $0 |
| Purchase Long-term Assets | $100,000 | $0 | $100,000 |
| Dividends | $0 | $0 | $0 |
| Subtotal Cash Spent | $336,824 | $430,521 | $923,604 |
| Net Cash Flow | $5,176 | $58,229 | ($75,667) |
| Cash Balance | $55,176 | $113,405 | $37,738 |
8.4 Projected Balance Sheet
The following table outlines our Balance Sheet.
| Pro Forma Balance Sheet | |||
| Year 1 | Year 2 | Year 3 | |
| Assets | |||
| Current Assets | |||
| Cash | $55,176 | $113,405 | $37,738 |
| Other Current Assets | $5,000 | $5,000 | $5,000 |
| Total Current Assets | $60,176 | $118,405 | $42,738 |
| Long-term Assets | |||
| Long-term Assets | $100,000 | $100,000 | $200,000 |
| Accumulated Depreciation | $0 | $0 | $0 |
| Total Long-term Assets | $100,000 | $100,000 | $200,000 |
| Total Assets | $160,176 | $218,405 | $242,738 |
| Liabilities and Capital | Year 1 | Year 2 | Year 3 |
| Current Liabilities | |||
| Accounts Payable | $21,828 | $23,256 | $52,061 |
| Current Borrowing | $0 | $0 | $0 |
| Other Current Liabilities | $0 | $0 | $0 |
| Subtotal Current Liabilities | $21,828 | $23,256 | $52,061 |
| Long-term Liabilities | $75,000 | $75,000 | $150,000 |
| Total Liabilities | $96,828 | $98,256 | $202,061 |
| Paid-in Capital | $90,000 | $90,000 | $90,000 |
| Retained Earnings | ($35,000) | ($26,652) | $30,149 |
| Earnings | $8,348 | $56,801 | ($79,472) |
| Total Capital | $63,348 | $120,149 | $40,677 |
| Total Liabilities and Capital | $160,176 | $218,405 | $242,738 |
| Net Worth | $63,348 | $120,149 | $40,677 |
8.5 Business Ratios
The following Ratios table includes industry profile comparison ratios for Commercial and Office Building Contractors (Standard Industry Code #1542).
| Ratio Analysis | ||||
| Year 1 | Year 2 | Year 3 | Industry Profile | |
| Sales Growth | 0.00% | 83.05% | 58.15% | -3.57% |
| Percent of Total Assets | ||||
| Other Current Assets | 3.12% | 2.29% | 2.06% | 39.87% |
| Total Current Assets | 37.57% | 54.21% | 17.61% | 91.45% |
| Long-term Assets | 62.43% | 45.79% | 82.39% | 8.55% |
| Total Assets | 100.00% | 100.00% | 100.00% | 100.00% |
| Current Liabilities | 13.63% | 10.65% | 21.45% | 34.87% |
| Long-term Liabilities | 46.82% | 34.34% | 61.79% | 15.42% |
| Total Liabilities | 60.45% | 44.99% | 83.24% | 50.29% |
| Net Worth | 39.55% | 55.01% | 16.76% | 49.71% |
| Percent of Sales | ||||
| Sales | 100.00% | 100.00% | 100.00% | 100.00% |
| Gross Margin | 57.98% | 63.68% | 65.64% | 17.83% |
| Selling, General & Administrative Expenses | 50.39% | 31.80% | 27.73% | 7.07% |
| Advertising Expenses | 4.95% | 6.32% | 5.54% | 0.25% |
| Profit Before Interest and Taxes | 4.70% | 18.14% | -8.83% | 1.85% |
| Main Ratios | ||||
| Current | 2.76 | 5.09 | 0.82 | 2.34 |
| Quick | 2.76 | 5.09 | 0.82 | 1.12 |
| Total Debt to Total Assets | 60.45% | 44.99% | 83.24% | 57.63% |
| Pre-tax Return on Net Worth | 18.83% | 67.54% | -195.37% | 4.01% |
| Pre-tax Return on Assets | 7.45% | 37.15% | -32.74% | 9.46% |
| Additional Ratios | Year 1 | Year 2 | Year 3 | |
| Net Profit Margin | 3.13% | 11.62% | -10.28% | n.a |
| Return on Equity | 13.18% | 47.28% | -195.37% | n.a |
| Activity Ratios | ||||
| Accounts Payable Turnover | 8.01 | 12.17 | 12.17 | n.a |
| Payment Days | 27 | 29 | 22 | n.a |
| Total Asset Turnover | 1.67 | 2.24 | 3.18 | n.a |
| Debt Ratios | ||||
| Debt to Net Worth | 1.53 | 0.82 | 4.97 | n.a |
| Current Liab. to Liab. | 0.23 | 0.24 | 0.26 | n.a |
| Liquidity Ratios | ||||
| Net Working Capital | $38,348 | $95,149 | ($9,323) | n.a |
| Interest Coverage | 20.08 | 11.82 | -6.06 | n.a |
| Additional Ratios | ||||
| Assets to Sales | 0.60 | 0.45 | 0.31 | n.a |
| Current Debt/Total Assets | 14% | 11% | 21% | n.a |
| Acid Test | 2.76 | 5.09 | 0.82 | n.a |
| Sales/Net Worth | 4.21 | 4.07 | 19.00 | n.a |
| Dividend Payout | 0.00 | 0.00 | 0.00 | n.a |
Appendix
| Sales Forecast | |||||||||||||
| Month 1 | Month 2 | Month 3 | Month 4 | Month 5 | Month 6 | Month 7 | Month 8 | Month 9 | Month 10 | Month 11 | Month 12 | ||
| Sales | |||||||||||||
| Direct Construction Projects | 0% | $0 | $0 | $0 | $10,000 | $10,000 | $10,000 | $15,000 | $15,000 | $15,000 | $20,000 | $20,000 | $20,000 |
| Building Renovations | 0% | $7,500 | $7,500 | $8,000 | $8,000 | $9,000 | $9,000 | $10,000 | $10,000 | $12,000 | $12,000 | $15,000 | $15,000 |
| Building Rentals | 0% | $0 | $0 | $0 | $0 | $0 | $0 | $0 | $0 | $0 | $0 | $0 | $0 |
| Sale of Components and Goods | 0% | $0 | $0 | $0 | $0 | $0 | $0 | $0 | $0 | $0 | $0 | $0 | $0 |
| Other | 0% | $0 | $0 | $0 | $1,000 | $1,000 | $1,000 | $1,000 | $1,000 | $1,000 | $1,000 | $1,000 | $1,000 |
| Total Sales | $7,500 | $7,500 | $8,000 | $19,000 | $20,000 | $20,000 | $26,000 | $26,000 | $28,000 | $33,000 | $36,000 | $36,000 | |
| Direct Cost of Sales | Month 1 | Month 2 | Month 3 | Month 4 | Month 5 | Month 6 | Month 7 | Month 8 | Month 9 | Month 10 | Month 11 | Month 12 | |
| All construction work | 40% | $0 | $0 | $0 | $4,000 | $4,000 | $4,000 | $6,000 | $6,000 | $6,000 | $8,000 | $8,000 | $8,000 |
| Renovations | 40% | $3,000 | $3,000 | $3,200 | $3,200 | $3,600 | $3,600 | $4,000 | $4,000 | $4,800 | $4,800 | $6,000 | $6,000 |
| Rentals | 20% | $0 | $0 | $0 | $0 | $0 | $0 | $0 | $0 | $0 | $0 | $0 | $0 |
| Sale of Components and Goods | 20% | $0 | $0 | $0 | $0 | $0 | $0 | $0 | $0 | $0 | $0 | $0 | $0 |
| Other | 10% | $0 | $0 | $0 | $1,000 | $1,000 | $1,000 | $1,000 | $1,000 | $1,000 | $1,000 | $1,000 | $1,000 |
| Subtotal Direct Cost of Sales | $3,000 | $3,000 | $3,200 | $8,200 | $8,600 | $8,600 | $11,000 | $11,000 | $11,800 | $13,800 | $15,000 | $15,000 | |
| Personnel Plan | |||||||||||||
| Month 1 | Month 2 | Month 3 | Month 4 | Month 5 | Month 6 | Month 7 | Month 8 | Month 9 | Month 10 | Month 11 | Month 12 | ||
| Chairman (Principal Owner) | 0% | $1,500 | $1,500 | $1,500 | $1,500 | $1,500 | $1,500 | $1,500 | $1,500 | $1,500 | $1,500 | $1,500 | $1,500 |
| CEO (Secondary Owner) | 0% | $1,500 | $1,500 | $1,500 | $1,500 | $1,500 | $1,500 | $1,500 | $1,500 | $1,500 | $1,500 | $1,500 | $1,500 |
| Office Clerk (Temporary Hire) | 0% | $1,250 | $1,250 | $1,250 | $1,250 | $1,250 | $1,250 | $1,500 | $1,500 | $1,500 | $1,750 | $1,750 | $1,750 |
| Foreman (Temporary Hire) | 0% | $0 | $0 | $0 | $2,400 | $2,400 | $2,400 | $2,400 | $2,400 | $2,400 | $2,400 | $2,400 | $2,400 |
| Technical Employee (Part-time) | 0% | $0 | $0 | $0 | $0 | $0 | $0 | $1,500 | $1,500 | $1,500 | $1,500 | $1,500 | $1,500 |
| Total People | 3 | 3 | 3 | 4 | 4 | 4 | 5 | 5 | 5 | 5 | 5 | 5 | |
| Total Payroll | $4,250 | $4,250 | $4,250 | $6,650 | $6,650 | $6,650 | $8,400 | $8,400 | $8,400 | $8,650 | $8,650 | $8,650 | |
| General Assumptions | |||||||||||||
| Month 1 | Month 2 | Month 3 | Month 4 | Month 5 | Month 6 | Month 7 | Month 8 | Month 9 | Month 10 | Month 11 | Month 12 | ||
| Plan Month | 1 | 2 | 3 | 4 | 5 | 6 | 7 | 8 | 9 | 10 | 11 | 12 | |
| Current Interest Rate | 10.00% | 10.00% | 10.00% | 10.00% | 10.00% | 10.00% | 10.00% | 10.00% | 10.00% | 10.00% | 10.00% | 10.00% | |
| Long-term Interest Rate | 10.00% | 10.00% | 10.00% | 10.00% | 10.00% | 10.00% | 10.00% | 10.00% | 10.00% | 10.00% | 10.00% | 10.00% | |
| Tax Rate | 30.00% | 30.00% | 30.00% | 30.00% | 30.00% | 30.00% | 30.00% | 30.00% | 30.00% | 30.00% | 30.00% | 30.00% | |
| Sales on Credit | 0 | 0 | 0 | 0 | 0 | 0 | 0 | 0 | 0 | 0 | 0 | 0 | |
| Other | 0 | 0 | 0 | 0 | 0 | 0 | 0 | 0 | 0 | 0 | 0 | 0 | |
| Pro Forma Profit and Loss | |||||||||||||
| Month 1 | Month 2 | Month 3 | Month 4 | Month 5 | Month 6 | Month 7 | Month 8 | Month 9 | Month 10 | Month 11 | Month 12 | ||
| Sales | $7,500 | $7,500 | $8,000 | $19,000 | $20,000 | $20,000 | $26,000 | $26,000 | $28,000 | $33,000 | $36,000 | $36,000 | |
| Direct Cost of Sales | $3,000 | $3,000 | $3,200 | $8,200 | $8,600 | $8,600 | $11,000 | $11,000 | $11,800 | $13,800 | $15,000 | $15,000 | |
| Other | $0 | $0 | $0 | $0 | $0 | $0 | $0 | $0 | $0 | $0 | $0 | $0 | |
| Total Cost of Sales | $3,000 | $3,000 | $3,200 | $8,200 | $8,600 | $8,600 | $11,000 | $11,000 | $11,800 | $13,800 | $15,000 | $15,000 | |
| Gross Margin | $4,500 | $4,500 | $4,800 | $10,800 | $11,400 | $11,400 | $15,000 | $15,000 | $16,200 | $19,200 | $21,000 | $21,000 | |
| Gross Margin % | 60.00% | 60.00% | 60.00% | 56.84% | 57.00% | 57.00% | 57.69% | 57.69% | 57.86% | 58.18% | 58.33% | 58.33% | |
| Expenses | |||||||||||||
| Payroll | $4,250 | $4,250 | $4,250 | $6,650 | $6,650 | $6,650 | $8,400 | $8,400 | $8,400 | $8,650 | $8,650 | $8,650 | |
| Sales and Marketing and Other Expenses | $500 | $500 | $500 | $500 | $500 | $500 | $750 | $750 | $750 | $750 | $750 | $750 | |
| Depreciation | $0 | $0 | $0 | $0 | $0 | $0 | $0 | $0 | $0 | $0 | $0 | $0 | |
| Gasoline and oil | $300 | $300 | $300 | $300 | $300 | $300 | $300 | $300 | $300 | $300 | $300 | $300 | |
| Telephone | $125 | $125 | $125 | $125 | $125 | $125 | $125 | $125 | $125 | $125 | $125 | $125 | |
| Utilities | $400 | $400 | $400 | $400 | $400 | $400 | $400 | $400 | $400 | $400 | $400 | $400 | |
| Insurance | $750 | $750 | $750 | $750 | $750 | $750 | $750 | $750 | $750 | $750 | $750 | $750 | |
| Rent | $1,500 | $543 | $543 | $543 | $543 | $543 | $543 | $543 | $543 | $543 | $543 | $543 | |
| Payroll Taxes | 15% | $543 | $543 | $543 | $543 | $543 | $543 | $543 | $543 | $543 | $543 | $543 | $544 |
| Website Maintenance & Support | $350 | $350 | $350 | $350 | $350 | $350 | $350 | $350 | $350 | $350 | $350 | $350 | |
| Consultants | $500 | $500 | $500 | $500 | $500 | $500 | $500 | $500 | $500 | $500 | $500 | $500 | |
| Advertising | 15% | $500 | $500 | $500 | $500 | $500 | $500 | $500 | $500 | $500 | $500 | $500 | $500 |
| Misc. Other Expenses | $150 | $150 | $150 | $150 | $150 | $150 | $150 | $150 | $150 | $150 | $150 | $150 | |
| Total Operating Expenses | $9,868 | $8,912 | $8,912 | $11,312 | $11,312 | $11,312 | $13,312 | $13,312 | $13,312 | $13,562 | $13,562 | $13,562 | |
| Profit Before Interest and Taxes | ($5,368) | ($4,412) | ($4,112) | ($512) | $88 | $88 | $1,688 | $1,688 | $2,888 | $5,638 | $7,438 | $7,438 | |
| EBITDA | ($5,368) | ($4,412) | ($4,112) | ($512) | $88 | $88 | $1,688 | $1,688 | $2,888 | $5,638 | $7,438 | $7,438 | |
| Interest Expense | $0 | $0 | $0 | $0 | $0 | $0 | $0 | $0 | $0 | $0 | $0 | $625 | |
| Taxes Incurred | ($1,611) | ($1,324) | ($1,234) | ($154) | $26 | $26 | $506 | $506 | $866 | $1,691 | $2,231 | $2,044 | |
| Net Profit | ($3,758) | ($3,088) | ($2,878) | ($358) | $62 | $62 | $1,182 | $1,182 | $2,022 | $3,947 | $5,207 | $4,769 | |
| Net Profit/Sales | -50.11% | -41.18% | -35.98% | -1.89% | 0.31% | 0.31% | 4.54% | 4.54% | 7.22% | 11.96% | 14.46% | 13.25% | |
| Pro Forma Cash Flow | |||||||||||||
| Month 1 | Month 2 | Month 3 | Month 4 | Month 5 | Month 6 | Month 7 | Month 8 | Month 9 | Month 10 | Month 11 | Month 12 | ||
| Cash Received | |||||||||||||
| Cash from Operations | |||||||||||||
| Cash Sales | $7,500 | $7,500 | $8,000 | $19,000 | $20,000 | $20,000 | $26,000 | $26,000 | $28,000 | $33,000 | $36,000 | $36,000 | |
| Subtotal Cash from Operations | $7,500 | $7,500 | $8,000 | $19,000 | $20,000 | $20,000 | $26,000 | $26,000 | $28,000 | $33,000 | $36,000 | $36,000 | |
| Additional Cash Received | |||||||||||||
| Sales Tax, VAT, HST/GST Received | 0.00% | $0 | $0 | $0 | $0 | $0 | $0 | $0 | $0 | $0 | $0 | $0 | $0 |
| New Current Borrowing | $0 | $0 | $0 | $0 | $0 | $0 | $0 | $0 | $0 | $0 | $0 | $0 | |
| New Other Liabilities (interest-free) | $0 | $0 | $0 | $0 | $0 | $0 | $0 | $0 | $0 | $0 | $0 | $0 | |
| New Long-term Liabilities | $0 | $0 | $0 | $0 | $0 | $0 | $0 | $0 | $0 | $0 | $0 | $75,000 | |
| Sales of Other Current Assets | $0 | $0 | $0 | $0 | $0 | $0 | $0 | $0 | $0 | $0 | $0 | $0 | |
| Sales of Long-term Assets | $0 | $0 | $0 | $0 | $0 | $0 | $0 | $0 | $0 | $0 | $0 | $0 | |
| New Investment Received | $0 | $0 | $0 | $0 | $0 | $0 | $0 | $0 | $0 | $0 | $0 | $0 | |
| Subtotal Cash Received | $7,500 | $7,500 | $8,000 | $19,000 | $20,000 | $20,000 | $26,000 | $26,000 | $28,000 | $33,000 | $36,000 | $111,000 | |
| Expenditures | Month 1 | Month 2 | Month 3 | Month 4 | Month 5 | Month 6 | Month 7 | Month 8 | Month 9 | Month 10 | Month 11 | Month 12 | |
| Expenditures from Operations | |||||||||||||
| Cash Spending | $4,250 | $4,250 | $4,250 | $6,650 | $6,650 | $6,650 | $8,400 | $8,400 | $8,400 | $8,650 | $8,650 | $8,650 | |
| Bill Payments | $234 | $6,986 | $6,348 | $6,831 | $12,728 | $13,288 | $13,393 | $16,418 | $16,457 | $17,672 | $20,461 | $22,158 | |
| Subtotal Spent on Operations | $4,484 | $11,236 | $10,598 | $13,481 | $19,378 | $19,938 | $21,793 | $24,818 | $24,857 | $26,322 | $29,111 | $30,808 | |
| Additional Cash Spent | |||||||||||||
| Sales Tax, VAT, HST/GST Paid Out | $0 | $0 | $0 | $0 | $0 | $0 | $0 | $0 | $0 | $0 | $0 | $0 | |
| Principal Repayment of Current Borrowing | $0 | $0 | $0 | $0 | $0 | $0 | $0 | $0 | $0 | $0 | $0 | $0 | |
| Other Liabilities Principal Repayment | $0 | $0 | $0 | $0 | $0 | $0 | $0 | $0 | $0 | $0 | $0 | $0 | |
| Long-term Liabilities Principal Repayment | $0 | $0 | $0 | $0 | $0 | $0 | $0 | $0 | $0 | $0 | $0 | $0 | |
| Purchase Other Current Assets | $0 | $0 | $0 | $0 | $0 | $0 | $0 | $0 | $0 | $0 | $0 | $0 | |
| Purchase Long-term Assets | $0 | $0 | $0 | $0 | $0 | $0 | $0 | $0 | $0 | $0 | $0 | $100,000 | |
| Dividends | $0 | $0 | $0 | $0 | $0 | $0 | $0 | $0 | $0 | $0 | $0 | $0 | |
| Subtotal Cash Spent | $4,484 | $11,236 | $10,598 | $13,481 | $19,378 | $19,938 | $21,793 | $24,818 | $24,857 | $26,322 | $29,111 | $130,808 | |
| Net Cash Flow | $3,016 | ($3,736) | ($2,598) | $5,519 | $622 | $62 | $4,207 | $1,182 | $3,143 | $6,678 | $6,889 | ($19,808) | |
| Cash Balance | $53,016 | $49,281 | $46,683 | $52,202 | $52,824 | $52,886 | $57,093 | $58,275 | $61,418 | $68,095 | $74,984 | $55,176 | |
| Pro Forma Balance Sheet | |||||||||||||
| Month 1 | Month 2 | Month 3 | Month 4 | Month 5 | Month 6 | Month 7 | Month 8 | Month 9 | Month 10 | Month 11 | Month 12 | ||
| Assets | Starting Balances | ||||||||||||
| Current Assets | |||||||||||||
| Cash | $50,000 | $53,016 | $49,281 | $46,683 | $52,202 | $52,824 | $52,886 | $57,093 | $58,275 | $61,418 | $68,095 | $74,984 | $55,176 |
| Other Current Assets | $5,000 | $5,000 | $5,000 | $5,000 | $5,000 | $5,000 | $5,000 | $5,000 | $5,000 | $5,000 | $5,000 | $5,000 | $5,000 |
| Total Current Assets | $55,000 | $58,016 | $54,281 | $51,683 | $57,202 | $57,824 | $57,886 | $62,093 | $63,275 | $66,418 | $73,095 | $79,984 | $60,176 |
| Long-term Assets | |||||||||||||
| Long-term Assets | $0 | $0 | $0 | $0 | $0 | $0 | $0 | $0 | $0 | $0 | $0 | $0 | $100,000 |
| Accumulated Depreciation | $0 | $0 | $0 | $0 | $0 | $0 | $0 | $0 | $0 | $0 | $0 | $0 | $0 |
| Total Long-term Assets | $0 | $0 | $0 | $0 | $0 | $0 | $0 | $0 | $0 | $0 | $0 | $0 | $100,000 |
| Total Assets | $55,000 | $58,016 | $54,281 | $51,683 | $57,202 | $57,824 | $57,886 | $62,093 | $63,275 | $66,418 | $73,095 | $79,984 | $160,176 |
| Liabilities and Capital | Month 1 | Month 2 | Month 3 | Month 4 | Month 5 | Month 6 | Month 7 | Month 8 | Month 9 | Month 10 | Month 11 | Month 12 | |
| Current Liabilities | |||||||||||||
| Accounts Payable | $0 | $6,774 | $6,127 | $6,407 | $12,285 | $12,845 | $12,845 | $15,871 | $15,871 | $16,992 | $19,723 | $21,405 | $21,828 |
| Current Borrowing | $0 | $0 | $0 | $0 | $0 | $0 | $0 | $0 | $0 | $0 | $0 | $0 | $0 |
| Other Current Liabilities | $0 | $0 | $0 | $0 | $0 | $0 | $0 | $0 | $0 | $0 | $0 | $0 | $0 |
| Subtotal Current Liabilities | $0 | $6,774 | $6,127 | $6,407 | $12,285 | $12,845 | $12,845 | $15,871 | $15,871 | $16,992 | $19,723 | $21,405 | $21,828 |
| Long-term Liabilities | $0 | $0 | $0 | $0 | $0 | $0 | $0 | $0 | $0 | $0 | $0 | $0 | $75,000 |
| Total Liabilities | $0 | $6,774 | $6,127 | $6,407 | $12,285 | $12,845 | $12,845 | $15,871 | $15,871 | $16,992 | $19,723 | $21,405 | $96,828 |
| Paid-in Capital | $90,000 | $90,000 | $90,000 | $90,000 | $90,000 | $90,000 | $90,000 | $90,000 | $90,000 | $90,000 | $90,000 | $90,000 | $90,000 |
| Retained Earnings | ($35,000) | ($35,000) | ($35,000) | ($35,000) | ($35,000) | ($35,000) | ($35,000) | ($35,000) | ($35,000) | ($35,000) | ($35,000) | ($35,000) | ($35,000) |
| Earnings | $0 | ($3,758) | ($6,846) | ($9,725) | ($10,083) | ($10,021) | ($9,960) | ($8,778) | ($7,596) | ($5,575) | ($1,628) | $3,579 | $8,348 |
| Total Capital | $55,000 | $51,242 | $48,154 | $45,275 | $44,917 | $44,979 | $45,040 | $46,222 | $47,404 | $49,425 | $53,372 | $58,579 | $63,348 |
| Total Liabilities and Capital | $55,000 | $58,016 | $54,281 | $51,683 | $57,202 | $57,824 | $57,886 | $62,093 | $63,275 | $66,418 | $73,095 | $79,984 | $160,176 |
| Net Worth | $55,000 | $51,242 | $48,154 | $45,275 | $44,917 | $44,979 | $45,040 | $46,222 | $47,404 | $49,425 | $53,372 | $58,579 | $63,348 |

