
JTB Industrial Sales
Executive Summary
This plan provides detailed investor information and includes the basic strategic business plan information necessary for initial establishment and operation of: JTB’s Industrial Sales Division. The following sub-plan outlines all aspects of the Industrial Sales Division only. JTB Industrial Sales, Inc. is one of three sub-corporations of JTB Technologies, Inc., a holding company. It will be formed in February of this year in Richfield, Louisiana as a corporation under the Laws of the Commonwealth of Louisiana.
JTB’s Industrial Sales Division will distribute top-quality Industrial-related products and services to local and national clients in the Automotive and Aerospace Industries, Primary Metals and Machining Industries, Mining and Contractor Industries, and in the Military and Governmental procurement sector. JTB Industrial will partner with many manufacturers throughout the U.S to bring our clients additional support services and specialty products to support their ongoing manufacturing or purchasing needs. To maximize profitability, JTB Industrial Sales will be be located with the other JTB divisions, providing access to our industrial Products and Services Division’s equipment and staff to help service our clients’ needs.
The management team responsible for the Industrial Sales Divisions development and hands-on-management of the daily operations are Mitchell and Rachel Jeremy. In addition, a team-oriented and customer-focused staff of 3 will support the management team. JTB, Industrial Sales, Inc. will retain the services of a CPA firm to perform professional company audits, prepare taxes and payroll, and serve as a business consultant to assist in setting achievable long-range strategic goals.
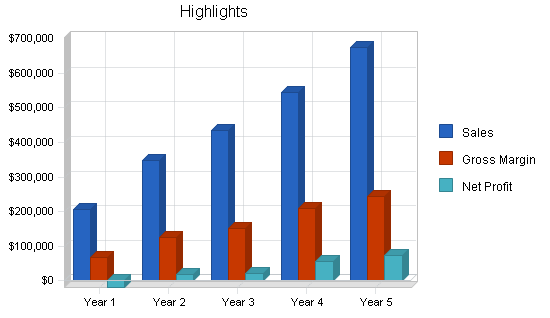
Based on the current prices in the industrial distribution market, JTB Industrial Sales has the potential of making $325,000 within the first eighteen months of operations. With good management, a revenue growth of approximately 24% percent is expected. The projected ratios at the end of Fiscal Year 2 are quite solid.
The equity for each investor will be based on his or her investment. An in-depth look at Ratios can be found in the Financial Plan section, below.
Ways to minimize risk factors to JTB’s Industrial Sales Division success include:
-
- Obtaining sufficient capital to properly fund the project to completion.
-
- Maintaining a lower than projected overhead, which increases the bottom line profit. Multi-skilled personnel will be employed, management will provide a continual training program will ensure they deliver consistent superior service, as customer satisfaction is a high priority goal to developing the business.
-
- Building a sufficient customer base. An excellent location has been determined by demographics, and an aggressive marketing program by a full-time employee will ensure desired results.
- Establishing community involvement to demonstrate how the business will contribute to a better quality of life. Community projects using the company facilities will be developed to help civic groups obtain their financial goals. School, church, and other groups will be welcomed to reach out to the company and its employees for fundraiser and other activities.
1.1 Mission
JTB Industrial Sales will distribute and support only the highest quality services and products. With this as our primary mission, we will work closely with our valued clients to establish solid business relationships within the local Louisiana market, and in the national market as well. Today’s market requires new approaches to marketing and client satisfaction.
Today’s client is seeking the most cost-effective alternatives while expecting the best possible products and services from its vendor base. JTB’s mission will be to provide all of the above to the Automotive, Aerospace, and Industrial marketplace.
1.2 Objectives
The primary objectives for our target markets are as follows:
- Integrate our distributed products and services into the industrial distribution market.
- Resell products and services offered by our manufacturing partners as an industrial distributor.
- Utilize technology software and websites to gain market share.
For many years, we have seen a niche in helping businesses with their production processes, external job costing, and expediting the purchasing of industrial supplies. Our plan calls for these services to be handled in a one-on-one fashion, wherein the client’s criteria for using the various products are reviewed, then a recommendation and a quotation is made by our Sales staff.
JTB’s Industrial Sales Division will be a base partner in the JTB network as well, and will also use this network to promote our products and services throughout our industrial partners. Utilizing our custom marketing and order processing systems, our compatibility for order processing and information processing will be greatly increased.
This technology will facilitate many typical tasks, allowing us to place requests to vendors and accept requests from customers simultaneously. As with many larger corporations requiring EDI for purchases, JTB will easily extend larger clients inventory, order tracking, and engineering information. JTB Industrial Sales will be able to promote products and service to all of its customers in the Louisiana market, and nationally as well.
1.3 Keys to Success
-
- Seasoned management with over twenty five years of business experience in the Industrial Distribution and Tooling industries.
-
- Focused and well defined long range goals for longevity. Plan is developed to allow flexibility and growth.
-
- Strong project management staffing with extensive prior Engineering experience providing clients with product and service support in an industrial setting.
-
- Strong marketing goals with niche products and services, targeted services and products delivered with unique marketing approaches.
-
- Very low internal development costs at startup.
- Previous base of quality external support vendors available to build on, with over twenty years of industry contacts to work with, in both the purchasing of quality products, and also in the marketing of our own products.
Company Summary
JTB’s Industrial Sales Division will be located in Richfield, Louisiana. This location is very close to the I-82 corridor, providing excellent access to the Mississippi, Arkansas and Texas industrial markets. JTB’s management acquired its roots in the industrial marketplace while managing RL&I Tool and Machine, Inc., a privately held corporation that operated in Missouri for over twenty-five years.
Further experience was also acquired while managing RL&I’s industrial supply division. In late 1999, the Missouri corporation was closed and the management shown in this plan relocated here to Louisiana. Prior to leaving Missouri, Technical Marketing Technologies LLC, a spin-off of the Missouri based corporation was established, and operates as a sole proprietorship here in Louisiana. With our roots firmly planted in the Industrial marketplace, JTB will provide Industrial and Commercial Tools, Safety Products, and Engineered Sales expertise.
The primary partners in this plan are responsible for all phases of implementing the sales process to drive the distributorship,with special emphasis on bringing the latest in automated P.C.-based sales tools, computer aided engineering, and custom tailored inventory to suite our clients needs in the following business types:
- Aerospace and Military
- Turbine and Valve manufacturers
- General Manufacturing, Fabricators and Precision Machine Shops.
- Specialty Machine Manufacturers.
- Governmental procurement and Military.
In addition to providing these clients with industrial products, JTB will also provide technical expertise, engineering assistance and all types of outsourced industrial services. JTB’s industrial services division will be utilized for these services in many cases.
2.1 Start-up Summary
Initial startup will consist of moving Technical Marketing Technologies LLC from it’s present location into a nearby 3,500 sq. ft. commercial facility. 1,000 sq. ft. of sales office area, and 2,500 sq. ft. of production space with provisions for further expansion when needed.

Once established, Mr. Jeremy will re-establish all of his previous industrial business contacts to develop a well rounded offering of products for immediate resale. This will include several catalog offerings with over 100,000 products each. A stock list will also be compiled of the major items to be offered adding more customer support value to the business additionally generating essential walk-in counter business.
We intend to train 2 Sales Associates to develop relations, and handle order processing with our intended local customer base. Additionally, 1 shared Sales and Marketing Associate will focus on new client research and development. Mr. Jeremy will make personal contact with all potential clients to develop long term solid relationships.

| Start-up | |
| Requirements | |
| Start-up Expenses | |
| Legal | $1,200 |
| Stationery etc. | $700 |
| Brochures and Catalogs | $4,500 |
| Consultants | $3,000 |
| Insurance | $750 |
| Rent | $750 |
| Accounting System | $3,500 |
| Computers, and Office Equipment | $8,500 |
| Total Start-up Expenses | $22,900 |
| Start-up Assets | |
| Cash Required | $115,600 |
| Start-up Inventory | $20,000 |
| Other Current Assets | $5,500 |
| Long-term Assets | $19,500 |
| Total Assets | $160,600 |
| Total Requirements | $183,500 |
| Start-up Funding | |
| Start-up Expenses to Fund | $22,900 |
| Start-up Assets to Fund | $160,600 |
| Total Funding Required | $183,500 |
| Assets | |
| Non-cash Assets from Start-up | $45,000 |
| Cash Requirements from Start-up | $115,600 |
| Additional Cash Raised | $0 |
| Cash Balance on Starting Date | $115,600 |
| Total Assets | $160,600 |
| Liabilities and Capital | |
| Liabilities | |
| Current Borrowing | $0 |
| Long-term Liabilities | $181,000 |
| Accounts Payable (Outstanding Bills) | $2,500 |
| Other Current Liabilities (interest-free) | $0 |
| Total Liabilities | $183,500 |
| Capital | |
| Planned Investment | |
| Owner | $0 |
| Investor | $0 |
| Additional Investment Requirement | $0 |
| Total Planned Investment | $0 |
| Loss at Start-up (Start-up Expenses) | ($22,900) |
| Total Capital | ($22,900) |
| Total Capital and Liabilities | $160,600 |
| Total Funding | $183,500 |
2.2 Company Ownership
JTB will be a privately held corporation co-owned by Rachel L Jeremy and her husband Mitchell R. Jeremy. Rachel Jeremy has 10 years experience in production management, and customer services acquired while she worked with RL&I Tool and Machine, Inc where she was also the Secretary for that corporation. Robyn will also add a large percentage to the minority owned shares, allowing the firm to participate in larger contracts requiring minority involvement.
Mitchell R. Jeremy owns and operates Technical Marketing Technologies LLC, a technology and marketing consulting firm. Mr. Jeremy is an innovator with over 25 years of technical experience in the Industrial tool market with an additional 15 years of integrating computers and other technologies into the manufacturing and distribution of industrial products. Mr. Jeremy has a proven track record of success in launching new business projects and directing operations for a previous MIssouri based corporation as President of RL&I Tool and Machine, Inc
To achieve our objectives, Mr. Jeremy is seeking $181,000 in loan financing for the Industrial Sales Division’s portion of the business plan. This loan will be paid from the cash flow of the business, and will be secured by the assets of the company, and backed by the character, experience and personal guarantees of the owners.
Products and Services
JTB’s Industrial Sales Division will provide industrial, commercial, military and governmental procurement clients with specialty and general industrial products and services. What makes JTB Industrial Sales unique in this market is our technical abilities to work closely with our clients engineering needs while also providing the outsourced services to reduce the clients production, maintenance, and safety costs involved with daily operations. JTB’s Industrial Sales Division will offer the following industrial goods: Tools, Specialty made to print items (ie., Machined components, items requiring project management and sub-contracted items), Safety products, Raw materials (ie., metals and hard metal products), and MRO maintenance repair items.
This will be accomplished in the following ways:
- Provide quality Industrial products to fulfill our clients production needs.
- Provide expertise in our field and become a recognized source of trusted quality products.
- Market nearly 300,000 products to these clients via an extensive catalog offering.
- Stock the demanded essentials required to fulfill our clients needs.
- Be available on extended hours of operation to process late in the day orders.
- Keep detailed records for repeat orders.
- Offer a quality secondary services program to service our clients after-sales needs.
- Seek out specialty products and services to set us apart from the competitors.
3.1 Product and Service Description
JTB’s Industrial Sales will offer the industrial buyer a unique purchasing environment allowing the buyer to easily purchase industrial related products and services. Our distributorship will remain flexible to allow the business to adapt to our clients purchasing needs.
Traditionally, industrial distributorships have offered many of the same lines available from most suppliers, with JTB’s advanced network of suppliers, we will provide most standard lines and many specialty lines, Our unique mix of services capabilities and short delivery times to our clients will make for a solid value based purchase for our clients. Our Products and Services Division will be equipped to make custom tools going to JTB’s industrial clients putting our services ahead of the competition while reducing costs to the customer.
Flexibility, with a solid mix of catalog items to compete against the larger catalog houses, a quality offering of industry recognized branded products, and our offering of custom engineering and alteration services. JTB Industrial Sales can cover all of the requirements for the small manufacturer up to the much larger corporation requiring system contract bids or EDI options.
3.2 Competitive Comparison
Presently in the local Louisiana market there are some well structured long standing industrial distributors in the marketplace, also there is a mix of national distributorships and catalog houses offering direct purchasing. In general, none of them provide the right mix of stocking capabilities mixed with a special services offering. Most can offer additional services to the clients, but the costs of outsourcing can really add up. In some cases shipping alone can add up to 40% in unnecessary additional costs as the distributor ships out a product to a specialty house, and the specialist return ships the distributor, and then finally a delivery or shipment is made to the client.
In our offering of products and services, we will have a very good inventory selection on hand stocking everything from new tools, used tools, raw materials, to actually manufacturing specialty items per print. Additionally, we can provide engineering help to our clients offering over 25 years of related applications experience.
Operating with all of our services under one roof greatly reduces logistical problems, reduces costs and speeds the delivery process to the client offering our capabilities locally, and nationally making JTB Industrial a better value.
3.3 Fulfillment
JTB’s Industrial Sales Division will purchase goods and services for resale from many sources throughout the U.S.
Our distributor relationships with our quality suppliers will be seen and used as a key factor in our sales process. As we represent manufacturers at our various clients, we can add many years of machining and engineering background to our sales process. An order could be as simple as filling a customer requirement for a specified manufacturers EDP number, to getting faxes with requests to provide specialty products for the manufacturer to complete manufacturing process.
Our selection of manufacturing partners will provide a secondary line of fulfillment for specialty products and services as well.. Additionally, our mix of nearly 300,000 industrial and safety products available through our catalog offering will allow us to compete against the much larger catalog suppliers.
3.4 Technology
JTB will develop its own P.C.-based sales and marketing help systems for its employees to use during the sales process additionally, our applications will have extensions to our Internet sites to aid the customer relations and sales process.
Our goals are to have extensive in-house Web development capabilities via our business development technologies division. Plans for multiple industrial portals for our advertising needs, and custom sales applications for licensing. Using our distributorship as the sales model, we will create special Web based applications to bring our online sales environment to our local and national customers.
3.4.1 Future Products and Services
As management comes from a distribution /service provider background, JTB will from the day it opens its doors have nearly 90% of the same capabilities as other distributorships in terms of resale capabilities. Capabilities that likely have taken them many years to create. In addition to our products, our services offering will also be a turn-key situation via our industrial products and services divisions capabilities, acting from day one like it has been up and running for many years.
Management brings with it the capabilities to do this, while also creating a profitable environment by creating and offering secondary services to match our clients needs as their needs change. Our future products and services are limited only to our own capacity, and our manufacturing partners capabilities and capacity in terms of future growth.
JTB Industrial Sales will keep pace with our clients needs on a continual basis anticipating their needs wherever possible while researching product alternatives to replace older technology.
Market Analysis Summary
JTB Industrial Sales Divisions marketplace is comprised of the following commercial and governmental business types
National Market Description:
- Aerospace Industry – High Tech Manufacturers, and supporting sub-industries
- Automotive – Automotive repair, and Auto body industry.
- Automotive – Auto Makers, and their support industries.
- Primary Metals and Machining Industry – Turbine, Valve, Specialty Manufacturers, and Machining industries.
- Mining and Contractor Industry – Hole drilling and Utility service providers.
Louisiana Market Description:
- Aerospace Industry – High Tech Manufacturers, and supporting sub-industries.
- Automotive – Automotive repair, and Auto body industry.
- Automotive – Auto Makers, and their support industries.
- Primary Metals and Machining Industry – Turbine, Valve, Specialty Manufacturers, and Machining industries.
- Mining and Contractor Industry – Hole drilling and Utility service providers.
- Military and Governmental procurement. (not projected but available)
The potential clients available in the U.S market 303,964, and the Louisiana market 2,827 are well suited for all of the Industrial products offered by the Industrial Sales Division. Presently they all purchase from specialty catalog companies, Industrial Distributors, and via the Internet. For the purposes of developing this plan, Military and Government procurement is not included in the potential market counts.
4.1 Market Segmentation
JTB Industrial Sales, Inc – Market Segmentation:
- Aerospace Industry – High Tech Manufacturers, and supporting sub-industries.
- Automotive – Automotive repair, and Auto body industry.
- Automotive – Auto Makers, and their support industries.
- Primary Metals and Machining Industry – Turbine, Valve, Specialty Manufacturers, and Machining industries.
- Mining and Contractor Industry – Hole drilling and Utility service providers.
- Military and Governmental procurement. (not projected but available)
Key market segmentation highlights
- All of the above markets are seeking cost reduction in their daily operations. As the JTB divisions will function as a distributor, and a service provider, we can deliver specialty products faster and more competitively priced.
- The above markets are seeking longer product life, resulting in higher profitability, all of the above markets purchase similar products and services consolidating our internal purchasing and marketing costs.
- All can be serviced via existing modes of transportation, UPS, Fedex, etc.
- 85% of the potential client base can utilize JTB’s Product and Services Divisions services, and the marketing services provided by the JTB’s Business Development Division as well. Greatly reducing the costs to acquire and solicit potential customers.

| Market Analysis | |||||||
| Year 1 | Year 2 | Year 3 | Year 4 | Year 5 | |||
| Potential Customers | Growth | CAGR | |||||
| Aerospace, High Tech manufacturing | 3% | 25,587 | 26,355 | 27,146 | 27,960 | 28,799 | 3.00% |
| Automotive, Repair, Autobody | 9% | 61,228 | 66,739 | 72,746 | 79,293 | 86,429 | 9.00% |
| Automotive, Auto makers, support sub-industry | 2% | 4,000 | 4,080 | 4,162 | 4,245 | 4,330 | 2.00% |
| Primary Metals, and Machining industry | 7% | 210,000 | 224,700 | 240,429 | 257,259 | 275,267 | 7.00% |
| Mining and Contractor industry | 9% | 3,149 | 3,432 | 3,741 | 4,078 | 4,445 | 9.00% |
| Total | 7.06% | 303,964 | 325,306 | 348,224 | 372,835 | 399,270 | 7.06% |
4.2 Target Market Segment Strategy
National and Regional Market Strategy for the following industries:
- Aerospace Industry – High Tech Manufacturers, and supporting sub-industries
- Automotive – Automotive repair, and Auto body industry.
- Automotive – Auto Makers, and their support industries.
- Primary Metals and Machining Industry – Turbine, Valve, Specialty Manufacturers, and Machining industries.
- Mining and Contractor Industry – Hole drilling and Utility service providers.
- Military and Government Procurement.
Our marketing strategy for the above markets will vary slightly for each, but will primarily use direct marketing, utilizing the owners’ previous contacts in these industries. When completed, our interactive software systems will further allow our integration into the market as it will be developed to form a closer one-on-one relationship with the client making it faster and easier to place repeat orders.
4.3 Service Business Analysis
JTB’s Industrial Sales Division is part of the catalog sales industry, in a sub-specialty helping manufacturers and distributors choose catalog products, parts, and service conditions. This industry is dominated by a few large players at the national level, but has a fragmented, local, small-scale component numbering in the hundreds. Within our local market, we will be competing largely with other small, local businesses. There are no industry standards for order placement, service agreements, or contract structure, leading many buyers to stick with an unsatisfactory local option simply because it helps them avoid having to learn a new seller’s system.
JTB’s Industrial Sales Division will provide a select market with a variety of industrial products from top manufacturers. As JTB Industrial Sales will work as an agent to sell many of these products, commissions will be made both as a distributor, and as a service provider of specialty services. Our niche in the engineered sales aspect of the industrial distribution marketplace places strong emphasis on providing the right product for the job the first time. As management’s background comes from working as a service provider and an industrial distributor, we can bring the previous twenty-five years of experience to our technical applications. We are highly experienced in CAD design and C.N.C. machining of various other components manufactured to print per customer specification.
As we interacted with these distributors, providing them services to help their clients, we also helped many of their sales personnel, who were not properly experienced in industrial applications. In many cases, we had to rectify the problems that resulted from bad product choices, in addition to salvaging their relations with the client by making a better, more cost-effective recommendation.
Our unique addition of interactive online marketing and ease of customer access to our services, and a strong commitment to providing a quality service, should provide a strong niche in the industry.
4.3.1 Competition and Buying Patterns
JTB’s competition consists of several locally established distributors, as well as three nationally established catalog style distributors. These businesses typically supply the local market with a variety of industrial products to meet the customers’ needs. Local distributorships are reselling some good quality tools and supplies to the local market, generally letting the customer select from the tooling and products they happen to supply, and provide outsourced services to fulfill customer needs.
Our former Missouri business sold to and manufactured for various business all over the U.S and Canada. The business and buying climate is different here in Louisiana as the businesses (buyers) allow themselves to be pilfered by the local distributorships. This seems to be caused by a lack of planning by the buyers, causing a continual rush order type of environment. Needless to say, this opens up very large margins for the distributors, as there is really no time for the customers to have things properly quoted.
Customer buying habits include everything from small dollar orders, large blanket purchase orders, systems contracts, the above mentioned “rush order scenario,” and other types of procurement. In general, all of the competition is trying to fulfill these requests in one way or another, without any kind of standardization, generally forcing each customer to adapt to the seller’s sales and order placement methods.
Strategy and Implementation Summary
Our strategy and implementation of our Industrial Sales Division keeps in stride with the other JTB divisions in that our intentions are to develop the business by distributing only quality products and services. The real strategy behind the business plan we are proposing is its growth capabilities when the currently not projected additional distributors are considered.
The strategy is simple: by utilizing our custom applications, we can eliminate much of the traditional overhead required to support external business activities, while still filling our orders. In many cases, buyers’ internal staff cannot handle technical issues, and consequently seek outside help.
5.1 Value Proposition
JTB’s Industrial Sales Division’s value proposition is very simple, providing quality and service that meets the customers’ requirements. With three JTB divisions, whenever possible, we attempt to utilize our own in-house skills to meet our customers, needs. When accomplished in-house, the value turns into a quality product or service for a reduced overall cost to the customer.
Simpler logistics means faster overall services at a reduced cost.
5.2 Competitive Edge
Our competitive edge is a unique offering of products and services, marketing our goods and services to many different industries. Our strongest asset is our twenty-five years of application support, acquired while working previously as a service business. With our three different divisions, we can offer many different services under one roof.
This offering of products and services, combined with the development of our own Web-based sales and marketing initiatives and applications, will strengthen JTB’s ties to our partners and direct clients. As computer networking is a strong area for me personally, I see the benefits to businesses that have solid network-based sales and marketing tools in place. JTB will be able to offer much larger clients an extremely large variety of products and services. All of the JTB divisions will benefit from the marketing, strategic ad placements and direct marketing products offered by each of the JTB divisions.
5.3 Marketing Strategy
Key Goals to our marketing plans are as follows:
- Develop a high profile sales environment to bring our products to new and existing clients.
- Develop new ways to market our products to potential clients via our branded applications and software.
- Develop partnerships, adding these partners services and products to develop a large products and services offering.
- Develop and maintain a quality customer service and follow-up program for all of the JTB divisions.
- Develop and utilize an ongoing automated marketing system to contact potential clients.
- Carefully target marketing expenditures to maximize returns on the campaigns.
5.3.1 Distribution Strategy
JTB will implement a distribution system developed by our Integrated Technologies Division. This provides the necessary real-time ability to share our inventory with other suppliers and customers. With the real-time capabilities mixed into our sales applications, we will be able to work very closely with our manufacturing partners to fill orders, receive orders, and process requests for quote.
5.3.2 Promotion Strategy
JTB Industrial Sales will promote sales and specials via the Internet, faxed and mailed sales literature, and printed media sent to the customers with our boxed shipments. Our integrated P.C.-based marketing systems will e-mail buyers about current promotions.
Our other divisions’ customer databases will be accessible by the Industrial Sales Divisions staff as well, allowing further solicitations into new markets and clients. With tailored promotions, we hope to gain a large promotion-based clientele that hopefully yields many return customers to further develop our long term return customer base.
5.3.3 Strategic Alliances
JTB Industrial Sales will develop long term relationships within the manufacturing and metalworking industry, developing vendor relationships to provide our clients with industrial products and services. Our manufacturing partners and industrial suppliers will be hand picked for their products and services. Our main goal while developing a strategic alliance is to select the best possible product or service providers we can locate.
JTB will utilize our business development applications provided to network with our clients and manufacturing partners to create a unique purchasing environment, providing the smaller clients with the same degree of service as our larger clients.
5.3.4 Pricing Strategy
JTB Industrial Sales will rely on well-known printed industrial product catalogs as a benchmark for pricing references.
While it is true that these giant catalog companies enjoy better distributor discounts when they make their purchasing arrangements with suppliers, its also possible to use their printed prices as a benchmark for our clients to make comparisons, when they purchase from us. Unless the item is a complete special, or a special standard, it can be found in a catalog, providing us with a good reference index to work from while calculating our discounts on list prices.
In general, it is usually fairly easy to compete in either the catalog business, or the Industrial Sales business, in terms of percentages. We will not structure our pricing to give the house away. What will set us apart is the service offering following the sale; we will generate additional revenues by servicing the distributed products, thus another sales point can be made as well.
“Not only can we sell you the new products you need, we can service them in-house as well.”
5.3.5 Marketing Programs
Our marketing programs will consist of a blend of the following:
- Internet-based industrial website banner ads: as we develop our industrial Internet marketplaces, we will place ads into our sites and many other industrial product sites as well.
- Promotional e-mail-based product e-flyers: as we collect users at our sites, we will build a sales process of delivering e-mail based promotions to our visitors highlighting our products and services.
- Catalog supplemental flyer programs delivered with all shipments: our shipping department will include inventory specials with all boxed shipments to our clients, saving much of the mailing costs.
- Fax-based special promotions, when allowed: we hope to target purchasing agents and buyers with our specials.
- in all cases and methods of delivery, we can build a promotional special to target each client’s purchasing history.
- Direct telephone solicitation while taking orders: our sales staff will close all order calls with a quick overview of our sales specials.
5.4 Milestones
Offices and Location for JTB Industrial Sales – Long term location arrangements for the Industrial Sales Divisions offices and warehouse.
Selection of Sales Associates – JTB Industrial Sales Division will be seeking bright, sales-oriented individuals to fulfill our internal needs for customer support, sales and marketing initiatives, and long term goals.
Set up Lines and Services offering – JTB will solicit the desired industrial lines we want to carry, and we will begin developing our catalog program as well.
Begin training Sales Associates – Training of our Sales Associates will be an ongoing effort. Our staff will function in a team situation allowing each associate to work towards specific areas of our intended sales goals.
Begin Catalog Program – Initially, 250 sets of custom catalogs will be ordered. We anticipate developing up to 1,200 catalog clients during the 4 years projected in the plan. The products available for resale in our intended catalog offering are 300,000 to 400,000 industrial items.
Begin development of Integrated Sales Apps – Our corporate Intranet will be developed with help from the JTB Integrated Technologies Division. The intranet will be a custom developed sales tool for our sales associates.
Begin Outside Sales Campaign – JTB will begin its outside sales campaign by following up on our initial letters of introduction, and by following up on clients utilizing our Industrial Services Divisions services, following through on our goal of 250 new clients per year.
Begin integration of manufacturing partners – With our marketing sites completed, JTB will solicit additional products and services to resell via our distributor partner network. Utilizing our custom developed technology, our clients will have a Internet version of our sales and marketing tools.

| Milestones | |||||
| Milestone | Start Date | End Date | Budget | Manager | Department |
| Office location for JTB Ind Sales | 2/1/2005 | 2/28/2005 | $4,500 | M.Jeremy | Sales |
| Selection of Sales Associates | 2/15/2005 | 3/15/2005 | $2,000 | M.Jeremy | Sales |
| Setup Lines and Services offering | 3/1/2005 | 4/1/2005 | $1,500 | M.Jeremy | Sales |
| Begin training Sales Associates | 4/1/2005 | 3/1/2006 | $8,500 | M.Jeremy | Sales |
| Begin development of Integrated Sales Apps | 4/1/2005 | 6/30/2005 | $5,000 | M.Jeremy | Web |
| Begin Catalog Program | 4/15/2005 | 12/15/2005 | $4,500 | M.Jeremy | Sales |
| Begin Outside Sales campaign | 8/1/2005 | 12/30/2006 | $12,000 | M.Jeremy | Sales |
| Begin integration of manufacturing partners | 3/1/2006 | 3/1/2008 | $12,000 | M.Jeremy | Sales |
| Totals | $50,000 | ||||
5.5 Sales Strategy
JTB’s Industrial Sales Division’s strategy is summed up in three words, Marketing, Engineering, and Sales. Our unique marketing environments will allow established and potential customers cost-free access to our products and services via Phone, Fax, EDI, and the Internet. The marketing environment will be integrated with sales capabilities. Customers can access their accounts via the Internet to review purchases, request quotes, and place orders.
Pre-sales engineering will be available for the clients when consultation is needed. JTB will develop online databases about the products we represent; these will be available to our staff to converse with clients about projects. CAD and other engineering software will work out potential issues on specialty projects prior to ordering. After the pre-sale process is complete, the staff will generate a formal quote to be sent to the client in the format they prefer.
The most prominent components of our sales process are ease of use and a knowledgeable staff to promptly fulfill orders. Having purchased from all types of businesses, including tool manufacturers, industrial distributors, and industrial catalog houses, JTB will blend the best features from our purchasing experiences into a comfortable, customer-oriented purchasing environment.
5.5.1 Sales Forecast
Our sales forecast table uses the following assumptions:
- Tooling average growth rate of sales 29.5% annually.
- Commercial, Contractor, Utilities average growth rate of sales 25% annually.
- Safety Products average growth rate of sales 66% annually.
- Holding Products average growth rate of sales 49.3% annually.
- Precision Measuring Products average growth rate of sales 49.3% annually.
- Catalog Industrial Products average growth rate of sales 34.3% annually.
- Specialty Purchased Components average growth rate of sales 66.7%
- Tool related Services average growth rate of sales 34.5% Annually.
The sales growth is affected by numerous factors, including:
- JTB’s ability to quickly develop its internal sales staff.
- JTB’s ability to rapidly redevelop management’s previous industry relations channels.
- The development of the JTB’s Products and Services Division’s services.
- The development of JTB’s Integrated Technologies Division’s marketing products.
JTB’s Industrial Sales Division’s forecast highlights the key products to be initially offered. Remaining flexible, management will be seeking additional avenues of business to develop, adding further sales capability. We feel strongly about developing a very good local customer base here in Louisiana, allowing quick growth and establishment of cash flow. Additionally, we anticipate better margins as we become established as direct distributors for many of the lines we would initially offer from catalogs, and through out of state purchases from other distributors.
Our sales forecast has an average margin of 36%. As an established direct or stocking distributor we previously had discount arrangements of up to 68% off list pricing these changes would result in an additional 15 – 30% reduction in our direct costs of goods picture.


| Sales Forecast | |||||
| Year 1 | Year 2 | Year 3 | Year 4 | Year 5 | |
| Sales | |||||
| Tooling | $26,320 | $54,000 | $72,000 | $93,000 | $103,456 |
| Commercial, Contractor, Utilities | $22,300 | $48,000 | $64,800 | $76,400 | $93,208 |
| Safety Products | $16,330 | $21,200 | $24,000 | $32,156 | $48,234 |
| Holding Products | $9,050 | $17,800 | $19,900 | $21,300 | $26,000 |
| Precision Measuring Products | $9,050 | $17,800 | $19,900 | $21,300 | $26,000 |
| Catalog Industrial Products | $105,200 | $126,300 | $141,500 | $164,375 | $200,537 |
| Specialty Purchased Components | $6,975 | $21,400 | $33,000 | $56,000 | $73,600 |
| Tool Related Services | $11,300 | $28,800 | $40,320 | $54,432 | $73,483 |
| Manufacturing Services | $0 | $12,000 | $18,000 | $24,000 | $30,000 |
| Manufacturing Partners | $0 | $0 | $0 | $0 | $0 |
| Military and Governmental | $0 | $0 | $0 | $0 | $0 |
| Total Sales | $206,525 | $347,300 | $433,420 | $542,963 | $674,518 |
| Direct Cost of Sales | Year 1 | Year 2 | Year 3 | Year 4 | Year 5 |
| Metal Cutting Tools | $15,792 | $32,400 | $43,200 | $50,880 | $62,074 |
| Commercial, Contractor, Utilities | $13,380 | $28,800 | $38,880 | $45,840 | $55,925 |
| Safety Products | $9,798 | $12,720 | $14,400 | $19,299 | $28,940 |
| Work Holding Products | $5,430 | $10,680 | $11,940 | $12,780 | $15,600 |
| Precision Measuring Products | $5,430 | $10,680 | $11,940 | $12,780 | $15,600 |
| Catalog Industrial Products | $68,380 | $82,095 | $91,975 | $106,843 | $130,349 |
| Specialty Puchased Components | $3,834 | $11,770 | $18,150 | $22,660 | $40,480 |
| Cutting Tool related Services | $6,215 | $15,840 | $22,176 | $29,938 | $40,415 |
| Channel Partner Services | $0 | $7,200 | $10,800 | $14,400 | $18,000 |
| Internet Distributorships | $0 | $0 | $0 | $0 | $0 |
| Military and Governmental | $0 | $0 | $0 | $0 | $0 |
| Subtotal Direct Cost of Sales | $128,259 | $212,185 | $263,461 | $315,420 | $407,383 |
Web Plan Summary
JTB’s Web-based marketing plan is essentially the same for all of the JTB divisions, with the exception of how each division targets its clients. As JTB will be able to add its services into the marketplaces to be developed, we will get day-to-day information and feedback from the various paid ads we place in industrial trade magazines, and with other websites as well. The Web plan is to link our products and services with as many affiliate sites as possible.
When established, these marketplaces and affiliate sites will serve as a very cost effective marketing tool for all of the JTB divisions, again keeping in mind that each division’s approach to this will be tailored towards its intended potential clients. Each division will have dedicated websites operating under the JTB logo. With a client database available at all times via our servers, we can easily show others seeking a better marketing system, order processing, Web-based marketing, and special applications that JTB products perform as intended, providing affordable long term results for our clients.
6.1 Website Marketing Strategy
JTB will develop and manage as many industrial marketplaces as possible, seeking out niche marketing that drives customers to our industrial products and services sites. Also, JTB will embed itself into many other sites utilizing search engine technology, affiliate marketing programs, and paid banner ads.
Management Summary
Sales Manager
Mitchell R. Jeremy
Mr. Jeremy will work with the managers and staff of the Industrial Sales Division to train staff and act as the project manager on bigger projects requiring an engineered sales background. Additionally, staff will be trained on the technical aspects of the products, and the use of the corporate Intranet. Mr. Jeremy will develop all of the internal and external sales and marketing programs to train and orient staff and customers about our products and services.
New products and programs will be added in layers as they are developed. Our Intranet will be continually developed as new products and services are added. Key training goals for our staff include making the associates self sufficient as quickly as possible on our base inventory. Working from standardized product lists and promotions containing many of our base products, will expedite the training process.
7.1 Management Team
Sales and Operations Manager
Mitchell R. Jeremy will be overseeing all aspects of inside sales, training of sales staff, and the development of new customers via both inside sales calls and direct outside sales, calling on larger clients. (All expenses relating to the owners’ salaries are listed in the plan for holding company, JTB Technologies, Inc., only.)
Sales Team Leader
Sales Team Leaders will work in both a sales and marketing role, providing customer support while continually training to market new products and services.
7.2 Personnel Plan
Sales Associates (Part-time)
Sales Associates will work in both a sales role, providing customer support while continually training to support new products and services offered.
Shipping and Receiving (Part-time)
In the first two years, this will be a part-time position. Depending on the demands of the business, we plan to increase this position to full-time in year 3, but we could switch to full-time sooner if necessary. Responsible for shipping, inventory, and receiving incoming goods. Packing orders for shipment, and miscellaneous jobs throughout the business.
| Personnel Plan | |||||
| Year 1 | Year 2 | Year 3 | Year 4 | Year 5 | |
| Production Personnel | |||||
| Shipping and Receiving | $9,600 | $9,600 | $18,800 | $18,800 | $22,500 |
| Name or Title or Group | $0 | $0 | $0 | $0 | $0 |
| Subtotal | $9,600 | $9,600 | $18,800 | $18,800 | $22,500 |
| Sales and Marketing Personnel | |||||
| Sales Team Leader | $30,000 | $30,000 | $31,000 | $31,000 | $31,000 |
| Sales Associate | $9,000 | $14,000 | $16,500 | $19,000 | $22,500 |
| Sales and Marketing Associate (shared) | $0 | $0 | $12,000 | $16,000 | $18,000 |
| Subtotal | $39,000 | $44,000 | $59,500 | $66,000 | $71,500 |
| General and Administrative Personnel | |||||
| Sales Manager | $0 | $0 | $0 | $0 | $0 |
| Other | $0 | $0 | $0 | $0 | $0 |
| Subtotal | $0 | $0 | $0 | $0 | $0 |
| Other Personnel | |||||
| Name or Title | $0 | $0 | $0 | $0 | $0 |
| Other | $0 | $0 | $0 | $0 | $0 |
| Subtotal | $0 | $0 | $0 | $0 | $0 |
| Total People | 3 | 4 | 5 | 5 | 5 |
| Total Payroll | $48,600 | $53,600 | $78,300 | $84,800 | $94,000 |
Financial Plan
JTB’s financial plan is based on raising $181,000 in long-term loans to develop the Industrial Sales Division of the corporation. To maintain Gross Margins of 36% or better, the Industrial Sales Division will also help develop and create P.C.-based Industrial Sales applications and portals in conjunction with our Integrated Technologies division.
Our unique customer applications will help to speed the quotation and purchasing process of the 300,000 industrial products offered in our catalogs. In just over two years the Industrial Sales Division will fully implement a large scale Internet and catalog-based marketing program to develop its client base both locally and nationally, showing a reasonable net profit by year 2. Important elements that will impact the financial plan can include:
- How quickly the sales division can pull its operations together, as this division will be situated within the same location as the other divisions. Management will have to develop and cross-train its sales team as quickly as possible.
- While we are putting a lot of emphasis on the Internet-based sales and marketing for the long-term plans, we will initially implement a solid direct marketing plan with ads in many industrial magazines and websites.
- Although the business is a start-up company, the financial plan is solidly based on past performance when management operated in similar situations. We have taken P&L income and expenses from the previous sales entity, and reduced some corporate overhead expenses such as warehouse and administrative costs, as this division will carry 1/3 of many of the normal operating expenses once established.
JTB’s Industrial Sales Division is capable of developing $674,518 in sales by year 5 of the plan, with a solid net worth, and good return on equity. With tough financial planning, financial goals will fully realized when all aspects of the business divisions are in place functioning as a complete corporation.
8.1 Important Assumptions
This plan is one part of a three part business plan providing details of each business segment for more accurate projections. The main plan, JTB Technologies, Inc., is used to show the overall development of the business in its entirety. Key assumptions around which management developed this plan are as follows:
- Current business, banking, and economic trends continue to be stable.
- Customer buying trends and orders remain strong.
- Overhead and other external operating cost grow as projected.
- External outsourced costs grow as anticipated.
- Internet buying trends continue to grow in the industrial sector.
These factors also play heavily into the business’ long-term plan, assuming that the business can be developed in it’s entirety in one location. This greatly reduces operating costs, and provides a more flexible staff situation for cross-training and other issues.
Upon reviewing the plan, you may have noticed management has mentioned expansion through the use of its online marketing system via numerous manufacturing partners throughout the U.S. The possible revenues from this have been added into the projections, but are under-valued for this projection. Also, there have been no revenues added for Military and Governmental purchases, a very large local market. Management’s position on the plan’s assumptions is we feel we can make better long term arrangements which should better the projected cash position shown.
Note 8.1.1 We have selected a high-quality, networked accounting system with capabilities of having multiple businesses running while still offering full consolidation of the business for accounting purposes. This system is complete with project management capabilities and budgeting. As such, management will implement a budgeted approach for the projects while adjusting costs in JTB’s favor wherever possible.
All financial tables in this plan include only the projections for the Industrial Sales Division. We suggest that each plan is reviewed, as each is quite different.
| General Assumptions | |||||
| Year 1 | Year 2 | Year 3 | Year 4 | Year 5 | |
| Plan Month | 1 | 2 | 3 | 4 | 5 |
| Current Interest Rate | 10.00% | 10.00% | 10.00% | 10.00% | 10.00% |
| Long-term Interest Rate | 10.00% | 10.00% | 10.00% | 10.00% | 10.00% |
| Tax Rate | 0.00% | 30.00% | 30.00% | 30.00% | 30.00% |
| Other | 0 | 0 | 0 | 0 | 0 |
8.2 Break-even Analysis
JTB’s break even analysis is based on our projected direct costs, including shipping and receiving personnel payroll, and first year’s sales. We will pass the break-even point in late in the first year, and make increasing profits thereafter.
The initial goal is to bring an established inventory list to market within 30 days from startup along with the addition of numerous well accepted industrial products for resale. What will set JTB apart from the other industrial entities is its ability for flexibility, expansion, and it’s individual divisions with key personnel all under one roof targeting each market segment JTB will pursue.
With this in mind, the goal is to build a solid base for the corporation with our primary products and services while continuing the development phase of our distribution software to be developed by our business development technologies division.

| Break-even Analysis | |
| Monthly Revenue Break-even | $15,441 |
| Assumptions: | |
| Average Percent Variable Cost | 62% |
| Estimated Monthly Fixed Cost | $5,852 |
8.3 Projected Profit and Loss
Please be sure to read note 8.1.1 in the Important Assumptions, section 8.1 regarding our Accounting system and methodology. The Projected Profit and Loss table takes into consideration all of the basic operating expenses for the Industrial Sales Division only.
When we produced the table, we developed our sales model around discount structures we had previously received while operating our previous distributorship. This distributorship directly represented and stocked many lines. For the purposes of the business plan’s projected sales portion of the P&L, we calculated our direct cost of goods sold using historical discount information. As we cannot anticipate our actual discount schedules from each vendor, we feel we can further reduce our direct costs of goods sold by an additional 15% – 20% once established as a direct distributor.
The projected table shows an average Gross Margin of 36%, but we feel we will be able to arrange much better terms. With this considered, the long term goal has not changed and is reflected in years 2006, and 2007. Please note the large jump in sales for year 2006; this is attributed to a large development of catalog clients. With consideration given to note 8.1.1, management feels it can produce a more robust corporation when all of the components of the business plan are combined.
Other considerations only partially considered in the P&L are the payroll for management and management’s output. The upper managements payroll is accounted for in the plan for the holding company, and work will be spread over the 3 divisions. Please remember when you do review the Profit and Loss statement, that the three JTB divisions will actually be operating under one roof. As such, management’s role will be to fill in all areas of sales and production wherever needed to complete orders.
Management’s operating schedule will also be overlapped to “keep our doors open” more operating hours than any of the other 9 to 5 competitors. Management anticipates running at least 50 hours per week, allowing us to develop more business on the west coast.


| Pro Forma Profit and Loss | |||||
| Year 1 | Year 2 | Year 3 | Year 4 | Year 5 | |
| Sales | $206,525 | $347,300 | $433,420 | $542,963 | $674,518 |
| Direct Cost of Sales | $128,259 | $212,185 | $263,461 | $315,420 | $407,383 |
| Production Payroll | $9,600 | $9,600 | $18,800 | $18,800 | $22,500 |
| Other Costs of Goods | $0 | $0 | $0 | $0 | $0 |
| Total Cost of Sales | $137,859 | $221,785 | $282,261 | $334,220 | $429,883 |
| Gross Margin | $68,666 | $125,515 | $151,159 | $208,743 | $244,635 |
| Gross Margin % | 33.25% | 36.14% | 34.88% | 38.45% | 36.27% |
| Operating Expenses | |||||
| Sales and Marketing Expenses | |||||
| Sales and Marketing Payroll | $39,000 | $44,000 | $59,500 | $66,000 | $71,500 |
| Advertising/Promotion | $3,000 | $4,800 | $4,800 | $4,800 | $4,800 |
| Other Sales and Marketing Expenses | $0 | $0 | $0 | $0 | $0 |
| Total Sales and Marketing Expenses | $42,000 | $48,800 | $64,300 | $70,800 | $76,300 |
| Sales and Marketing % | 20.34% | 14.05% | 14.84% | 13.04% | 11.31% |
| General and Administrative Expenses | |||||
| General and Administrative Payroll | $0 | $0 | $0 | $0 | $0 |
| Sales and Marketing and Other Expenses | $0 | $2,500 | $3,000 | $3,500 | $4,000 |
| Depreciation | $1,950 | $1,950 | $1,950 | $1,950 | $1,950 |
| Rent | $9,000 | $9,000 | $9,000 | $9,000 | $9,000 |
| Utilities | $4,100 | $4,800 | $5,600 | $6,000 | $6,500 |
| Insurance | $3,000 | $4,000 | $5,000 | $6,000 | $7,000 |
| Payroll Taxes | $6,570 | $9,405 | $12,750 | $14,400 | $16,200 |
| CPA – Accounting and Payroll | $3,600 | $3,800 | $4,000 | $4,000 | $4,000 |
| Other | $0 | $0 | $0 | $0 | $0 |
| Total General and Administrative Expenses | $28,220 | $35,455 | $41,300 | $44,850 | $48,650 |
| General and Administrative % | 13.66% | 10.21% | 9.53% | 8.26% | 7.21% |
| Other Expenses: | |||||
| Other Payroll | $0 | $0 | $0 | $0 | $0 |
| Consultants | $0 | $0 | $0 | $0 | $0 |
| Other Other Expenses | $0 | $0 | $0 | $0 | $0 |
| Total Other Expenses | $0 | $0 | $0 | $0 | $0 |
| Other % | 0.00% | 0.00% | 0.00% | 0.00% | 0.00% |
| Total Operating Expenses | $70,220 | $84,255 | $105,600 | $115,650 | $124,950 |
| Profit Before Interest and Taxes | ($1,554) | $41,260 | $45,559 | $93,093 | $119,685 |
| EBITDA | $396 | $43,210 | $47,509 | $95,043 | $121,635 |
| Interest Expense | $17,536 | $16,538 | $15,496 | $14,454 | $13,413 |
| Taxes Incurred | $0 | $7,417 | $9,019 | $23,592 | $31,882 |
| Net Profit | ($19,090) | $17,306 | $21,044 | $55,047 | $74,391 |
| Net Profit/Sales | -9.24% | 4.98% | 4.86% | 10.14% | 11.03% |
8.4 Projected Cash Flow
JTB’s projected cash flow reflects a strong cash balance throughout the plan, please remember when you review this table, it is for the Industrial Sales Division only.
When reviewing the projected cash flow, it is important to note that the largest growth in sales is from our catalog sales program, as this is not really segmented for review. Additional segmentation information can be found in the market segmentation table in section 4.1, and in the milestones section 5.6.
Purchasing operates on a cost plus scenario marking up services to be re-sold, similar to the services area of our Industrial Products and Services Division. As the cash flow projects only the base products described in the business plan, it is highly probable JTB will be involved with more outsourced products and manufacturer partnering in years 2 thru 5, furthering our potential profitability.

| Pro Forma Cash Flow | |||||
| Year 1 | Year 2 | Year 3 | Year 4 | Year 5 | |
| Cash Received | |||||
| Cash from Operations | |||||
| Cash Sales | $20,653 | $34,730 | $43,342 | $54,296 | $67,452 |
| Cash from Receivables | $147,150 | $286,175 | $373,931 | $468,128 | $582,400 |
| Subtotal Cash from Operations | $167,802 | $320,905 | $417,273 | $522,424 | $649,852 |
| Additional Cash Received | |||||
| Sales Tax, VAT, HST/GST Received | $0 | $0 | $0 | $0 | $0 |
| New Current Borrowing | $0 | $0 | $0 | $0 | $0 |
| New Other Liabilities (interest-free) | $0 | $0 | $0 | $0 | $0 |
| New Long-term Liabilities | $0 | $0 | $0 | $0 | $0 |
| Sales of Other Current Assets | $0 | $0 | $0 | $0 | $0 |
| Sales of Long-term Assets | $0 | $0 | $0 | $0 | $0 |
| New Investment Received | $0 | $0 | $0 | $0 | $0 |
| Subtotal Cash Received | $167,802 | $320,905 | $417,273 | $522,424 | $649,852 |
| Expenditures | Year 1 | Year 2 | Year 3 | Year 4 | Year 5 |
| Expenditures from Operations | |||||
| Cash Spending | $48,600 | $53,600 | $78,300 | $84,800 | $94,000 |
| Bill Payments | $162,310 | $287,556 | $337,505 | $408,226 | $511,084 |
| Subtotal Spent on Operations | $210,910 | $341,156 | $415,805 | $493,026 | $605,084 |
| Additional Cash Spent | |||||
| Sales Tax, VAT, HST/GST Paid Out | $0 | $0 | $0 | $0 | $0 |
| Principal Repayment of Current Borrowing | $0 | $0 | $0 | $0 | $0 |
| Other Liabilities Principal Repayment | $0 | $0 | $0 | $0 | $0 |
| Long-term Liabilities Principal Repayment | $10,416 | $10,416 | $10,416 | $10,416 | $10,416 |
| Purchase Other Current Assets | $0 | $0 | $0 | $0 | $0 |
| Purchase Long-term Assets | $0 | $0 | $0 | $0 | $0 |
| Dividends | $0 | $0 | $0 | $0 | $0 |
| Subtotal Cash Spent | $221,326 | $351,572 | $426,221 | $503,442 | $615,500 |
| Net Cash Flow | ($53,524) | ($30,667) | ($8,948) | $18,982 | $34,351 |
| Cash Balance | $62,076 | $31,408 | $22,460 | $41,442 | $75,794 |
8.5 Projected Balance Sheet
JTB’s projected balance sheet shows a strong cash development capability over the projected 5 year plan. The projected balance sheet, like the rest of the business plan, assumes the business remains at its startup location during the first five years of operations, keeping costs relatively fixed for the projections. Again, as mentioned in the Important Assumptions section 8.1, management still feels it can develop a stronger situation than what is reflected.
JTB’s Industrial Sales Division will maintain a stable cash position over the next five years while developing a positive net worth. As the Industrial Sales Division is essentially an office setting, there really is no need to develop large numbers of assets other than what is required at startup. During the life of the plan, inventory requirements may change as we offer our clients different purchasing options. Any differences in cash flow and inventory would show that the cash is tied up in inventory. With this in mind, we would try to keep the required inventory down to reasonable levels wherever possible.
| Pro Forma Balance Sheet | |||||
| Year 1 | Year 2 | Year 3 | Year 4 | Year 5 | |
| Assets | |||||
| Current Assets | |||||
| Cash | $62,076 | $31,408 | $22,460 | $41,442 | $75,794 |
| Accounts Receivable | $38,723 | $65,118 | $81,265 | $101,804 | $126,471 |
| Inventory | $29,852 | $41,361 | $51,356 | $64,336 | $79,924 |
| Other Current Assets | $5,500 | $5,500 | $5,500 | $5,500 | $5,500 |
| Total Current Assets | $136,150 | $143,387 | $160,582 | $213,082 | $287,688 |
| Long-term Assets | |||||
| Long-term Assets | $19,500 | $19,500 | $19,500 | $19,500 | $19,500 |
| Accumulated Depreciation | $1,950 | $3,900 | $5,850 | $7,800 | $9,750 |
| Total Long-term Assets | $17,550 | $15,600 | $13,650 | $11,700 | $9,750 |
| Total Assets | $153,700 | $158,987 | $174,232 | $224,782 | $297,438 |
| Liabilities and Capital | Year 1 | Year 2 | Year 3 | Year 4 | Year 5 |
| Current Liabilities | |||||
| Accounts Payable | $25,106 | $23,503 | $28,120 | $34,039 | $42,720 |
| Current Borrowing | $0 | $0 | $0 | $0 | $0 |
| Other Current Liabilities | $0 | $0 | $0 | $0 | $0 |
| Subtotal Current Liabilities | $25,106 | $23,503 | $28,120 | $34,039 | $42,720 |
| Long-term Liabilities | $170,584 | $160,168 | $149,752 | $139,336 | $128,920 |
| Total Liabilities | $195,690 | $183,671 | $177,872 | $173,375 | $171,640 |
| Paid-in Capital | $0 | $0 | $0 | $0 | $0 |
| Retained Earnings | ($22,900) | ($41,990) | ($24,684) | ($3,640) | $51,407 |
| Earnings | ($19,090) | $17,306 | $21,044 | $55,047 | $74,391 |
| Total Capital | ($41,990) | ($24,684) | ($3,640) | $51,407 | $125,798 |
| Total Liabilities and Capital | $153,700 | $158,987 | $174,232 | $224,782 | $297,438 |
| Net Worth | ($41,990) | ($24,684) | ($3,640) | $51,407 | $125,798 |
8.6 Business Ratios
Business ratios for the years of this plan are shown below. Industry profile ratios based on the Standard Industrial Classification (SIC) code 5961.9905, Catalog Sales, are shown for comparison.
JTB’s business ratios are compared to an established industry profile, our ratios differ in some areas as the industry profile ratios most likely is reflective of a complete business with a full overhead. Our ratios are lighter in overhead and assets, as most of the heavy assets are in our Industrial Products and Services Division, and are not shown in this divisions balance sheet.
Our sales growth is substantially greater as we are adding new products and services each year to the plan, and our Gross average margins of 36% are in line with the profile. Overall we feel our ratios are better than the industry as we have maximized our marketing budgets and marketing avenues while keeping costs in check. Further maximization comes in the form of training the sales staff on maintaining profit per order levels when processing orders. Our unique order processing makes for streamlined repeat ordering by customers further allowing our staff to process orders more efficiently, while reducing the internal costs of processing orders.
| Ratio Analysis | ||||||
| Year 1 | Year 2 | Year 3 | Year 4 | Year 5 | Industry Profile | |
| Sales Growth | 0.00% | 68.16% | 24.80% | 25.27% | 24.23% | 2.88% |
| Percent of Total Assets | ||||||
| Accounts Receivable | 25.19% | 40.96% | 46.64% | 45.29% | 42.52% | 12.87% |
| Inventory | 19.42% | 26.02% | 29.48% | 28.62% | 26.87% | 36.42% |
| Other Current Assets | 3.58% | 3.46% | 3.16% | 2.45% | 1.85% | 28.07% |
| Total Current Assets | 88.58% | 90.19% | 92.17% | 94.79% | 96.72% | 77.36% |
| Long-term Assets | 11.42% | 9.81% | 7.83% | 5.21% | 3.28% | 22.64% |
| Total Assets | 100.00% | 100.00% | 100.00% | 100.00% | 100.00% | 100.00% |
| Current Liabilities | 16.33% | 14.78% | 16.14% | 15.14% | 14.36% | 38.38% |
| Long-term Liabilities | 110.99% | 100.74% | 85.95% | 61.99% | 43.34% | 17.46% |
| Total Liabilities | 127.32% | 115.53% | 102.09% | 77.13% | 57.71% | 55.84% |
| Net Worth | -27.32% | -15.53% | -2.09% | 22.87% | 42.29% | 44.16% |
| Percent of Sales | ||||||
| Sales | 100.00% | 100.00% | 100.00% | 100.00% | 100.00% | 100.00% |
| Gross Margin | 33.25% | 36.14% | 34.88% | 38.45% | 36.27% | 41.33% |
| Selling, General & Administrative Expenses | 10.98% | 8.55% | 8.16% | 7.16% | 6.33% | 24.67% |
| Advertising Expenses | 12.20% | 10.45% | 12.64% | 11.75% | 10.87% | 2.06% |
| Profit Before Interest and Taxes | -0.75% | 11.88% | 10.51% | 17.15% | 17.74% | 1.22% |
| Main Ratios | ||||||
| Current | 5.42 | 6.10 | 5.71 | 6.26 | 6.73 | 1.75 |
| Quick | 4.23 | 4.34 | 3.88 | 4.37 | 4.86 | 0.70 |
| Total Debt to Total Assets | 127.32% | 115.53% | 102.09% | 77.13% | 57.71% | 62.87% |
| Pre-tax Return on Net Worth | 45.46% | -100.16% | -825.90% | 152.97% | 84.48% | 2.83% |
| Pre-tax Return on Assets | -12.42% | 15.55% | 17.25% | 34.98% | 35.73% | 7.62% |
| Additional Ratios | Year 1 | Year 2 | Year 3 | Year 4 | Year 5 | |
| Net Profit Margin | -9.24% | 4.98% | 4.86% | 10.14% | 11.03% | n.a |
| Return on Equity | 0.00% | 0.00% | 0.00% | 107.08% | 59.14% | n.a |
| Activity Ratios | ||||||
| Accounts Receivable Turnover | 4.80 | 4.80 | 4.80 | 4.80 | 4.80 | n.a |
| Collection Days | 40 | 61 | 68 | 68 | 69 | n.a |
| Inventory Turnover | 6.70 | 5.96 | 5.68 | 5.45 | 5.65 | n.a |
| Accounts Payable Turnover | 7.37 | 12.17 | 12.17 | 12.17 | 12.17 | n.a |
| Payment Days | 28 | 31 | 28 | 27 | 27 | n.a |
| Total Asset Turnover | 1.34 | 2.18 | 2.49 | 2.42 | 2.27 | n.a |
| Debt Ratios | ||||||
| Debt to Net Worth | 0.00 | 0.00 | 0.00 | 3.37 | 1.36 | n.a |
| Current Liab. to Liab. | 0.13 | 0.13 | 0.16 | 0.20 | 0.25 | n.a |
| Liquidity Ratios | ||||||
| Net Working Capital | $111,044 | $119,884 | $132,462 | $179,043 | $244,968 | n.a |
| Interest Coverage | -0.09 | 2.49 | 2.94 | 6.44 | 8.92 | n.a |
| Additional Ratios | ||||||
| Assets to Sales | 0.74 | 0.46 | 0.40 | 0.41 | 0.44 | n.a |
| Current Debt/Total Assets | 16% | 15% | 16% | 15% | 14% | n.a |
| Acid Test | 2.69 | 1.57 | 0.99 | 1.38 | 1.90 | n.a |
| Sales/Net Worth | 0.00 | 0.00 | 0.00 | 10.56 | 5.36 | n.a |
| Dividend Payout | 0.00 | 0.00 | 0.00 | 0.00 | 0.00 | n.a |
8.7 Long-term Plan
JTB’s Industrial Sales Division’s long term plan has been projected out to a 10 year review to highlight the businesses long term results, and the added potential of the manufacturing partnerships.
- Gross Sales over $800,000 by year 8 of this plan.
- Gross Margins over $280,000 by year 7 of this plan.
- Net Income over $100,000 by year 5 of this plan.
- Current Assets over $390,000 by year 5 of the plan.
- Equity of over $360,000 by year 7 of this plan.

Appendix
| Sales Forecast | |||||||||||||
| Month 1 | Month 2 | Month 3 | Month 4 | Month 5 | Month 6 | Month 7 | Month 8 | Month 9 | Month 10 | Month 11 | Month 12 | ||
| Sales | |||||||||||||
| Tooling | 0% | $400 | $600 | $800 | $1,500 | $1,900 | $2,100 | $2,600 | $2,850 | $3,100 | $3,210 | $3,460 | $3,800 |
| Commercial, Contractor, Utilities | 0% | $350 | $500 | $600 | $900 | $1,100 | $1,400 | $1,800 | $2,400 | $2,700 | $3,150 | $3,600 | $3,800 |
| Safety Products | 0% | $250 | $540 | $600 | $780 | $820 | $1,100 | $1,400 | $1,800 | $2,100 | $2,210 | $2,330 | $2,400 |
| Holding Products | 0% | $200 | $350 | $400 | $500 | $600 | $700 | $800 | $900 | $1,000 | $1,100 | $1,200 | $1,300 |
| Precision Measuring Products | 0% | $200 | $350 | $400 | $500 | $600 | $700 | $800 | $900 | $1,000 | $1,100 | $1,200 | $1,300 |
| Catalog Industrial Products | 0% | $700 | $1,400 | $2,800 | $5,400 | $6,800 | $7,900 | $10,200 | $11,800 | $12,700 | $14,100 | $15,100 | $16,300 |
| Specialty Purchased Components | 0% | $0 | $0 | $0 | $375 | $475 | $575 | $675 | $775 | $875 | $975 | $1,075 | $1,175 |
| Tool Related Services | 0% | $0 | $0 | $0 | $300 | $600 | $900 | $1,100 | $1,300 | $1,500 | $1,700 | $1,900 | $2,000 |
| Manufacturing Services | 0% | $0 | $0 | $0 | $0 | $0 | $0 | $0 | $0 | $0 | $0 | $0 | $0 |
| Manufacturing Partners | 0% | $0 | $0 | $0 | $0 | $0 | $0 | $0 | $0 | $0 | $0 | $0 | $0 |
| Military and Governmental | 0% | $0 | $0 | $0 | $0 | $0 | $0 | $0 | $0 | $0 | $0 | $0 | $0 |
| Total Sales | $2,100 | $3,740 | $5,600 | $10,255 | $12,895 | $15,375 | $19,375 | $22,725 | $24,975 | $27,545 | $29,865 | $32,075 | |
| Direct Cost of Sales | Month 1 | Month 2 | Month 3 | Month 4 | Month 5 | Month 6 | Month 7 | Month 8 | Month 9 | Month 10 | Month 11 | Month 12 | |
| Metal Cutting Tools | $240 | $360 | $480 | $900 | $1,140 | $1,260 | $1,560 | $1,710 | $1,860 | $1,926 | $2,076 | $2,280 | |
| Commercial, Contractor, Utilities | $210 | $300 | $360 | $540 | $660 | $840 | $1,080 | $1,440 | $1,620 | $1,890 | $2,160 | $2,280 | |
| Safety Products | $150 | $324 | $360 | $468 | $492 | $660 | $840 | $1,080 | $1,260 | $1,326 | $1,398 | $1,440 | |
| Work Holding Products | $120 | $210 | $240 | $300 | $360 | $420 | $480 | $540 | $600 | $660 | $720 | $780 | |
| Precision Measuring Products | $120 | $210 | $240 | $300 | $360 | $420 | $480 | $540 | $600 | $660 | $720 | $780 | |
| Catalog Industrial Products | $455 | $910 | $1,820 | $3,510 | $4,420 | $5,135 | $6,630 | $7,670 | $8,255 | $9,165 | $9,815 | $10,595 | |
| Specialty Puchased Components | $0 | $0 | $0 | $206 | $261 | $316 | $371 | $426 | $481 | $536 | $591 | $646 | |
| Cutting Tool related Services | $0 | $0 | $0 | $165 | $330 | $495 | $605 | $715 | $825 | $935 | $1,045 | $1,100 | |
| Channel Partner Services | $0 | $0 | $0 | $0 | $0 | $0 | $0 | $0 | $0 | $0 | $0 | $0 | |
| Internet Distributorships | $0 | $0 | $0 | $0 | $0 | $0 | $0 | $0 | $0 | $0 | $0 | $0 | |
| Military and Governmental | $0 | $0 | $0 | $0 | $0 | $0 | $0 | $0 | $0 | $0 | $0 | $0 | |
| Subtotal Direct Cost of Sales | $1,295 | $2,314 | $3,500 | $6,389 | $8,023 | $9,546 | $12,046 | $14,121 | $15,501 | $17,098 | $18,525 | $19,901 | |
| Personnel Plan | |||||||||||||
| Month 1 | Month 2 | Month 3 | Month 4 | Month 5 | Month 6 | Month 7 | Month 8 | Month 9 | Month 10 | Month 11 | Month 12 | ||
| Production Personnel | |||||||||||||
| Shipping and Receiving | $800 | $800 | $800 | $800 | $800 | $800 | $800 | $800 | $800 | $800 | $800 | $800 | |
| Name or Title or Group | $0 | $0 | $0 | $0 | $0 | $0 | $0 | $0 | $0 | $0 | $0 | $0 | |
| Subtotal | $800 | $800 | $800 | $800 | $800 | $800 | $800 | $800 | $800 | $800 | $800 | $800 | |
| Sales and Marketing Personnel | |||||||||||||
| Sales Team Leader | $2,500 | $2,500 | $2,500 | $2,500 | $2,500 | $2,500 | $2,500 | $2,500 | $2,500 | $2,500 | $2,500 | $2,500 | |
| Sales Associate | $0 | $0 | $900 | $900 | $900 | $900 | $900 | $900 | $900 | $900 | $900 | $900 | |
| Sales and Marketing Associate (shared) | $0 | $0 | $0 | $0 | $0 | $0 | $0 | $0 | $0 | $0 | $0 | $0 | |
| Subtotal | $2,500 | $2,500 | $3,400 | $3,400 | $3,400 | $3,400 | $3,400 | $3,400 | $3,400 | $3,400 | $3,400 | $3,400 | |
| General and Administrative Personnel | |||||||||||||
| Sales Manager | $0 | $0 | $0 | $0 | $0 | $0 | $0 | $0 | $0 | $0 | $0 | $0 | |
| Other | $0 | $0 | $0 | $0 | $0 | $0 | $0 | $0 | $0 | $0 | $0 | $0 | |
| Subtotal | $0 | $0 | $0 | $0 | $0 | $0 | $0 | $0 | $0 | $0 | $0 | $0 | |
| Other Personnel | |||||||||||||
| Name or Title | $0 | $0 | $0 | $0 | $0 | $0 | $0 | $0 | $0 | $0 | $0 | $0 | |
| Other | $0 | $0 | $0 | $0 | $0 | $0 | $0 | $0 | $0 | $0 | $0 | $0 | |
| Subtotal | $0 | $0 | $0 | $0 | $0 | $0 | $0 | $0 | $0 | $0 | $0 | $0 | |
| Total People | 2 | 2 | 3 | 3 | 3 | 3 | 3 | 3 | 3 | 3 | 3 | 3 | |
| Total Payroll | $3,300 | $3,300 | $4,200 | $4,200 | $4,200 | $4,200 | $4,200 | $4,200 | $4,200 | $4,200 | $4,200 | $4,200 | |
| General Assumptions | |||||||||||||
| Month 1 | Month 2 | Month 3 | Month 4 | Month 5 | Month 6 | Month 7 | Month 8 | Month 9 | Month 10 | Month 11 | Month 12 | ||
| Plan Month | 1 | 2 | 3 | 4 | 5 | 6 | 7 | 8 | 9 | 10 | 11 | 12 | |
| Current Interest Rate | Current Interest Rate | 10.00% | 10.00% | 10.00% | 10.00% | 10.00% | 10.00% | 10.00% | 10.00% | 10.00% | 10.00% | 10.00% | 10.00% |
| Long-term Interest Rate | Long-term Interest Rate | 10.00% | 10.00% | 10.00% | 10.00% | 10.00% | 10.00% | 10.00% | 10.00% | 10.00% | 10.00% | 10.00% | 10.00% |
| Tax Rate | Tax Rate | 30.00% | 30.00% | 30.00% | 30.00% | 30.00% | 30.00% | 30.00% | 30.00% | 30.00% | 30.00% | 30.00% | 30.00% |
| Other | 0 | 0 | 0 | 0 | 0 | 0 | 0 | 0 | 0 | 0 | 0 | 0 | |
| Pro Forma Profit and Loss | |||||||||||||
| Month 1 | Month 2 | Month 3 | Month 4 | Month 5 | Month 6 | Month 7 | Month 8 | Month 9 | Month 10 | Month 11 | Month 12 | ||
| Sales | $2,100 | $3,740 | $5,600 | $10,255 | $12,895 | $15,375 | $19,375 | $22,725 | $24,975 | $27,545 | $29,865 | $32,075 | |
| Direct Cost of Sales | $1,295 | $2,314 | $3,500 | $6,389 | $8,023 | $9,546 | $12,046 | $14,121 | $15,501 | $17,098 | $18,525 | $19,901 | |
| Production Payroll | $800 | $800 | $800 | $800 | $800 | $800 | $800 | $800 | $800 | $800 | $800 | $800 | |
| Other Costs of Goods | $0 | $0 | $0 | $0 | $0 | $0 | $0 | $0 | $0 | $0 | $0 | $0 | |
| Total Cost of Sales | $2,095 | $3,114 | $4,300 | $7,189 | $8,823 | $10,346 | $12,846 | $14,921 | $16,301 | $17,898 | $19,325 | $20,701 | |
| Gross Margin | $5 | $626 | $1,300 | $3,066 | $4,072 | $5,029 | $6,529 | $7,804 | $8,674 | $9,647 | $10,540 | $11,374 | |
| Gross Margin % | 0.24% | 16.74% | 23.21% | 29.90% | 31.58% | 32.71% | 33.70% | 34.34% | 34.73% | 35.02% | 35.29% | 35.46% | |
| Operating Expenses | |||||||||||||
| Sales and Marketing Expenses | |||||||||||||
| Sales and Marketing Payroll | $2,500 | $2,500 | $3,400 | $3,400 | $3,400 | $3,400 | $3,400 | $3,400 | $3,400 | $3,400 | $3,400 | $3,400 | |
| Advertising/Promotion | $0 | $200 | $200 | $200 | $300 | $300 | $300 | $300 | $300 | $300 | $300 | $300 | |
| Other Sales and Marketing Expenses | $0 | $0 | $0 | $0 | $0 | $0 | $0 | $0 | $0 | $0 | $0 | $0 | |
| Total Sales and Marketing Expenses | $2,500 | $2,700 | $3,600 | $3,600 | $3,700 | $3,700 | $3,700 | $3,700 | $3,700 | $3,700 | $3,700 | $3,700 | |
| Sales and Marketing % | 119.05% | 72.19% | 64.29% | 35.10% | 28.69% | 24.07% | 19.10% | 16.28% | 14.81% | 13.43% | 12.39% | 11.54% | |
| General and Administrative Expenses | |||||||||||||
| General and Administrative Payroll | $0 | $0 | $0 | $0 | $0 | $0 | $0 | $0 | $0 | $0 | $0 | $0 | |
| Sales and Marketing and Other Expenses | $0 | $0 | $0 | $0 | $0 | $0 | $0 | $0 | $0 | $0 | $0 | $0 | |
| Depreciation | $163 | $163 | $163 | $163 | $163 | $163 | $163 | $163 | $163 | $163 | $163 | $163 | |
| Rent | $750 | $750 | $750 | $750 | $750 | $750 | $750 | $750 | $750 | $750 | $750 | $750 | |
| Utilities | $300 | $300 | $300 | $300 | $300 | $300 | $300 | $400 | $400 | $400 | $400 | $400 | |
| Insurance | $250 | $250 | $250 | $250 | $250 | $250 | $250 | $250 | $250 | $250 | $250 | $250 | |
| Payroll Taxes | 15% | $270 | $450 | $585 | $585 | $585 | $585 | $585 | $585 | $585 | $585 | $585 | $585 |
| CPA – Accounting and Payroll | 15% | $300 | $300 | $300 | $300 | $300 | $300 | $300 | $300 | $300 | $300 | $300 | $300 |
| Other | $0 | $0 | $0 | $0 | $0 | $0 | $0 | $0 | $0 | $0 | $0 | $0 | |
| Total General and Administrative Expenses | $2,033 | $2,213 | $2,348 | $2,348 | $2,348 | $2,348 | $2,348 | $2,448 | $2,448 | $2,448 | $2,448 | $2,448 | |
| General and Administrative % | 96.79% | 59.16% | 41.92% | 22.89% | 18.20% | 15.27% | 12.12% | 10.77% | 9.80% | 8.89% | 8.20% | 7.63% | |
| Other Expenses: | |||||||||||||
| Other Payroll | $0 | $0 | $0 | $0 | $0 | $0 | $0 | $0 | $0 | $0 | $0 | $0 | |
| Consultants | $0 | $0 | $0 | $0 | $0 | $0 | $0 | $0 | $0 | $0 | $0 | $0 | |
| Other Other Expenses | $0 | $0 | $0 | $0 | $0 | $0 | $0 | $0 | $0 | $0 | $0 | $0 | |
| Total Other Expenses | $0 | $0 | $0 | $0 | $0 | $0 | $0 | $0 | $0 | $0 | $0 | $0 | |
| Other % | 0.00% | 0.00% | 0.00% | 0.00% | 0.00% | 0.00% | 0.00% | 0.00% | 0.00% | 0.00% | 0.00% | 0.00% | |
| Total Operating Expenses | $4,533 | $4,913 | $5,948 | $5,948 | $6,048 | $6,048 | $6,048 | $6,148 | $6,148 | $6,148 | $6,148 | $6,148 | |
| Profit Before Interest and Taxes | ($4,528) | ($4,287) | ($4,648) | ($2,882) | ($1,976) | ($1,019) | $482 | $1,657 | $2,527 | $3,500 | $4,393 | $5,227 | |
| EBITDA | ($4,365) | ($4,124) | ($4,485) | ($2,719) | ($1,813) | ($856) | $644 | $1,819 | $2,689 | $3,662 | $4,555 | $5,389 | |
| Interest Expense | $1,501 | $1,494 | $1,487 | $1,479 | $1,472 | $1,465 | $1,458 | $1,450 | $1,443 | $1,436 | $1,429 | $1,422 | |
| Taxes Incurred | $0 | $0 | $0 | $0 | $0 | $0 | $0 | $0 | $0 | $0 | $0 | $0 | |
| Net Profit | ($6,029) | ($5,780) | ($6,134) | ($4,361) | ($3,448) | ($2,483) | ($976) | $206 | $1,083 | $2,064 | $2,964 | $3,805 | |
| Net Profit/Sales | -287.08% | -154.56% | -109.54% | -42.52% | -26.74% | -16.15% | -5.04% | 0.91% | 4.34% | 7.49% | 9.92% | 11.86% | |
| Pro Forma Cash Flow | |||||||||||||
| Month 1 | Month 2 | Month 3 | Month 4 | Month 5 | Month 6 | Month 7 | Month 8 | Month 9 | Month 10 | Month 11 | Month 12 | ||
| Cash Received | |||||||||||||
| Cash from Operations | |||||||||||||
| Cash Sales | $210 | $374 | $560 | $1,026 | $1,290 | $1,538 | $1,938 | $2,273 | $2,498 | $2,755 | $2,987 | $3,208 | |
| Cash from Receivables | $0 | $1,197 | $2,825 | $4,426 | $7,693 | $10,734 | $13,019 | $16,118 | $19,347 | $21,735 | $23,942 | $26,113 | |
| Subtotal Cash from Operations | $210 | $1,571 | $3,385 | $5,452 | $8,983 | $12,272 | $14,957 | $18,390 | $21,845 | $24,490 | $26,929 | $29,320 | |
| Additional Cash Received | |||||||||||||
| Sales Tax, VAT, HST/GST Received | 0.00% | $0 | $0 | $0 | $0 | $0 | $0 | $0 | $0 | $0 | $0 | $0 | $0 |
| New Current Borrowing | $0 | $0 | $0 | $0 | $0 | $0 | $0 | $0 | $0 | $0 | $0 | $0 | |
| New Other Liabilities (interest-free) | $0 | $0 | $0 | $0 | $0 | $0 | $0 | $0 | $0 | $0 | $0 | $0 | |
| New Long-term Liabilities | $0 | $0 | $0 | $0 | $0 | $0 | $0 | $0 | $0 | $0 | $0 | $0 | |
| Sales of Other Current Assets | $0 | $0 | $0 | $0 | $0 | $0 | $0 | $0 | $0 | $0 | $0 | $0 | |
| Sales of Long-term Assets | $0 | $0 | $0 | $0 | $0 | $0 | $0 | $0 | $0 | $0 | $0 | $0 | |
| New Investment Received | $0 | $0 | $0 | $0 | $0 | $0 | $0 | $0 | $0 | $0 | $0 | $0 | |
| Subtotal Cash Received | $210 | $1,571 | $3,385 | $5,452 | $8,983 | $12,272 | $14,957 | $18,390 | $21,845 | $24,490 | $26,929 | $29,320 | |
| Expenditures | Month 1 | Month 2 | Month 3 | Month 4 | Month 5 | Month 6 | Month 7 | Month 8 | Month 9 | Month 10 | Month 11 | Month 12 | |
| Expenditures from Operations | |||||||||||||
| Cash Spending | $3,300 | $3,300 | $4,200 | $4,200 | $4,200 | $4,200 | $4,200 | $4,200 | $4,200 | $4,200 | $4,200 | $4,200 | |
| Bill Payments | $2,612 | $3,384 | $3,748 | $3,974 | $7,195 | $14,476 | $15,912 | $19,790 | $21,280 | $21,663 | $23,553 | $24,722 | |
| Subtotal Spent on Operations | $5,912 | $6,684 | $7,948 | $8,174 | $11,395 | $18,676 | $20,112 | $23,990 | $25,480 | $25,863 | $27,753 | $28,922 | |
| Additional Cash Spent | |||||||||||||
| Sales Tax, VAT, HST/GST Paid Out | $0 | $0 | $0 | $0 | $0 | $0 | $0 | $0 | $0 | $0 | $0 | $0 | |
| Principal Repayment of Current Borrowing | $0 | $0 | $0 | $0 | $0 | $0 | $0 | $0 | $0 | $0 | $0 | $0 | |
| Other Liabilities Principal Repayment | $0 | $0 | $0 | $0 | $0 | $0 | $0 | $0 | $0 | $0 | $0 | $0 | |
| Long-term Liabilities Principal Repayment | $868 | $868 | $868 | $868 | $868 | $868 | $868 | $868 | $868 | $868 | $868 | $868 | |
| Purchase Other Current Assets | $0 | $0 | $0 | $0 | $0 | $0 | $0 | $0 | $0 | $0 | $0 | $0 | |
| Purchase Long-term Assets | $0 | $0 | $0 | $0 | $0 | $0 | $0 | $0 | $0 | $0 | $0 | $0 | |
| Dividends | $0 | $0 | $0 | $0 | $0 | $0 | $0 | $0 | $0 | $0 | $0 | $0 | |
| Subtotal Cash Spent | $6,780 | $7,552 | $8,816 | $9,042 | $12,263 | $19,544 | $20,980 | $24,858 | $26,348 | $26,731 | $28,621 | $29,790 | |
| Net Cash Flow | ($6,570) | ($5,981) | ($5,431) | ($3,590) | ($3,281) | ($7,272) | ($6,024) | ($6,468) | ($4,503) | ($2,242) | ($1,692) | ($470) | |
| Cash Balance | $109,030 | $103,049 | $97,618 | $94,027 | $90,747 | $83,474 | $77,451 | $70,983 | $66,480 | $64,238 | $62,546 | $62,076 | |
| Pro Forma Balance Sheet | |||||||||||||
| Month 1 | Month 2 | Month 3 | Month 4 | Month 5 | Month 6 | Month 7 | Month 8 | Month 9 | Month 10 | Month 11 | Month 12 | ||
| Assets | Starting Balances | ||||||||||||
| Current Assets | |||||||||||||
| Cash | $115,600 | $109,030 | $103,049 | $97,618 | $94,027 | $90,747 | $83,474 | $77,451 | $70,983 | $66,480 | $64,238 | $62,546 | $62,076 |
| Accounts Receivable | $0 | $1,890 | $4,059 | $6,274 | $11,078 | $14,990 | $18,093 | $22,511 | $26,846 | $29,977 | $33,032 | $35,968 | $38,723 |
| Inventory | $20,000 | $18,705 | $16,391 | $12,891 | $9,584 | $12,035 | $14,319 | $18,069 | $21,182 | $23,252 | $25,647 | $27,788 | $29,852 |
| Other Current Assets | $5,500 | $5,500 | $5,500 | $5,500 | $5,500 | $5,500 | $5,500 | $5,500 | $5,500 | $5,500 | $5,500 | $5,500 | $5,500 |
| Total Current Assets | $141,100 | $135,125 | $128,999 | $122,283 | $120,188 | $123,271 | $121,386 | $123,531 | $124,511 | $125,208 | $128,417 | $131,801 | $136,150 |
| Long-term Assets | |||||||||||||
| Long-term Assets | $19,500 | $19,500 | $19,500 | $19,500 | $19,500 | $19,500 | $19,500 | $19,500 | $19,500 | $19,500 | $19,500 | $19,500 | $19,500 |
| Accumulated Depreciation | $0 | $163 | $325 | $488 | $650 | $813 | $975 | $1,138 | $1,300 | $1,463 | $1,625 | $1,788 | $1,950 |
| Total Long-term Assets | $19,500 | $19,338 | $19,175 | $19,013 | $18,850 | $18,688 | $18,525 | $18,363 | $18,200 | $18,038 | $17,875 | $17,713 | $17,550 |
| Total Assets | $160,600 | $154,462 | $148,174 | $141,295 | $139,038 | $141,958 | $139,911 | $141,893 | $142,711 | $143,245 | $146,292 | $149,514 | $153,700 |
| Liabilities and Capital | Month 1 | Month 2 | Month 3 | Month 4 | Month 5 | Month 6 | Month 7 | Month 8 | Month 9 | Month 10 | Month 11 | Month 12 | |
| Current Liabilities | |||||||||||||
| Accounts Payable | $2,500 | $3,259 | $3,619 | $3,743 | $6,714 | $13,950 | $15,254 | $19,081 | $20,560 | $20,879 | $22,731 | $23,857 | $25,106 |
| Current Borrowing | $0 | $0 | $0 | $0 | $0 | $0 | $0 | $0 | $0 | $0 | $0 | $0 | $0 |
| Other Current Liabilities | $0 | $0 | $0 | $0 | $0 | $0 | $0 | $0 | $0 | $0 | $0 | $0 | $0 |
| Subtotal Current Liabilities | $2,500 | $3,259 | $3,619 | $3,743 | $6,714 | $13,950 | $15,254 | $19,081 | $20,560 | $20,879 | $22,731 | $23,857 | $25,106 |
| Long-term Liabilities | $181,000 | $180,132 | $179,264 | $178,396 | $177,528 | $176,660 | $175,792 | $174,924 | $174,056 | $173,188 | $172,320 | $171,452 | $170,584 |
| Total Liabilities | $183,500 | $183,391 | $182,883 | $182,139 | $184,242 | $190,610 | $191,046 | $194,005 | $194,616 | $194,067 | $195,051 | $195,309 | $195,690 |
| Paid-in Capital | $0 | $0 | $0 | $0 | $0 | $0 | $0 | $0 | $0 | $0 | $0 | $0 | $0 |
| Retained Earnings | ($22,900) | ($22,900) | ($22,900) | ($22,900) | ($22,900) | ($22,900) | ($22,900) | ($22,900) | ($22,900) | ($22,900) | ($22,900) | ($22,900) | ($22,900) |
| Earnings | $0 | ($6,029) | ($11,809) | ($17,943) | ($22,304) | ($25,752) | ($28,235) | ($29,211) | ($29,005) | ($27,922) | ($25,859) | ($22,895) | ($19,090) |
| Total Capital | ($22,900) | ($28,929) | ($34,709) | ($40,843) | ($45,204) | ($48,652) | ($51,135) | ($52,111) | ($51,905) | ($50,822) | ($48,759) | ($45,795) | ($41,990) |
| Total Liabilities and Capital | $160,600 | $154,462 | $148,174 | $141,295 | $139,038 | $141,958 | $139,911 | $141,893 | $142,711 | $143,245 | $146,292 | $149,514 | $153,700 |
| Net Worth | ($22,900) | ($28,929) | ($34,709) | ($40,843) | ($45,204) | ($48,652) | ($51,135) | ($52,111) | ($51,905) | ($50,822) | ($48,758) | ($45,795) | ($41,990) |
| Long-term | ||||||||||
| Year 1 | Year 2 | Year 3 | Year 4 | Year 5 | Year 6 | Year 7 | Year 8 | Year 9 | Year 10 | |
| Sales | $206,525 | $347,300 | $433,420 | $542,963 | $674,518 | $714,989 | $787,898 | $811,234 | $841,790 | $877,349 |
| Cost of Sales | $137,859 | $221,785 | $282,261 | $334,220 | $429,883 | $455,448 | $501,891 | $516,756 | $536,220 | $558,871 |
| Gross Margin | $68,666 | $125,515 | $151,159 | $208,743 | $244,635 | $259,541 | $286,007 | $294,478 | $305,570 | $318,478 |
| Gross Margin % | 33.25% | 36.14% | 34.88% | 38.45% | 36.27% | 36.30% | 36.30% | 36.30% | 36.30% | 36.30% |
| Operating Expenses | $70,220 | $84,255 | $105,600 | $115,650 | $124,950 | $136,196 | $148,453 | $161,814 | $176,377 | $192,251 |
| Operating Income | ($1,554) | $41,260 | $45,559 | $93,093 | $119,685 | $123,346 | $137,554 | $132,664 | $129,193 | $126,227 |
| Net Income | ($19,090) | $17,306 | $21,044 | $55,047 | $74,391 | $109,778 | $122,423 | $118,071 | $114,981 | $112,342 |
| Current Assets | $136,150 | $143,387 | $160,582 | $213,082 | $287,688 | $373,994 | $411,394 | $452,533 | $497,787 | $547,565 |
| Long-term Assets | $17,550 | $15,600 | $13,650 | $11,700 | $9,750 | $7,800 | $5,850 | $3,900 | $1,950 | $0 |
| Current Liabilities | $25,106 | $23,503 | $28,120 | $34,039 | $42,720 | $80,235 | $92,270 | $103,342 | $118,326 | $137,258 |
| Long-term Liabilities | $170,584 | $160,168 | $149,752 | $139,336 | $128,920 | $118,504 | $108,088 | $97,672 | $87,256 | $76,840 |
| Equity | ($41,990) | ($24,684) | ($3,640) | $51,407 | $125,798 | $183,055 | $216,886 | $255,419 | $294,155 | $333,467 |


