
Silvera and Sons
Executive Summary
Silvera & Sons prepares green Arabica coffee beans grown in Brazil for exportation to American specialty roasters and sells to wholesalers on the Brazilian market. We will expand production capacity from 72,000/60kg bags per year to 120-160,000/60kg per year. Our coffee stands out from that of the competition. We prepare the top five percent, in terms of quality standards, of all Arabica beans on the market. Our customers seek this product as it provides them with a point of differentiation to specialty roasters. In the past six years, demand for our coffee has exceeded the amount we are able to supply and we have been forced to refuse requests for larger shipments.
We predict growth of thirty percent in the first year with sales exceeding ($BRL) expectations. In year three the plant will run at maximum capacity and based on the current price of coffee we expect excellent profits ($BRL). We have positive indicators from current importers that the additional amount of beans will be sold.
Our keys to success are:
- Establishing and maintaining working relationships and contractual agreements with American importers and Brazilian coffee brokers and wholesalers.
- Bringing the new facility to maximum production within three years of operation.
- Increasing our profit margin with the use of improved technology in the new facility.
- Effectively communicating to current and potential customers, through targeted efforts, our position as a differentiated provider of the highest quality Arabica beans in the world.

1.1 Objectives
The objectives of Silvera & Sons:
- Increase production and sale from 78,000/60kg bags per year to approximately 100,000/60kg bags per year in the first year of operation at the proposed facility and reach maximum capacity of 120,000/60kg bags per year by year three.
- Increase sales substantially in the first full year of operation.
- Establish strategic relationships with 10-15 American importers in Los Angeles, San Francisco, & Seattle.
- Increase gross margins in the next three years.
1.2 Mission
Silvera & Sons Ltda seeks to serve coffee importers and enthusiasts by exceeding minimum acceptable quality standards and by providing the highest quality product at the lowest possible price. We value our relationships with current and future customers and hope to communicate our appreciation to them through our outstanding, guaranteed product quality, personal service, and efficient delivery. Our commitment to our customers and the country of Brazil will be reflected through honest and responsible business.
1.3 Keys to Success
The keys to success for Silvera & Sons are:
- Establishing and maintaining working relationships and contractual agreements with American importers and Brazilian coffee brokers and wholesalers.
- Bringing the new facility to maximum production within three years of operation.
- Increasing our profit margin with the use of improved technology in the new facility.
- Effectively communicating, to current and potential customers, our position as a differentiated provider of the highest quality Arabica beans in the world.
Company Summary
Silvera & Sons buys and prepares raw coffee in parchment (pergamino), or coffee in its post-harvest stage. The finished product, green Arabica coffee beans are packaged in 60kg sacks and sold on the U.S. and Brazilian market. Our customers are primarily American importers and Brazilian wholesalers who provide high-quality beans to the specialty roasting market.
2.1 Company Ownership
Silvera & Sons Ltda. is a private, family owned preparer and exporter of Brazilian-grown, green Arabica coffee beans. It is owned and operated by Marco Silvera Sr. and his sons, Marco Silvera Jr. and Antonio Silvera.
2.2 Company History
Silvera & Sons is in its sixth year of operation. The current plant has been in operation for 15 years and for 12 of those years was managed by Marco Silvera Sr. who was then an employee of the former owner, Cafe Fina. Since the plant was purchased, Silvera & Sons has maintained maximum production and sales. It is currently operating at maximum capacity.

| Past Performance | |||
| 1996 | 1997 | 1998 | |
| Sales | $16,262,532 | $17,304,066 | $18,345,600 |
| Gross Margin | $2,439,380 | $2,630,218 | $2,814,215 |
| Gross Margin % | 15.00% | 15.20% | 15.34% |
| Operating Expenses | $12,196,899 | $12,631,968 | $13,346,424 |
| Inventory Turnover | 12.00 | 12.00 | 12.00 |
| Balance Sheet | |||
| 1996 | 1997 | 1998 | |
| Current Assets | |||
| Cash | $0 | $0 | $994,260 |
| Inventory | $0 | $0 | $355,200 |
| Other Current Assets | $0 | $0 | $243,936 |
| Total Current Assets | $0 | $0 | $1,593,396 |
| Long-term Assets | |||
| Long-term Assets | $0 | $0 | $521,650 |
| Accumulated Depreciation | $0 | $0 | $100,000 |
| Total Long-term Assets | $0 | $0 | $421,650 |
| Total Assets | $0 | $0 | $2,015,046 |
| Current Liabilities | |||
| Accounts Payable | $0 | $0 | $8,435 |
| Current Borrowing | $0 | $0 | $58,000 |
| Other Current Liabilities (interest free) | $0 | $0 | $0 |
| Total Current Liabilities | $0 | $0 | $66,435 |
| Long-term Liabilities | $0 | $0 | $402,000 |
| Total Liabilities | $0 | $0 | $468,435 |
| Paid-in Capital | $0 | $0 | $525,000 |
| Retained Earnings | $0 | $0 | $85,985 |
| Earnings | $0 | $0 | $935,626 |
| Total Capital | $0 | $0 | $1,546,611 |
| Total Capital and Liabilities | $0 | $0 | $2,015,046 |
| Other Inputs | |||
| Payment Days | 0 | 0 | 60 |
2.3 Company Locations and Facilities
The Silvera & Son’s main warehouse and office is located in Ouro Fino. The warehouse has the capacity to prepare approximately 6,000 60kg bags of exportable coffee beans. The proposed new warehouse and preparation facility site is also located in Ouro Fino. The new facility will be 3.500m2 and will have 30 selecting machines with capacity to prepare 40,000 bags for exportation and 80,000 bags for storage. The proposed facility will also handle shipping.
Products
Silvera & Sons deal exclusively in green coffee, grown in the southern states of Brazil and one-hundred percent Arabica. Beans in parchment are purchased directly from growers and are de-husked and packaged into 60kg sacks in the Silvera & Sons’ plant. The final product is suitable for sale and exportation.
3.1 Competitive Comparison
In order to differentiate our product, coffee, which is a commodity, from the product offering of competitors, all beans are guaranteed fresh and are shipped within seven days of preparation. In addition all beans are sorted at ninety-five percent screen 18 and above compared to the industry standard ninety percent screen of 17 and above. The beans shipped by Silvera & Sons are therefore larger than most and are guaranteed fresh. In addition, all of the farms from which Silvera & Sons purchases coffee adhere to environmentally sound farming practices and avoid the use of pesticides and chemicals in crop production.
There are approximately ten competitors who offer a product similar to ours. Our research indicates that with the additional capacity we would become one of the top four, in terms of quantity, providers. We have the advantage of established distribution channels and reputation. In addition, improvements to our marketing efforts will further separate us from the larger market and from our close competitors.
3.2 Sales Literature
Silvera & Sons currently works with two importers in the United States who handle all of our shipments. Likewise, we have dealt with the same Brazilian wholesalers, for internal sales, each year. Sales to this point have been handled through personal selling. Additional sales literature will include a website, direct mail to specialty roasters and importers, and print advertising in several trade publications including Coffee Times, a monthly publication which targets American business dealing with issues relevant to the coffee industry.
3.3 Sourcing
Both the existing and the proposed facilities are ideally located in Ouro Fino, in the state of Minas Gerais. Minas Gerais is the largest coffee producing state in Brazil and beans produced in the region are of the highest quality. With additional financing, we would be able to buy larger volumes at lower prices. We now buy from one or more of six private growers or grower cooperatives. Contracts are secured six months in advance of harvest.
3.4 Technology
Improvements in technology will include the use of partially automated selecting machines which will allow for increased production capacity with a lower machine-to-operator ratio than we currently employ. Additional storage capabilities will decrease shipping charges and will reduce the need for permanent shipping employees by thirty-five percent. High-technology information system upgrades will improve all aspects of business, especially inventory control, tracking of shipments, and communication with clients in import countries.

3.5 Future Products
Alternative to the Arabica bean, Coffea Robusta, though it shares some similarities with the Arabica bean, is very different. Coffea Robusta is grown at lower elevations and has a higher yield per plant as well as being more resistant to disease. It also has up to twice the caffeine level as it’s cousin the Arabica Bean. Due to the lower cost and larger market amount of Robusta coffee, it is found primarily on supermarket shelves. The Arabica species grows at much higher elevations, better soil rich areas, and is the source of the worlds finest coffees.
By providing the finest species of coffee, Silvera & Sons has taken the first step towards a differentiated product. To further distinguish our coffee, we adhere to higher quality standards than approximately ninety-five percent of the market. In addition, all of our beans are of the Bourbon Santos variety. The “Bourbon” strain is considered one of the finest Brazil has to offer. It is grown in the mountains surrounding Sao Paulo and is highly sought after by specialty roasters from around the world. We have assumed the position of a specialized provider of this exceptional coffee. Our customers, American and Brazilian specialty roasters, recognize Silvera & Sons for our ability to provide the type of beans they require to produce award winning coffee.
Market Analysis Summary
Coffee is the second largest commodity market next to oil and Brazil has remained the largest producer of coffee in the world for two centuries. Imports of Arabica coffee in the United States have increased ninety-four percent in the past five years and consumption of coffee within Brazil has seen similar increases. In addition, demand for green coffee is above the market clearing level, and market price and crop yield estimates are at an all time high.
The increase in the number of independent specialty roasters in the United States and Brazil has contributed to and is an indicator of the increased demand for coffee. Within the larger coffee market is our target market is the specialty roaster. These discerning customers want the highest quality coffee beans. They serve the growing “gourmet” coffee market and are represented by large American companies like Starbucks and thousands of smaller specialty roasters. The Arabica bean is considered to be the best in the world and as such, the demand for Arabica beans is high on the specialty roaster market. Specialty roasters are willing to pay more for Arabica beans and attempt to distinguish themselves via the characteristics of the bean they use i.e. the location in which it was grown, farming methods, bean size, etc. The final consumer is relatively price insensitive if the coffee is good, has won awards, or is compatible with a popular trend. We estimate that specialty roasting in the U.S. alone is a ($USD) one-billion market.
4.1 Market Segmentation
The potential customer groups for Silvera & Sons are:
- American importers of green Arabica beans: Market research suggests that there are approximately 200 importers of green Arabica coffee on the West and East Coasts of the United States that would be able to handle the quantities of our shipments and are in our target market . Combined, they import a total of four to five million/60kg bags of Brazilian coffee per year.
- Brazilian green coffee wholesalers: This market serves as a safety valve for our export business. By maintaining relationships with Brazilian wholesalers we have an alternative market with established distribution channels.
- Brazilian specialty roasters: As we move towards maximum capacity we will plan to more aggressively target this audience. We hope to eventually reduce transactions with wholesalers and capture their value-added costs as profit. We anticipate that this effort will begin approximately four years into operation of the new facility.

| Market Analysis | |||||||
| 1999 | 2000 | 2001 | 2002 | 2003 | |||
| Potential Customers | Growth | CAGR | |||||
| U.S. Importers (60kg bags) | 26% | 70,140 | 88,376 | 111,354 | 140,306 | 176,786 | 26.00% |
| Brazilian Wholesalers (60kg bags) | 26% | 30,060 | 37,876 | 47,724 | 60,132 | 75,766 | 26.00% |
| Total | 26.00% | 100,200 | 126,252 | 159,078 | 200,438 | 252,552 | 26.00% |
4.2 Industry Analysis
Coffee has been a growing industry for the past five years. The most notable growth has been in the American market where imports have increased almost one-hundred percent and the market price has nearly doubled. The number of specialty roasters has increased from a handful of well known companies to thousands of independent entities. There is a constant struggle within this market to produce the best coffee and serve one or more niches within the larger market. Brazilian coffee producers and exporters have made great efforts to improve agricultural techniques, processing methods, and distribution in order to better serve this growing market. Demand for Brazilian coffee is currently greater than supply.
4.2.1 Competition and Buying Patterns
The purchase decision for our customer is based on trust in our process and bean selection. We have established relationships with our customers which extend beyond that of the buyer/seller. The Silvera & Sons label means that the product has been chosen and prepared with the highest quality standards in mind. Our beans are priced up to nine percent higher than similar products. Our customers are willing to pay more for our product because they are familiar with us and trust in the quality of our beans. This is the result of their success in the marketplace with our product.
4.2.2 Main Competitors
There are approximately 150 exporters of green Arabica beans in Brazil. According to the Brazilian Coffee Exporters Association, ABECAFE, fifty percent (50%) of all green coffee exports come from their 45 members. Approximately eighty percent (80%) of these exports come from 20 ABECAFE members. Market contributions of individual exporters are held in strict confidence and are not available to the public. However, based on this information and given the large number of remaining exporters not affiliated with ABECAFE who account for the remaining sixty percent (60%) of all exports, we assume that many of the largest competitors are amongst the ABECAFE members. They are:
| Agro Food | Cooxupe | Mitsui Alimentos |
| Allcoffee | Cotia Trading | Nicchio Cafe |
| Bramazonia | Custudio Forzza | Nova America |
| Cafe do Ponto | Esteve | N.S. da Guia |
| Cafeeira Carolina | Eurobrasil | Ottoni & Filhos |
| Cargill Agricola | Fazenda da Serra | Porto de Santos |
| Casas Sendas | Guaxupe | Ref. Oleos Brasil |
| Cocam | Inter-Continental | R & G |
| Comexim | JR Exportadora | Rio Doce |
| Comercial Ben. | MC Coffee | Tres Coracoes |
| Compel | Melitta | Volcafe |
4.2.3 Industry Participants
Silvera & Sons deals exclusively in the exportation and sale of green Arabica beans. There are approximately 150 Brazilian businesses in this market. However, approximately 30 companies account for approximately eighty percent of the total amount of green Arabica exports. In addition many of these companies prepare, export and sell, to the Brazilian market, other coffee products. Additional products include:
- Green Robusta (Conillon) beans: The Robusta bean is produced in far less quantity, in Brazil, than the Arabica and is considered an inferior species. The Robusta market represents less than ten percent of all coffee produced in Brazil.
- Soluble coffee products: These are instant (water soluble) coffees and are either decaffeinated or not. Sales of soluble coffee products account for approximately twelve percent of the total market.
- Roasted & Ground coffee: Approximately eighty-five percent of all roasted and ground coffee (decaffeinated and non-decaffeinated) goes to internal consumption and represents approximately twenty-seven percent of the total coffee market.
- Primary competitors include: Golden Brazil, Bramazonia, Comexim, and Nicchio Cafe.
4.2.4 Distribution Patterns
All of the coffee produced for exportation by Silvera & Sons and approximately eighty-five percent of all coffee produced for exportation in Brazil is shipped from Porto de Santos. Prepared coffee is shipped via rail and/or truck from the Silvera & Sons plant in Ouro Fino to Porto de Santos. From the port it is then shipped, in 40 foot containers to the port of Miami via cargo ship. Distribution charges are assumed by Silvera & Sons up to the arrival of the shipments in Miami whereupon importers assume responsibility, as detailed in contract, of the shipment and additional distribution charges.
Strategy and Implementation Summary
Silvera & Sons strategy is to expand production capabilities in order to fulfill the requests of importers with whom we currently deal for larger orders which we are unable to currently fulfill. In addition Silvera & Sons seeks to establish additional contracts with importers on the West Coast of the United States and increase the volume of green coffee sold on the Brazilian market. We intend to first maximize quantity of coffee sold within existing channels and second, establish additional accounts through targeted marketing efforts.
5.1 Competitive Edge
Silvera & Sons competitive edge comes from the advantage of having established relationships with American importers, and Brazilian coffee growers, green coffee brokers and wholesalers. Silvera & Sons has received affirmation of the demand for their product in the form of requests from importers for larger product shipments. Ours is a superior product offering because of the larger average size of the bean and because we purchase from growers who rely on the use of chemicals and pesticides less than two percent of the time. In addition, prompt preparation and shipment provides importers with a product that is up to one month fresher than beans sold by many exporters.
5.2 Strategy Pyramid
Our main strategy is to communicate the unique and desired attributes of our coffee to larger segments of the American and Brazilian markets. We sell a superior product, yet one that can be considered a commodity. It is therefore important that we effectively communicate the unique aspects which make it ideally suited for a niche market.
The unique aspects of our products include superior product selection and preparation, quality assurance, and efficient distribution. These are things we have done since we started doing business. The tactics we will use to communicate these strengths include, personal selling, targeted print advertising, and improved communication capabilities via information system improvements and a sophisticated website.
As tactics below the pyramid, we have identified three specialty publication in the United States and two in Brazil in which we will run print ads. We also plan to increase personal selling efforts to additional American importers. Part of the personal selling will include invitations to importers to visit our facilities, at our expense.
5.3 Marketing Strategy
Silvera & Sons marketing strategy will include the use of targeted print media advertising and direct selling to importers in the United States who provide green coffee to specialty roasters. We will capitalize on existing relationships with importers who have stated their willingness to contact West Coast affiliates and recommend Silvera & Sons coffee. We have positioned ourselves as a differentiated provider of the highest quality Arabica beans. The primary goal of all marketing efforts will be to communicate this to existing and potential customers.
5.3.1 Promotion Strategy
Relationships are key to success in the export business. Importers in Florida have on several occasions visited the Silvera & Sons facility, family home, and farms from which coffee is purchased. Additional accounts and contacts with West Coast importers have all been established and maintained through personal contact. Personal selling will remain our most important means of promotion. Marco Silvera Jr. will continue to lead this effort. In addition to personal selling Silvera & Sons has identified several specialty publications within which print advertisements will run. Direct mail, in the form of personal letters will also be used to communicate with existing and potential clients. Our budget for promotion activities is as follows:
- Personal Selling which includes phone expenses, travel for Silvera & Sons employees and for importers who we invite to Brazil: ($BRL) 35,000 annually.
- Print Advertising in three specialty publications and direct mail: ($BRL) 12,000 monthly.
- World Wide Web presence: ($BRL) 125,000 to produce a new site and $2,500 annually to maintain the site.
5.3.2 Distribution Strategy
Distribution is one of the greatest challenges faced by Silvera & Sons. The distribution system of Brazil is largely outdated and inefficient. Moreover, taxes, specifically excise taxes are high. Distribution costs for internal sales are absorbed by the customer but distribution costs for exports are absorbed by us. Increasing the volume of our exports makes us eligible to receive reduced fees and helps ensure that trucks and rail cars are running at maximum capacity.
5.3.3 Marketing Programs
Our most important marketing program is an increase in personal selling combined with targeted direct mail and print advertising. Marco Silvera Jr. will be responsible, with a budget of ($BRL) 35,000 and a milestone date of May 30, 1999. The program is intended to establish contractual agreements with 10 additional importers, increase brand awareness of our product in the United States, and communicate our position as a provider of the highest quality green Arabica beans on the market.
Another key marketing program is the development of a sophisticated Website. The goal of this program is to increase our presence on the world wide web and provide additional means of communication and customer data collection. The website will cost ($BRL) 125,000.
5.3.4 Positioning Statement
For American importers of Brazilian coffee who use our coffee to supply specialty roasters, Silvera & Sons coffee beans are the highest quality and largest beans available. Unlike many exporters, our beans exceed the minimum acceptable quality standards and are shipped within one week of preparation to ensure the largest and freshest beans on the market. Our products are perfectly suited for the specialty roasting market which constantly strives to offer award winning coffee.
5.3.5 Pricing Strategy
Because Silvera & Sons adheres to higher quality standards, the price of our coffee is slightly higher (four to nine percent) than the market average. The import market largely determines the price of imported coffee in the United States. Beans that do not meet Silvera & Sons quality standards are resold on the Brazilian market at the current market price. Green coffee, on the import market, now sells for US$ 213.56/60kg bag. According to Silvera & Sons pricing strategy, Silvera & Sons coffee would sell for approximately US$ 224/60kg bag. Importers have to this point been willing to pay the additional cost.
5.4 Sales Strategy
Silvera & Sons strategy focuses first on meeting the increased demand from importers with whom we have established relationships for larger orders. These importers are critical to our ability to acquire additional accounts on both the East and West coasts of the United States without having to spend a great deal on sales efforts. Secondly we will focus on increasing the volume, while maintaining the percentage of sales, of beans sold to the internal Brazilian market. When we have reached maximum sales to existing channels we can then shift the majority of our focus to securing additional import accounts.
5.4.1 Sales Forecast
The following chart and table show our present sales forecast. We project healthy growth in sales in 1999, a slightly smaller increase again in 2000, and reach maximum for production capacity in 2001 representing a large growth over the previous year.

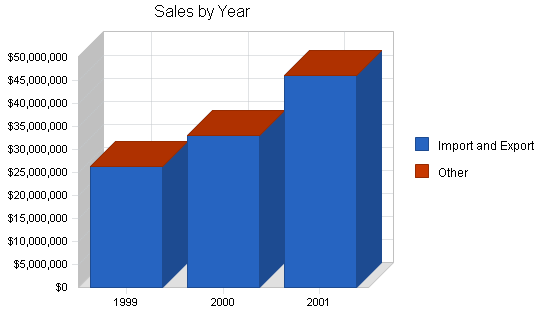
| Sales Forecast | |||
| 1999 | 2000 | 2001 | |
| Unit Sales | |||
| Import and Export | 100,200 | 120,000 | 160,000 |
| Other | 0 | 0 | 0 |
| Total Unit Sales | 100,200 | 120,000 | 160,000 |
| Unit Prices | 1999 | 2000 | 2001 |
| Import and Export | $262.08 | $275.18 | $288.29 |
| Other | $0.00 | $0.00 | $0.00 |
| Sales | |||
| Import and Export | $26,260,416 | $33,021,600 | $46,126,400 |
| Other | $0 | $0 | $0 |
| Total Sales | $26,260,416 | $33,021,600 | $46,126,400 |
| Direct Unit Costs | 1999 | 2000 | 2001 |
| Import and Export | $212.00 | $222.60 | $233.20 |
| Other | $0.00 | $0.00 | $0.00 |
| Direct Cost of Sales | |||
| Import and Export | $21,242,400 | $26,712,000 | $37,312,000 |
| Other | $0 | $0 | $0 |
| Subtotal Direct Cost of Sales | $21,242,400 | $26,712,000 | $37,312,000 |
5.4.2 Sales Programs
Personal selling: Through personal contact we need to confirm in writing orders for larger quantities of our product from American importers and Brazilian wholesalers. In addition we need to establish sales agreements with at least six, possibly ten, additional American importers. Marco Silvera Jr. is responsible and the due date is May 30, with a budget of ($BRL) 24,000.
5.5 Strategic Alliances
Our most valued alliances are those we have developed with American importers. They have the ability and willingness to purchase larger quantities of our products and recommend us to other importers. Additional alliances with trucking contractors and the Porto de Santos Cafe Commission are currently established.
5.6 Milestones
The accompanying table shows specific milestones, with responsibilities assigned, dates, and budgets. The milestones represented in this plan are those which we have determined to be the most important.

| Milestones | |||||
| Milestone | Start Date | End Date | Budget | Manager | Department |
| Secure Financing | 1/1/1999 | 2/1/1999 | $12,000 | M. Silvera Sr. | Finance |
| Establish Import Accounts | 1/1/1999 | 5/1/1999 | $18,000 | M. Silvera Jr. | Sales & Marketing |
| Increase Production | 1/1/1999 | 9/1/1999 | $18,000 | A Silvera | Production & Shipping |
| Hire Intl. Legal & Finance Specialist | 1/1/2000 | 3/1/2000 | $35,000 | TBA | Administration |
| Totals | $83,000 | ||||
Management Summary
Silvera & Sons management consists of four full-time employees. Additional assistance is acquired on a part-time basis and/or through the use of consultants, specifically in legal matters. Detailed descriptions are found in the following section.
6.1 Management Team
Silvera & Sons is organized into three functional areas: product sourcing, sales, and marketing; production and shipping; and finance and administration.
Marco Silvera Sr: CEO/President in charge of finance and administration. Marco Silvera Sr., 57 has worked in the coffee export business for 30 years. Before starting Silvera & Sons he was the Chief Financial Officer and general manager of the Cafe Fino coffee company. He began working for Cafe Fino after he finished an accounting degree at the University of Southern California. The current Silvera & Sons plant was formerly owned by Cafe Fino and was sold to Mr. Silvera who had decided to “retire” and wanted to run a small business. Cafe Fino had purchased larger facilities and no longer needed the plant.
Marco Silvera Jr: Vice president in charge of product sourcing, sales, and marketing. Marco Silvera Jr., 32 completed his MBA at Syracuse University and worked for several years on the Brazilian stock and commodities market as a broker. He later took a position as an International Sales and Marketing Representative for a major agricultural brokerage and supply firm in Sao Paulo. He is expected to succeed his father as CEO of Silvera & Sons Ltda.
Antonio Silvera: Vice president in charge of production and shipping. Antonio Silvera, 29 worked as a civil engineer for two years for the Brazilian government after completing an engineering degree at the University of Brazil, Sao Paulo. He is responsible for the supervision of all plant employees.
Additional Management:
Ralph Henzo, CFO:
Gracie, Renoldo, & Fertado Attorneys at Law, Sao Paulo.
6.2 Management Team Gaps
We currently lack a full-time professional who can deal with the changing legal and financial aspects of international business. We have relied on legal consultants but are now analyzing the possibility of adding an additional position to deal exclusively with international issues. In addition, as we continue to grow and hire more personnel, we may hire a controller.
6.3 Personnel Plan
The personnel plan requires an increase in plant employees from 11 to 17-20 within the next three years. Additional employees will also be added to increase administrative and accounting support. One additional employee will be added to the sales and marketing division. We will retain all current employees as they will not have to relocate.
| Personnel Plan | |||
| 1999 | 2000 | 2001 | |
| Production Personnel | |||
| Antonio Silvera, VP Production | $38,400 | $41,088 | $43,964 |
| Plant Employees | $219,996 | $228,796 | $237,948 |
| Other | $42,000 | $47,000 | $50,000 |
| Subtotal | $300,396 | $316,884 | $331,912 |
| Sales and Marketing Personnel | |||
| Marco Silvera Jr, VP Sales/Mktg. | $45,000 | $48,150 | $51,521 |
| Other | $180,492 | $80,000 | $85,000 |
| Subtotal | $225,492 | $128,150 | $136,521 |
| General and Administrative Personnel | |||
| Marco Slivera Sr, CEO | $50,400 | $53,928 | $57,703 |
| Ralph Henzo, CFO | $42,000 | $44,940 | $44,940 |
| Admin/Acctg. Staff | $9,000 | $9,360 | $44,734 |
| Other | $18,000 | $22,000 | $26,000 |
| Subtotal | $119,400 | $130,228 | $173,377 |
| Other Personnel | |||
| Name or Title or Group | $0 | $0 | $0 |
| Name or Title or Group | $0 | $0 | $0 |
| Name or Title or Group | $0 | $0 | $0 |
| Subtotal | $0 | $0 | $0 |
| Total People | 15 | 16 | 17 |
| Total Payroll | $645,288 | $575,262 | $641,810 |
Financial Plan
We want to finance growth through a combination of long-term debt and cash flow. Purchase of the larger facility and equipment will require approximately eighty percent debt financing. Additional technology will be primarily financed with cash-flow. Inventory turnover must remain at or above four or we run the risk of backing up orders and jeopardizing our freshness guarantees. We have had no problems with accounts receivable and we expect to maintain our collection days at 30 with thirty percent of sales on credit.
In addition, we must achieve gross margins of thirty-five percent and hold operating costs no more than sixty-five percent of sales.
7.1 Break-even Analysis
The break-even analysis shows that Silvera & Sons has sufficient sales strength to remain viable. Our per month break-even point projections are detailed in the following table and chart.

| Break-even Analysis | |
| Monthly Units Break-even | 2,049 |
| Monthly Revenue Break-even | $537,078 |
| Assumptions: | |
| Average Per-Unit Revenue | $262.08 |
| Average Per-Unit Variable Cost | $212.00 |
| Estimated Monthly Fixed Cost | $102,629 |
7.2 Important Assumptions
Important assumptions for this plan are found in the following table. These assumptions largely determine the financial plan and require that we secure additional financing.
| General Assumptions | |||
| 1999 | 2000 | 2001 | |
| Plan Month | 1 | 2 | 3 |
| Current Interest Rate | 14.00% | 14.00% | 14.00% |
| Long-term Interest Rate | 9.00% | 9.00% | 9.00% |
| Tax Rate | 47.00% | 47.00% | 47.00% |
| Other | 0 | 0 | 0 |
7.3 Key Financial Indicators
The most important factor to Silvera & Sons anticipated growth is the procurement of necessary financing. The size of the orders currently requested by importers are larger than what can be produced given our present plant capacity.
The following chart shows changes in key financial indicators: sales, gross margin, operating expenses, collection days, and inventory turnover. The growth in sales goes above thirty percent in the first year, twenty percent in second, and back to thirty percent in year three after which it will settle. We expect to increase gross margin but our projections show a decline in the first two years following the purchase of the new facility. This is due to the facilities not being run at maximum capacity. The projections for collection days and inventory turnover show that we expect a decline in these indicators.

7.4 Projected Profit and Loss
We expect to close the first year of production in the new facility with quite exempary ($BRL) sales and to increase our sales in the second and third years. Net earnings will be above industry average ($BRL).


| Pro Forma Profit and Loss | |||
| 1999 | 2000 | 2001 | |
| Sales | $26,260,416 | $33,021,600 | $46,126,400 |
| Direct Cost of Sales | $21,242,400 | $26,712,000 | $37,312,000 |
| Production Payroll | $300,396 | $316,884 | $331,912 |
| Other Costs of Sales | $300,000 | $345,000 | $410,000 |
| Total Cost of Sales | $21,842,796 | $27,373,884 | $38,053,912 |
| Gross Margin | $4,417,620 | $5,647,716 | $8,072,488 |
| Gross Margin % | 16.82% | 17.10% | 17.50% |
| Operating Expenses | |||
| Sales and Marketing Expenses | |||
| Sales and Marketing Payroll | $225,492 | $128,150 | $136,521 |
| Advertising/Promotion | $144,000 | $165,000 | $165,000 |
| Travel | $21,000 | $22,500 | $24,000 |
| Other Sales and Marketing Expenses | $24,000 | $26,500 | $28,500 |
| Total Sales and Marketing Expenses | $414,492 | $342,150 | $354,021 |
| Sales and Marketing % | 1.58% | 1.04% | 0.77% |
| General and Administrative Expenses | |||
| General and Administrative Payroll | $119,400 | $130,228 | $173,377 |
| Marketing/Promotion | $0 | $0 | $0 |
| Depreciation | $216,000 | $216,000 | $216,000 |
| Leased Equipment | $50,400 | $50,400 | $50,400 |
| Utilities | $36,000 | $36,000 | $36,000 |
| Insurance | $72,000 | $75,000 | $78,000 |
| Rent | $305,250 | $300,000 | $300,000 |
| Payroll Taxes | $0 | $0 | $0 |
| Other General and Administrative Expenses | $0 | $0 | $0 |
| Total General and Administrative Expenses | $799,050 | $807,628 | $853,777 |
| General and Administrative % | 3.04% | 2.45% | 1.85% |
| Other Expenses: | |||
| Other Payroll | $0 | $0 | $0 |
| Consultants | $18,000 | $24,000 | $30,000 |
| Other Expenses | $0 | $0 | $0 |
| Total Other Expenses | $18,000 | $24,000 | $30,000 |
| Other % | 0.07% | 0.07% | 0.07% |
| Total Operating Expenses | $1,231,542 | $1,173,778 | $1,237,798 |
| Profit Before Interest and Taxes | $3,186,078 | $4,473,938 | $6,834,690 |
| EBITDA | $3,402,078 | $4,689,938 | $7,050,690 |
| Interest Expense | $269,166 | $238,449 | $225,191 |
| Taxes Incurred | $1,370,949 | $1,990,680 | $3,106,465 |
| Net Profit | $1,545,964 | $2,244,809 | $3,503,035 |
| Net Profit/Sales | 5.89% | 6.80% | 7.59% |
7.5 Projected Cash Flow
Silvera & Sons expects to manage cash flow over the next three years with the assistance of a loan supported by the Central Bank of Brazil. This financing assistance is required to provide the working capital to meet the current needs for the construction of the new production facility and additional personnel, distribution costs, and other related expenses.

| Pro Forma Cash Flow | |||
| 1999 | 2000 | 2001 | |
| Cash Received | |||
| Cash from Operations | |||
| Cash Sales | $26,260,416 | $33,021,600 | $46,126,400 |
| Subtotal Cash from Operations | $26,260,416 | $33,021,600 | $46,126,400 |
| Additional Cash Received | |||
| Sales Tax, VAT, HST/GST Received | $0 | $0 | $0 |
| New Current Borrowing | $0 | $0 | $0 |
| New Other Liabilities (interest-free) | $0 | $0 | $0 |
| New Long-term Liabilities | $2,700,000 | $0 | $0 |
| Sales of Other Current Assets | $0 | $0 | $0 |
| Sales of Long-term Assets | $0 | $0 | $0 |
| New Investment Received | $0 | $650,000 | $650,000 |
| Subtotal Cash Received | $28,960,416 | $33,671,600 | $46,776,400 |
| Expenditures | 1999 | 2000 | 2001 |
| Expenditures from Operations | |||
| Cash Spending | $645,288 | $575,262 | $641,810 |
| Bill Payments | $23,678,478 | $29,770,693 | $41,735,934 |
| Subtotal Spent on Operations | $24,323,766 | $30,345,955 | $42,377,744 |
| Additional Cash Spent | |||
| Sales Tax, VAT, HST/GST Paid Out | $0 | $0 | $0 |
| Principal Repayment of Current Borrowing | $57,996 | $0 | $0 |
| Other Liabilities Principal Repayment | $0 | $0 | $0 |
| Long-term Liabilities Principal Repayment | $305,250 | $294,636 | $0 |
| Purchase Other Current Assets | $60,000 | $75,000 | $85,000 |
| Purchase Long-term Assets | $2,700,000 | $0 | $0 |
| Dividends | $0 | $0 | $0 |
| Subtotal Cash Spent | $27,447,012 | $30,715,591 | $42,462,744 |
| Net Cash Flow | $1,513,404 | $2,956,009 | $4,313,656 |
| Cash Balance | $2,507,664 | $5,463,673 | $9,777,329 |
7.6 Projected Balance Sheet
As shown in the balance sheet in the following table, our net will grow quickly by the end of 1999 and to continue steadily through the end of the plan period. The monthly projections are in the appendix.
| Pro Forma Balance Sheet | |||
| 1999 | 2000 | 2001 | |
| Assets | |||
| Current Assets | |||
| Cash | $2,507,664 | $5,463,673 | $9,777,329 |
| Inventory | $1,958,880 | $2,463,262 | $3,440,747 |
| Other Current Assets | $303,936 | $378,936 | $463,936 |
| Total Current Assets | $4,770,480 | $8,305,872 | $13,682,013 |
| Long-term Assets | |||
| Long-term Assets | $3,221,650 | $3,221,650 | $3,221,650 |
| Accumulated Depreciation | $316,000 | $532,000 | $748,000 |
| Total Long-term Assets | $2,905,650 | $2,689,650 | $2,473,650 |
| Total Assets | $7,676,130 | $10,995,522 | $16,155,663 |
| Liabilities and Capital | 1999 | 2000 | 2001 |
| Current Liabilities | |||
| Accounts Payable | $1,786,801 | $2,506,020 | $3,513,127 |
| Current Borrowing | $4 | $4 | $4 |
| Other Current Liabilities | $0 | $0 | $0 |
| Subtotal Current Liabilities | $1,786,805 | $2,506,024 | $3,513,131 |
| Long-term Liabilities | $2,796,750 | $2,502,114 | $2,502,114 |
| Total Liabilities | $4,583,555 | $5,008,138 | $6,015,245 |
| Paid-in Capital | $525,000 | $1,175,000 | $1,825,000 |
| Retained Earnings | $1,021,611 | $2,567,575 | $4,812,383 |
| Earnings | $1,545,964 | $2,244,809 | $3,503,035 |
| Total Capital | $3,092,575 | $5,987,383 | $10,140,418 |
| Total Liabilities and Capital | $7,676,130 | $10,995,522 | $16,155,663 |
| Net Worth | $3,092,575 | $5,987,383 | $10,140,418 |
7.7 Business Ratios
Standard business ratios are included in the following table. The ratios show an aggressive plan for growth in order to reach maximum production within three years. Return on investment increases each year as we bring the new facility to maximum capacity and production. Return on sales and assets remain strong and cost of goods decreases based upon efficiency projections. Projections are based on the 1997/98 selling price. Industry Profile is based on NAICS code 311920, Coffee and Tea Manufacturing.
| Ratio Analysis | ||||
| 1999 | 2000 | 2001 | Industry Profile | |
| Sales Growth | 43.14% | 25.75% | 39.69% | 5.50% |
| Percent of Total Assets | ||||
| Inventory | 25.52% | 22.40% | 21.30% | 12.43% |
| Other Current Assets | 3.96% | 3.45% | 2.87% | 27.50% |
| Total Current Assets | 62.15% | 75.54% | 84.69% | 60.13% |
| Long-term Assets | 37.85% | 24.46% | 15.31% | 39.87% |
| Total Assets | 100.00% | 100.00% | 100.00% | 100.00% |
| Current Liabilities | 23.28% | 22.79% | 21.75% | 8.46% |
| Long-term Liabilities | 36.43% | 22.76% | 15.49% | 16.54% |
| Total Liabilities | 59.71% | 45.55% | 37.23% | 25.00% |
| Net Worth | 40.29% | 54.45% | 62.77% | 75.00% |
| Percent of Sales | ||||
| Sales | 100.00% | 100.00% | 100.00% | 100.00% |
| Gross Margin | 16.82% | 17.10% | 17.50% | 23.32% |
| Selling, General & Administrative Expenses | 10.94% | 10.31% | 9.91% | 9.39% |
| Advertising Expenses | 0.55% | 0.50% | 0.36% | 2.06% |
| Profit Before Interest and Taxes | 12.13% | 13.55% | 14.82% | 4.36% |
| Main Ratios | ||||
| Current | 2.67 | 3.31 | 3.89 | 5.32 |
| Quick | 1.57 | 2.33 | 2.92 | 3.45 |
| Total Debt to Total Assets | 59.71% | 45.55% | 37.23% | 27.13% |
| Pre-tax Return on Net Worth | 94.32% | 70.74% | 65.18% | 12.79% |
| Pre-tax Return on Assets | 38.00% | 38.52% | 40.91% | 17.55% |
| Additional Ratios | 1999 | 2000 | 2001 | |
| Net Profit Margin | 5.89% | 6.80% | 7.59% | n.a |
| Return on Equity | 49.99% | 37.49% | 34.55% | n.a |
| Activity Ratios | ||||
| Inventory Turnover | 10.91 | 12.08 | 12.64 | n.a |
| Accounts Payable Turnover | 14.25 | 12.17 | 12.17 | n.a |
| Payment Days | 27 | 26 | 26 | n.a |
| Total Asset Turnover | 3.42 | 3.00 | 2.86 | n.a |
| Debt Ratios | ||||
| Debt to Net Worth | 1.48 | 0.84 | 0.59 | n.a |
| Current Liab. to Liab. | 0.39 | 0.50 | 0.58 | n.a |
| Liquidity Ratios | ||||
| Net Working Capital | $2,983,675 | $5,799,847 | $10,168,882 | n.a |
| Interest Coverage | 11.84 | 18.76 | 30.35 | n.a |
| Additional Ratios | ||||
| Assets to Sales | 0.29 | 0.33 | 0.35 | n.a |
| Current Debt/Total Assets | 23% | 23% | 22% | n.a |
| Acid Test | 1.57 | 2.33 | 2.92 | n.a |
| Sales/Net Worth | 8.49 | 5.52 | 4.55 | n.a |
| Dividend Payout | 0.00 | 0.00 | 0.00 | n.a |
Appendix
| Sales Forecast | |||||||||||||
| Jan | Feb | Mar | Apr | May | Jun | Jul | Aug | Sep | Oct | Nov | Dec | ||
| Unit Sales | |||||||||||||
| Import and Export | 0% | 8,700 | 8,200 | 8,800 | 8,300 | 8,450 | 8,050 | 8,000 | 8,200 | 8,050 | 8,000 | 9,050 | 8,400 |
| Other | 0% | 0 | 0 | 0 | 0 | 0 | 0 | 0 | 0 | 0 | 0 | 0 | 0 |
| Total Unit Sales | 8,700 | 8,200 | 8,800 | 8,300 | 8,450 | 8,050 | 8,000 | 8,200 | 8,050 | 8,000 | 9,050 | 8,400 | |
| Unit Prices | Jan | Feb | Mar | Apr | May | Jun | Jul | Aug | Sep | Oct | Nov | Dec | |
| Import and Export | $262.08 | $262.08 | $262.08 | $262.08 | $262.08 | $262.08 | $262.08 | $262.08 | $262.08 | $262.08 | $262.08 | $262.08 | |
| Other | $0.00 | $0.00 | $0.00 | $0.00 | $0.00 | $0.00 | $0.00 | $0.00 | $0.00 | $0.00 | $0.00 | $0.00 | |
| Sales | |||||||||||||
| Import and Export | $2,280,096 | $2,149,056 | $2,306,304 | $2,175,264 | $2,214,576 | $2,109,744 | $2,096,640 | $2,149,056 | $2,109,744 | $2,096,640 | $2,371,824 | $2,201,472 | |
| Other | $0 | $0 | $0 | $0 | $0 | $0 | $0 | $0 | $0 | $0 | $0 | $0 | |
| Total Sales | $2,280,096 | $2,149,056 | $2,306,304 | $2,175,264 | $2,214,576 | $2,109,744 | $2,096,640 | $2,149,056 | $2,109,744 | $2,096,640 | $2,371,824 | $2,201,472 | |
| Direct Unit Costs | Jan | Feb | Mar | Apr | May | Jun | Jul | Aug | Sep | Oct | Nov | Dec | |
| Import and Export | 0.00% | $212.00 | $212.00 | $212.00 | $212.00 | $212.00 | $212.00 | $212.00 | $212.00 | $212.00 | $212.00 | $212.00 | $212.00 |
| Other | 0.00% | $0.00 | $0.00 | $0.00 | $0.00 | $0.00 | $0.00 | $0.00 | $0.00 | $0.00 | $0.00 | $0.00 | $0.00 |
| Direct Cost of Sales | |||||||||||||
| Import and Export | $1,844,400 | $1,738,400 | $1,865,600 | $1,759,600 | $1,791,400 | $1,706,600 | $1,696,000 | $1,738,400 | $1,706,600 | $1,696,000 | $1,918,600 | $1,780,800 | |
| Other | $0 | $0 | $0 | $0 | $0 | $0 | $0 | $0 | $0 | $0 | $0 | $0 | |
| Subtotal Direct Cost of Sales | $1,844,400 | $1,738,400 | $1,865,600 | $1,759,600 | $1,791,400 | $1,706,600 | $1,696,000 | $1,738,400 | $1,706,600 | $1,696,000 | $1,918,600 | $1,780,800 | |
| Personnel Plan | |||||||||||||
| Jan | Feb | Mar | Apr | May | Jun | Jul | Aug | Sep | Oct | Nov | Dec | ||
| Production Personnel | |||||||||||||
| Antonio Silvera, VP Production | $3,200 | $3,200 | $3,200 | $3,200 | $3,200 | $3,200 | $3,200 | $3,200 | $3,200 | $3,200 | $3,200 | $3,200 | |
| Plant Employees | $18,333 | $18,333 | $18,333 | $18,333 | $18,333 | $18,333 | $18,333 | $18,333 | $18,333 | $18,333 | $18,333 | $18,333 | |
| Other | $3,500 | $3,500 | $3,500 | $3,500 | $3,500 | $3,500 | $3,500 | $3,500 | $3,500 | $3,500 | $3,500 | $3,500 | |
| Subtotal | $25,033 | $25,033 | $25,033 | $25,033 | $25,033 | $25,033 | $25,033 | $25,033 | $25,033 | $25,033 | $25,033 | $25,033 | |
| Sales and Marketing Personnel | |||||||||||||
| Marco Silvera Jr, VP Sales/Mktg. | $3,750 | $3,750 | $3,750 | $3,750 | $3,750 | $3,750 | $3,750 | $3,750 | $3,750 | $3,750 | $3,750 | $3,750 | |
| Other | $15,041 | $15,041 | $15,041 | $15,041 | $15,041 | $15,041 | $15,041 | $15,041 | $15,041 | $15,041 | $15,041 | $15,041 | |
| Subtotal | $18,791 | $18,791 | $18,791 | $18,791 | $18,791 | $18,791 | $18,791 | $18,791 | $18,791 | $18,791 | $18,791 | $18,791 | |
| General and Administrative Personnel | |||||||||||||
| Marco Slivera Sr, CEO | $4,200 | $4,200 | $4,200 | $4,200 | $4,200 | $4,200 | $4,200 | $4,200 | $4,200 | $4,200 | $4,200 | $4,200 | |
| Ralph Henzo, CFO | $3,500 | $3,500 | $3,500 | $3,500 | $3,500 | $3,500 | $3,500 | $3,500 | $3,500 | $3,500 | $3,500 | $3,500 | |
| Admin/Acctg. Staff | $750 | $750 | $750 | $750 | $750 | $750 | $750 | $750 | $750 | $750 | $750 | $750 | |
| Other | $1,500 | $1,500 | $1,500 | $1,500 | $1,500 | $1,500 | $1,500 | $1,500 | $1,500 | $1,500 | $1,500 | $1,500 | |
| Subtotal | $9,950 | $9,950 | $9,950 | $9,950 | $9,950 | $9,950 | $9,950 | $9,950 | $9,950 | $9,950 | $9,950 | $9,950 | |
| Other Personnel | |||||||||||||
| Name or Title or Group | $0 | $0 | $0 | $0 | $0 | $0 | $0 | $0 | $0 | $0 | $0 | $0 | |
| Name or Title or Group | $0 | $0 | $0 | $0 | $0 | $0 | $0 | $0 | $0 | $0 | $0 | $0 | |
| Name or Title or Group | $0 | $0 | $0 | $0 | $0 | $0 | $0 | $0 | $0 | $0 | $0 | $0 | |
| Subtotal | $0 | $0 | $0 | $0 | $0 | $0 | $0 | $0 | $0 | $0 | $0 | $0 | |
| Total People | 15 | 15 | 15 | 15 | 15 | 15 | 15 | 15 | 15 | 15 | 15 | 15 | |
| Total Payroll | $53,774 | $53,774 | $53,774 | $53,774 | $53,774 | $53,774 | $53,774 | $53,774 | $53,774 | $53,774 | $53,774 | $53,774 | |
| Pro Forma Profit and Loss | |||||||||||||
| Jan | Feb | Mar | Apr | May | Jun | Jul | Aug | Sep | Oct | Nov | Dec | ||
| Sales | $2,280,096 | $2,149,056 | $2,306,304 | $2,175,264 | $2,214,576 | $2,109,744 | $2,096,640 | $2,149,056 | $2,109,744 | $2,096,640 | $2,371,824 | $2,201,472 | |
| Direct Cost of Sales | $1,844,400 | $1,738,400 | $1,865,600 | $1,759,600 | $1,791,400 | $1,706,600 | $1,696,000 | $1,738,400 | $1,706,600 | $1,696,000 | $1,918,600 | $1,780,800 | |
| Production Payroll | $25,033 | $25,033 | $25,033 | $25,033 | $25,033 | $25,033 | $25,033 | $25,033 | $25,033 | $25,033 | $25,033 | $25,033 | |
| Other Costs of Sales | $25,000 | $25,000 | $25,000 | $25,000 | $25,000 | $25,000 | $25,000 | $25,000 | $25,000 | $25,000 | $25,000 | $25,000 | |
| Total Cost of Sales | $1,894,433 | $1,788,433 | $1,915,633 | $1,809,633 | $1,841,433 | $1,756,633 | $1,746,033 | $1,788,433 | $1,756,633 | $1,746,033 | $1,968,633 | $1,830,833 | |
| Gross Margin | $385,663 | $360,623 | $390,671 | $365,631 | $373,143 | $353,111 | $350,607 | $360,623 | $353,111 | $350,607 | $403,191 | $370,639 | |
| Gross Margin % | 16.91% | 16.78% | 16.94% | 16.81% | 16.85% | 16.74% | 16.72% | 16.78% | 16.74% | 16.72% | 17.00% | 16.84% | |
| Operating Expenses | |||||||||||||
| Sales and Marketing Expenses | |||||||||||||
| Sales and Marketing Payroll | $18,791 | $18,791 | $18,791 | $18,791 | $18,791 | $18,791 | $18,791 | $18,791 | $18,791 | $18,791 | $18,791 | $18,791 | |
| Advertising/Promotion | $12,000 | $12,000 | $12,000 | $12,000 | $12,000 | $12,000 | $12,000 | $12,000 | $12,000 | $12,000 | $12,000 | $12,000 | |
| Travel | $1,750 | $1,750 | $1,750 | $1,750 | $1,750 | $1,750 | $1,750 | $1,750 | $1,750 | $1,750 | $1,750 | $1,750 | |
| Other Sales and Marketing Expenses | $2,000 | $2,000 | $2,000 | $2,000 | $2,000 | $2,000 | $2,000 | $2,000 | $2,000 | $2,000 | $2,000 | $2,000 | |
| Total Sales and Marketing Expenses | $34,541 | $34,541 | $34,541 | $34,541 | $34,541 | $34,541 | $34,541 | $34,541 | $34,541 | $34,541 | $34,541 | $34,541 | |
| Sales and Marketing % | 1.51% | 1.61% | 1.50% | 1.59% | 1.56% | 1.64% | 1.65% | 1.61% | 1.64% | 1.65% | 1.46% | 1.57% | |
| General and Administrative Expenses | |||||||||||||
| General and Administrative Payroll | $9,950 | $9,950 | $9,950 | $9,950 | $9,950 | $9,950 | $9,950 | $9,950 | $9,950 | $9,950 | $9,950 | $9,950 | |
| Marketing/Promotion | $0 | $0 | $0 | $0 | $0 | $0 | $0 | $0 | $0 | $0 | $0 | $0 | |
| Depreciation | $18,000 | $18,000 | $18,000 | $18,000 | $18,000 | $18,000 | $18,000 | $18,000 | $18,000 | $18,000 | $18,000 | $18,000 | |
| Leased Equipment | $4,200 | $4,200 | $4,200 | $4,200 | $4,200 | $4,200 | $4,200 | $4,200 | $4,200 | $4,200 | $4,200 | $4,200 | |
| Utilities | $3,000 | $3,000 | $3,000 | $3,000 | $3,000 | $3,000 | $3,000 | $3,000 | $3,000 | $3,000 | $3,000 | $3,000 | |
| Insurance | $6,000 | $6,000 | $6,000 | $6,000 | $6,000 | $6,000 | $6,000 | $6,000 | $6,000 | $6,000 | $6,000 | $6,000 | |
| Rent | $0 | $27,750 | $27,750 | $27,750 | $27,750 | $27,750 | $27,750 | $27,750 | $27,750 | $27,750 | $27,750 | $27,750 | |
| Payroll Taxes | 9% | $0 | $0 | $0 | $0 | $0 | $0 | $0 | $0 | $0 | $0 | $0 | $0 |
| Other General and Administrative Expenses | $0 | $0 | $0 | $0 | $0 | $0 | $0 | $0 | $0 | $0 | $0 | $0 | |
| Total General and Administrative Expenses | $41,150 | $68,900 | $68,900 | $68,900 | $68,900 | $68,900 | $68,900 | $68,900 | $68,900 | $68,900 | $68,900 | $68,900 | |
| General and Administrative % | 1.80% | 3.21% | 2.99% | 3.17% | 3.11% | 3.27% | 3.29% | 3.21% | 3.27% | 3.29% | 2.90% | 3.13% | |
| Other Expenses: | |||||||||||||
| Other Payroll | $0 | $0 | $0 | $0 | $0 | $0 | $0 | $0 | $0 | $0 | $0 | $0 | |
| Consultants | $1,500 | $1,500 | $1,500 | $1,500 | $1,500 | $1,500 | $1,500 | $1,500 | $1,500 | $1,500 | $1,500 | $1,500 | |
| Other Expenses | $0 | $0 | $0 | $0 | $0 | $0 | $0 | $0 | $0 | $0 | $0 | $0 | |
| Total Other Expenses | $1,500 | $1,500 | $1,500 | $1,500 | $1,500 | $1,500 | $1,500 | $1,500 | $1,500 | $1,500 | $1,500 | $1,500 | |
| Other % | 0.07% | 0.07% | 0.07% | 0.07% | 0.07% | 0.07% | 0.07% | 0.07% | 0.07% | 0.07% | 0.06% | 0.07% | |
| Total Operating Expenses | $77,191 | $104,941 | $104,941 | $104,941 | $104,941 | $104,941 | $104,941 | $104,941 | $104,941 | $104,941 | $104,941 | $104,941 | |
| Profit Before Interest and Taxes | $308,472 | $255,682 | $285,730 | $260,690 | $268,202 | $248,170 | $245,666 | $255,682 | $248,170 | $245,666 | $298,250 | $265,698 | |
| EBITDA | $326,472 | $273,682 | $303,730 | $278,690 | $286,202 | $266,170 | $263,666 | $273,682 | $266,170 | $263,666 | $316,250 | $283,698 | |
| Interest Expense | $23,885 | $23,621 | $23,356 | $23,092 | $22,827 | $22,563 | $22,298 | $22,034 | $21,769 | $21,505 | $21,240 | $20,976 | |
| Taxes Incurred | $133,756 | $109,069 | $123,316 | $111,671 | $115,326 | $106,035 | $104,983 | $109,815 | $106,408 | $105,356 | $130,195 | $115,019 | |
| Net Profit | $150,831 | $122,992 | $139,058 | $125,927 | $130,049 | $119,572 | $118,385 | $123,834 | $119,992 | $118,805 | $146,815 | $129,703 | |
| Net Profit/Sales | 6.62% | 5.72% | 6.03% | 5.79% | 5.87% | 5.67% | 5.65% | 5.76% | 5.69% | 5.67% | 6.19% | 5.89% | |
| Pro Forma Cash Flow | |||||||||||||
| Jan | Feb | Mar | Apr | May | Jun | Jul | Aug | Sep | Oct | Nov | Dec | ||
| Cash Received | |||||||||||||
| Cash from Operations | |||||||||||||
| Cash Sales | $2,280,096 | $2,149,056 | $2,306,304 | $2,175,264 | $2,214,576 | $2,109,744 | $2,096,640 | $2,149,056 | $2,109,744 | $2,096,640 | $2,371,824 | $2,201,472 | |
| Subtotal Cash from Operations | $2,280,096 | $2,149,056 | $2,306,304 | $2,175,264 | $2,214,576 | $2,109,744 | $2,096,640 | $2,149,056 | $2,109,744 | $2,096,640 | $2,371,824 | $2,201,472 | |
| Additional Cash Received | |||||||||||||
| Sales Tax, VAT, HST/GST Received | 0.00% | $0 | $0 | $0 | $0 | $0 | $0 | $0 | $0 | $0 | $0 | $0 | $0 |
| New Current Borrowing | $0 | $0 | $0 | $0 | $0 | $0 | $0 | $0 | $0 | $0 | $0 | $0 | |
| New Other Liabilities (interest-free) | $0 | $0 | $0 | $0 | $0 | $0 | $0 | $0 | $0 | $0 | $0 | $0 | |
| New Long-term Liabilities | $2,700,000 | $0 | $0 | $0 | $0 | $0 | $0 | $0 | $0 | $0 | $0 | $0 | |
| Sales of Other Current Assets | $0 | $0 | $0 | $0 | $0 | $0 | $0 | $0 | $0 | $0 | $0 | $0 | |
| Sales of Long-term Assets | $0 | $0 | $0 | $0 | $0 | $0 | $0 | $0 | $0 | $0 | $0 | $0 | |
| New Investment Received | $0 | $0 | $0 | $0 | $0 | $0 | $0 | $0 | $0 | $0 | $0 | $0 | |
| Subtotal Cash Received | $4,980,096 | $2,149,056 | $2,306,304 | $2,175,264 | $2,214,576 | $2,109,744 | $2,096,640 | $2,149,056 | $2,109,744 | $2,096,640 | $2,371,824 | $2,201,472 | |
| Expenditures | Jan | Feb | Mar | Apr | May | Jun | Jul | Aug | Sep | Oct | Nov | Dec | |
| Expenditures from Operations | |||||||||||||
| Cash Spending | $53,774 | $53,774 | $53,774 | $53,774 | $53,774 | $53,774 | $53,774 | $53,774 | $53,774 | $53,774 | $53,774 | $53,774 | |
| Bill Payments | $132,806 | $3,668,016 | $1,850,946 | $2,222,911 | $1,867,189 | $2,040,313 | $1,827,442 | $1,898,330 | $1,996,185 | $1,883,378 | $1,911,190 | $2,379,772 | |
| Subtotal Spent on Operations | $186,580 | $3,721,790 | $1,904,720 | $2,276,685 | $1,920,963 | $2,094,087 | $1,881,216 | $1,952,104 | $2,049,959 | $1,937,152 | $1,964,964 | $2,433,546 | |
| Additional Cash Spent | |||||||||||||
| Sales Tax, VAT, HST/GST Paid Out | $0 | $0 | $0 | $0 | $0 | $0 | $0 | $0 | $0 | $0 | $0 | $0 | |
| Principal Repayment of Current Borrowing | $4,833 | $4,833 | $4,833 | $4,833 | $4,833 | $4,833 | $4,833 | $4,833 | $4,833 | $4,833 | $4,833 | $4,833 | |
| Other Liabilities Principal Repayment | $0 | $0 | $0 | $0 | $0 | $0 | $0 | $0 | $0 | $0 | $0 | $0 | |
| Long-term Liabilities Principal Repayment | $0 | $27,750 | $27,750 | $27,750 | $27,750 | $27,750 | $27,750 | $27,750 | $27,750 | $27,750 | $27,750 | $27,750 | |
| Purchase Other Current Assets | $5,000 | $5,000 | $5,000 | $5,000 | $5,000 | $5,000 | $5,000 | $5,000 | $5,000 | $5,000 | $5,000 | $5,000 | |
| Purchase Long-term Assets | $225,000 | $225,000 | $225,000 | $225,000 | $225,000 | $225,000 | $225,000 | $225,000 | $225,000 | $225,000 | $225,000 | $225,000 | |
| Dividends | $0 | $0 | $0 | $0 | $0 | $0 | $0 | $0 | $0 | $0 | $0 | $0 | |
| Subtotal Cash Spent | $421,413 | $3,984,373 | $2,167,303 | $2,539,268 | $2,183,546 | $2,356,670 | $2,143,799 | $2,214,687 | $2,312,542 | $2,199,735 | $2,227,547 | $2,696,129 | |
| Net Cash Flow | $4,558,683 | ($1,835,317) | $139,001 | ($364,004) | $31,030 | ($246,926) | ($47,159) | ($65,631) | ($202,798) | ($103,095) | $144,277 | ($494,657) | |
| Cash Balance | $5,552,943 | $3,717,626 | $3,856,626 | $3,492,622 | $3,523,653 | $3,276,727 | $3,229,568 | $3,163,937 | $2,961,139 | $2,858,044 | $3,002,321 | $2,507,664 | |
| Pro Forma Balance Sheet | |||||||||||||
| Jan | Feb | Mar | Apr | May | Jun | Jul | Aug | Sep | Oct | Nov | Dec | ||
| Assets | Starting Balances | ||||||||||||
| Current Assets | |||||||||||||
| Cash | $994,260 | $5,552,943 | $3,717,626 | $3,856,626 | $3,492,622 | $3,523,653 | $3,276,727 | $3,229,568 | $3,163,937 | $2,961,139 | $2,858,044 | $3,002,321 | $2,507,664 |
| Inventory | $355,200 | $2,028,840 | $1,912,240 | $2,052,160 | $1,935,560 | $1,970,540 | $1,877,260 | $1,865,600 | $1,912,240 | $1,877,260 | $1,865,600 | $2,110,460 | $1,958,880 |
| Other Current Assets | $243,936 | $248,936 | $253,936 | $258,936 | $263,936 | $268,936 | $273,936 | $278,936 | $283,936 | $288,936 | $293,936 | $298,936 | $303,936 |
| Total Current Assets | $1,593,396 | $7,830,719 | $5,883,802 | $6,167,722 | $5,692,118 | $5,763,129 | $5,427,923 | $5,374,104 | $5,360,113 | $5,127,335 | $5,017,580 | $5,411,717 | $4,770,480 |
| Long-term Assets | |||||||||||||
| Long-term Assets | $521,650 | $746,650 | $971,650 | $1,196,650 | $1,421,650 | $1,646,650 | $1,871,650 | $2,096,650 | $2,321,650 | $2,546,650 | $2,771,650 | $2,996,650 | $3,221,650 |
| Accumulated Depreciation | $100,000 | $118,000 | $136,000 | $154,000 | $172,000 | $190,000 | $208,000 | $226,000 | $244,000 | $262,000 | $280,000 | $298,000 | $316,000 |
| Total Long-term Assets | $421,650 | $628,650 | $835,650 | $1,042,650 | $1,249,650 | $1,456,650 | $1,663,650 | $1,870,650 | $2,077,650 | $2,284,650 | $2,491,650 | $2,698,650 | $2,905,650 |
| Total Assets | $2,015,046 | $8,459,369 | $6,719,452 | $7,210,372 | $6,941,768 | $7,219,779 | $7,091,573 | $7,244,754 | $7,437,763 | $7,411,985 | $7,509,230 | $8,110,367 | $7,676,130 |
| Liabilities and Capital | Jan | Feb | Mar | Apr | May | Jun | Jul | Aug | Sep | Oct | Nov | Dec | |
| Current Liabilities | |||||||||||||
| Accounts Payable | $8,435 | $3,606,760 | $1,776,433 | $2,160,879 | $1,798,931 | $1,979,476 | $1,764,281 | $1,831,660 | $1,933,419 | $1,820,231 | $1,831,254 | $2,318,158 | $1,786,801 |
| Current Borrowing | $58,000 | $53,167 | $48,334 | $43,501 | $38,668 | $33,835 | $29,002 | $24,169 | $19,336 | $14,503 | $9,670 | $4,837 | $4 |
| Other Current Liabilities | $0 | $0 | $0 | $0 | $0 | $0 | $0 | $0 | $0 | $0 | $0 | $0 | $0 |
| Subtotal Current Liabilities | $66,435 | $3,659,927 | $1,824,767 | $2,204,380 | $1,837,599 | $2,013,311 | $1,793,283 | $1,855,829 | $1,952,755 | $1,834,734 | $1,840,924 | $2,322,995 | $1,786,805 |
| Long-term Liabilities | $402,000 | $3,102,000 | $3,074,250 | $3,046,500 | $3,018,750 | $2,991,000 | $2,963,250 | $2,935,500 | $2,907,750 | $2,880,000 | $2,852,250 | $2,824,500 | $2,796,750 |
| Total Liabilities | $468,435 | $6,761,927 | $4,899,017 | $5,250,880 | $4,856,349 | $5,004,311 | $4,756,533 | $4,791,329 | $4,860,505 | $4,714,734 | $4,693,174 | $5,147,495 | $4,583,555 |
| Paid-in Capital | $525,000 | $525,000 | $525,000 | $525,000 | $525,000 | $525,000 | $525,000 | $525,000 | $525,000 | $525,000 | $525,000 | $525,000 | $525,000 |
| Retained Earnings | $85,985 | $1,021,611 | $1,021,611 | $1,021,611 | $1,021,611 | $1,021,611 | $1,021,611 | $1,021,611 | $1,021,611 | $1,021,611 | $1,021,611 | $1,021,611 | $1,021,611 |
| Earnings | $935,626 | $150,831 | $273,823 | $412,881 | $538,809 | $668,857 | $788,429 | $906,814 | $1,030,648 | $1,150,640 | $1,269,445 | $1,416,261 | $1,545,964 |
| Total Capital | $1,546,611 | $1,697,442 | $1,820,434 | $1,959,492 | $2,085,420 | $2,215,468 | $2,335,040 | $2,453,425 | $2,577,259 | $2,697,251 | $2,816,056 | $2,962,872 | $3,092,575 |
| Total Liabilities and Capital | $2,015,046 | $8,459,369 | $6,719,452 | $7,210,372 | $6,941,768 | $7,219,779 | $7,091,573 | $7,244,754 | $7,437,763 | $7,411,985 | $7,509,230 | $8,110,367 | $7,676,130 |
| Net Worth | $1,546,611 | $1,697,442 | $1,820,434 | $1,959,492 | $2,085,420 | $2,215,468 | $2,335,040 | $2,453,425 | $2,577,259 | $2,697,251 | $2,816,056 | $2,962,872 | $3,092,575 |
| General Assumptions | |||||||||||||
| Jan | Feb | Mar | Apr | May | Jun | Jul | Aug | Sep | Oct | Nov | Dec | ||
| Plan Month | 1 | 2 | 3 | 4 | 5 | 6 | 7 | 8 | 9 | 10 | 11 | 12 | |
| Current Interest Rate | 14.00% | 14.00% | 14.00% | 14.00% | 14.00% | 14.00% | 14.00% | 14.00% | 14.00% | 14.00% | 14.00% | 14.00% | |
| Long-term Interest Rate | 9.00% | 9.00% | 9.00% | 9.00% | 9.00% | 9.00% | 9.00% | 9.00% | 9.00% | 9.00% | 9.00% | 9.00% | |
| Tax Rate | 47.00% | 47.00% | 47.00% | 47.00% | 47.00% | 47.00% | 47.00% | 47.00% | 47.00% | 47.00% | 47.00% | 47.00% | |
| Other | 0 | 0 | 0 | 0 | 0 | 0 | 0 | 0 | 0 | 0 | 0 | 0 | |

